Land Use and Landscape Pattern Changes in the Sanjiang Plain, Northeast China

Abstract
1. Introduction
2. Materials and Methods
2.1. Study Area
2.2. Land Use and Data Sources
2.3. Land Use Changes
2.4. Landscape Pattern Changes
3. Results
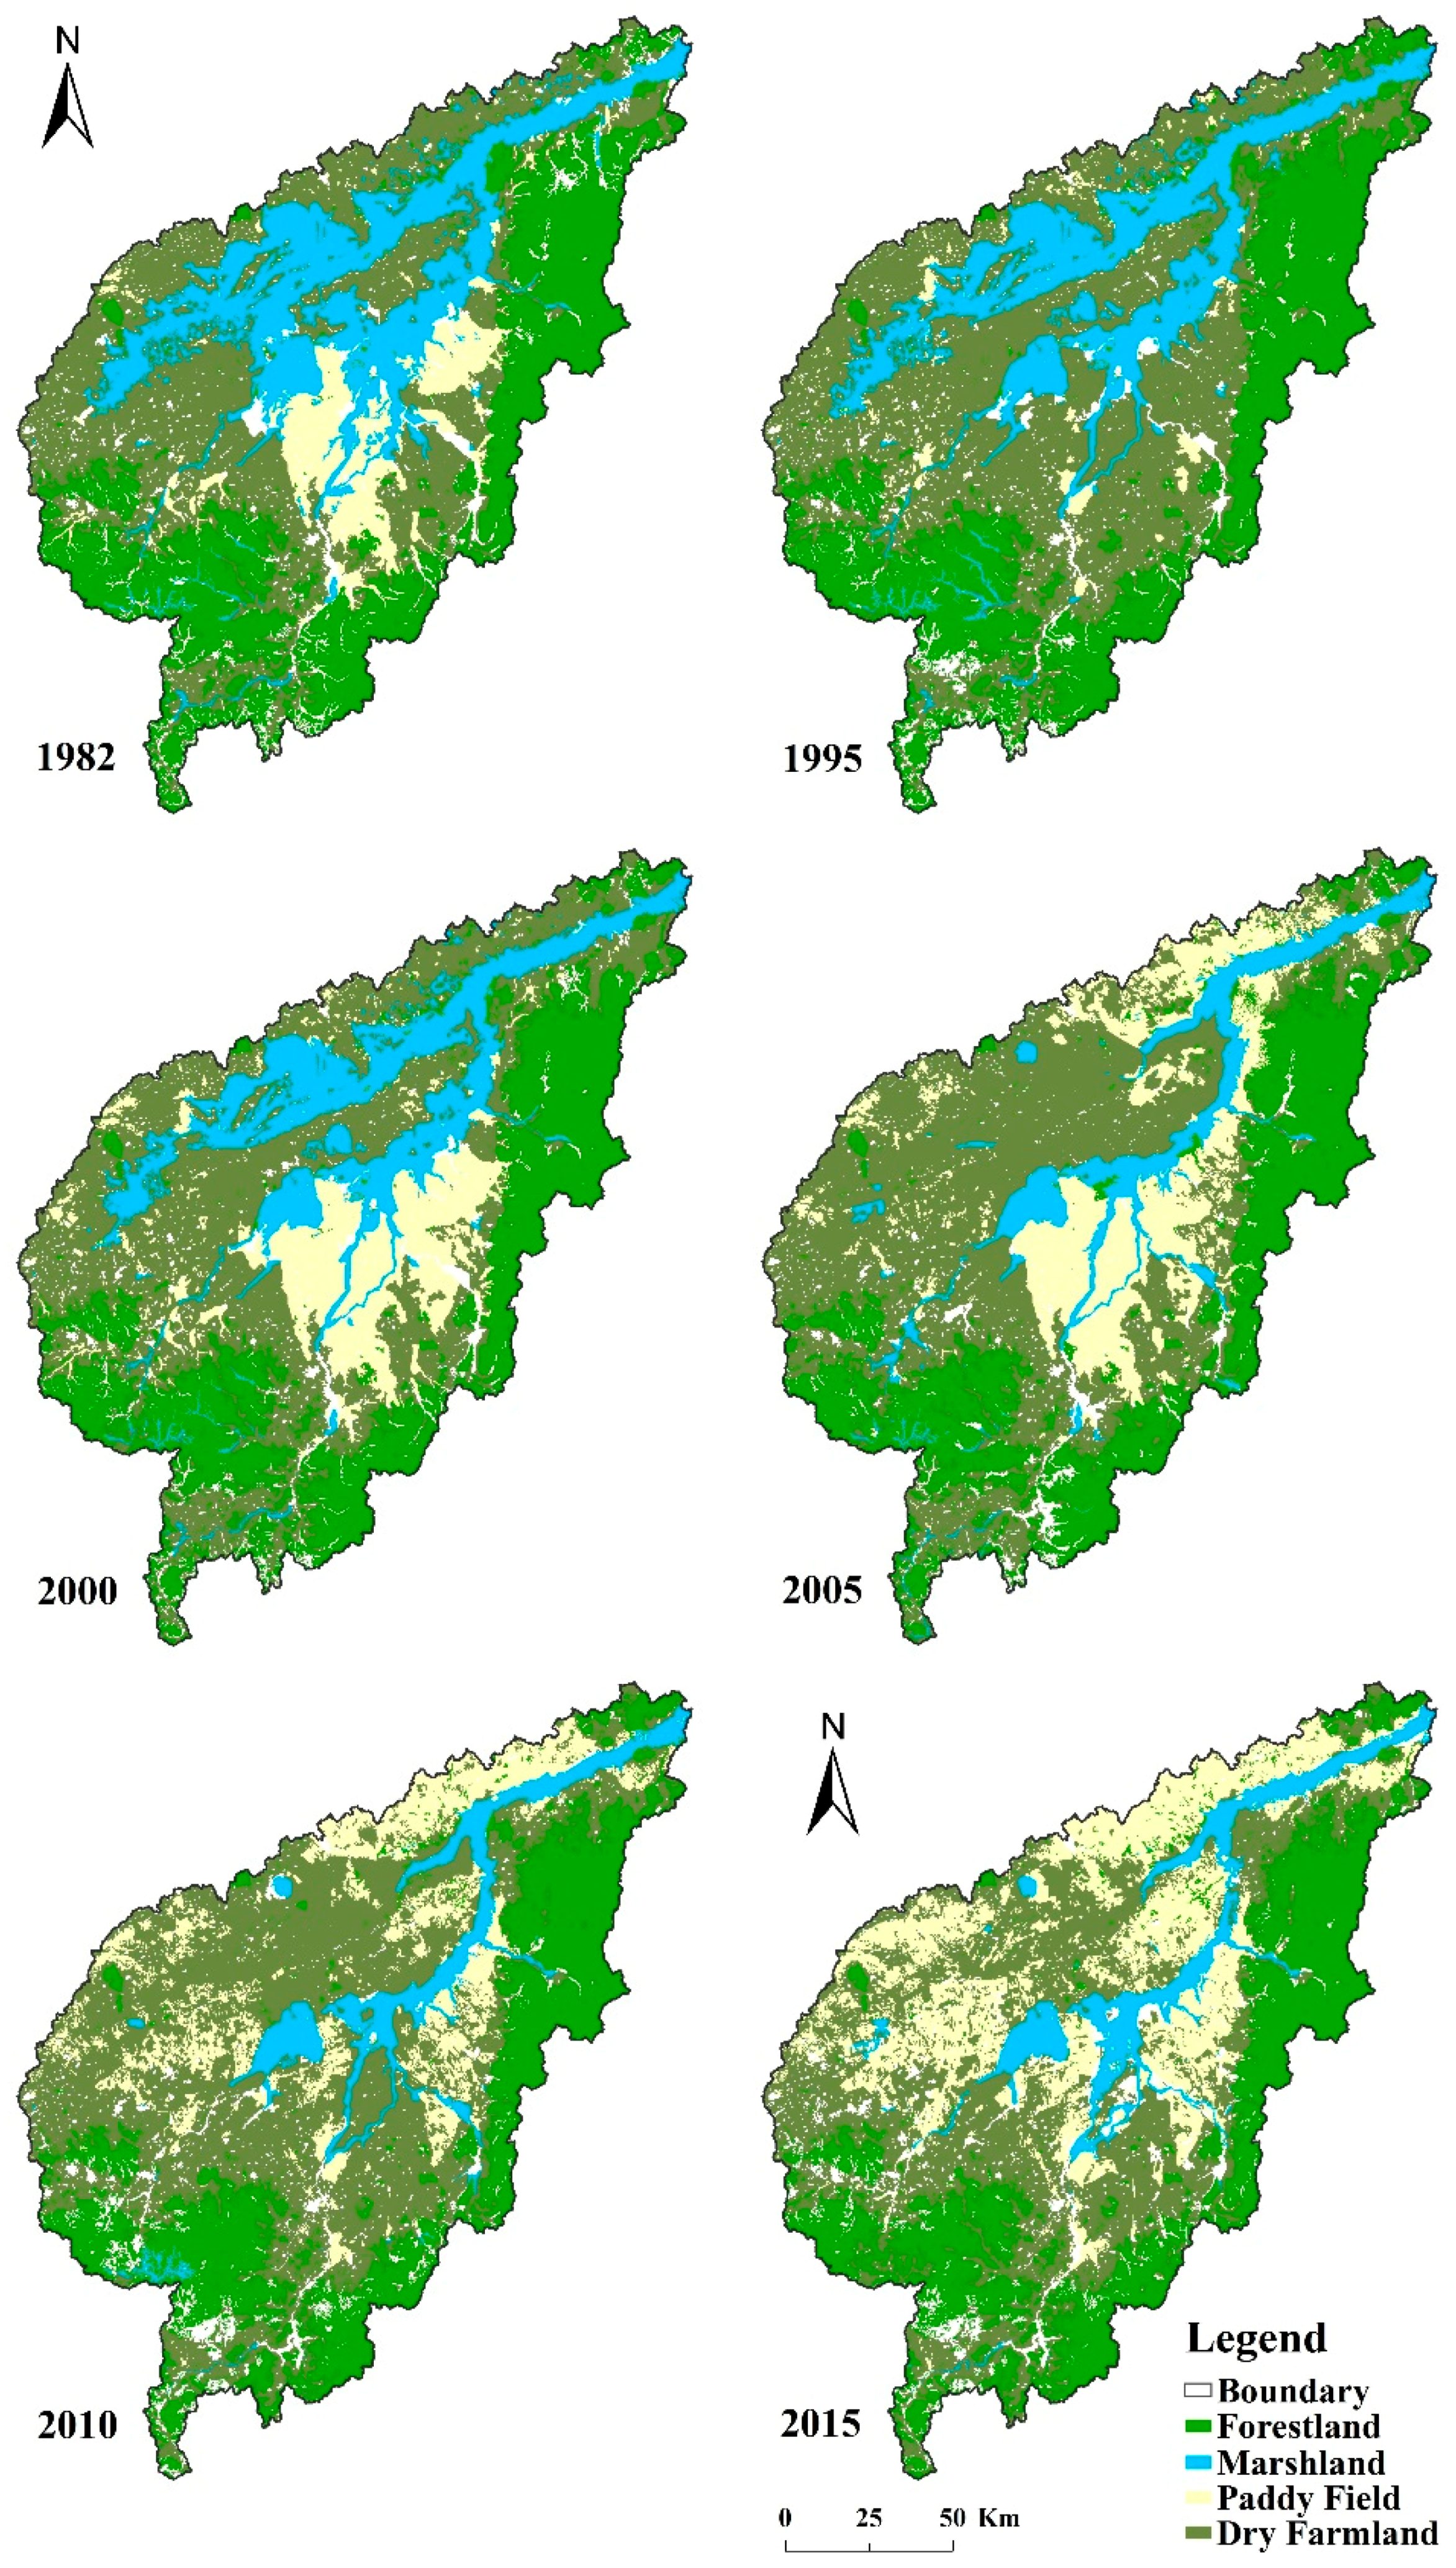
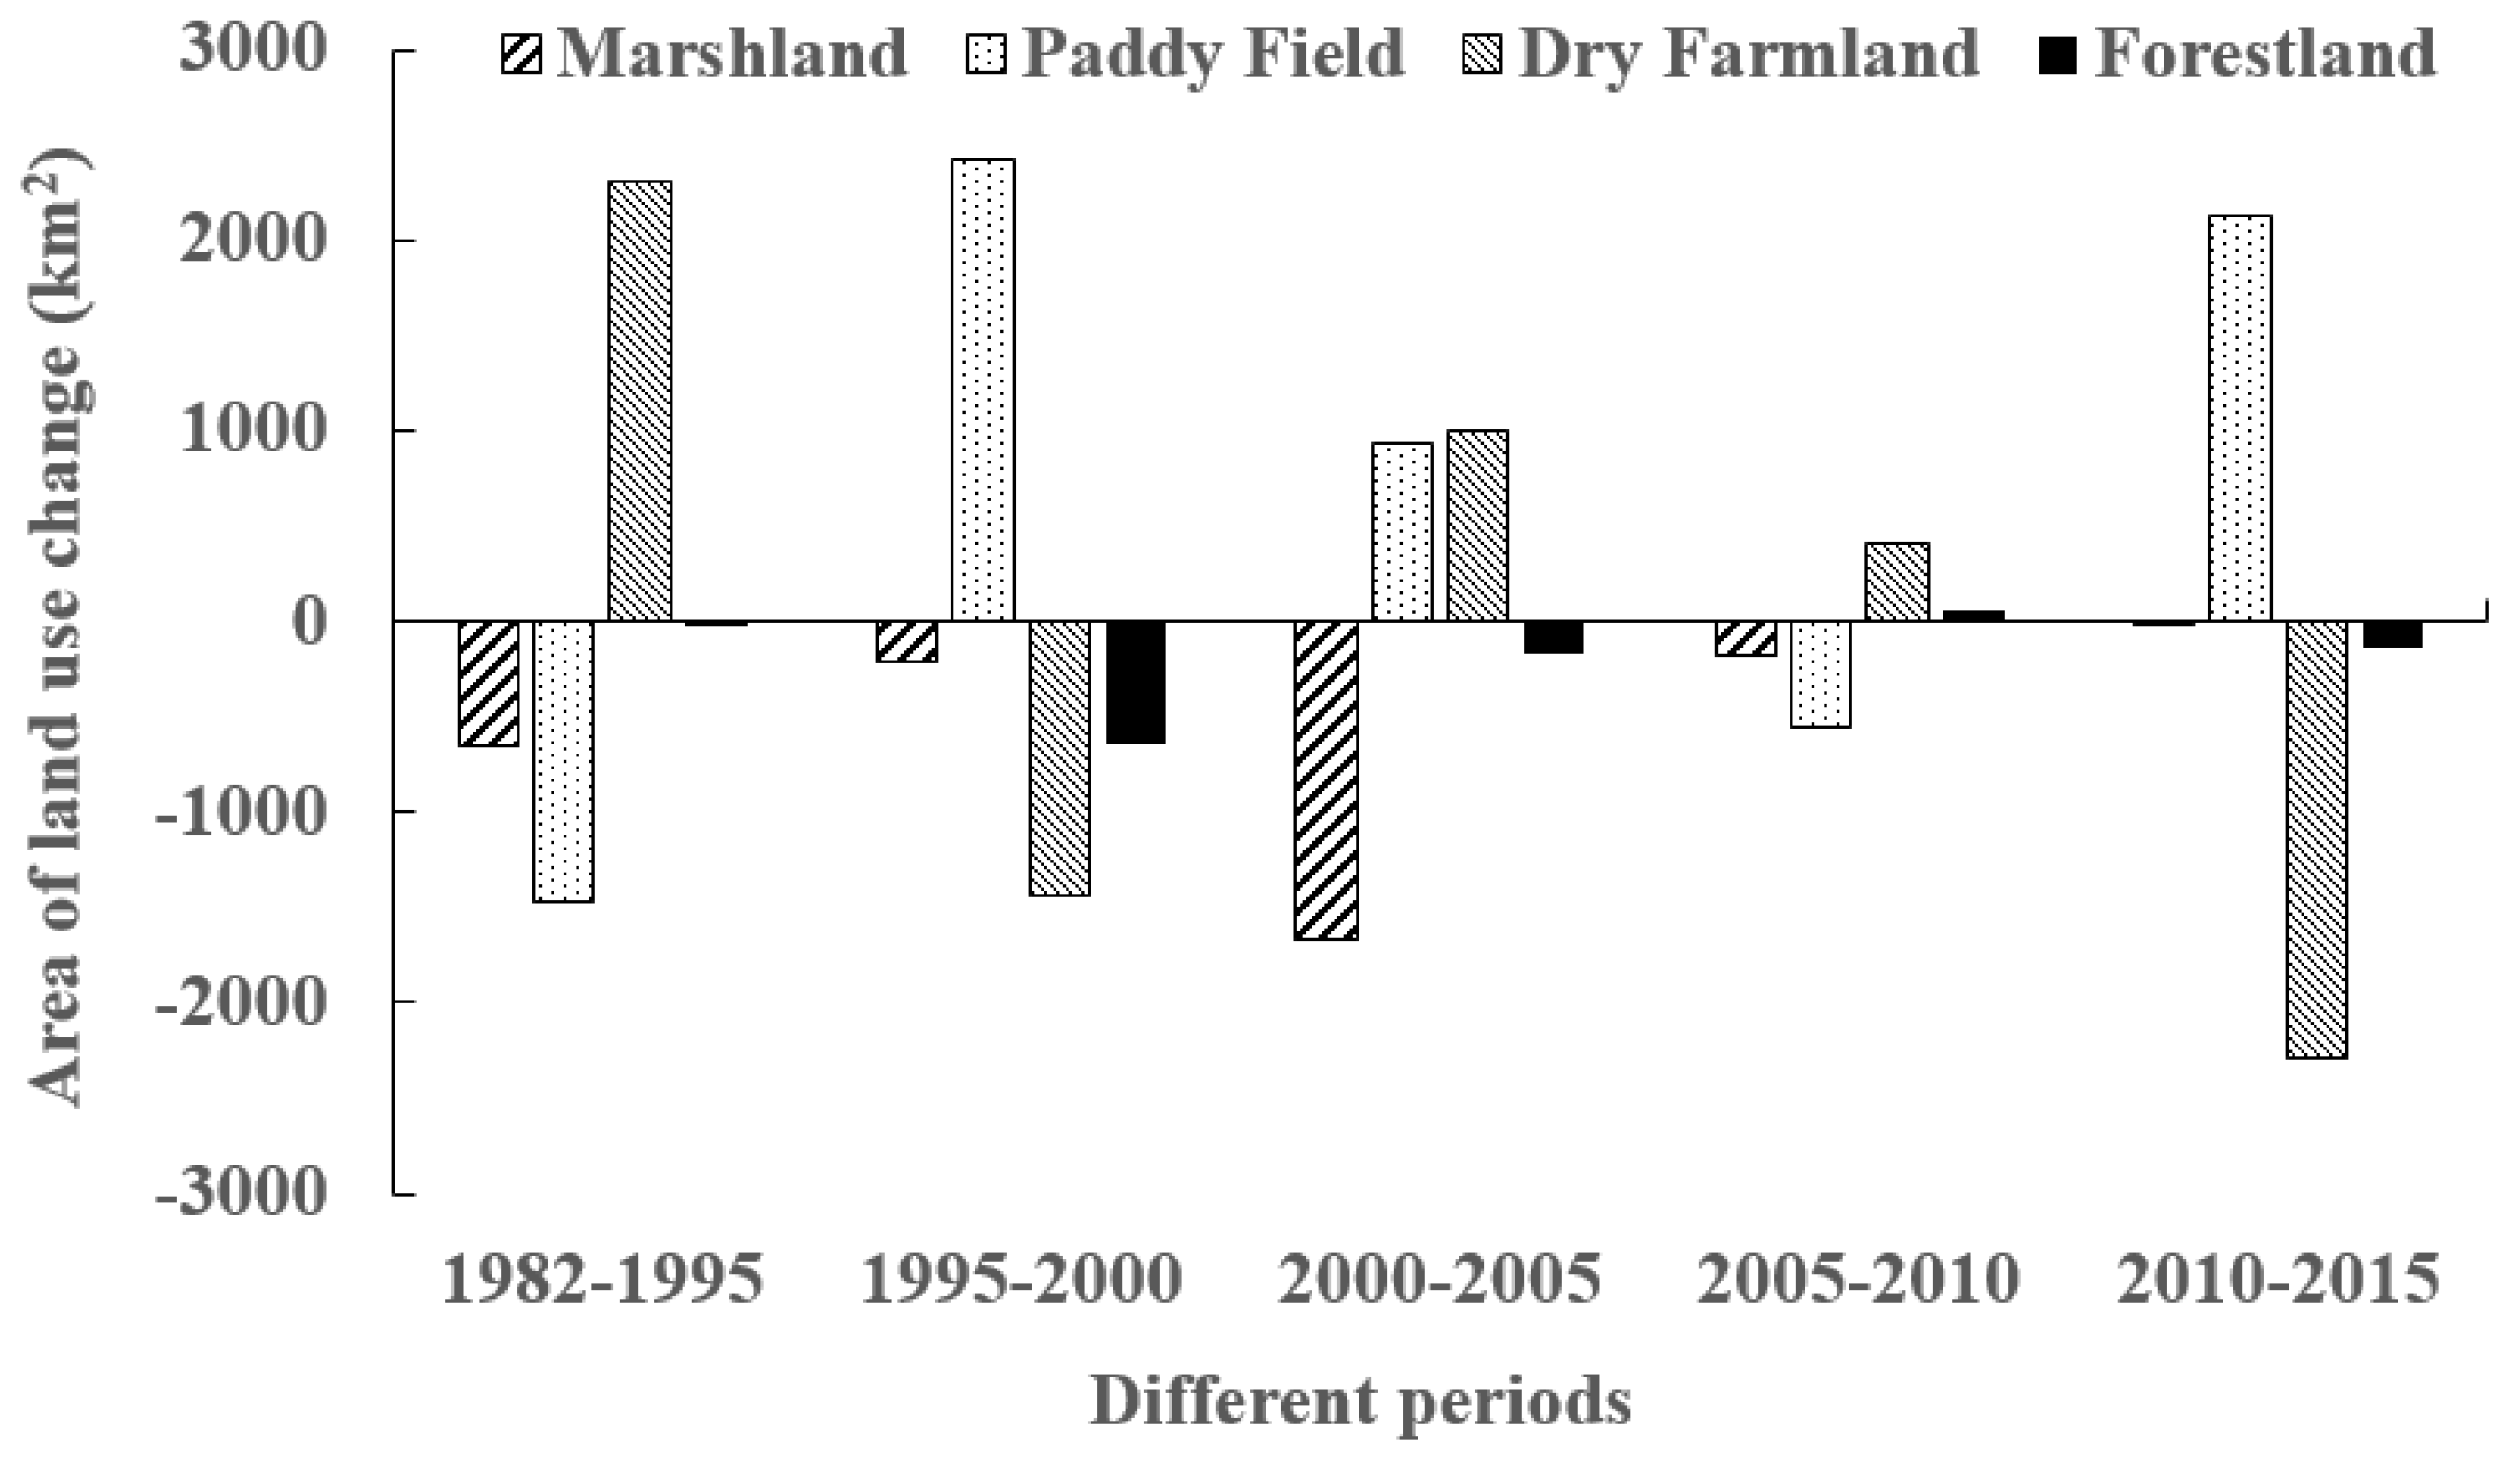
3.1. Land Use Changes
3.2. Landscape Pattern Changes
4. Discussion
5. Conclusions
Author Contributions
Funding
Acknowledgments
Conflicts of Interest
References
- Costanza, R.; d’Arge, R.; de Groot, R.; Farber, S.; Grasso, M.; Hannon, B.; Limburg, K.; Naeem, S.; O’Neill, R.V.; Paruelo, J.; et al. The value of the world’s ecosystem services and natural capital. Nature 1997, 387, 253–260. [Google Scholar] [CrossRef]
- Hirabayashi, Y.; Mahendran, R.; Koirala, S.; Konoshima, L.; Yamazaki, D.; Watanabe, S.; Kim, H.; Kanae, S. Global flood risk under climate change. Nat. Clim. Chang. 2013, 3, 816–821. [Google Scholar] [CrossRef]
- Junk, W.J.; An, S.; Finlayson., C.M.; Gopal, B.; Květ, J.; Mitchell, S.A.; Mitsch, W.J.; Robarts, R.D. Current state of knowledge regarding the world’s wetlands and their future under global climate change: A synthesis. Aquat. Sci. 2013, 75, 151–167. [Google Scholar] [CrossRef]
- Namaalwa, S.; Van Dam, A.A.; Funk, A.; Ajie, G.S.; Kaggwa, R.C. A characterization of the drivers, pressures, ecosystem functions and services of Namatala wetland. Environ. Sci. Policy 2013, 34, 44–57. [Google Scholar] [CrossRef]
- Balmford, A.; Bruner, A.; Copper, P.; Costanza, R.; Farber, S.; Green, R.E.; Jenkins, M.; Jefferiss, P.; Jessamy, V.; Madden, J.; et al. Economic reasons for conserving wild nature. Science 2002, 297, 950–953. [Google Scholar] [CrossRef] [PubMed]
- Robichaux, R.; Harrington, L.M.B. Environmental conditions, irrigation reuse pits, and the need for restoration in the rainwater basin wetland complex, Nebraska. Pap. Appl. Geogr. Conf. 2009, 32, 217–225. [Google Scholar]
- Davidson, N.C. How much wetland has the world lost? Long-term and recent trends in global wetland area. Mar. Freshw. Res. 2014, 65, 936–941. [Google Scholar] [CrossRef]
- Spaling, H. Analyzing cumulative environmental effects of agricultural land drainage in southern Ontario, Canada. Agric. Ecosyst. Environ. 1995, 53, 279–292. [Google Scholar] [CrossRef]
- Mensing, D.M.; Galatowitsch, S.M.; Tester, J.R. Anthropogenic effects on the biodiversity of riparian wetlands of a northern temperate landscape. J. Environ. Manag. 1998, 53, 349–377. [Google Scholar] [CrossRef]
- Turner, M.G. Disturbance and landscape dynamics in a changing world. Ecology 2010, 91, 2833–2849. [Google Scholar] [CrossRef] [PubMed]
- Foley, J.A.; DeFries, R.; Asner, G.P.; Barford, C.; Bonan, G.; Carpenter, S.R.; Chapin, F.S.; Coe, M.T.; Daily, G.C.; Gibbs, H.K.; et al. Global consequences of land use. Science 2005, 309, 570–574. [Google Scholar] [CrossRef] [PubMed]
- Foley, J.A.; Ramankutty, N.; Brauman, K.A.; Cassidy, E.S.; Gerber, J.S.; Johnston, M.; Mueller, N.D.; O’Connell, C.; Ray, D.K.; West, P.C.; et al. Solutions for a cultivated planet. Nature 2011, 478, 337–342. [Google Scholar] [CrossRef] [PubMed]
- Bullock, J.M.; Aronson, J.; Newton, A.C.; Pywell, R.F.; Rey-Benayas, J.M. Restoration of ecosystem services and biodiversity: Conflicts and opportunities. Trends Ecol. Evol. 2011, 26, 541–549. [Google Scholar] [CrossRef] [PubMed]
- Song, K.; Liu, D.; Wang, Z.; Zhang, B.; Jin, C.; Li, F.; Liu, H. Land use change in Sanjiang Plain and its driving forces analysis since 1954. Acta Geogr. Sin. Chin. Ed. 2008, 63, 93–104. [Google Scholar]
- Yan, F.Q.; Zhang, S.W.; Liu, X.T.; Chen, D.; Chen, J.; Bu, K.; Yang, J.C.; Chang, L.P. The effects of spatiotemporal changes in land degradation on ecosystem services values in Sanjiang Plain, China. Remote Sens. 2016, 8, 917. [Google Scholar] [CrossRef]
- Liu, H.Y.; Zhang, S.K.; Li, Z.F.; Lu, X.G.; Yang, Q. Impacts on wetlands of large-scale land-use changes by agricultural development: The small Sanjiang Plain, China. Ambio 2004, 33, 306–310. [Google Scholar] [CrossRef] [PubMed]
- Zhang, S.Q.; Na, X.D.; Kong, B.; Wang, Z.M.; Jiang, H.X.; Yu, H.; Zhao, Z.C.; Li, X.F.; Liu, C.Y.; Dale, P. Identifying wetland change in China’ s Sanjiang Plain using remote sensing. Wetlands 2009, 29, 302–313. [Google Scholar] [CrossRef]
- Li, Y.; Zhang, Y.Z.; Zhang, S.W. Landscape pattern and ecological effect of the marsh changes in the Sanjiang Plain. Sci. Geogr. Sin. 2002, 22, 677–682. [Google Scholar]
- Wang, Z.M.; Zhang, B.; Zhang, S.Q.; Li, X.Y.; Liu, D.W.; Song, K.S.; Li, J.P.; Li, F.; Duan, H.T. Changes of land use and of ecosystem service values in Sanjiang Plain, Northeast China. Environ. Monit. Assess. 2006, 112, 69–91. [Google Scholar] [CrossRef] [PubMed]
- Liu, X.T.; Ma, X.H. Effects of large-scale reclamation on environments and regional environment protection in Sanjiang Plain. Sci. Geogr. Sin. 2000, 20, 14–19. [Google Scholar]
- Yao, Y.L.; Lu, X.G.; Yu, H.X.; Wang, L. Influence factors of wetland cultivation in Naoli River Watershed of Sanjiang Plain. J. Northeast. For. Univ. 2011, 39, 72–74. [Google Scholar]
- Liu, G.H.; Luan, Z.Q.; Yan, B.X. Analysis on the spatiotemporal distribution of precipitation in the Naoli River of the Sanjiang plain during the past 50 years. J. Arid Land Resour. Environ. 2013, 27, 131–136. [Google Scholar]
- Xiao, D.R.; Tian, B.; Tian, K.; Yang, Y. Landscape patterns and their changes in Sichuan Ruoergai Wetland National Nature Reserve. Acta Ecol. Sin. 2010, 30, 27–32. [Google Scholar] [CrossRef]
- Varga, D.; Subiros, J.V.; Barriocanal, C.; Pujantell, J. Landscape transformation under global environmental change in Mediterranean mountains: Agrarian lands as a guarantee for maintaining their multifunctionality. Forests 2018, 9, 27. [Google Scholar] [CrossRef]
- Ernoul, L.; Mesléard, F.; Gaubert, P.; Béchet, A. Limits to Agri-environmental schemes uptake to mitigate human-wildlife conflict: Lessons learned from flamingos in the Camargue, southern France. Int. J. Agric. Sustain. 2013, 12, 23–36. [Google Scholar] [CrossRef]
- Liu, X.H.; Yan, S.T.; Wang, R.C.; Jiang, M.; Wang, L.; Zhang, S.J. Discussion on wetland ecological compensation standard: A case study in Xingkai Lake wetlands of international importance. Wetl. Sci. 2016, 14, 289–294. [Google Scholar]
- Chan, K.M.A.; Satterfield, T.; Goldstein, J. Rethinking ecosystem services to better address and navigate cultural values. Ecol. Econ. 2012, 74, 8–18. [Google Scholar] [CrossRef]
- Marre, J.B.; Brander, L.; Thebaud, O.; Boncoeur, J.; Pascoe, S.; Coglan, L.; Pascal, N. Non-market use and non-use values for preserving ecosystem services over time: A choice experiment application to coral reef ecosystems in New Caledonia. Ocean Coast. Manag. 2015, 105, 1–14. [Google Scholar] [CrossRef]
- Scholte, S.S.K.; Todorova, M.; van Teeffelen, A.J.A.; Verburg, P.H. Public support for wetland restoration: What is the link with ecosystem service values. Wetlands 2016, 36, 467–481. [Google Scholar] [CrossRef]
- Audet, J.; Elsgaard, L.; Kjaergaard, C.; Larsen, S.E. Greenhouse gas emissions from a Danish riparian wetland before and after restoration. Ecol. Eng. 2013, 57, 170–182. [Google Scholar] [CrossRef]
- Ghermandi, A.; van den Bergh, J.C.J.M.; Brander, L.M.; de Groot, H.L.F.; Nunes, P.A.L.D. The values of natural and human-made wetlands: A meta-analysis. Water Resour. Res. 2010, 46, 1–12. [Google Scholar] [CrossRef]
- Jiang, T.T.; Pan, J.F.; Pu, X.M.; Wang, B.; Pan, J.J. Current status of coastal wetlands in China: Degradation, restoration, and future management. Estuar. Coast. Shelf Sci. 2015, 164, 265–275. [Google Scholar] [CrossRef]


| Metrics | Indices | Description | Units |
|---|---|---|---|
| Class | LPI | It quantifies the percentage of total landscape area comprised by the largest patch. | Percent |
| Class | FRAC_AM | It reflects shape complexity across a range of spatial scales. | None |
| Class | AI | It shows the connectivity of different pairs of patch types. | Percent |
| Class | SPLIT | It is based on the cumulative patch area distribution and is interpreted as the effective mesh number. | None |
| Class/landscape | NP | It shows the number of patches. | None |
| Class/landscape | COHESION | It measures the physical connectedness of the corresponding patch type | None |
| Landscape | SHAPE_AM | It reflects the complication of landscape pattern. | None |
| Landscape | CONTAG | It considers all patch types present on an image, including any present in the landscape border. | Percent |
| Landscape | IJI | It isolates the interspersion or intermixing of patch types. | Percent |
| Landscape | SHDI | It is used to compare different landscapes or the same landscape at different times. | None |
| Landscape | SHEI | It is expressed that an even distribution of area among patch type results in the maximum evenness. | None |
| 1982 | 1995 | 2000 | 2005 | 2010 | 2015 | Rate of Change | |
|---|---|---|---|---|---|---|---|
| Marshland | 18.44 | 15.64 | 14.72 | 7.62 | 6.83 | 6.77 | −63.29 |
| Paddy Field | 8.25 | 2.00 | 12.31 | 16.26 | 13.91 | 22.93 | 177.84 |
| Dry Farmland | 37.69 | 47.53 | 41.39 | 45.66 | 47.38 | 37.68 | −0.01 |
| Forestland | 29.95 | 29.94 | 27.18 | 26.44 | 26.67 | 26.10 | −12.88 |
| Types | 1982–1995 | 1995–2000 | 2000–2005 | 2005–2010 | 2010–2015 | |
|---|---|---|---|---|---|---|
| Land use conversion | Conversion of paddy field to dry farmland | 1737.40 | 81.11 | 573.63 | 1788.57 | 181.12 |
| Conversion of dry farmland to paddy field | 284.44 | 2379.60 | 1298.30 | 1297.40 | 2272.20 | |
| Conversion of marshland to paddy field | 42.90 | 46.10 | 234.10 | 58.80 | 76.70 | |
| Conversion of marshland to dry farmland | 759.40 | 227.00 | 1590.20 | 276.60 | 98.60 | |
| Conversion of forestland to dry farmland | 290.90 | 578.70 | 364.30 | 386.30 | 575.20 | |
| Land use relative change | Marshland | −1.17 | –1.18 | –9.64 | –2.08 | –0.17 |
| Paddy field | –5.83 | 103.05 | 6.41 | –2.89 | 12.97 | |
| Dry farmland | 2.01 | –2.58 | 2.07 | 0.75 | –4.09 | |
| Forestland | –0.003 | –1.84 | –0.54 | 0.17 | –0.43 |
| Type | NP | LPI | FRAC_AM | COHESION | SPLIT | AI | |
|---|---|---|---|---|---|---|---|
| 1982 | Marshland | 153 | 9.89 | 1.20 | 99.95 | 102.12 | 99.36 |
| Paddy field | 120 | 29.90 | 1.13 | 99.83 | 4.95 | 99.15 | |
| Dry farmland | 382 | 51.58 | 1.25 | 99.95 | 3.31 | 98.61 | |
| 1995 | Marshland | 124 | 8.47 | 1.20 | 99.94 | 139.34 | 99.33 |
| Paddy field | 301 | 9.02 | 1.08 | 98.60 | 30.94 | 97.00 | |
| Dry farmland | 324 | 68.09 | 1.27 | 99.98 | 2.07 | 98.81 | |
| 2000 | Marshland | 124 | 6.50 | 1.17 | 99.92 | 232.02 | 99.35 |
| Paddy field | 325 | 23.72 | 1.14 | 99.76 | 6.99 | 98.80 | |
| Dry farmland | 557 | 59.89 | 1.27 | 99.96 | 2.60 | 98.47 | |
| 2005 | Marshland | 116 | 3.57 | 1.16 | 99.87 | 781.30 | 99.20 |
| Paddy field | 383 | 18.36 | 1.17 | 99.80 | 9.85 | 98.51 | |
| Dry farmland | 258 | 77.54 | 1.22 | 99.98 | 1.65 | 99.36 | |
| 2010 | Marshland | 49 | 2.72 | 1.16 | 99.88 | 1267.44 | 99.28 |
| Paddy field | 725 | 28.89 | 1.20 | 99.73 | 10.04 | 97.55 | |
| Dry farmland | 689 | 67.37 | 1.29 | 99.97 | 2.12 | 98.31 | |
| 2015 | Marshland | 59 | 1.73 | 1.15 | 99.85 | 1909.46 | 99.27 |
| Paddy field | 870 | 20.81 | 1.21 | 99.82 | 10.70 | 98.05 | |
| Dry farmland | 1213 | 58.88 | 1.29 | 99.95 | 2.73 | 97.58 | |
| 1982–2015 | Marshland | −94 | −8.17 | −0.06 | −0.10 | 1807.34 | −0.09 |
| Paddy field | 750 | −9.08 | 0.08 | −0.01 | 5.74 | −1.10 | |
| Dry farmland | 831 | 7.30 | 0.04 | −0.002 | −0.58 | −1.04 |
| NP | CONTAG | IJI | COHESION | SHDI | SHEI | |
|---|---|---|---|---|---|---|
| 1982 | 727 | 74.24 | 31.85 | 99.94 | 1.03 | 0.50 |
| 1995 | 768 | 79.85 | 25.77 | 99.96 | 0.75 | 0.39 |
| 2000 | 1199 | 70.41 | 41.66 | 99.94 | 1.11 | 0.57 |
| 2005 | 1323 | 67.47 | 48.69 | 99.94 | 0.86 | 0.62 |
| 2010 | 1485 | 74.84 | 20.41 | 99.95 | 0.92 | 0.47 |
| 2015 | 2192 | 68.54 | 25.76 | 99.91 | 1.16 | 0.60 |
| Subtype | NP | LPI | FRAC_AM | COHESION | SPLIT | AI | |
|---|---|---|---|---|---|---|---|
| 1982 | Thick woodland | 173 | 43.98 | 1.20 | 99.96 | 2.93 | 99.33 |
| Shrub land | 112 | 0.55 | 1.06 | 98.71 | 15,342.53 | 97.86 | |
| Sparse woodland | 39 | 0.45 | 1.06 | 98.70 | 45,558.20 | 98.02 | |
| Others | 17 | 0.05 | 1.03 | 97.49 | 151,3231.96 | 97.37 | |
| 1995 | Thick woodland | 173 | 39.40 | 1.18 | 99.94 | 3.82 | 99.37 |
| Shrub land | 86 | 0.56 | 1.07 | 98.81 | 20,831.79 | 97.74 | |
| Sparse woodland | 46 | 0.42 | 1.06 | 98.77 | 35,213.31 | 98.08 | |
| Others | 12 | 0.04 | 1.02 | 97.04 | 3,840,893.64 | 97.44 | |
| 2000 | Thick woodland | 229 | 38.14 | 1.17 | 99.93 | 4.06 | 99.28 |
| Shrub land | 105 | 0.44 | 1.05 | 98.47 | 26,150.18 | 97.69 | |
| Sparse woodland | 39 | 0.30 | 1.05 | 98.43 | 75,001.50 | 97.93 | |
| Others | 11 | 0.04 | 1.02 | 97.08 | 3,265,906.75 | 97.49 | |
| 2005 | Thick woodland | 230 | 38.74 | 1.17 | 99.92 | 4.26 | 99.27 |
| Shrub land | 94 | 0.38 | 1.05 | 98.49 | 24,860.52 | 97.84 | |
| Sparse woodland | 60 | 0.01 | 1.03 | 97.73 | 207,202.63 | 97.35 | |
| Others | 9 | 0.04 | 1.03 | 97.39 | 2,513,830.36 | 97.64 | |
| 2010 | Thick woodland | 235 | 39.71 | 1.18 | 99.93 | 4.28 | 99.23 |
| Shrub land | 88 | 0.77 | 1.08 | 99.09 | 6286.93 | 98.13 | |
| Sparse woodland | 39 | 0.36 | 1.04 | 98.66 | 41,144.30 | 98.26 | |
| Others | 13 | 0.04 | 1.03 | 97.42 | 1,885,888.44 | 97.33 | |
| 2015 | Thick woodland | 299 | 39.01 | 1.18 | 99.92 | 4.32 | 99.21 |
| Shrub land | 95 | 0.59 | 1.05 | 98.53 | 20,467.33 | 97.86 | |
| Sparse woodland | 53 | 0.39 | 1.05 | 98.51 | 46,787.03 | 97.77 | |
| Others | 13 | 0.04 | 1.01 | 96.98 | 2,885,803.54 | 97.49 | |
| 1982–2015 | Thick woodland | 126 | −4.98 | −0.02 | −0.04 | 1.39 | −0.11 |
| Shrub land | −17 | 0.04 | −0.01 | −0.19 | 5124.79 | −0.004 | |
| Sparse woodland | 14 | −0.06 | −0.002 | −0.19 | 1228.82 | −0.26 | |
| Others | −4 | −0.004 | −0.02 | −0.51 | 1,372,571.59 | 0.12 |
| NP | SHAPE_AM | CONTAG | IJI | COHESION | SHDI | SHEI | |
|---|---|---|---|---|---|---|---|
| 1982 | 341 | 8.93 | 91.11 | 29.96 | 99.95 | 0.24 | 0.17 |
| 1995 | 317 | 6.97 | 91.94 | 24.35 | 99.93 | 0.22 | 0.16 |
| 2000 | 384 | 6.80 | 91.79 | 14.49 | 99.91 | 0.22 | 0.16 |
| 2005 | 393 | 6.41 | 92.11 | 35.54 | 99.91 | 0.21 | 0.15 |
| 2010 | 375 | 7.00 | 89.47 | 23.43 | 99.91 | 0.28 | 0.20 |
| 2015 | 460 | 6.76 | 91.84 | 25.07 | 99.91 | 0.22 | 0.16 |
© 2018 by the authors. Licensee MDPI, Basel, Switzerland. This article is an open access article distributed under the terms and conditions of the Creative Commons Attribution (CC BY) license (http://creativecommons.org/licenses/by/4.0/).
Share and Cite
Liu, X.; An, Y.; Dong, G.; Jiang, M. Land Use and Landscape Pattern Changes in the Sanjiang Plain, Northeast China. Forests 2018, 9, 637. https://doi.org/10.3390/f9100637
Liu X, An Y, Dong G, Jiang M. Land Use and Landscape Pattern Changes in the Sanjiang Plain, Northeast China. Forests. 2018; 9(10):637. https://doi.org/10.3390/f9100637
Chicago/Turabian StyleLiu, Xiaohui, Yu An, Guihua Dong, and Ming Jiang. 2018. "Land Use and Landscape Pattern Changes in the Sanjiang Plain, Northeast China" Forests 9, no. 10: 637. https://doi.org/10.3390/f9100637
APA StyleLiu, X., An, Y., Dong, G., & Jiang, M. (2018). Land Use and Landscape Pattern Changes in the Sanjiang Plain, Northeast China. Forests, 9(10), 637. https://doi.org/10.3390/f9100637