Article

Leaf Phenology Variation within the Canopy and Its Relationship with the Transpiration of Populus tomentosa under Plantation Conditions

1
Ministry of Education Key Laboratory of Silviculture and Conservation, Beijing Forestry University, Beijing 100083, China
2
Beijing Academy of Forestry and Pomology Sciences, Beijing 100093, China
3
Faculty of Agriculture, Forestry and Medicine, The Open University of China, Beijing 100036, China
4
Plant & Food Research, Fitzherbert Science Centre, Palmerston North 4412, New Zealand
5
Institute of Ecology, Hunan Academy of Forestry, Changsha 410018, China
*
Author to whom correspondence should be addressed.
Forests 2018, 9(10), 603; https://doi.org/10.3390/f9100603
Submission received: 5 September 2018 / Revised: 21 September 2018 / Accepted: 26 September 2018 / Published: 29 September 2018
(This article belongs to the Section Forest Ecophysiology and Biology)

Abstract

:
To provide a theoretical basis for developing intensive cultivation practices for Populus tomentosa plantations, the leaf phenology variation within the canopy and its relationship with transpiration of well-watered P. tomentosa tree in a dense plantation were investigated. The variation in canopy light interception, indicated by the ratio between net radiation under (Rn-u) and above (Rn-a) canopy, with leaf development was also studied. During the growing season, the achievement of maximum leaf number tended to be later in higher parts of the canopy. In the lower and middle canopy, the leaf number maximized earlier in the east-facing side than in the west-facing side, but this difference disappeared in the upper canopy. The Rn-u/Rn-a was stable in May, but declined and then varied steadily until late August. Generally, in May, the crop coefficient (Kcb) of the tree reached its highest level and was not correlated with leaf area (LA) in all layers (p > 0.05). However, it increased linearly (p < 0.001) with LA in the layers above a canopy height of 3 m from June to late August, and most of its variation was explained by LA in the 5–7 m layer. After late August, Kcb decreased linearly with decreasing LA in all layers (p < 0.001). Consequently, a temporal ecological strategy seems to be adopted by P. tomentosa leaves in different layers and azimuthal sides for efficient light acquisition. The contribution of the different canopy layers to tree transpiration can vary, with the leaves in the upper and all layers mainly controlling transpiration in summer and in spring and autumn, respectively.

1. Introduction

Poplar has been identified as one of the fastest growing trees in temperate zones, and is also one of the main tree species for developing fast-growing and high-yielding plantations in North China. Plantations of poplar can not only produce a large amount of wood and fiber resources, but also provide ecosystem and environmental services, such as watershed services, waste management, carbon sink, biodiversity and wildlife habitat, etc. At present, the poplar timber plantation area has reached 4.82 million ha, accounting for 7.66% of the total timber plantation area in China [1] and ranking first in the world. However, the productivities and qualities of these poplar plantations are still very low, and they need to be improved urgently by environmentally friendly intensive cultivation practices, such as water-saving irrigation, fertilization, pruning, and weed control [2,3,4].
Understanding of the growth rhythm of the trees is the basis to improve plantation productivities by intensive cultivation practices that can be refined according to the characteristics of tree growth [5,6]. The leaves are the primary photosynthetic organ for producing carbohydrate in most cases, so its phenology is closely related to tree’s growth rhythm. Additionally, leaf phenology can alter the interception and allocation of light, microclimate, and the potential carbon-gain strategy within canopy [7,8,9,10,11]. Thus, information on leaf phenology within the canopy will help to gain more profound insights into tree growth characteristics and to predict forest productivity [12].
However, since it is very difficult, time-consuming and laborious to closely observe the leaf phenology of trees in the field, most researchers have investigated the leaf development of forests by indirectly measuring leaf area index [13,14,15]. There are also some researchers who did pioneering work on observing leaf dynamics in forest with the help of binoculars [16], mobile walk-up towers [17], meteorological towers [18] and a canopy walkway system [12]. Although these studies investigated leaf dynamics in different canopy layers, their observations were mainly limited to variation in the areas of leaves from some representative branches, or branch units [9,16,17]. This will definitely result in some bias of the actual leaf phenology within the canopy, because of the high heterogeneity in light availability along the canopy profile [19] which can result in tremendous variability in leaf development within the canopy [16]. Therefore, observing the dynamics of all leaves is the most precise way to understand leaf phenology within the canopy. However, to our knowledge, no attempt has been conducted for such detailed work in forest plantations. In addition, previous works have provided deep insights into the vertical variation of leaf phenology within canopy [9,16,17,20], but the changes in the leaf phenology with azimuth at different canopy levels remain unclear and have not been investigated.
Knowledge of tree water use is also pivotal for developing efficient cultivation practices for promoting forest productivity and quality [5,21] and it can help to predict tree growth [22,23]. Thus, a huge number of researchers have investigated the water use of plantations of many tree species [13,14,15,22]. Whole tree water use is the summation of transpiration rates of all the leaves within the canopy, so transpiration of a tree is closely related to, and can be determined by, the leaf phenology and physiology in its canopy. At present, the control effects of stand leaf dynamics on tree water use have been well studied and understood by correlating transpiration of trees to stand leaf area index [14,15,24,25]. However, the response of tree water use to the leaf areas in different canopy layers has been little investigated. Thus, it is still not clear how leaves in different canopy layers influence the seasonal transpiration variation of the trees in plantations.
The Chinese white poplar, Populus tomentosa Carr. (Salicaceae), plays a critical role in poplar timber plantations in the North China Plain [26], but the average actual plantation productivity of P. tomentosa in this region is still far lower than its potential productivity [5,27]. Consequently, in order to provide a theoretical basis for developing high-efficiency intensive cultivation measures for P. tomentosa plantations, based on leaf phenology and tree water use, this study was conducted with three objectives: (1) to determine the leaf phenological variation with canopy height and azimuth in different canopy layers of P. tomentosa, (2) to investigate the variation of canopy light interception with leaf development in the canopy profile, and (3) to reveal the relationships between transpiration and the leaf areas in different canopy layers. To achieve these objectives, only one sample tree in a mature P. tomentosa plantation was selected as the research focus, due to the great difficulty in investigating the leaf phenology of a big tree that requires counting all the leaves within its canopy. However, although using only one sample tree for study may introduce a high risk of random effect, it provides the opportunity to thoroughly understand the leaf phenology variation within the canopy by counting all of the leaves. Besides, this method can also help to directly link the whole tree transpiration to the leaf development in different canopy parts.

2. Materials and Methods

2.1. Experimental Site Description and Experimental Plantation

The experimental site was located in Gaotang County, Liaocheng City, Shandong Province, China (36°58′ N, 116°14′ E, and elevation 27 m). In this area, the climate is a warm temperate monsoon. The average annual precipitation, air temperature, and free water-surface evaporation were 545 mm, 13.2 °C and 1880 mm, respectively. The deep soil, developed from quaternary alluvium, had a texture of silt and silt loam over the 0–120 and >120 cm soil depths, respectively. In the upper 40 cm layer, the soil has an average bulk density of 1.63 g cm−3, pH of 8.1, 41.5 mg kg−1 available N, 76.8 mg kg−1 available K, 7.11 mg kg−1 available P, and 0.94% organic matter.
The experimental plantation was established in late March 2005 with the clone B301 of P. tomentosa. The trees were planted with an alternate narrow- (2 m) and wide-row (6 m) spacing scheme, with within-row spacing of 1 m (Figure 1). This led to a planting density of 2500 trees ha−1. From 2010 to 2011, a subsurface drip irrigation experiment was installed in this plantation, and the experiment had three irrigation treatments, and one control non-irrigation treatment with each, including three replications [5]. The present study was only conducted in the second replicated plot of the T25 treatment in 2010. In this treatment, the trees were irrigated when the average tensiometer-measured soil water potential at the 20 cm depth and 10 cm distant from a drip emitter reached −25 kPa. Due to the onset of the rainy season, and the high (shallow) groundwater level afterward [5], irrigation was only implemented from early April to early August, with total irrigation amount of about 336 mm.
From the tree row in the west side of a tree belt in the middle of the experimental plot (Figure 1), one single representative tree was selected with a diameter at breast height = 9.05 cm, height = 11.6 m, under-branch height = 3.60 m, and average canopy width = 2.90 m. This tree of average size was selected for leaf number and area, trunk sap flux, and leaf physiological parameters measurements.

2.2. Field Experiment Measurements

2.2.1. Leaf Number and Leaf Area

A steel scaffold (Figure S1) of about 12 m was installed around the sample tree at the end of April 2010 (Figure 1). The canopy of the sample tree at the beginning of the experiment was about 8 m length and was divided into eight layers by 1 m interval (Figure 1). The first-order branches and their sub-branches were also divided into different segments as belonging to different canopy layers according to their spreading trajectories. The different branch segments were distinguished by marking the branches using marker pen. All the first-order branches attached to a specific canopy layer were numbered and marked with waterproof labels, and the heights that they branched from the stem were defined as their branch heights, which was set to 0 at the bottom of the canopy (Figure 1). Detail information on the basal diameters and growth directions of these first-order branches are listed in Table 1. As illustrated in Figure S2, most first-order branches of the sample tree were located in four azimuthal directions of E, NE, N, and NW, which accounted for 76% of the total amount.
From early May onward, measurements of leaf number and area were conducted about every 15–20 days. Each time, we climbed on the steel scaffold and counted every leaf within the canopy manually. The leaf number of the different branches and canopy layers were recorded. Then leaf samples, including ca. 50–60 leaves with different sizes, were randomly collected from the lower (canopy layer of 0–3 m), middle (3–6 m), and upper parts (>6 m) of the canopies of the adjacent trees, respectively. These leaf samples were taken to the laboratory for scanning using an Epson Twain Pro high-quality scanner at 400 dpi, and the images were analyzed using automatic image analysis software WinRHIZO (Regent Instruments Inc., Quebec City, QC, Canada) to obtain the projected area of leaves. The average area per leaf (cm2 leaf−1) of the leaf samples from different canopy parts and the leaf number in various canopy layers were used to estimate the total leaf area (LA) of each first-order branch, and within a specific canopy layer of the sample tree. Then, the daily trends in the LAs of the different canopy layers were calculated by linear interpolation using the data of two successive measurements. In addition, in order to investigate the leaf phenology variation with azimuth in different canopy layers, we compared the dynamics of leaf number on first-order branches in east- (narrow row zone, including first-order branches in east, northeast and southeast directions) and west-facing (wide row zone, including first-order branches in west, northwest and southwest directions) sides (Figure 1; Table 1).
Leaf number variation rates (number d−1) of different first-order branches and canopy layers between two successive measurement times were calculated by dividing the variation of leaf number by the number of days within this period. The leaf number decrease and increase rates of each first-order branch were summed respectively to obtain that of the whole tree, and their summation was the net leaf number variation rate.

2.2.2. Trunk Sap Flux

Trunk sap flux density (cm s−1) of the sample tree was measured using thermal dissipation probes (TDP30, Dynamax Inc., Houston, TX, USA). Two sets of probes were inserted into the sapwood about 1.3 m above the ground on the south and north aspects of the sample tree trunk, respectively, in early April 2010. Then, waterproofing sealant was placed around these probes to keep out any water, and reflective bubble insulation was used to wrap the stem and probes to reduce thermal gradients. Sap flux density was measured every 30 s, and the 10-min mean data were stored in an automatic data logger (Model DL2e, Delta-T Devices Inc., Cambridge, UK). During the experiment, sap flux was continuously monitored until the growing season ended. The measured sap flux and the sapwood area (calculated using our established allometric equation describing the variation of sapwood area with the trunk diameter of P. tomentosa [15]) were used to estimate the daily tree transpiration (mm d−1) according to Granier [28]. Then the crop coefficient (Kcb) of FAO-56 for the sample tree was calculated by dividing the transpiration by the reference crop potential evapotranspiration (mm d−1), which was estimated using the meteorological data according to the Penman-Monteith equation [29].

2.2.3. Soil Water Content

At the end of April in 2010, one rectangular experimental plot of 4 m2 was established within the average growing space around the sample tree, and the plot boundaries were along the middle lines between the sample tree and its adjacent trees in four directions (Figure 1). Twelve access tubes 2 m in length were installed within the experimental plot, and these were located in different distances from the trunk (detail of the installation scheme can be found in Xi et al. [23]. A TDR tube probe (TRIME-IPH, IMKO Inc., Ettlingen, Germany) was then utilized to measure the soil volumetric water content (θ, cm3 cm−3) dynamics within the plot from early April to early August with measurement intervals of 1–11 days. The θ profiles were measured every 10 or 20 cm intervals from the soil surface to 170 cm depth. Then the measured soil water data were used to calculate the soil water availability (rθ) using Equation (1),
r θ = θ θ w p θ f c θ w p
where θwp and θfc are the θ at the soil water potential of wilting point (−1500 kPa) and field capacity (−10 kPa [30]), respectively.

2.2.4. Net Solar Radiation Above and under the Sample Tree Canopy

Two dome net radiometers were used to measure the net solar radiation above (Rn-a) and under (Rn-u) the canopy of the sample tree from the end of April to October in 2010. The radiometers were attached to the steel scaffold around the sample tree, with one about 1 m above the canopy (adjusted the radiometer installation height regularly with the growth of canopy) and the other one 1 m underneath the canopy (Figure 1). The net solar radiation was monitored every 10 min, and the data were stored in an automatic data logger. The ratio between net solar radiation under and above the canopy (Rn-u/Rn-a) was calculated to reflect the amount of light intercepted by the canopy, with a higher Rn-u/Rn-a indicating lower light interception.

2.2.5. Leaf Physiological Parameters and Meteorological Factors

A Li-1600 steady-state porometer (Li-Cor Inc., Lincoln, NE, USA) was used to measure the leaf physiological parameters of transpiration rate (Tr) and stomatal conductance (Gs), plus photosynthetic photon flux density (Qn) within the canopy. On 21 July (a sunny day) 2010, to measure leaf physiological parameters some three, four and three branches growing in different azimuthal directions were selected from the lower, middle and upper parts of the sample tree canopy, respectively. The measurements were taken every two hours from 08:00 to 18:00, and every time we measured the Tr and Gs of three fixed leaves from each sample branches and Qn.
Meteorological factors at the experimental site were measured using a weather station (Delta-T Devices Ltd., Cambridge, UK) located about 250 m from the experimental plot. The measured factors included solar radiation (Ra), photosynthetically active radiation, air temperature and relative humidity, wind speed and direction, and precipitation.

2.3. Statistical Analysis

Linear regression was applied to analyze the relationship between Kcb and the LA in different canopy layers in different periods, with Kcb and LA as the dependent and independent variables, respectively. All statistical analyses were undertaken using the Origin 9.0 (OriginLab, Northampton, MA, USA).

3. Results

3.1. Variation of Soil Water Availability

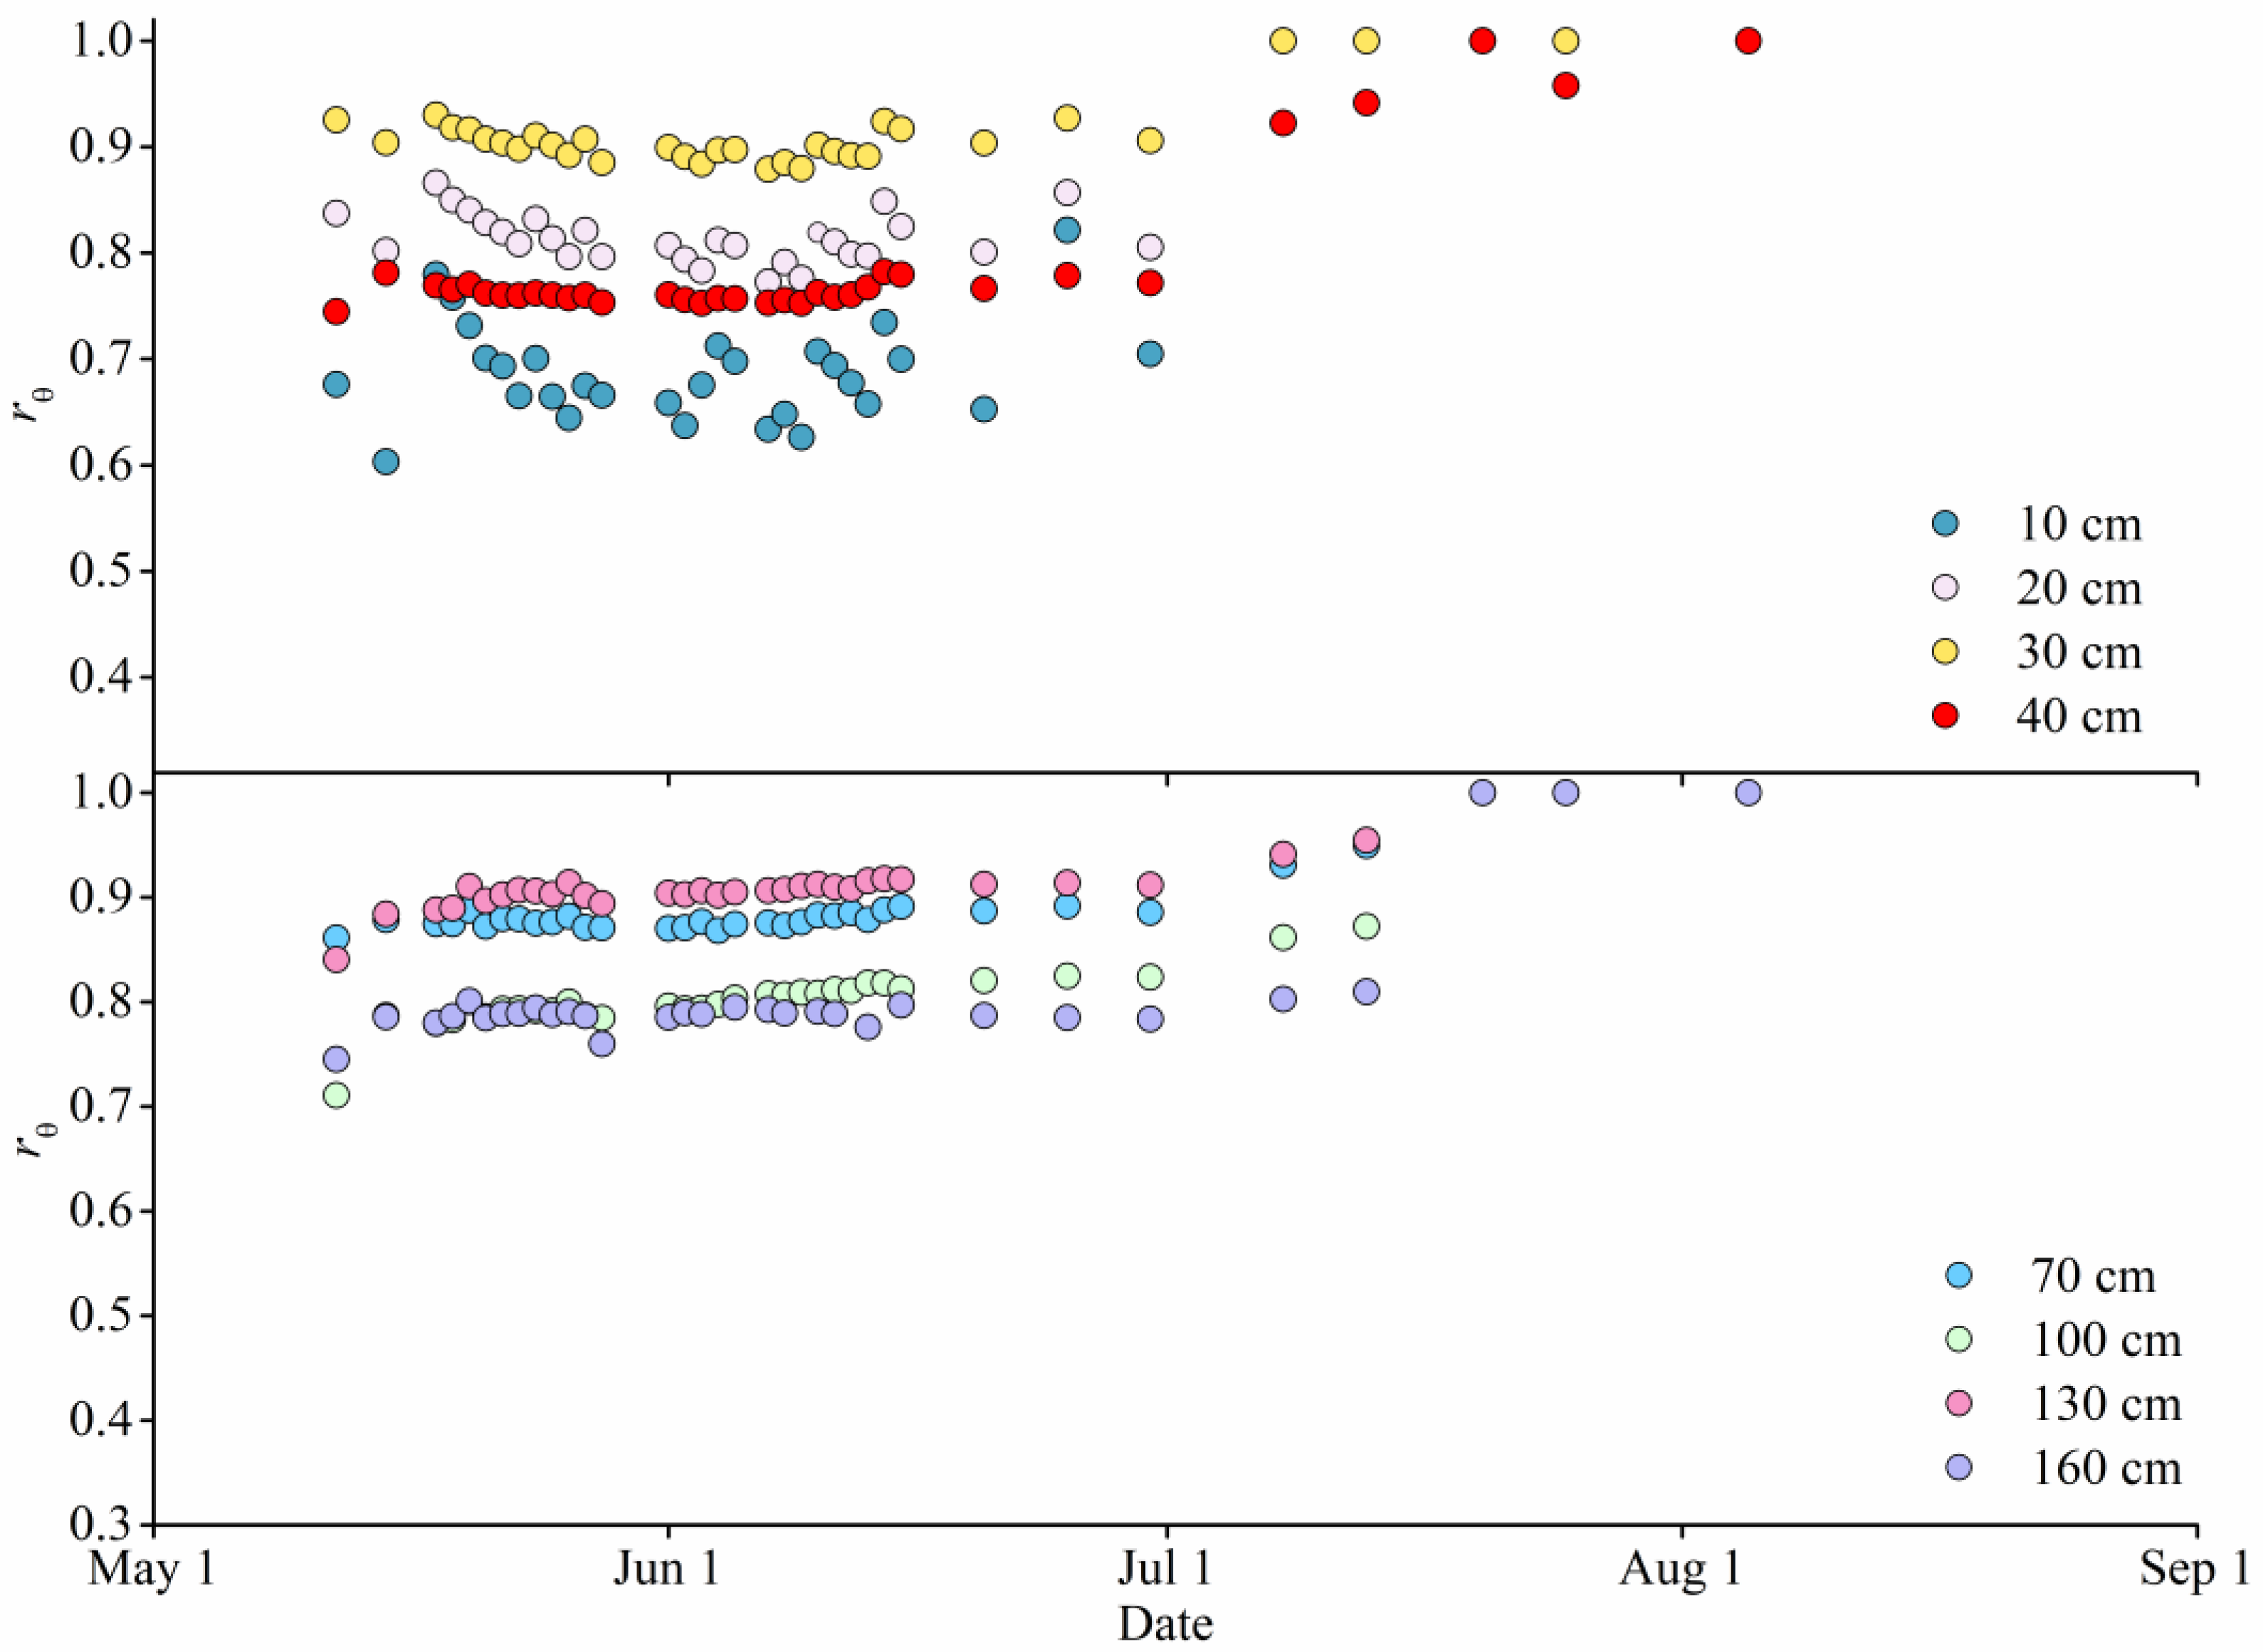
In general, there was no apparent variation trend of rθ with depth throughout the 0–170 cm soil profile within the average growing space around the sample tree. In addition, rθ values in all layers were relatively high, with the seasonal average values varying from 0.73 to 0.92 (Figure 2). During the growing season, rθ varied intensively in 0–30 cm soil and kept relatively stable below 30 cm depth before the end of June. Afterward, with the arrival of the rainy season, rθ in all soil layers increased markedly and then kept stable near 1.0.

3.2. Dynamics of Light Interception by the Canopy

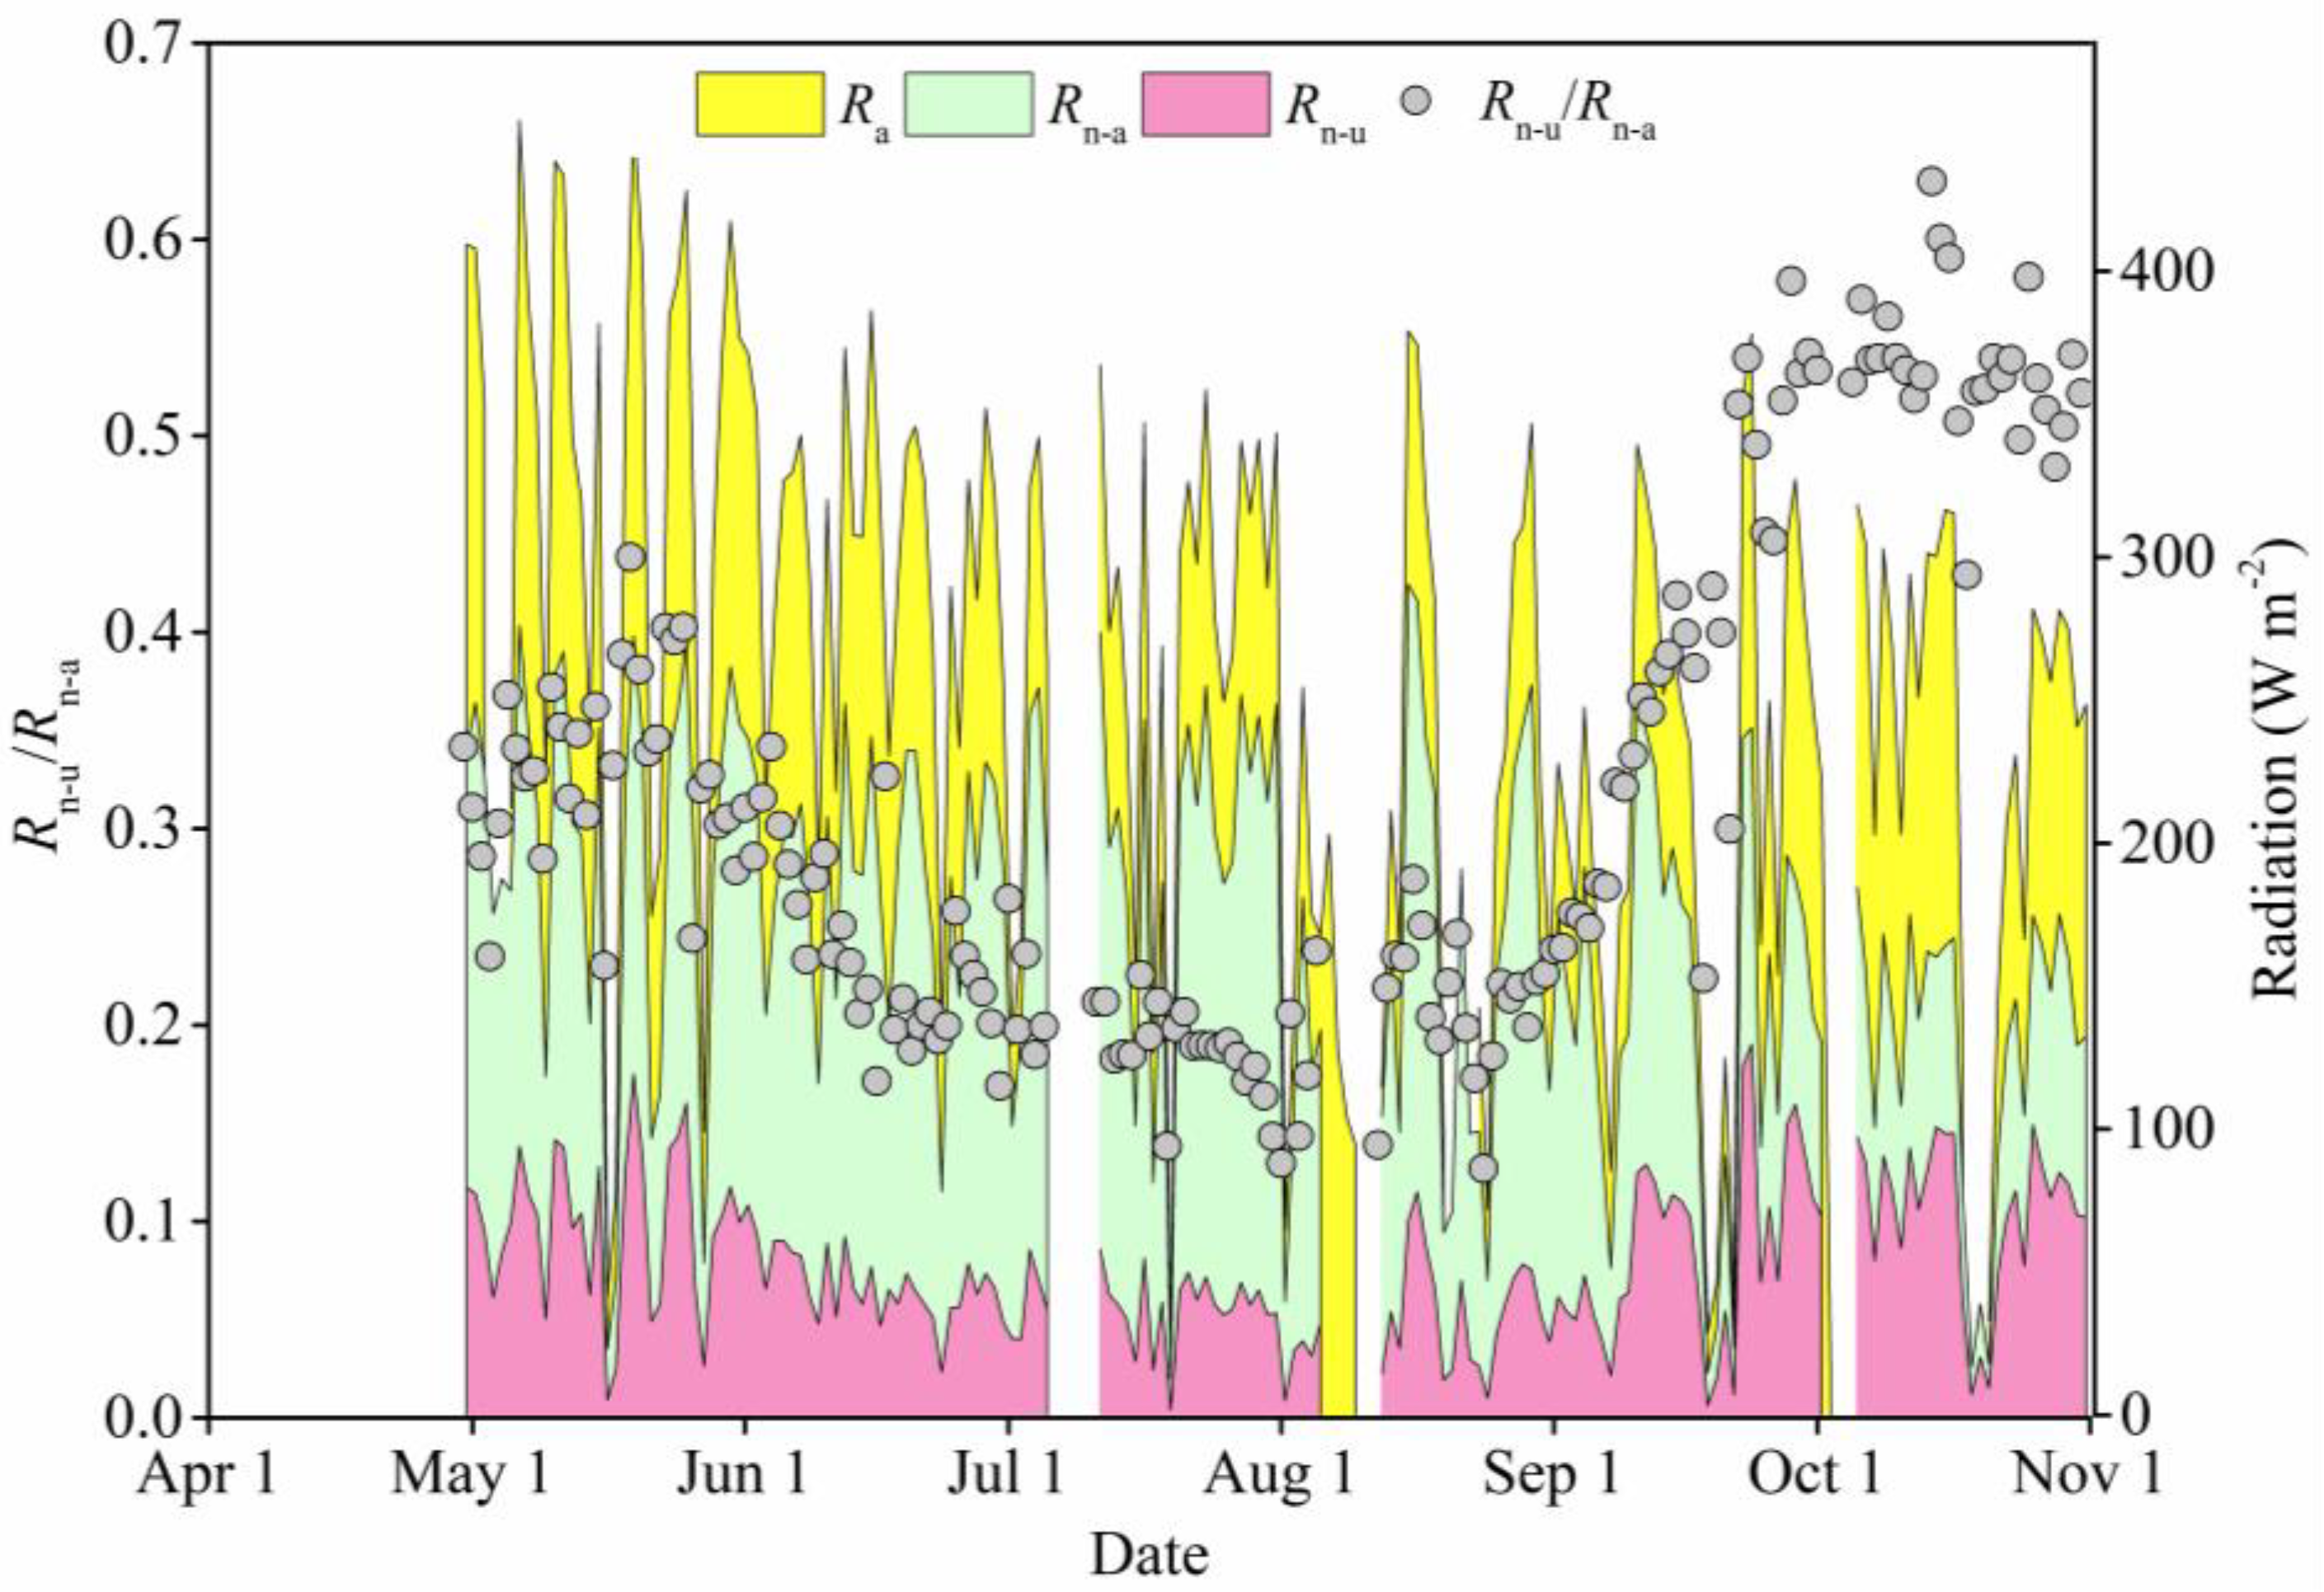
As shown in Figure 3, Rn-a was lower than Ra throughout the growing season, and both of them reached their seasonally highest levels in May, and then declined and stayed relatively stable until mid-September, after which time they declined gradually. Relative to Ra and Rn-a, Rn-u was lower and showed a similar variation trend from May to mid-September, but then it increased distinctly at the end of the growing season.
From early to late May, the Rn-u/Rn-a was relatively stable. Afterward, it declined gradually in the following month and then remained steadily around 0.2 until late August. Thereafter, Rn-u/Rn-a increased sharply to about 0.55 within one month and then stayed stable again until the growing season end.

3.3. Leaf Number Variation in Different Branch Heights

There were considerable differences in the seasonality of leaf number on the branches from different branch heights (Figure 4). The leaf number variation of all branches exhibited a single peak, except for that of the branches at the bottom (0–1 m branch height) of the canopy, which had three peaks during the growing season. In the lower part (0–3 m branch height) of the canopy, the maximum leaf number appeared between early May and early June. With increasing branch height, the time when the leaf number increased to its maximum tended to be delayed, i.e., from early June to the middle of July. However, as for the branches at the top of the canopy (>7 m branch height), their leaves also developed relatively early, and maximum leaf number appeared in early June.
Obvious leaf drop on branches in different branch heights was initiated during the period from mid-July to early August, and by late August all leaves at the canopy bottom (0–1 m branch height) had fallen off (Figure 4). This was followed by branches in the 1–3 m branch height range, where all leaves fell off in mid-September. By averaging leaf number through the growing season, branches in 4–5 m branch height of the canopy were shown to possess the most leaves (1365 pieces), accounting for half (51%) of all leaves of the sample tree. Relative to branches in the lower canopy section (1–4 m branch height), those in the upper section (>4 m branch height) had much more leaves, and accounted for 77% of the total.

3.4. Leaf Number Variation in Different Canopy Layers

Seasonal leaf number variation showed great differences across the various canopy layers (Figure 5). Overall, the date when the leaf number increased to its maximum occurred later in the higher canopy layers. Throughout the canopy, the leaf number in the 6–7 m layer was always the highest during the growing season, and was followed in sequence by that in the 5–6, 4–5 and >7 m (but only after about mid-June) layers. The total season-average leaf numbers in these four layers accounted for 84% of that of the whole canopy.
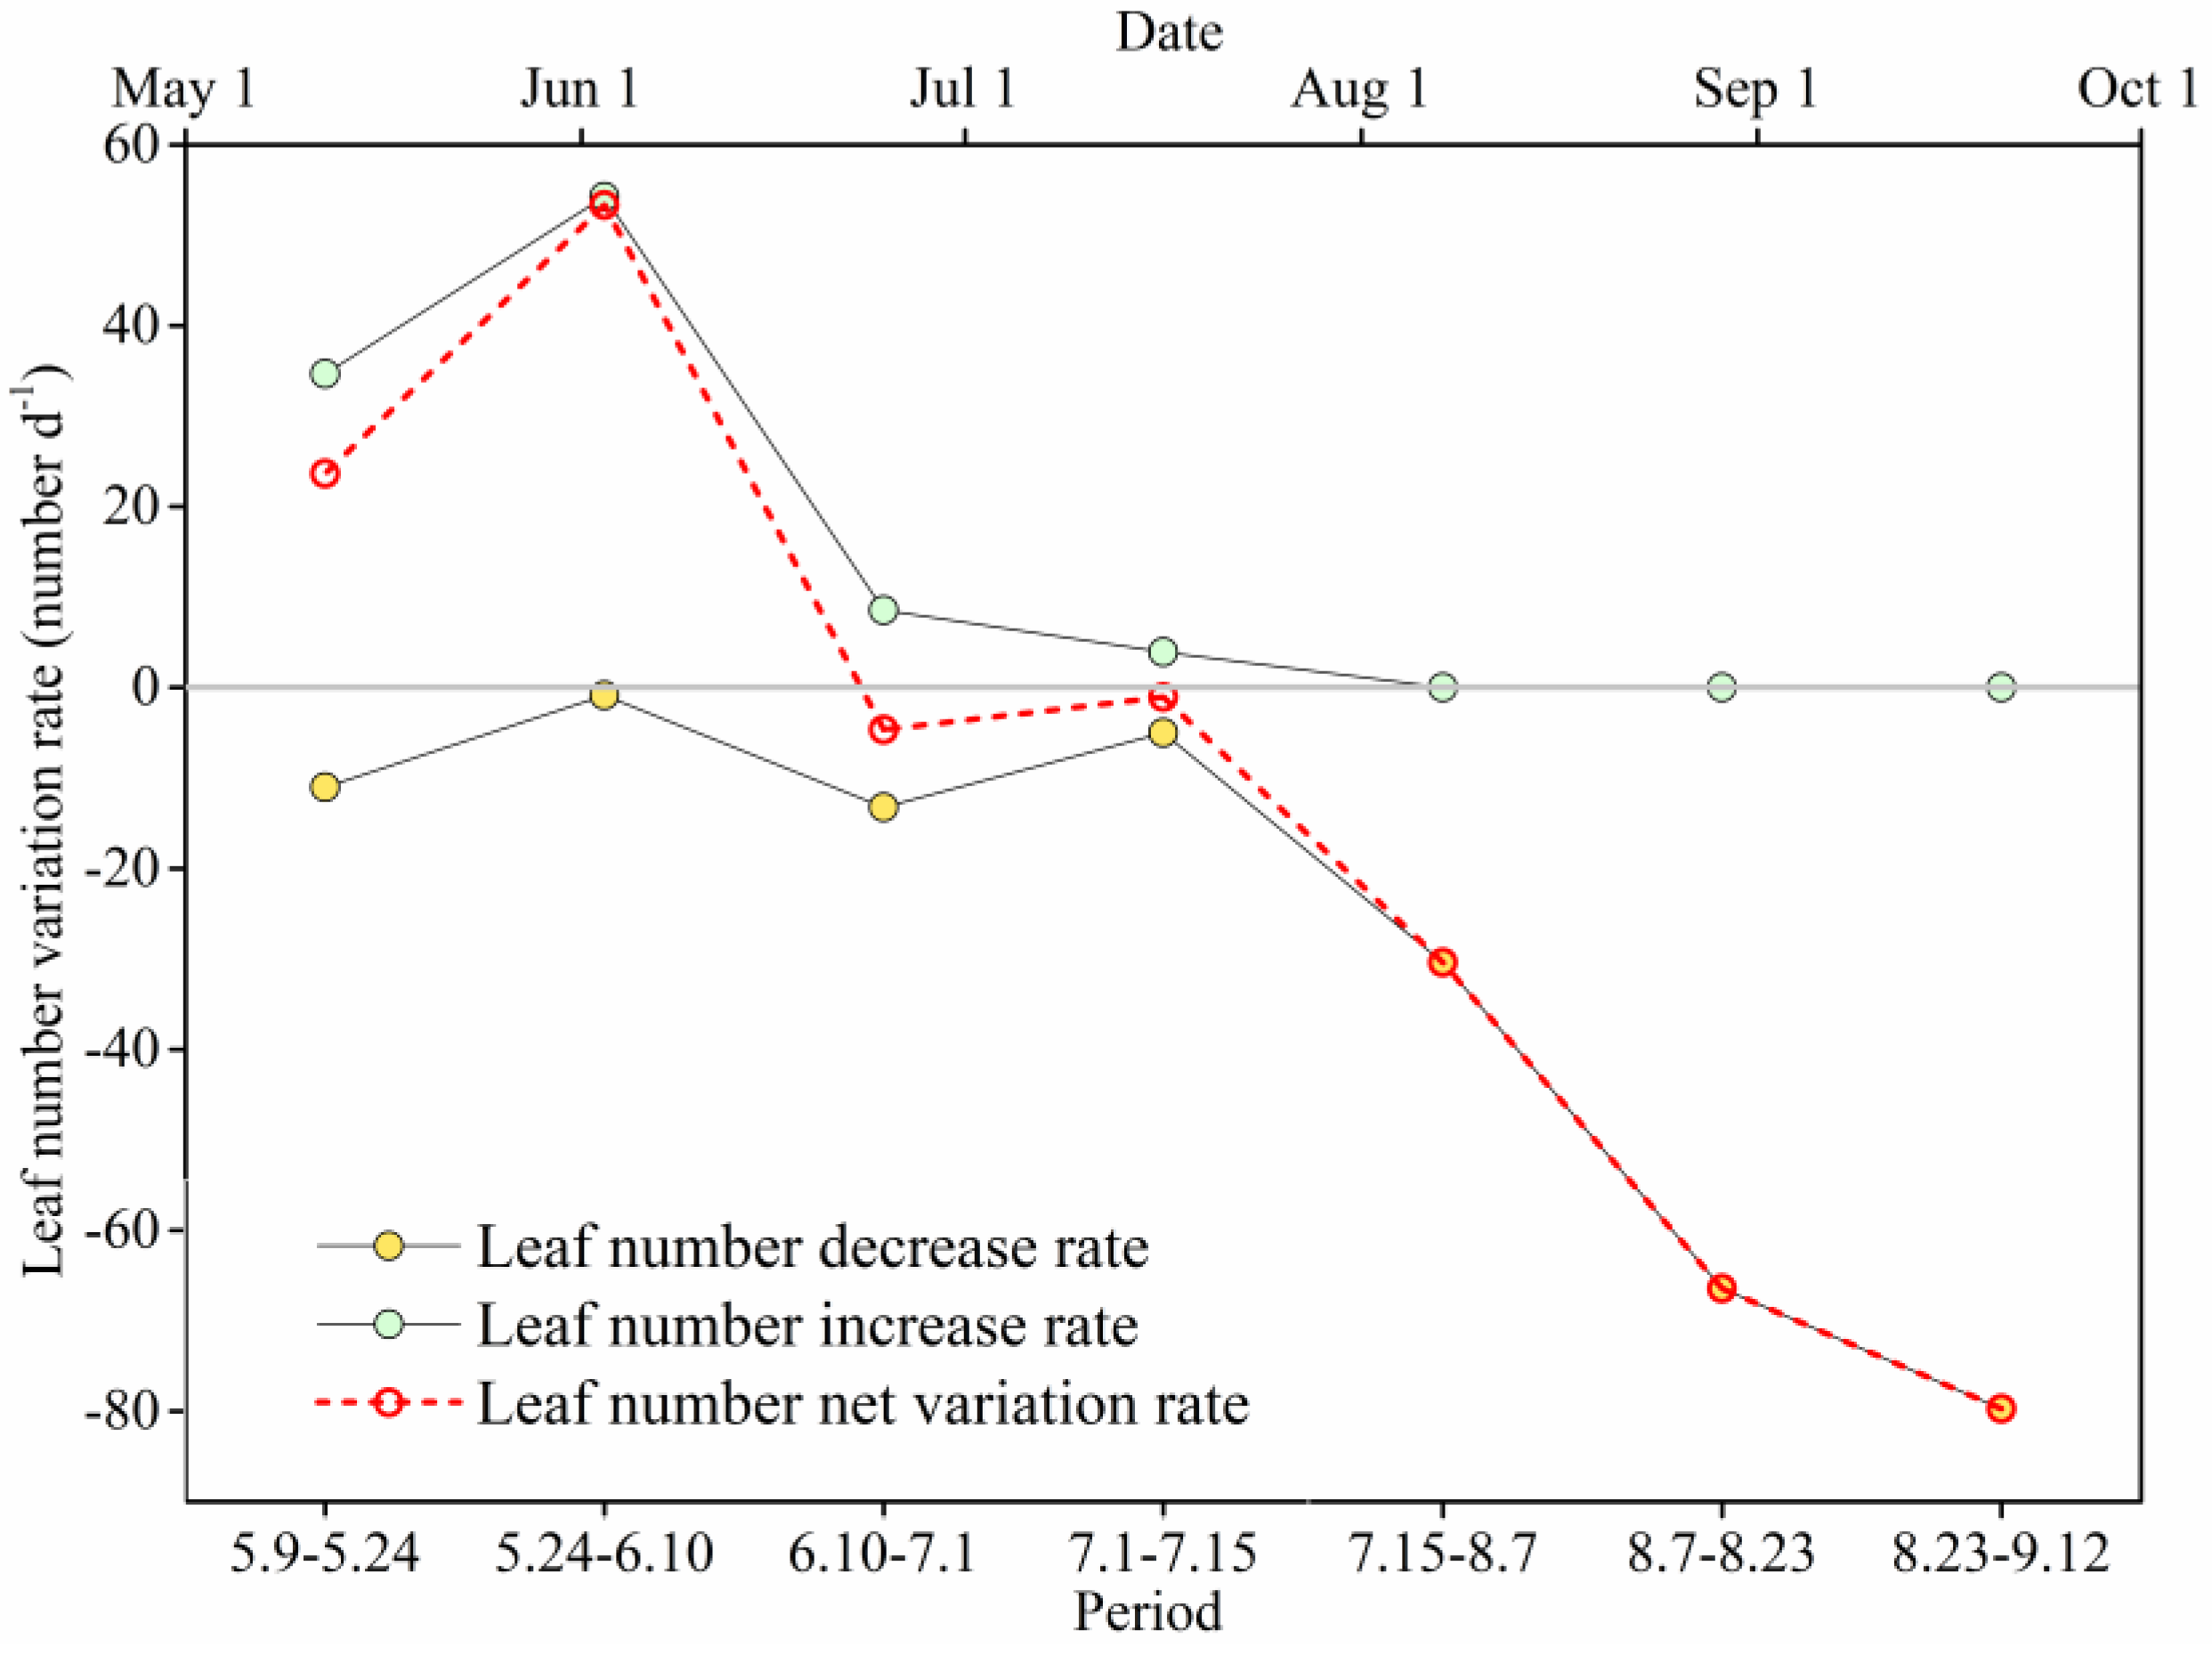
From early May to early June, leaf production rate of 35–54 leaves d−1 increased with time, and was about 3–54 times as great as the leaf falling rate of 1–11 leaves d−1 (Figure 6). Therefore, within this period, the leaf number of the whole canopy increased greatly with time and reached its annual maximum in early June (Figure 6). Afterward, the rates of leaf production (4–9 leaves d−1) and leaf drop (5–13 leaves d−1) were relatively small and were almost identical until mid-July. So there was only little variation in the leaf number in this period. After mid-July, the sample tree appeared to stop producing leaves, while its rate of leaf drop increased abruptly and accelerated with time. Consequently, the number of leaves decreased rapidly during this period, with about 59 leaves falling off every day (Figure 6).

3.5. Leaf Number Variation in Different Azimuthal Sides

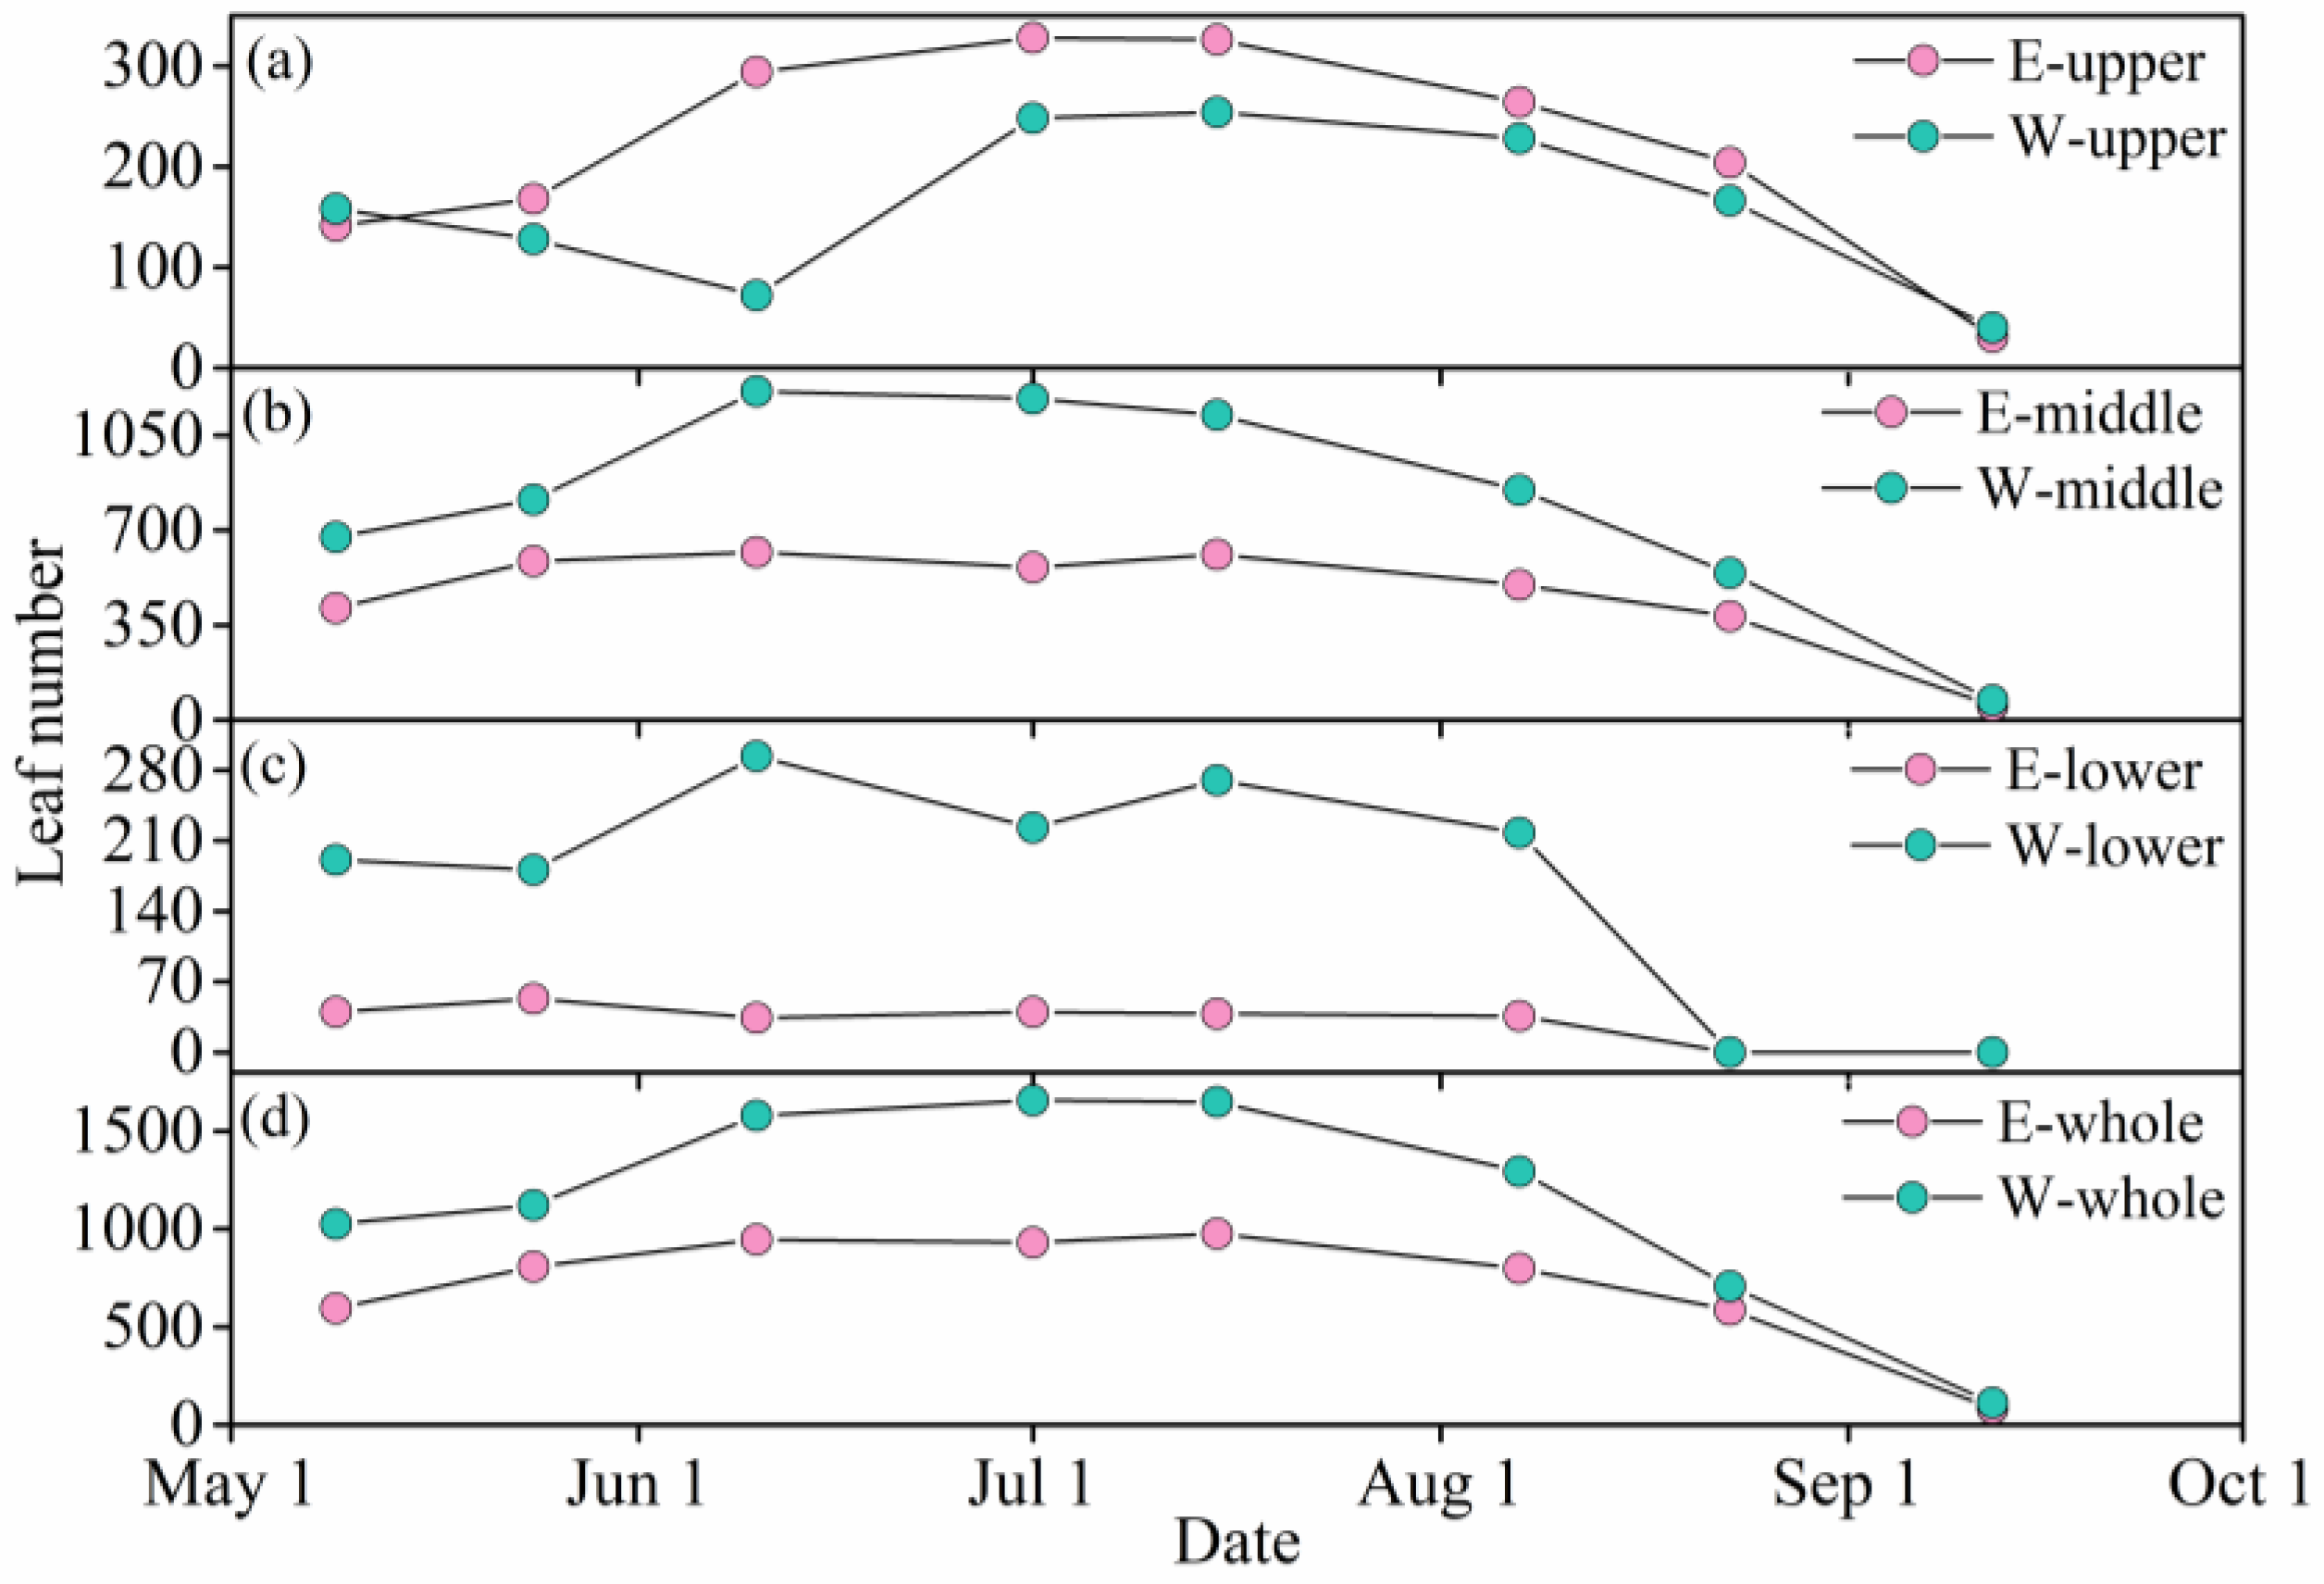
As illustrated in Figure 7, in both the lower (0–3 m branch height) and middle (3–6 m) parts of the canopy, the maximum leaf number of branches in the east-facing sides appeared about half a month earlier than that in the west-facing sides. In contrast, in the upper canopy (>6 m branch height), the leaves on branches on both sides increased to their maximum at the same time (early July). Overall, as to the whole canopy, the time when leaves on the branches increased to the maximum number was about twenty days earlier on the east-facing side.

3.6. Leaf Area Dynamics and Vertical Distribution

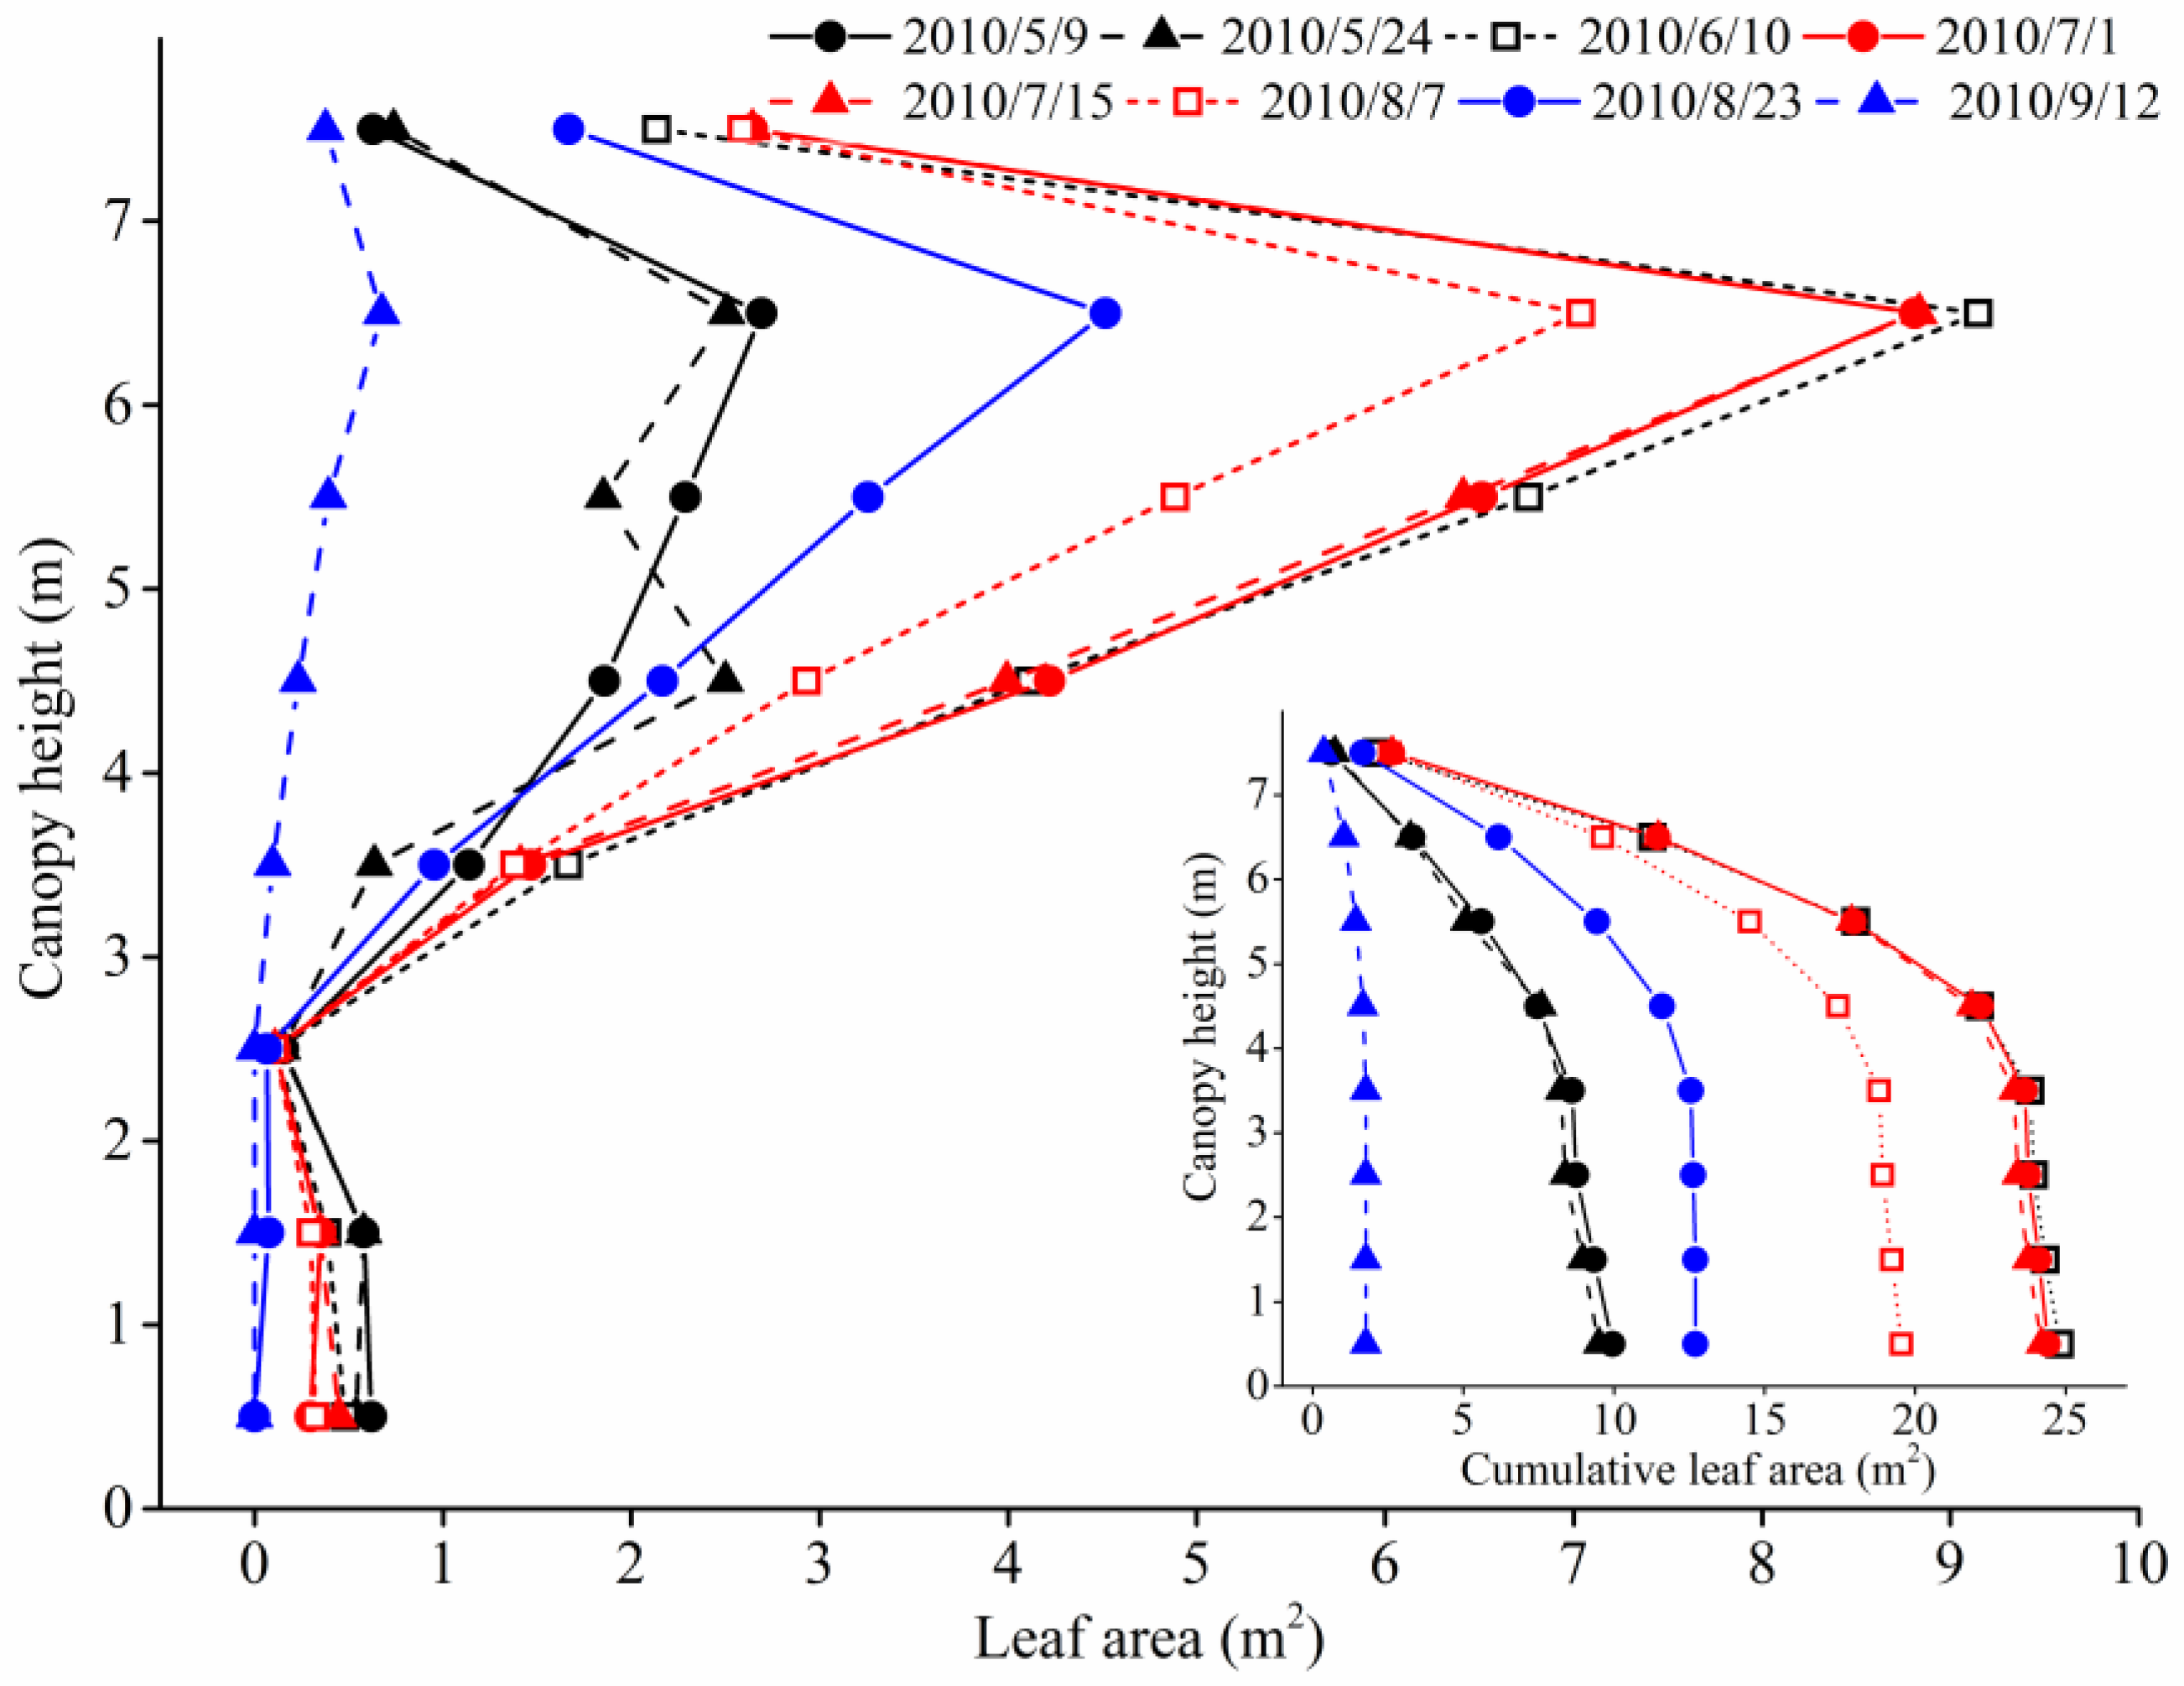
During the growing season, the LA variation amplitude in the 0–3 m canopy height was very small, but increased markedly with height above 3 m until reaching the canopy top, where it decreased greatly (Figure 8). In canopy above the 3 m height, the LA varied relatively little between 9–24 May, but from 24 May to 10 June it increased sharply by 64% to 265% in the different canopy layers. Then during the following one month (10 June–15 July), the LA in the different layers varied little and kept their highest levels for the growing season. After about 15 July, the LA in almost all layers started to decrease rapidly until the growing season ended.
In the lower part of the canopy (0–3 m canopy height), average LAs were similar in the different layers and were much lower than that in the other canopy layers. Above 3 m canopy height, the LA increased greatly and almost linearly with height. However, at the canopy top above 7 m height, the LA decreased sharply to a level similar to that in the middle canopy layer (Figure 8).
The seasonally averaged total LA of the sample tree was 15.86 m2 (1.77–24.80 m2). Among different canopy layers, the LA within 6–7 m canopy height was the highest, accounting for one third (35%) of the total tree’s LA. In addition, on average, 88% (75%–95%) of the total LA of the sample tree was allocated to its upper canopy sections (>4 m canopy height) (Figure 8).

3.7. Leaf Physiological Parameter Variation within the Canopy

On a typically sunny day on 21 July, when total leaf number and area were still at relatively high levels (Figure 5 and Figure 8), Gs, Tr and Qn in both the lower and middle parts of the canopy exhibited a unimodal diurnal variation, with their peak values appeared between 12:00 and 14:00 (Figure 9). As for the upper canopy, both Gs and Qn showed bimodal variations, with their peak values occurring at both 10:00 and 14:00, but Tr only increased to its maximum at 14:00. Overall, with increasing canopy height, Gs, Tr and Qn increased markedly, especially between 10:00–15:30. Daily average values of Gs and Tr in the upper canopy were 0.52 cm s−1 and 7.63 μg cm−2 s−1, respectively, which were 17% and 87% (Gs), and 16% and 83% (Tr) higher than that in the middle and lower canopies, respectively.

3.8. Response of Transpiration to Leaf Areas in Different Canopy Layers

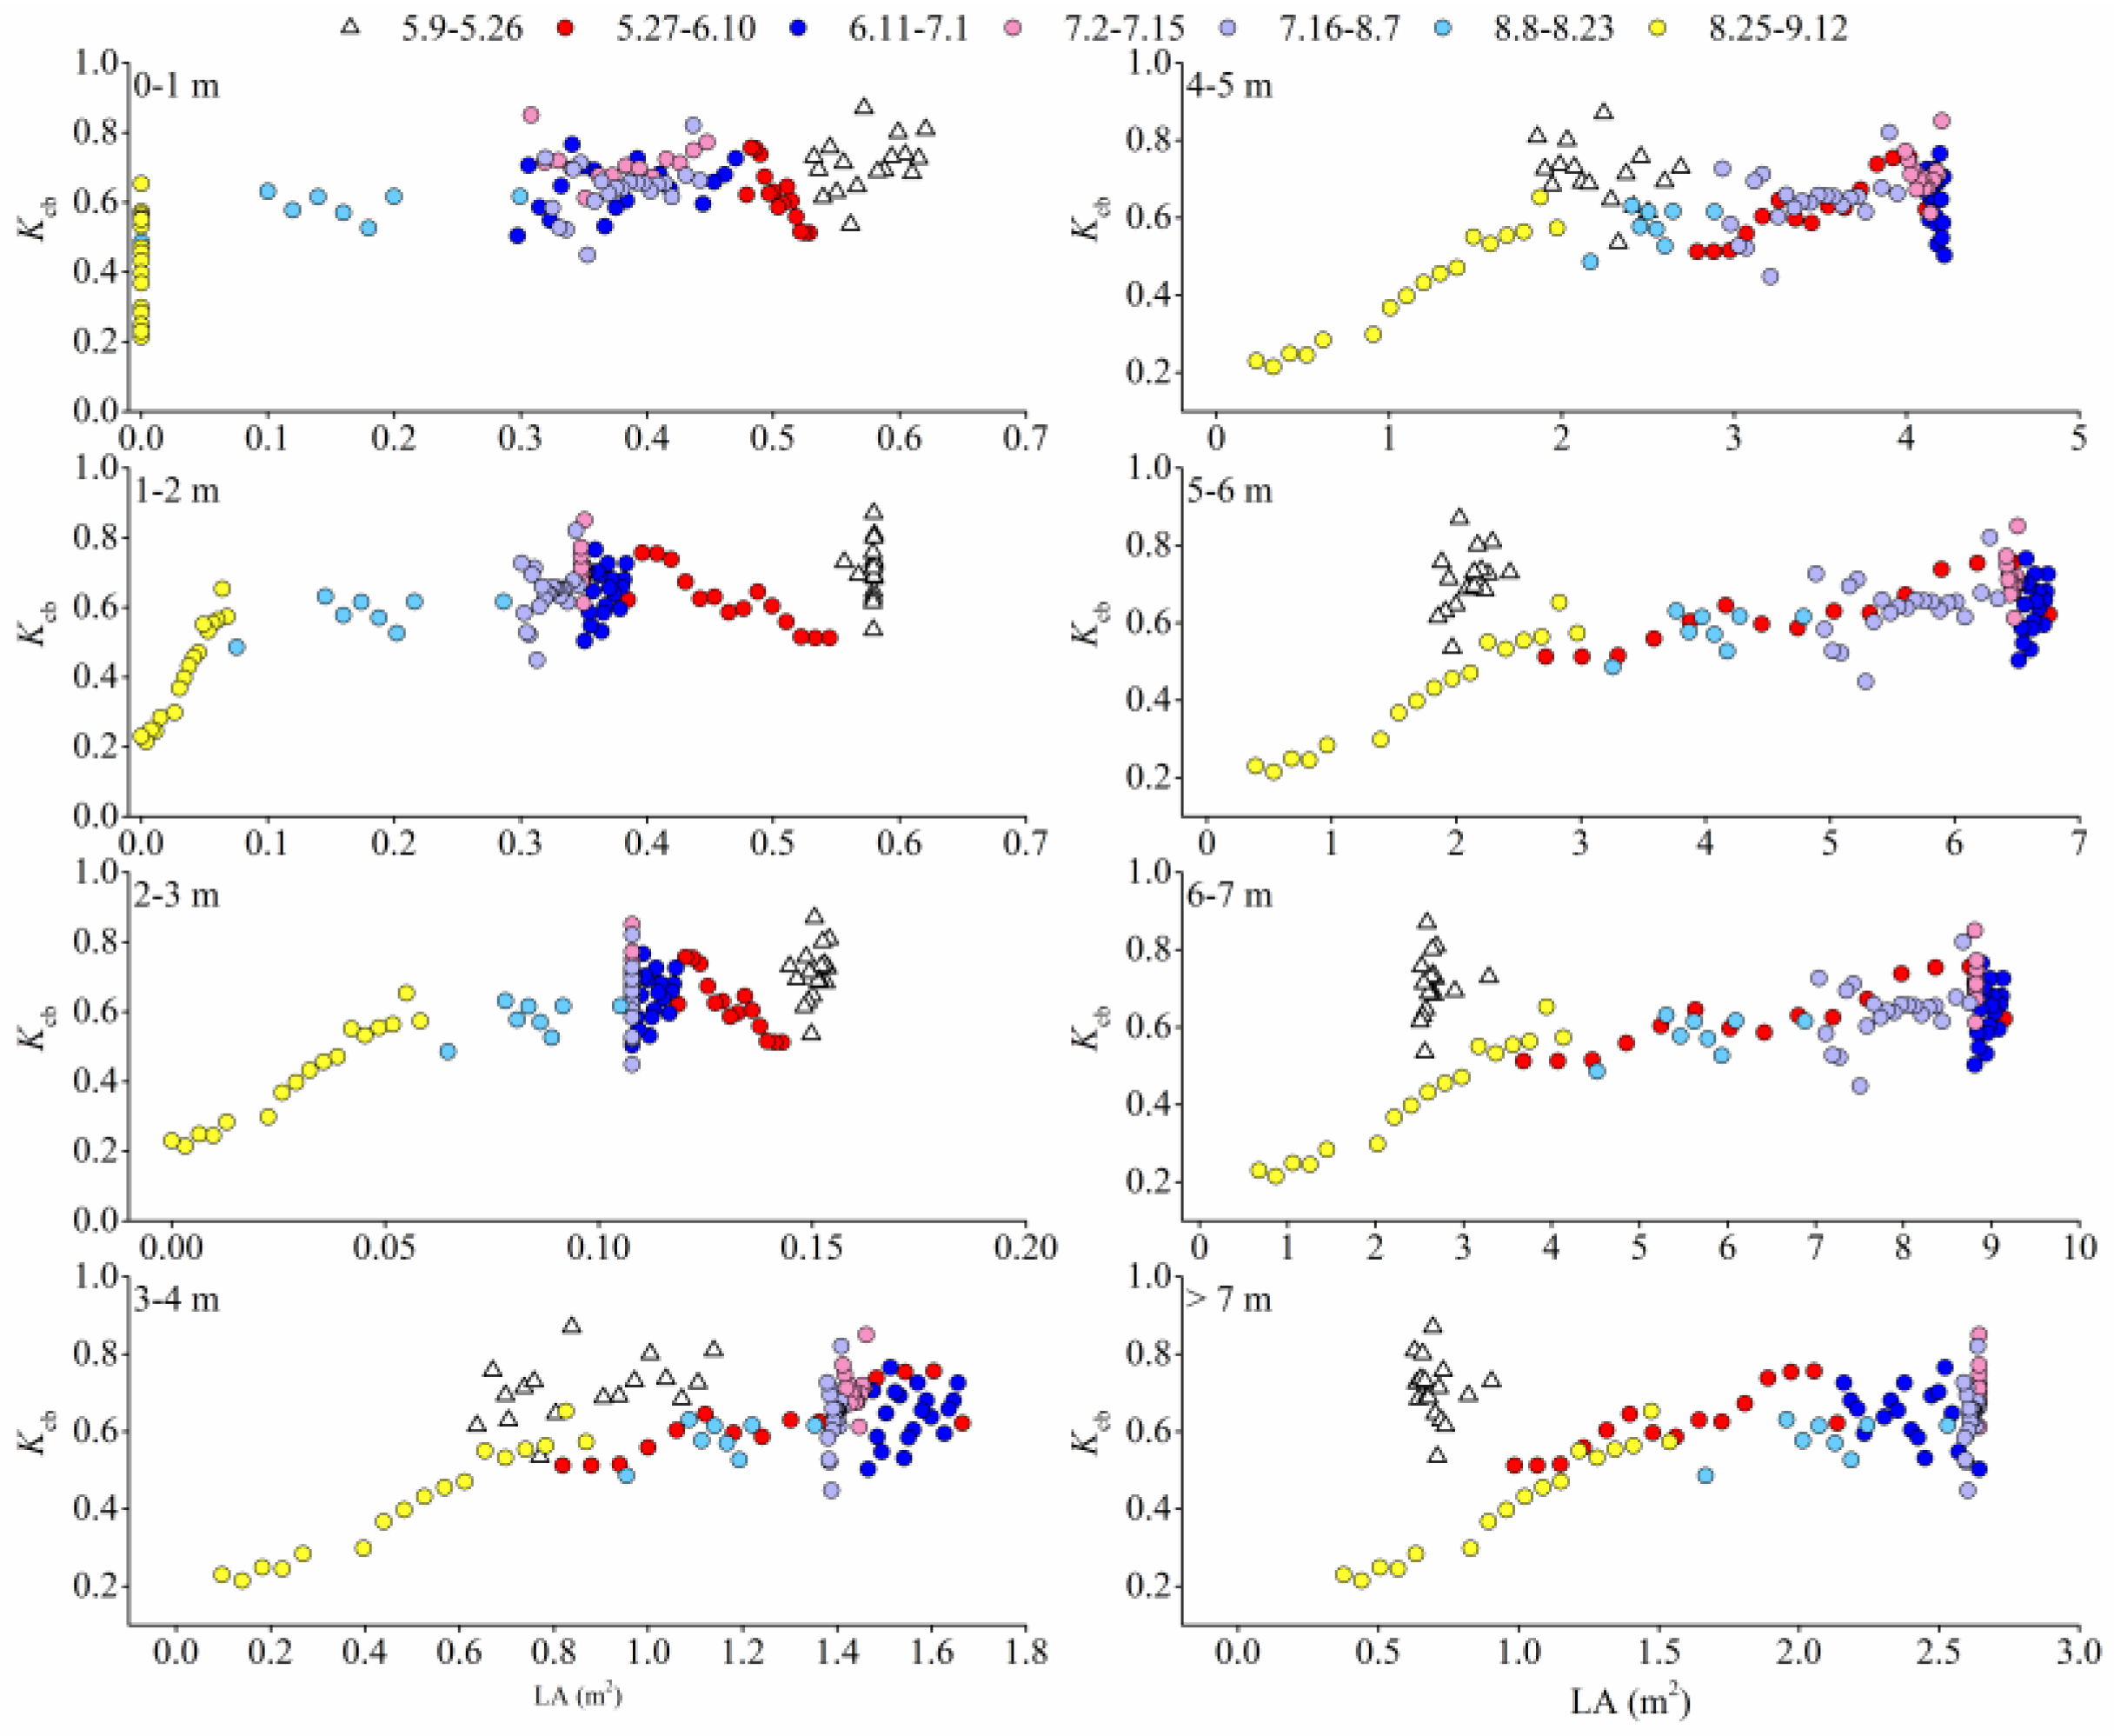
As shown in Figure 10, between 9–26 May, the Kcb of the sample tree reached its highest seasonal level with a mean of 0.71. Within this period, the LA in the 0–3 m canopy layer also reached its maximum, but in the layers above 3 m canopy height the LAs were still very low relative to their corresponding maximum values. Linear regression analysis showed non-significant correlated relationships existed between Kcb and the LAs in all canopy layers (p > 0.05) in this period.
From 27 May to 23 August, Kcb increased linearly (p < 0.001) with LA in canopy layers above 3 m height, although the increment was slight. Whereas, variation of LA in the 0–3 m canopy layer showed a non-significant correlation with that of Kcb (p > 0.05). In addition, the proportion of the Kcb variation during this period explained by LA was the highest in the 5–7 m canopy layers (R2 = 0.300), which was followed in sequence by the 4–5 (R2 = 0.257), 3–4 (R2 = 0.235) and > 7 m (R2 = 0.139) canopy layers. After late August, the Kcb and LA in all canopy layers (except the 0–1 m layer) decreased rapidly, and significant linear relationships were detected between them (p < 0.001).

4. Discussion

4.1. Leaf Phenology Variation within the Canopy

To fully utilize the light resources so as to maximize growth within the growing season, plants usually develop different leaf phenological patterns within the canopy [9,11,16,17,20]. This phenomenon was well demonstrated in our study by laboriously counting manually all the leaves of a mature P. tomentosa tree through the growing season. It was found that, except branches at the canopy top (>7 m branch height), the maximum leaf number tended to be reached later on branches attached to higher stems (Figure 4). A similar trend was more apparently reflected in the variation of leaf number at different canopy layers with canopy height, and the maximum leaf number in the top layer of canopy occurred last (Figure 5). This phenological asynchrony within the canopy indicates that P. tomentosa has adopted a “temporal ecological strategy” for efficient light acquisition [7]. That is to say, earlier development and maturation of lower leaves allowed the lower canopy of P. tomentosa to fully intercept and utilize the higher irradiance in spring (Figure 3). However, it seems that P. tomentosa did not rely on its lower leaves to utilize the markedly increased irradiance in the lower canopy in autumn (Figure 3), as the time when all leaves had fallen off was earlier in the lower canopy. Similar leaf phenology variation within the canopy was also observed on many other tree species, such as Lyonia ovalifolia [11] and Acer saccharum Marshall [17] in temperate forests.
Although many researchers have investigated the leaf phenology variation with canopy height [9,12,16,17,18,20], little attention has been paid to the variability in leaf phenology at different azimuths within different canopy layers. Previous studies showed that leaf phenology can be influenced by many abiotic and biotic factors, such as light, air temperature and humidity, wind speed, leaf water status, and ontogeny [8,16,31,32,33]. However, as to the leaf phenology variation within the canopy, the light environment and leaf water status have been recognized as the two most critical determinants [16,31]. In our plantation, due to the non-uniform characteristics of tree planting (Figure 1), there were great differences in the growing spaces of canopies at different azimuths, which could subsequently result in azimuthal variation in the light environment within the canopy. This might contribute to the earlier achievement of maximum leaf number in the east-facing sides (narrow row zone) of both the lower and middle canopies, relative to that in the west-facing sides (wide row zone) (Figure 7). As leaf water potential might have varied relatively little within the same canopy layer in a dense plantation, leaf water status difference might not be the reason for this phenomenon. On the contrary, maximum leaf number in both the east- and west-facing sides occurred simultaneously in the upper canopy (>6 m branch height) (Figure 7). This might be due to the relatively small difference in the irradiation among different azimuthal sides due to all sides were directly exposed to sunlight. Our observed phenomenon implies that the “temporal ecological strategy” also seems to be adopted by leaves in different azimuths of the same canopy layer for efficient light acquisition. In addition, the coexistence of leaf phenology synchronization, and asynchronization in different azimuthal sides within the canopy indicates that it will be biased to reveal the leaf phenology of a tree species growing under non-uniform planting scheme by just observing leaf development in a specific part of the canopy.
The present research is the first study to investigate thoroughly and precisely the leaf phenological variation of P. tomentosa within the canopy. Due to the great difficulty in observing leaf dynamics of big trees in a dense plantation, only one sample tree with average size was selected in this study. Thus, the leaf phenology observed on this single sample tree may not be completely applicable to other P. tomentosa trees. Nonetheless, we think our results are very important and valuable since, to our knowledge, no such attempts have been conducted to observe the dynamics of all leaves of a single big tree in the field. Although the data before early May were absent, our results indicated that the net leaf number variation rate of mature P. tomentosa exhibited a unimodal seasonal pattern with the peak occurring between late May and early June. This was different from the bimodal seasonal variation pattern, with peaks occurred in May and July, in tree diameter in the same plantation [5]. The main leaf production period of mature P. tomentosa under plantation conditions was before mid-June and its main leaf drop was initiated at about mid-July, which was roughly consistent with the leaf area index dynamics in the present plantation [15]. This information will be useful for the cultivation of P. tomentosa plantations across similar sites to ours and for the understanding of its ecophysiological activities.

4.2. Leaf Area Vertical Distribution and Its Relationship with Canopy Light Interception

The LA in different canopy layers of the sample tree, and its variation, were strongly influenced by height. In the lower canopy parts (0–3 m canopy height), the LA in different layers was similar and varied relatively little. Whereas, above the 3 m canopy height, both the LA and its variation amplitude increased markedly with height, but decreased abruptly at the top of the canopy. This kind of vertical profile in LA might be determined by the decreasing light availability from canopy top to bottom (Figure 9), as the average widths of most canopy layers were similar (2–3 m) and showed no distinct variation trend with height (data not shown). This vertical LA distribution pattern can also help to explain the phenomenon of decreasing leaf water status with increasing canopy height, which had been observed in the present plantation by [34], and in other forests [10,17,35]. This is because the amount of water transferred by sapwood would be shared by more leaves in the higher canopy layers.
There was an evident seasonality in the canopy light interception of the sample tree, reflected by Rn-u/Rn-a (Figure 3). This might be mainly controlled by the leaf development in the upper canopy because of its greater variability in the growing season (Figure 5 and Figure 8). Thus, from about mid-June to mid-August, when LA in the upper canopy had reached its seasonal highest level, the amount of light intercepted by canopy also increased to its seasonal maximum. This subsequently resulted in Rn-u decreasing to its annual lowest level. Overall, the average Ra and Rn-a were higher in spring than in autumn, but Rn-u in these two seasons kept within similar ranges, which could be mainly due to the higher canopy light interception ratio in spring (Figure 3). This information on the seasonal Rn-u and Rn-a variation will help to understand and predict the seasonal dynamics of evapotranspiration and its components in dense plantations like ours [13,15].
Overall, relative to the situation in summer, both the LA of the sample tree and its vertical gradient within the canopy were lower in spring and autumn (Figure 8). According to the Lambert-Beer law, this might result in a smaller gradient in light availability from the canopy top to the bottom and higher light availability in lower canopy in spring and autumn. This was also reflected by the higher Rn-u in these two seasons (Figure 3). As leaf transpiration rate and stomatal conductance were usually positively correlated with the surrounding light availability [10,11,36], the difference in leaf transpiration rates between the lower and upper canopies of trees in the present plantation might be smaller in spring and autumn. This speculated phenomenon has also been observed, or reflected in the data in other studies [11,36]. Consequently, due to the seasonal variations of both the leaf transpiration rate and the LA along the canopy profile, the contribution of leaves in the lower canopy to the whole-tree transpiration might be higher in spring and autumn but lower in summer.

4.3. The Relationship between Transpiration and Leaf Area

To detect precisely the relationship between tree transpiration and leaf area, it is essential to eliminate the effects of soil water availability and other environmental factors [13,15]. These requirements were achieved in this study by guaranteeing the high rθ in the rootzone around the sample tree (Figure 2) and by dividing its transpiration rate by the reference evapotranspiration to obtain Kcb of the sample tree [29].
The Kcb is a critical parameter for predicting plant water use on different scales and can provide insight into plant water relations in different environments [29]. Thus, in order to obtain precise information on the seasonal Kcb variation, many studies have related Kcb to some easily measured plant development variables, such as leaf area, leaf area index, or canopy cover [13,25,37]. Some researchers found that the relationship between Kcb and plant variables was linear [13,37], while others, and our previous study in the same plantation, found it was nonlinear. The Kcb tended to plateau as plant variables increased above a critical value [13,15,25,38,39]. These contrasting conclusions were mainly obtained at the stand scale and based on the development variables of the whole canopies of plant individuals or populations. Whereas, in the present study, it was directly demonstrated that, on a single tree scale in a dense plantation, the Kcb increased nonlinearly with increasing leaf areas of not only the whole tree (data not shown), but also different canopy layers.
In our previous study [15], the phenomenon that Kcb of P. tomentosa plantation tended to plateau as the stand LAI increased above a threshold value was attributed to the fact that the stand sun-exposed LA in the upper canopy, which determines the plant water consumption [37], reached its maximum when the stand LAI was still small. However, based on the results of this study, it is more plausible to attribute that phenomenon to the seasonal variation in the vertical distribution of both the LA, and the sun-exposed LA within the canopy. In spring, as the total stand LA [15] and canopy light interception were small (Figure 3), a large portion of leaves from upper canopy to the bottom could be exposed directly to sunlight. That is, sun-exposed leaves were distributed throughout the whole canopy profile. This, combined with the high irradiation, high wind speed and low relative humidity [15] might result in the Kcb increasing to its annual maximum level in late spring (May) (Figure 10), even though average tree LA was still relatively small at this time (Figure 8). After late May, both the stand LA (especially the LA of the upper canopy) and canopy light interception increased markedly while light in the lower canopy decreased greatly, which could subsequently lead to that sun-exposed leaves were mainly distributed on canopy top. As the LA of trees and its vertical distribution pattern changed little from June to late August, the sun-exposed LA, and dependent Kcb, exhibited only a small variation during this period (Figure 10). Consequently, as for the whole growing season, the stand [15] and single tree (Figure 10) Kcb varied relatively little with the LA after they both achieved their seasonal highest levels in late May or early June.

4.4. Contribution of Leaves in Different Canopy Layers to Tree Transpiration

Across different periods during the growing season, the relationships between Kcb of the sample tree and LA of its different canopy layers changed greatly (Figure 10). This implies that the relative contributions of leaves in different canopy layers to the whole tree transpiration varied through the growing season. In May, the seasonal maximum levels of Kcb and LA in the 0–3 m canopy layer occurred concurrently, while the LA in the upper layers stayed at relatively low levels (Figure 8 and Figure 10), which strongly supports our speculation that the leaves in the lower canopy contributed greatly to the whole tree transpiration in spring. From June to late August, the non-significant correlation between LA and Kcb indicated that the leaves in the bottom 3 m canopy layer only made a small contribution to tree water use. On the contrary, the leaves in layers above the 3 m canopy height exhibited an obvious contribution to the transpiration of the tree during this period, which was reflected by their significantly linear correlations (p < 0.001). In addition, according to the amount of variation in the Kcb explained by the LA in different layers above 3 m, the leaves distributed within 5–7 m canopy height exerted the greatest control on the tree water use, which could be due to the coupling effects of both larger LA and higher leaf transpiration rates and stomatal conductances (Figure 9). After late August, due to the distinctly decreasing canopy light interception and the upper canopy LA (Figure 3 and Figure 8), a large number of leaves in the lower canopy were directly exposed to sunlight, resulting in sun-exposed leaves that were distributed throughout the whole canopy profile again. Therefore, in this period, the leaves in all the canopy layers (except the bottom 1 m layer where all leaves had fallen off) showed a significant linear correlation with Kcb (p < 0.001). That is, all of them contributed to transpiration.
Consequently, it can be deduced that the stand transpiration in a dense plantation may be mainly controlled by the total area and spatial distribution of the sun-exposed leaves within the canopy, and all the different canopy layers will exhibit different controls on the stand water relations at different periods. This information will provide a theoretical basis for further optimizing stand water-use prediction models for plantations of poplars, and other tree species, and it will also facilitate our understanding of plant water relations in plantations.

5. Conclusions

In a dense P. tomentosa plantation with an alternate narrow- and wide-row spacing planting scheme, the leaf phenological variation within the canopy of one mature tree was thoroughly investigated by manually counting all leaves throughout the growing season, and its relationship with the tree transpiration was analyzed. Our results demonstrated that maximum leaf number on branches tended to occur later with increasing canopy height. In both the lower and middle canopies, the achievement of the maximum leaf number was earlier on the east-facing sides (narrow row zone) than in the west-facing sides (wide row zone). However, this leaf phenology asynchronization disappeared at the top of the canopy. These phenomena indicate that a “temporal ecological strategy” was being adopted by leaves in different canopy layers and at different azimuths of the same layer, to ensure for effective light acquisition.
The distinct seasonality of the canopy light interception of the tree was mainly controlled by the leaf development in the upper canopy. The seasonal variation in the vertical distribution of both the LA and the sun-exposed LA within the canopy seems to determine the Kcb dynamics of individual tree and the stand. In addition, the contribution of leaves in different canopy layers to whole tree’s transpiration might change during the growing season, with the leaves in the upper canopy, and in all canopy layers, roughly exerting the main controls on tree water use in summer, and in spring and autumn, respectively.

Supplementary Materials

The following are available online at https://www.mdpi.com/1999-4907/9/10/603/s1, Figure S1: The steel scaffold established around the sample tree for counting leaf number, sampling leaves, and measuring leaf physiological traits, Figure S2: Distribution of first-order branches of the sample tree in different azimuthal directions. Number unit in the figure represents the number of branches.

Author Contributions

Y.W., G.L. and B.X. completed the experiments and wrote the manuscript. B.X., L.J. and F.M. designed the experiments. Y.W., N.D., J.D. and D.L. performed the data analysis. B.C. and L.J. contributed to the discussion, analysis and revision of the manuscript.

Funding

This research was jointly funded by The National Natural Science Foundation of China [31800531, 31670625, 31872702] the National Key Research and Development Program of China [2016YFD0600403], and the Key Technologies R&D Program of China [2015BAD09B02].

Acknowledgments

The authors are grateful to all of the reviewers and editors for reading the manuscript and providing very useful comments.

Conflicts of Interest

The authors declare that they have no conflict of interest.

References

  1. SFA. Report of Forest Resources in China (2009–2013); China Forestry Press: Beijing, China, 2014. (In Chinese) [Google Scholar]
  2. Zheng, S.K. High Yield Cultivation of Poplar; Golden Shield Press: Beijing, China, 2006. (In Chinese) [Google Scholar]
  3. Fang, S.Z. Silviculture of poplar plantation in China: A review. Chin. J. Appl. Ecol. 2008, 19, 2308–2316, (In Chinese with English abstract). [Google Scholar]
  4. Liu, S.R.; Yang, Y.J.; Wang, H. Development strategy and management countermeasures of planted forests in China: Transforming from timber-centered single objective management towards multi-purpose management for enhancing quality and benefits of ecosystem services. Acta Ecol. Sin. 2018, 38, 1–10, (In Chinese with English abstract). [Google Scholar]
  5. Xi, B.Y.; Li, G.D.; Bloomberg, M.; Jia, L.M. The effects of subsurface irrigation at different soil water potential thresholds on the growth and transpiration of Populus tomentosa in the North China Plain. Aust. For. 2014, 77, 159–167. [Google Scholar] [CrossRef]
  6. Wang, Y. Research on Effects of Nitrogen Fertigation on Tree-Growth and Its Mechanisms of Action in Populus tomentosa Plantation. Ph.D. Thesis, Beijing Forestry University, Beijing, China, 2015. (In Chinese with English abstract). [Google Scholar]
  7. Kikuzawa, K. Leaf phenology as an optimal strategy for carbon gain in plants. Can. J. Bot. 1995, 73, 158–163. [Google Scholar] [CrossRef]
  8. Koike, T.; Kitao, M.; Maruyama, Y.; Mori, S.; Lei, T.T. Leaf morphology and photosynthetic adjustments among deciduous broad-leaved trees within the vertical canopy profile. Tree Physiol. 2001, 21, 951–958. [Google Scholar] [CrossRef] [PubMed] [Green Version]
  9. Osada, N.; Takeda, H.; Okuda, T.; Awang, M. Within-crown variation in the timing of leaf emergence and fall of Malaysian trees in association with crown development patterns. Am. J. Bot. 2005, 92, 1210–1214. [Google Scholar] [CrossRef] [PubMed] [Green Version]
  10. Kim, H.S.; Oren, R.; Hinckley, T.M. Actual and potential transpiration and carbon assimilation in an irrigated poplar plantation. Tree Physiol. 2008, 28, 559–577. [Google Scholar] [CrossRef] [PubMed] [Green Version]
  11. Yoshimura, L. Influences of phenological differences on leaf-level carbon budget between the upper and lower crown of Lyonia ovalifolia. Botany 2013, 91, 25–33. [Google Scholar] [CrossRef]
  12. Osada, O.; Takeda, H.; Furukawa, A.; Awang, M. Leaf dynamics and maintenance of tree crowns in a Malaysian rain forest stand. J. Ecol. 2001, 89, 774–782. [Google Scholar] [CrossRef] [Green Version]
  13. Gong, D.Z.; Kang, S.Z.; Yao, L.M.; Zhang, L. Estimation of evapotranspiration and its components from an apple orchard in northwest China using sap flow and water balance methods. Hydrol. Process 2007, 21, 931–938. [Google Scholar] [CrossRef]
  14. Tie, Q.; Hu, H.C.; Tian, F.Q.; Guan, H.D.; Lin, H. Environmental and physiological controls on sap flow in a subhumid mountainous catchment in North China. Agric. For. Meteorol. 2017, 240, 46–57. [Google Scholar] [CrossRef]
  15. Xi, B.Y.; Di, N.; Wang, Y.; Duan, J.; Jia, L.M. Modeling stand water use response to soil water availability and groundwater level for a mature Populus tomentosa plantation located on the North China Plain. For. Ecol. Manag. 2017, 391, 63–74. [Google Scholar] [CrossRef]
  16. Gressler, E.; Jochner, S.; Capdevielle-Vargas, R.M.; Morellato, L.P.C.; Menzel, A. Vertical variation in autumn leaf phenology of Fagus sylvatica L. in southern Germany. Agric. For. Meteorol. 2015, 201, 176–186. [Google Scholar] [CrossRef]
  17. Coble, A.P.; VanderWall, B.; Mau, A.; Cavaleri, M.A. How vertical patterns in leaf traits shift seasonally and the implications for modeling canopy photosynthesis in a temperate deciduous forest. Tree Physiol. 2016, 36, 1077–1091. [Google Scholar] [CrossRef] [PubMed]
  18. Oláh, V.; Szőllősi, E.; Lakatos, Á.; Kanalas, P.; Nyitrai, B.; Mészáros, I. Springtime leaf development of mature sessile oak trees as based on multi-seasonal monitoring data. Acta Silv. Lignaria Hung. 2012, 8, 21–30. [Google Scholar]
  19. Niinemets, Ü.; Keenan, T.F.; Hallik, L. A worldwide analysis of within-canopy variations in leaf structural, chemical and physiological traits across plant functional types. New Phytol. 2015, 205, 973–993. [Google Scholar] [CrossRef] [PubMed]
  20. Zheng, Y.Q.; Feng, M.; Li, Z.J. Investigation of bud burst, shoot growth and leaf expansion in Populus euphratica of different ages. Acta Ecol. Sin. 2015, 35, 1198–1207, (In Chinese with English abstract). [Google Scholar]
  21. Al Yamani, W.; Green, S.; Pangilinan, R.; Dixon, S.; Shahid, S.A.; Kemp, P.; Clothier, B. Water use of Al Ghaf (Prosopis cineraria) and Al Sidr (Ziziphus spina-christi) forests irrigated with saline groundwater in the hyper-arid deserts of Abu Dhabi. Agric. Water Manag. 2018, 203, 105–114. [Google Scholar] [CrossRef]
  22. Watt, M.S.; Whitehead, D.; Richardson, B.; Mason, E.G.; Leckie, A.C. Modelling the influence of weed competition on the growth of young Pinus radiate at a dry land site. For. Ecol. Manag. 2003, 178, 271–286. [Google Scholar] [CrossRef]
  23. Xi, B.Y.; Bloomberg, M.; Watt, M.S.; Wang, Y.; Jia, L.M. Modeling growth response to soil water availability simulated by HYDRUS for a mature triploid Populus tomentosa plantation located on the North China Plain. Agric. Water Manag. 2016, 176, 243–254. [Google Scholar] [CrossRef]
  24. Du, S.Q.; Kang, S.Z.; Li, F.S.; Du, T.S. Water use efficiency is improved by alternate partial root-zone irrigation of apple in arid northwest China. Agric. Water Manag. 2017, 179, 184–192. [Google Scholar] [CrossRef]
  25. Wei, Z.W.; Yoshimura, K.; Wang, L.X.; Miralles, D.G.; Jasechko, S.; Lee, X.H. Revisiting the contribution of transpiration to global terrestrial evapotranspiration. Geophys. Res. Lett. 2017, 44, 2792–2801. [Google Scholar] [CrossRef]
  26. Zhang, P.D.; Wu, F.; Kang, X.Y. Genotypic variation in wood properties and growth traits of triploid hybrid clones of Populus tomentosa at three clonal traits. Tree Genet. Genomes 2012, 8, 1041–1050. [Google Scholar] [CrossRef]
  27. Zhu, Z.T.; Lin, H.B.; Kang, X.Y. Studies on allotriploid breeding of Populus tomentosa B301 clones. Sci. Silvae Sin. 1995, 31, 499–505, (In Chinese with English abstract). [Google Scholar]
  28. Granier, A. Evaluation of transpiration in a Douglas-fir stand by means of sap flow measurements. Tree Physiol. 1987, 3, 309–320. [Google Scholar] [CrossRef] [PubMed] [Green Version]
  29. Allen, R.; Pereira, L.S.; Raes, D.; Smith, M. Crop Evapotranspiration: Guidelines for Computing Crop Requirements; FAO Irrigation and Drainage Paper No. 56; FAO: Rome, Italy, 1998. [Google Scholar]
  30. Hillel, D. Introduction to Environmental Soil Physics; Elsevier Academic Press: San Diego, CA, USA, 2004. [Google Scholar]
  31. Zhang, Y.X.; Equiza, M.A.; Zheng, Q.S.; Tyree, M.T. Factors controlling plasticity of leaf morphology in Robinia pseudoacacia L. II: The impact of water stress on leaf morphology of seedling grown in a controlled environment chamber. Ann. For. Sci. 2012, 69, 39–47. [Google Scholar] [CrossRef]
  32. Vitasse, Y. Ontogenic changes rather than difference in temperature cause understory trees to leaf out earlier. New Phytol. 2013, 198, 149–155. [Google Scholar] [CrossRef] [PubMed] [Green Version]
  33. Laube, J.; Sparks, T.H.; Estrella, N.; Menzel, A. Does humidity trigger tree phenology? Proposal for an air humidity based framework for bud development in spring. New Phytol. 2014, 202, 350–355. [Google Scholar] [CrossRef] [PubMed] [Green Version]
  34. Fu, F.Z. Studies on Photosynthetic Characteristics and Canopy Management of Triploid Chinese White Poplar Pulpwood. Ph.D. Thesis, Beijing Forestry University, Beijing, China, 2010. (In Chinese with English abstract). [Google Scholar]
  35. Sellin, A.; Kupper, P. Effects of light availability versus hydraulic constraints on stomatal responses within a crown of silver birch. Oecologia 2005, 142, 388–397. [Google Scholar] [CrossRef] [PubMed]
  36. Reeves, I.; Emery, R.J.N. Seasonal patterns of cytokinins and microclimate and the mediation of gas exchange among canopy layers of mature Acer saccharum trees. Tree Physiol. 2007, 27, 1635–1645. [Google Scholar] [CrossRef] [PubMed]
  37. Williams, L.E.; Ayars, J.E. Grapevine water use and the crop coefficient are linear functions of the shaded area measured beneath the canopy. Agric. For. Meteorol. 2005, 132, 201–211. [Google Scholar] [CrossRef]
  38. De Medeiros, G.A.; Arruda, F.B.; Sakai, E. Crop coefficient for irrigated beans derived using three reference evaporation methods. Agric. For. Meteorol. 2005, 135, 135–143. [Google Scholar] [CrossRef]
  39. Duchemin, B.; Hadria, R.; Erraki, S.; Boulet, G.; Maisongrande, P.; Chehbouni, A.; Escadafal, R.; Ezzahar, J.; Hoedjes, J.C.B.; Kharrou, M.H.; et al. Monitoring wheat phenology and irrigation in Central Morocco: On the use of relationships between evapotranspiration, crops coefficients, leaf area index and remotely-sensed vegetation indices. Agric. Water Manag. 2006, 79, 1–27. [Google Scholar] [CrossRef]
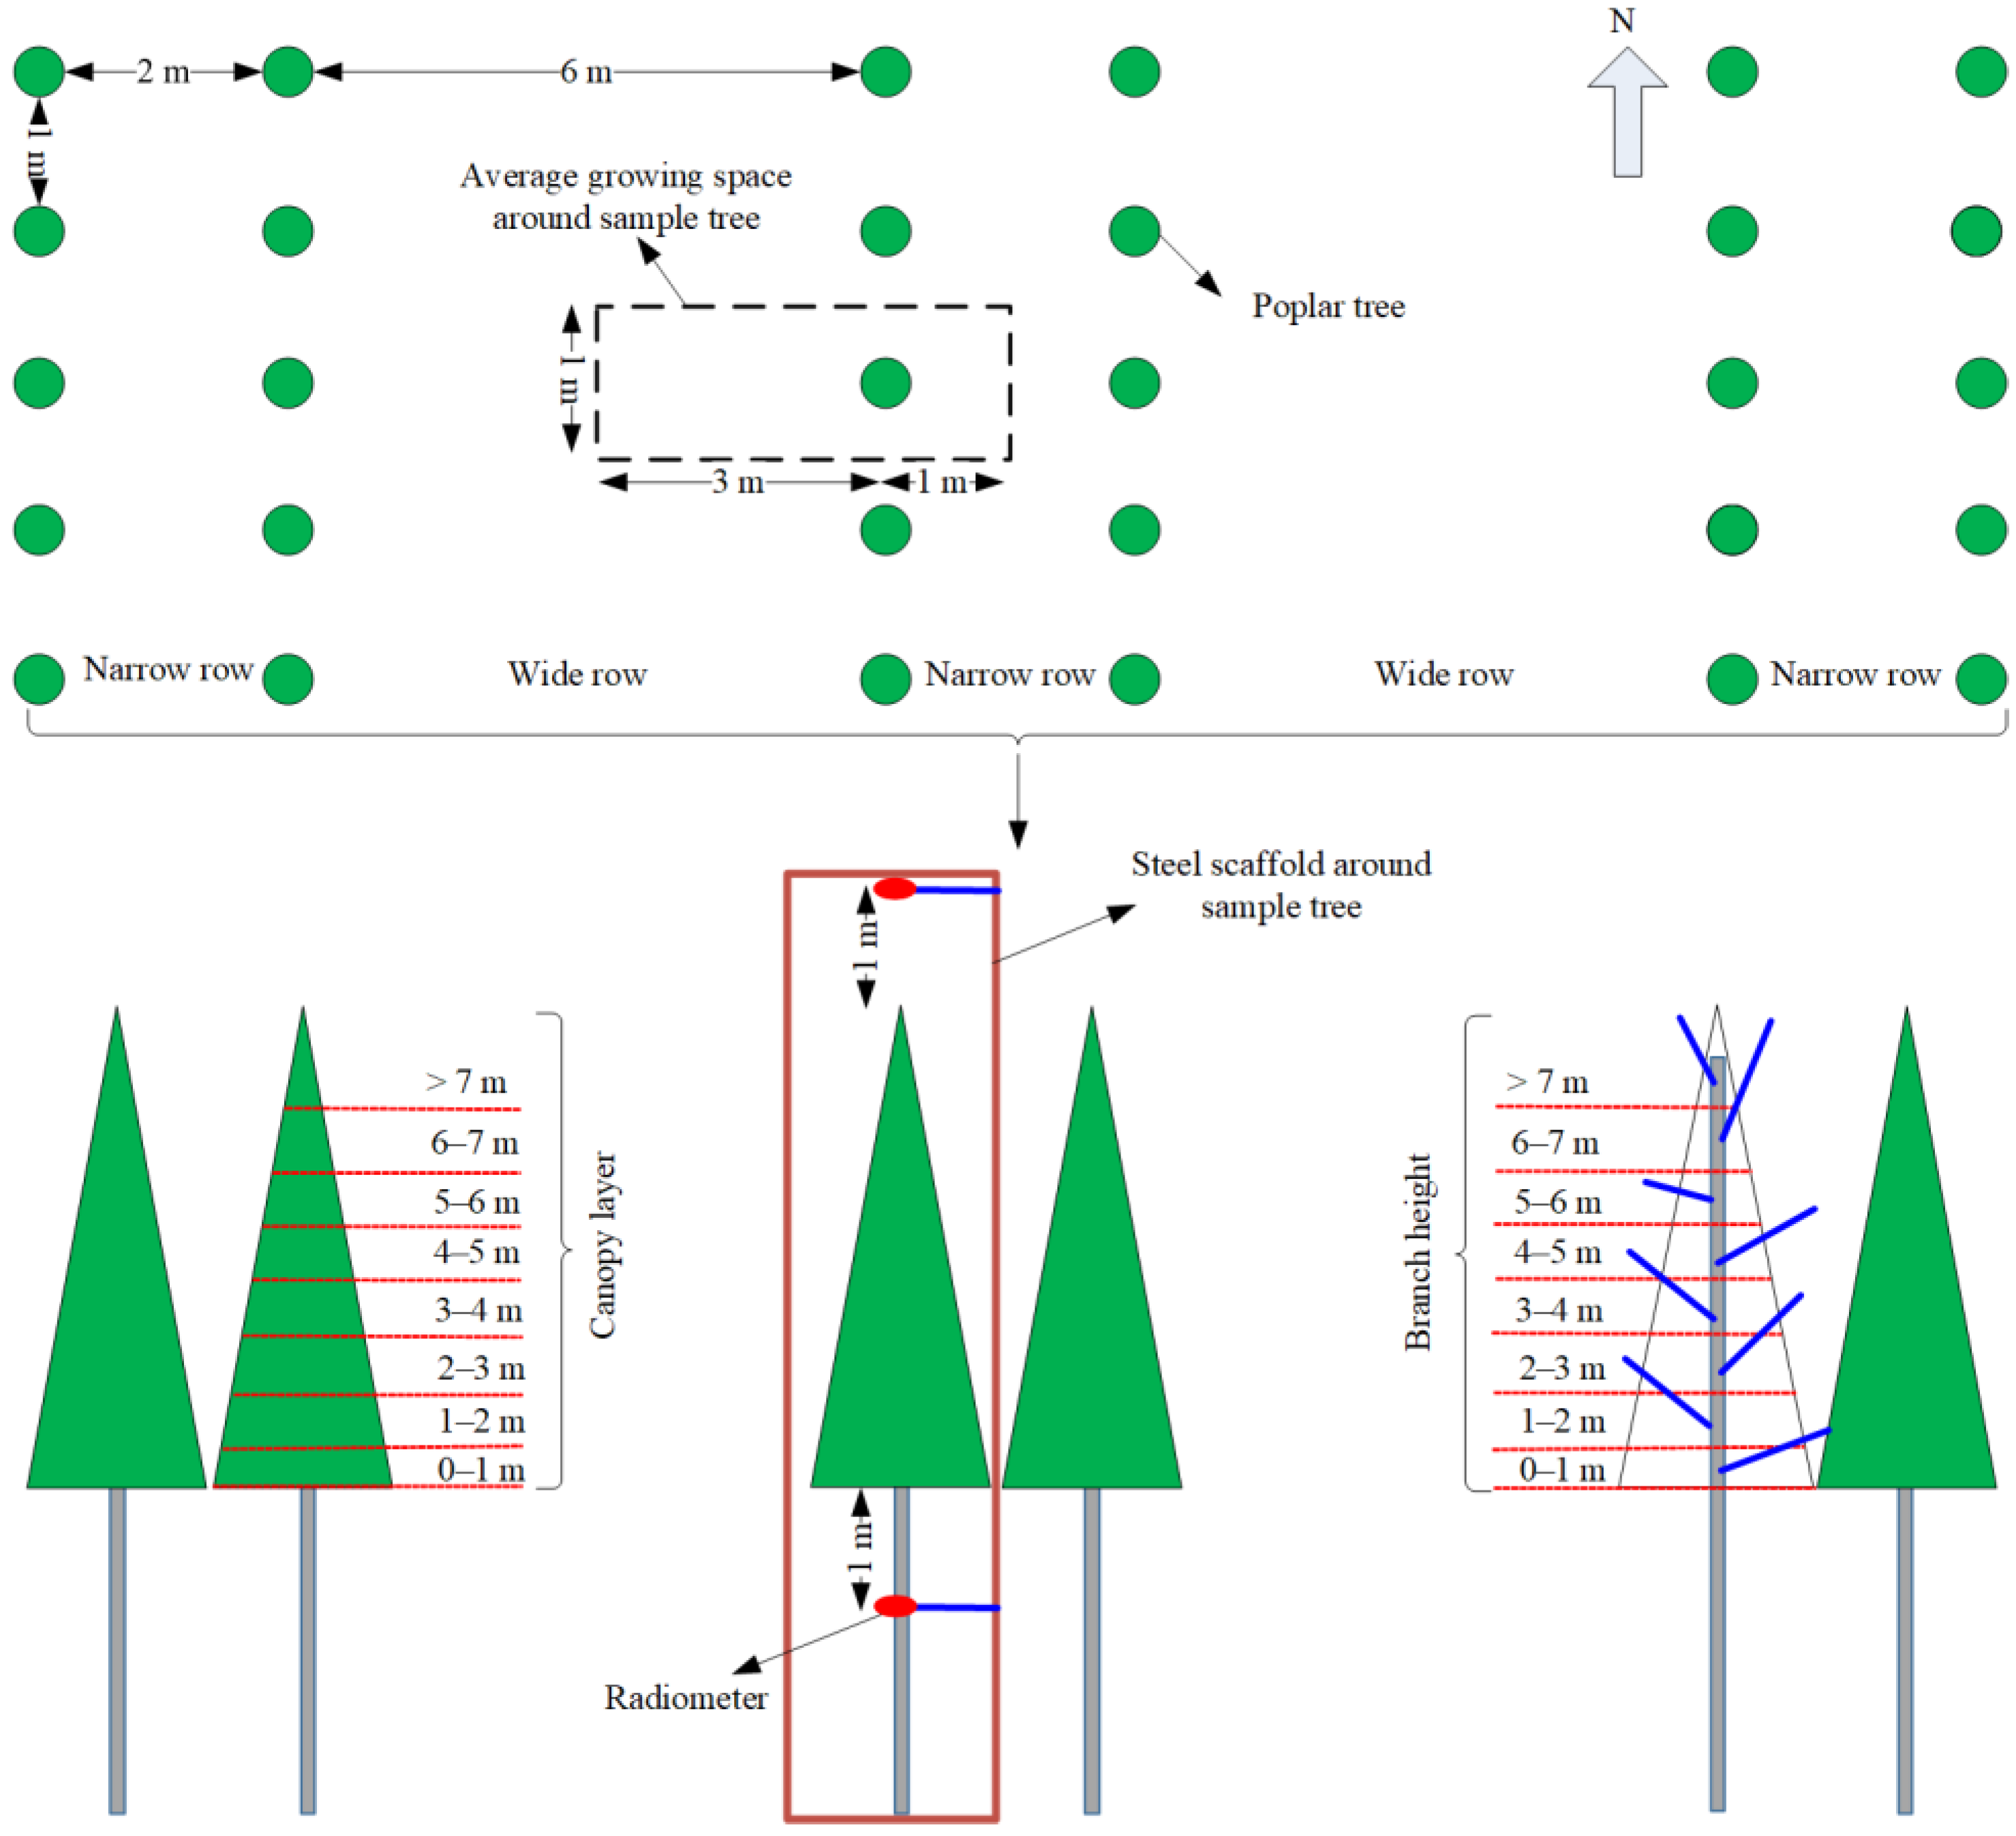
Figure 1. Schematic diagrams of the alternate wide- and narrow-row spacing planting scheme, the relative position of the sample tree, the installation patterns for dome net radiometers above and under the sample tree canopy, and the definitions of canopy layer and branch height used in this study.
Forests 09 00603 g001
Figure 2. Seasonal variation of soil water availability (rθ) at different soil depths within the average growing space of the sample tree.
Forests 09 00603 g002
Figure 3. Seasonal variation of solar radiation (Ra) in the experimental site, net solar radiation above (Rn-a) and under (Rn-u) the sample tree canopy, and the ratio between Rn-u and Rn-a.
Forests 09 00603 g003
Figure 4. Variation of the leaf number on branches from different branch heights (Figure 1) of the sample tree.
Forests 09 00603 g004
Figure 5. Variation of the leaf number in different canopy layers and of the total canopy.
Forests 09 00603 g005
Figure 6. Leaf number decrease, increase and net variation rates of the sample tree in different periods during the growing season in 2010. The date format in different periods is “month.day”.
Forests 09 00603 g006
Figure 7. Variation in leaf number on first-order branches in the east- (narrow row zone) and west-facing (wide row zone) sides of the (a) upper (0–3 m branch height (Figure 1)), (b) middle (3–6 m) and (c) lower canopy parts (>6 m), and of (d) the whole canopy.
Forests 09 00603 g007
Figure 8. Variation of the leaf areas with canopy height of the sample tree at different dates. The inset shows the cumulative leaf areas distribution plotted against the canopy height of the sample tree at different dates. The date format at different times is “year/month/day”.
Forests 09 00603 g008
Figure 9. Diurnal variation of (a) the leaf stomatal conductance (Gs), (b) leaf transpiration rate (Tr) and (c) photosynthetic photon flux density (Qn) in the lower, middle and upper canopy parts of the sample tree on 21 July 2010.
Forests 09 00603 g009
Figure 10. Variation of the crop coefficient (Kcb) of the sample tree with leaf areas (LA) in different canopy layers. The date format in different periods is “month.day”.
Forests 09 00603 g010
Table 1. Basal diameters and growth directions of first-order branches belonging to different branch height ranges.
First-Order Branch NumberBranch Height Range (m)
0–11–22–33–44–55–66–7>7
12.50 a (NW)1.34 (NW) b2.30 (N)1.15 (NE)0.80 (W)2.00 (E)- c (NW)- c (N)
2 1.01 (NE)1.00 (E)1.30 (NE)1.20 (NE)1.30 (SW)- c (SE)- c (NW)
3 2.40 (E) 1.30 (N)1.55 (SW)0.80 (E)- c (E)- c (SE)
4 2.10 (N)1.05 (E)0.50 (N)- c (S)
5 1.00 (E)1.00 (N) - c (NE)
6 0.70 (E)2.10 (NE) - c (W)
7 1.60 (NW) - c (E)
8 1.20 (S) - c (NW)
9 0.60 (NE) - c (SW)
10 2.50 (N) - c (NE)
11 2.60 (W) - c (NE)
a Basal diameter (cm); b Growth direction; c - Not measured.