Temperate and Tropical Forest Canopies are Already Functioning beyond Their Thermal Thresholds for Photosynthesis

Abstract
1. Introduction
- (A)
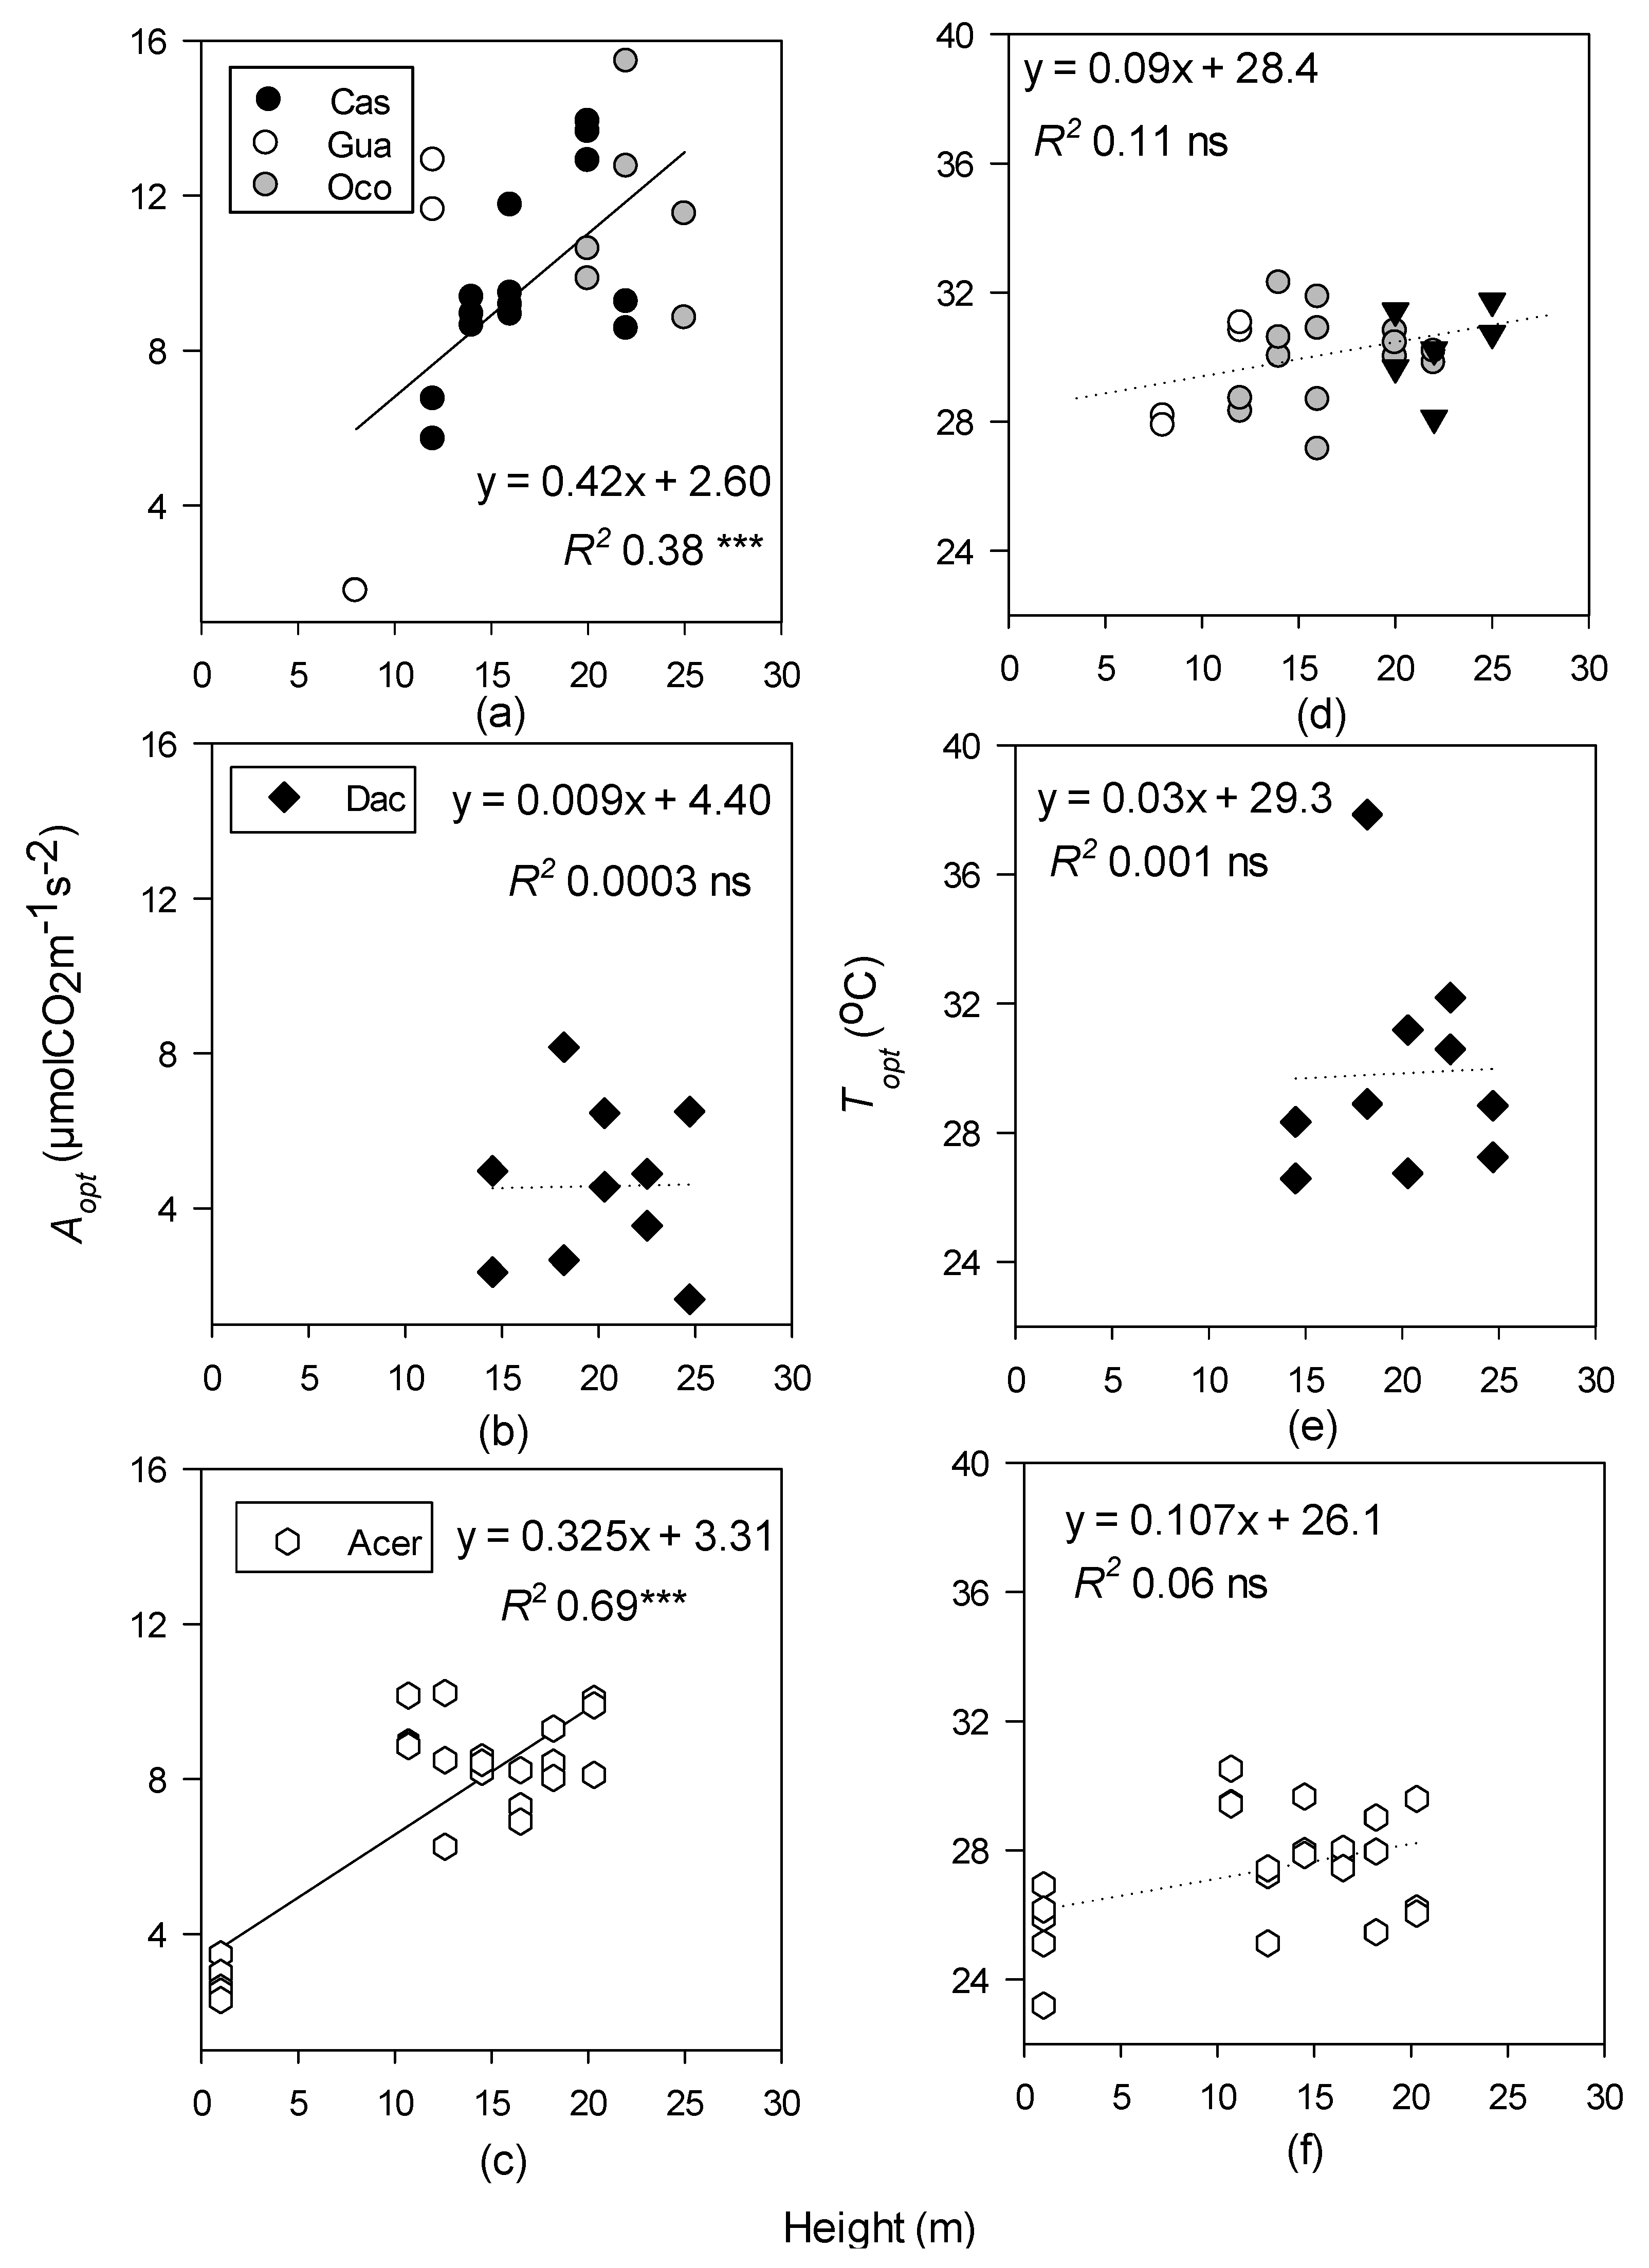
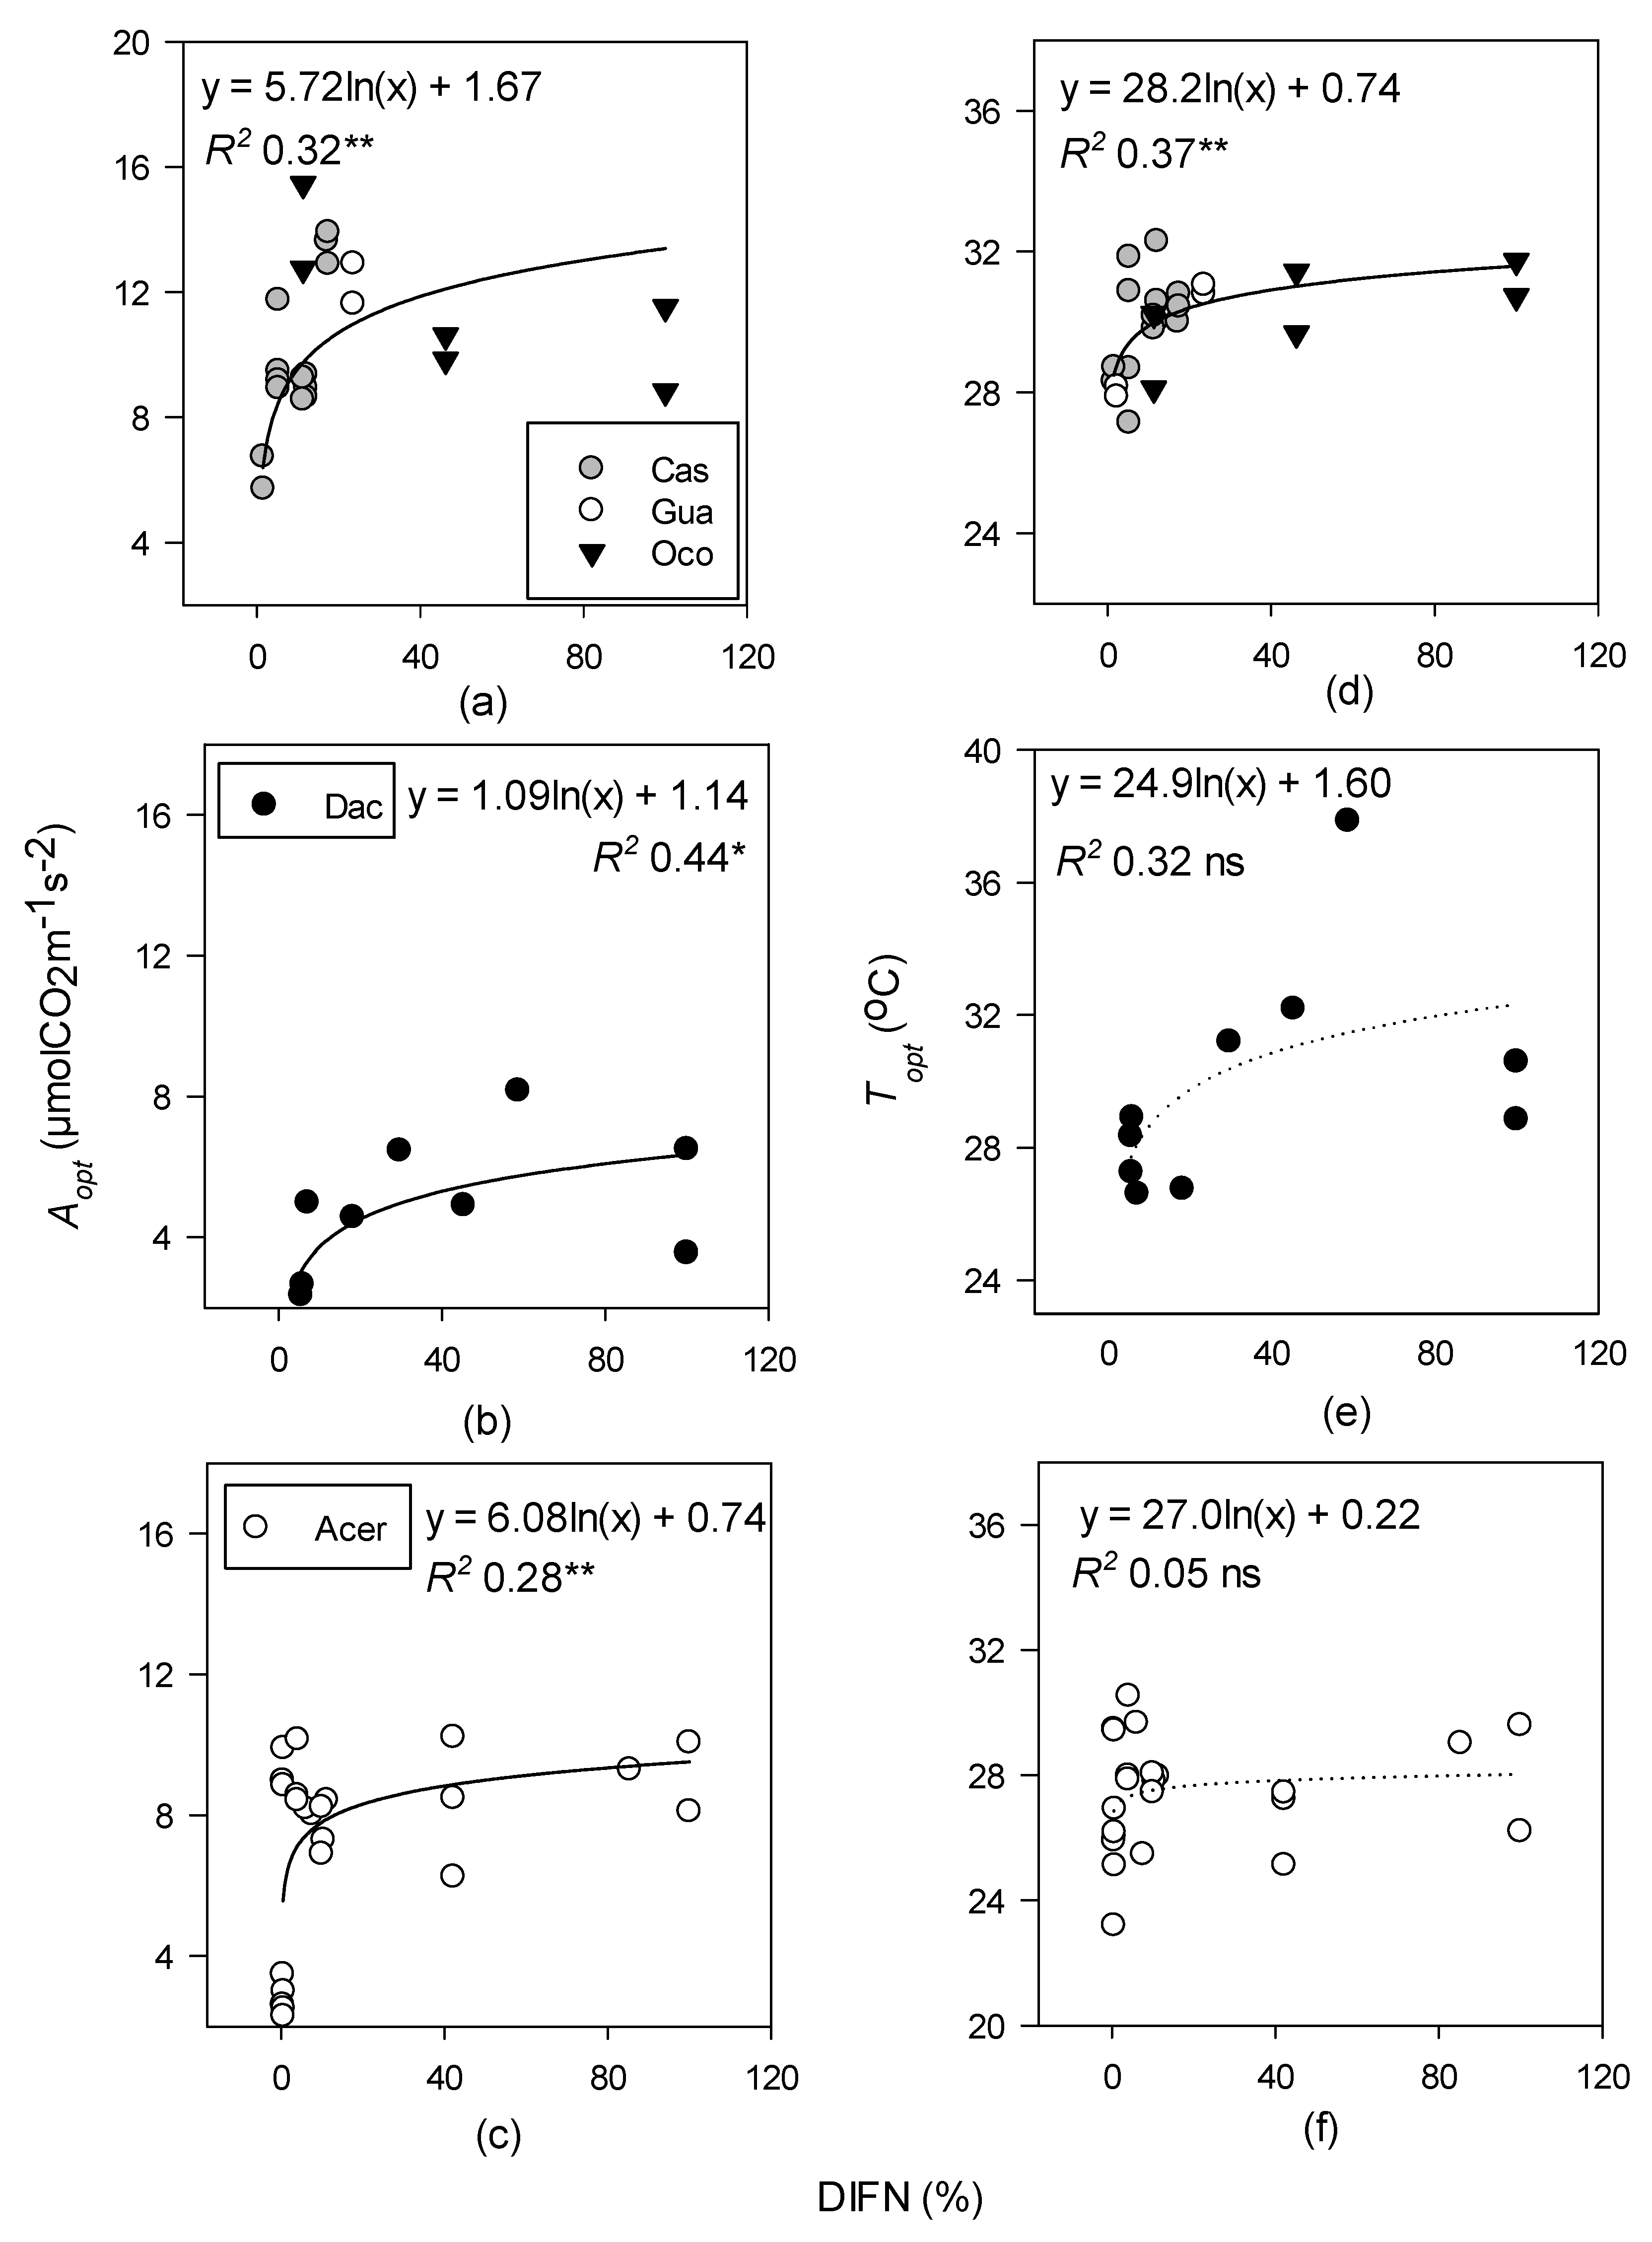
- Compared to lower leaves, upper canopy leaves at all sites will have higher temperature optima for photosynthesis (Topt), higher maximum rates of photosynthesis (Aopt), and both parameters will increase with increasing light availability.
- (B)
- Topt and Aopt will increase with increasing mean annual temperatures across forest types, but tropical tree species will be functioning closer to photosynthetic thresholds than temperate species.
- (C)
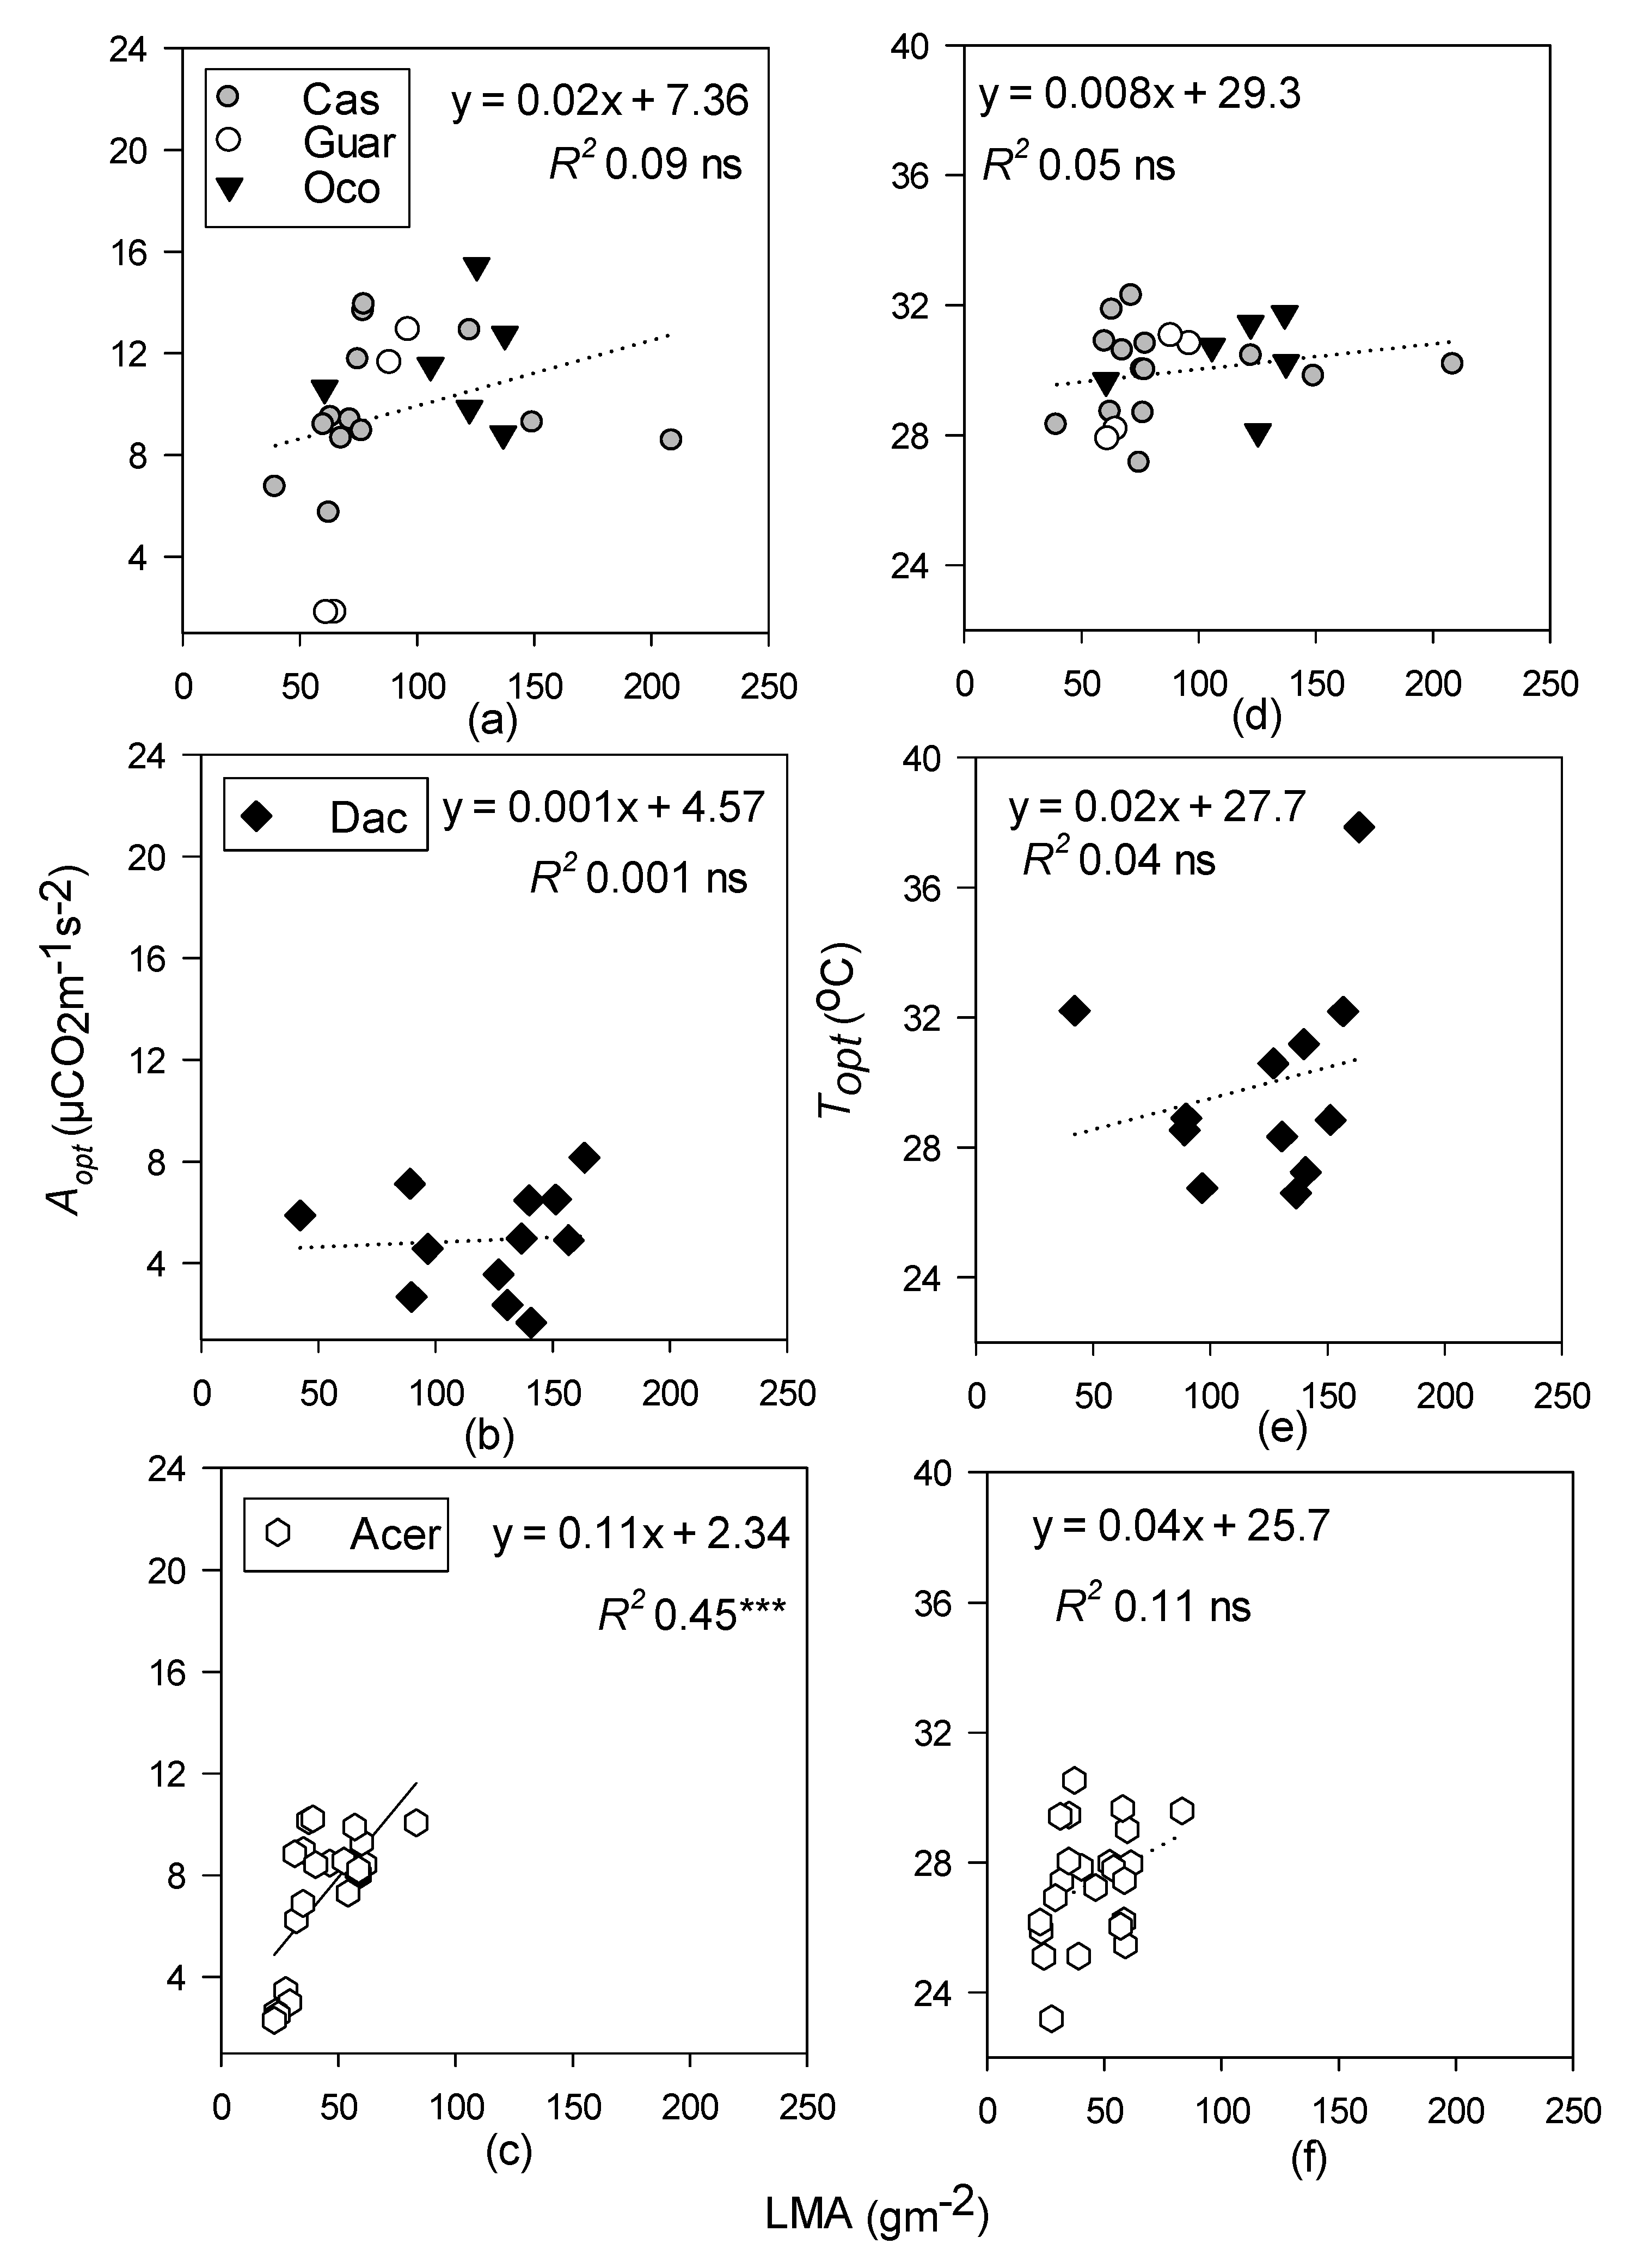
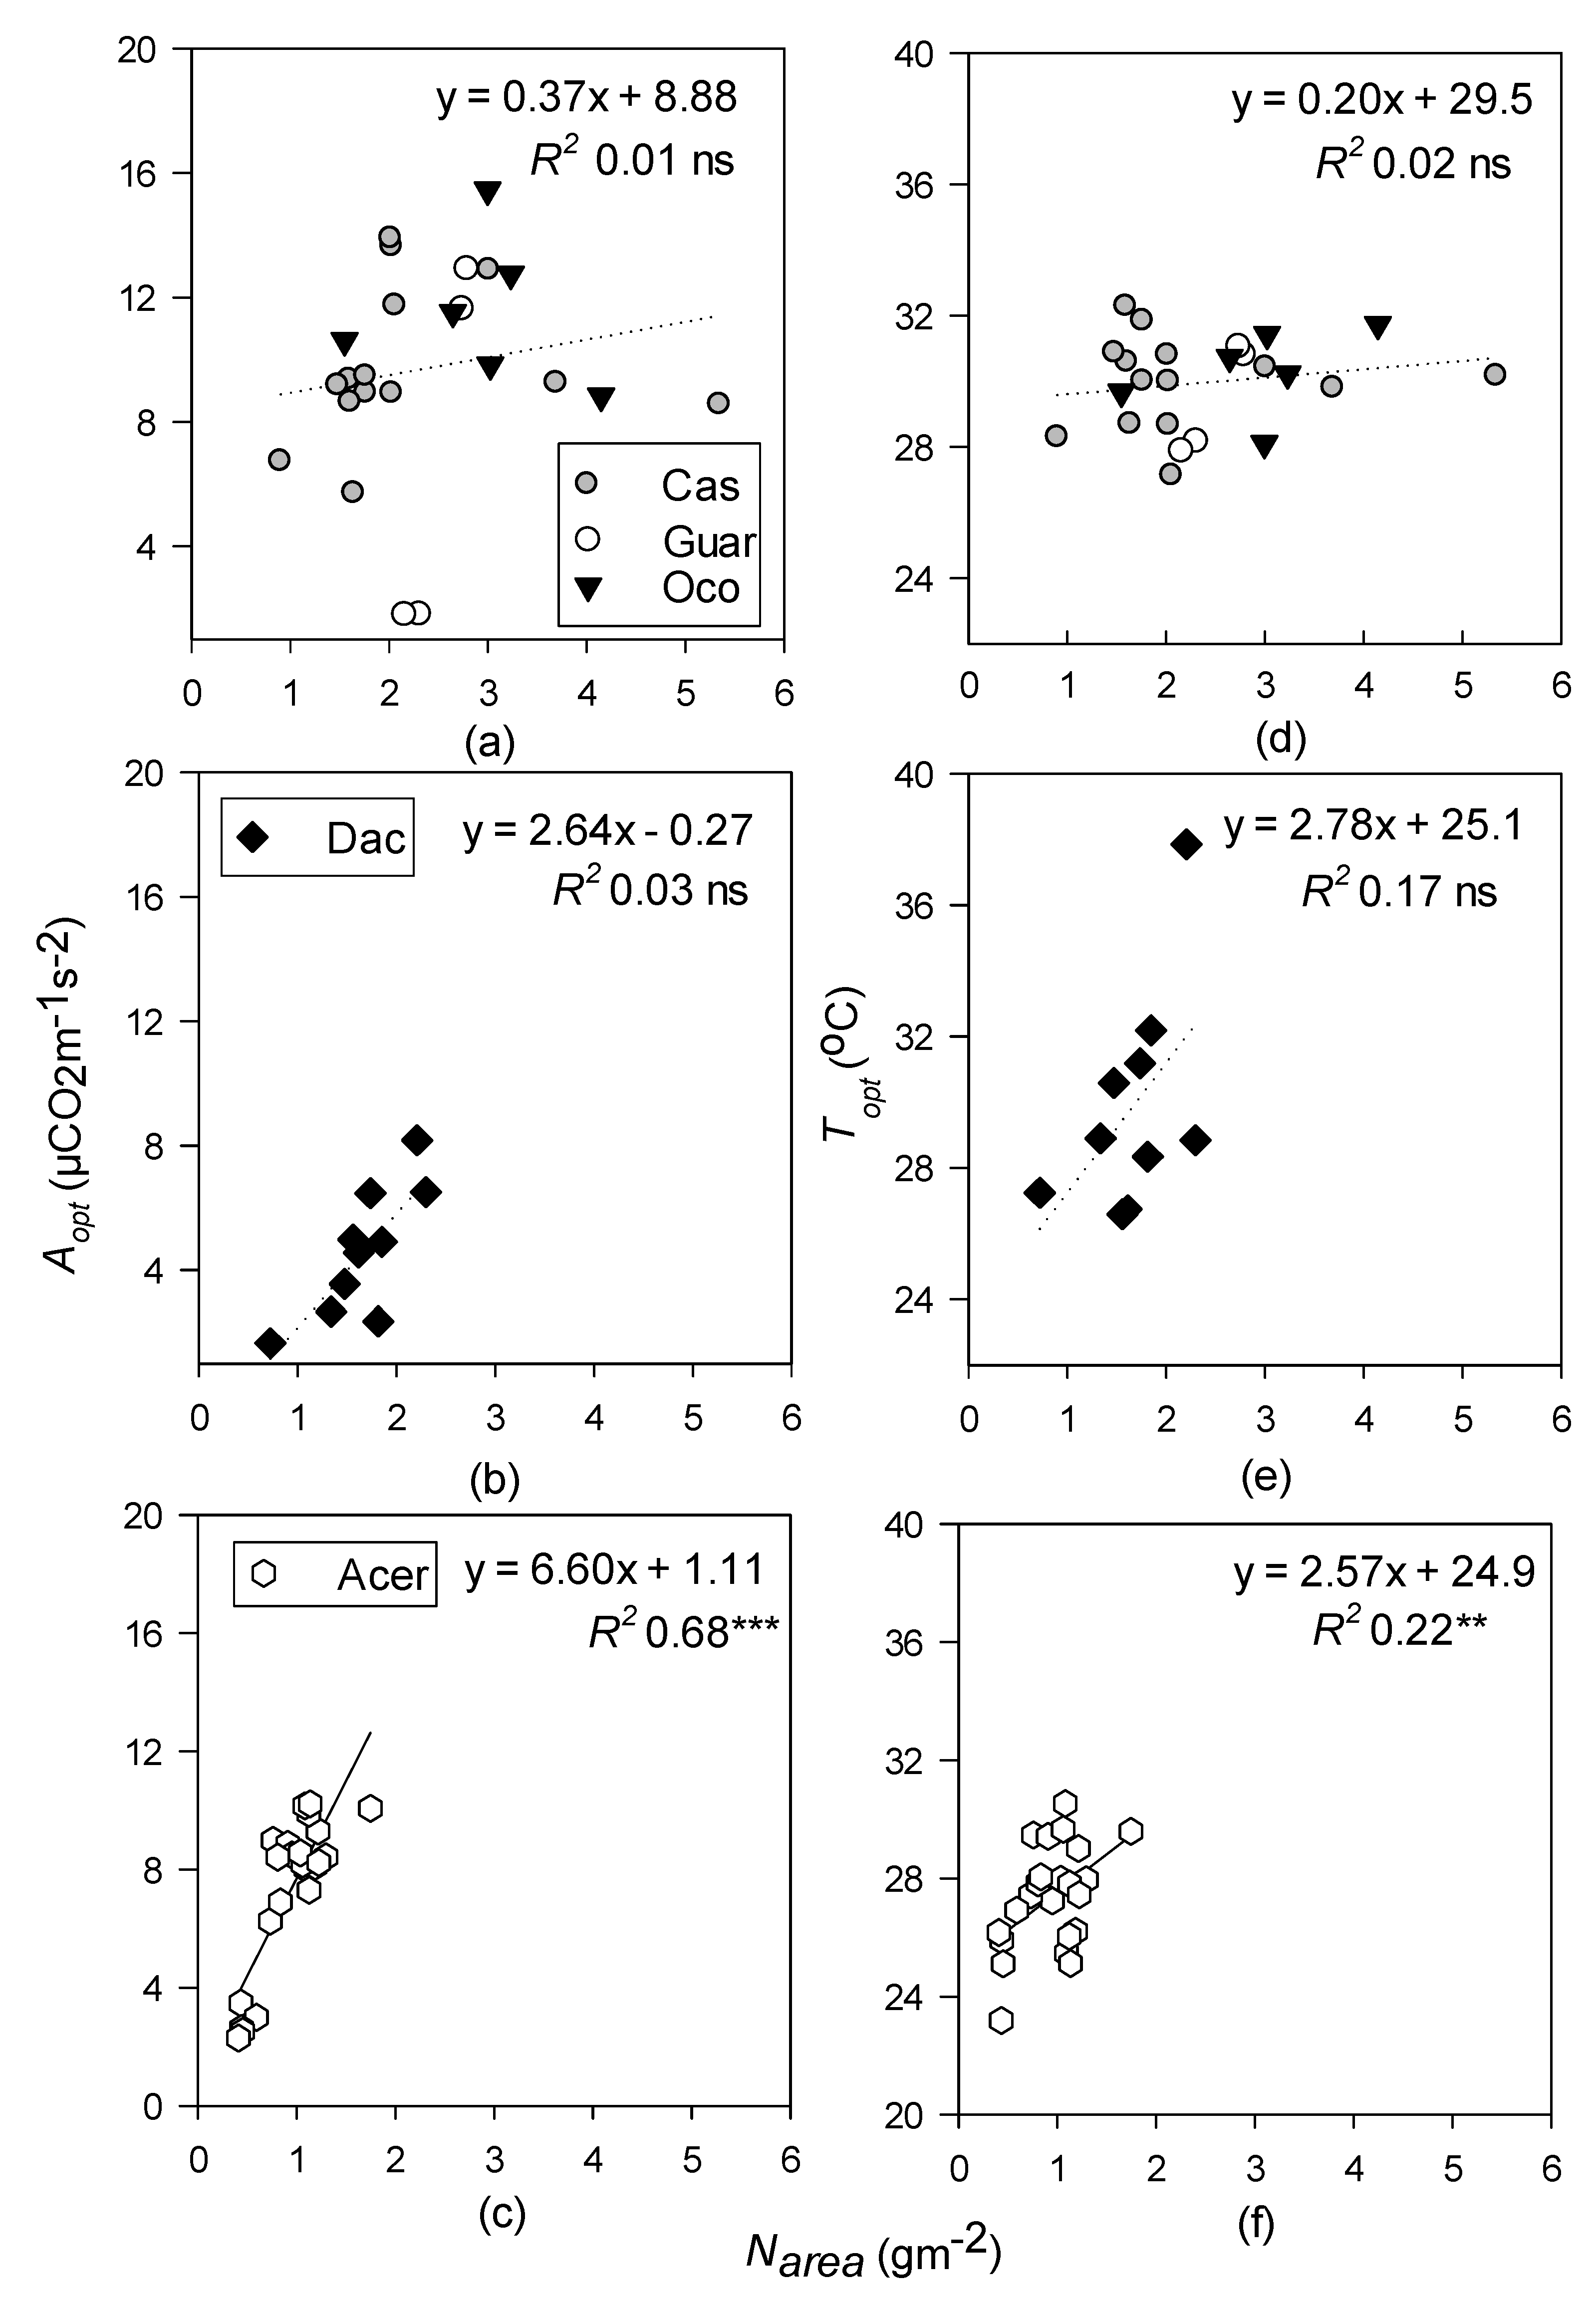
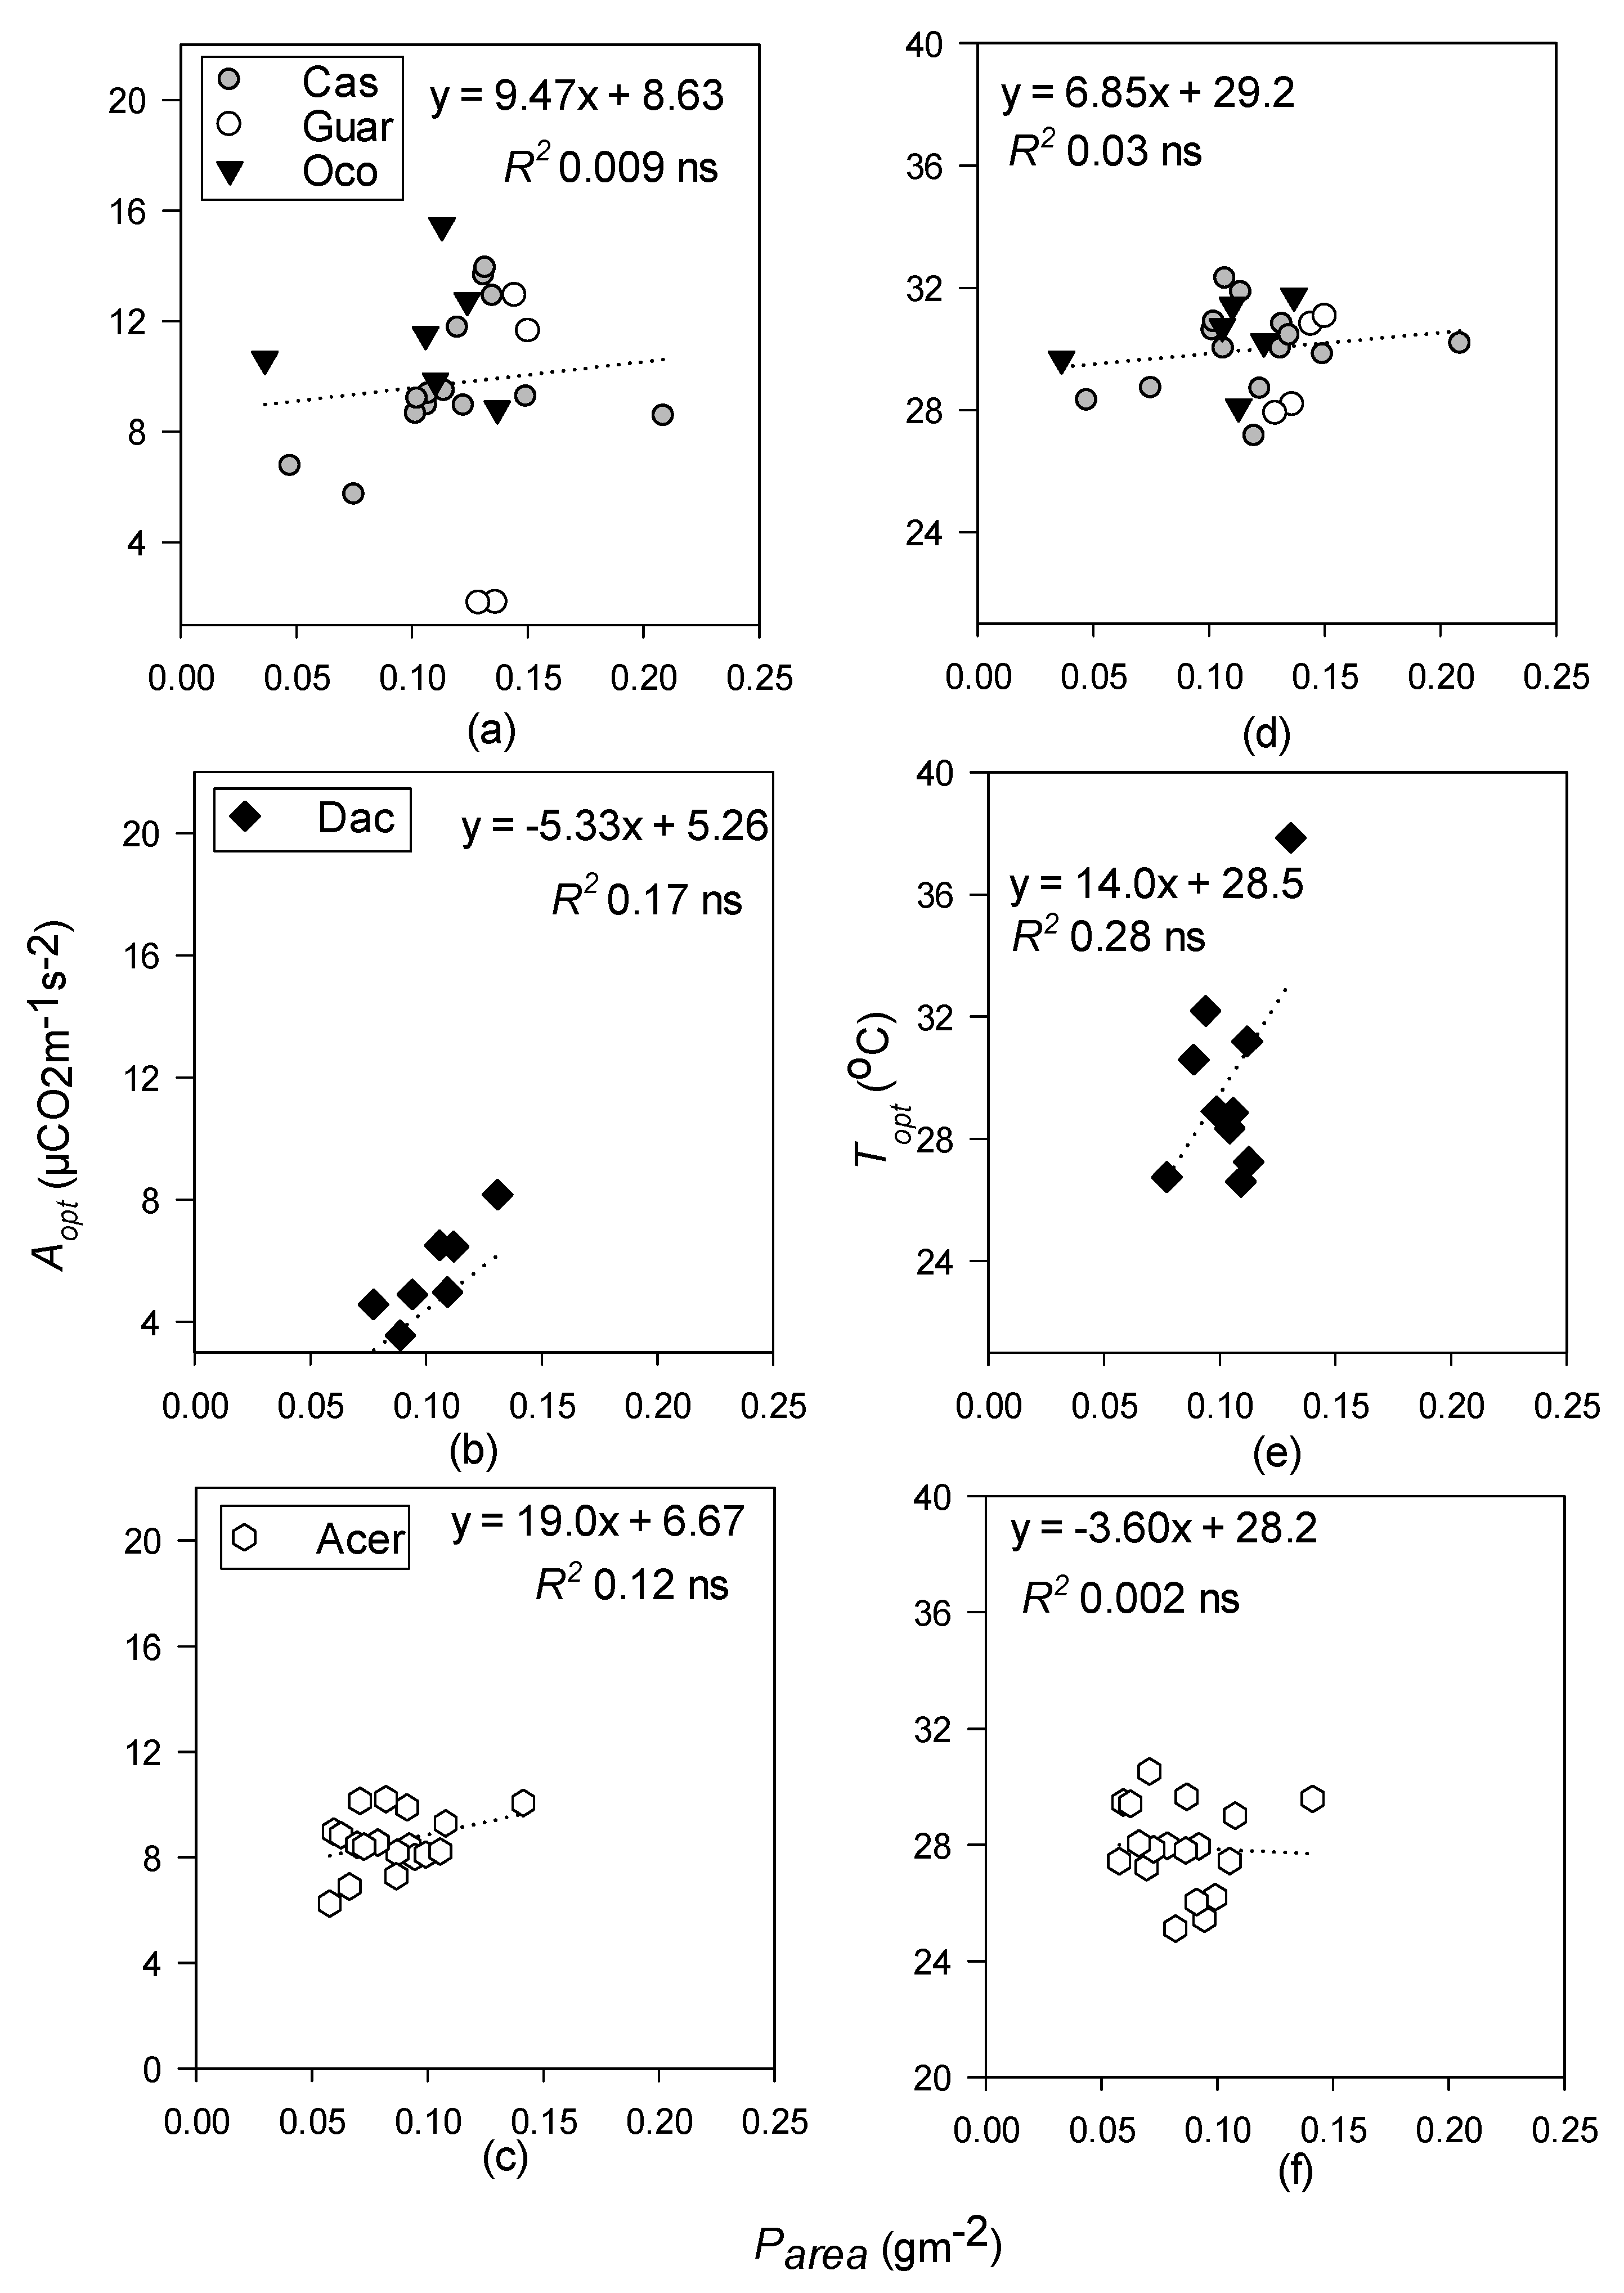
- Topt and Aopt will increase with increasing LMA at all sites but will be better predicted by leaf N in the temperate site, and leaf P at the tropical sites.
2. Materials and Methods
2.1. Temperate Deciduous Forest
2.2. Tropical Moist Forest
2.3. Tropical Wet Forest
2.4. Environmental Measurements
2.5. Sampling Design for Photosynthetic Measurements
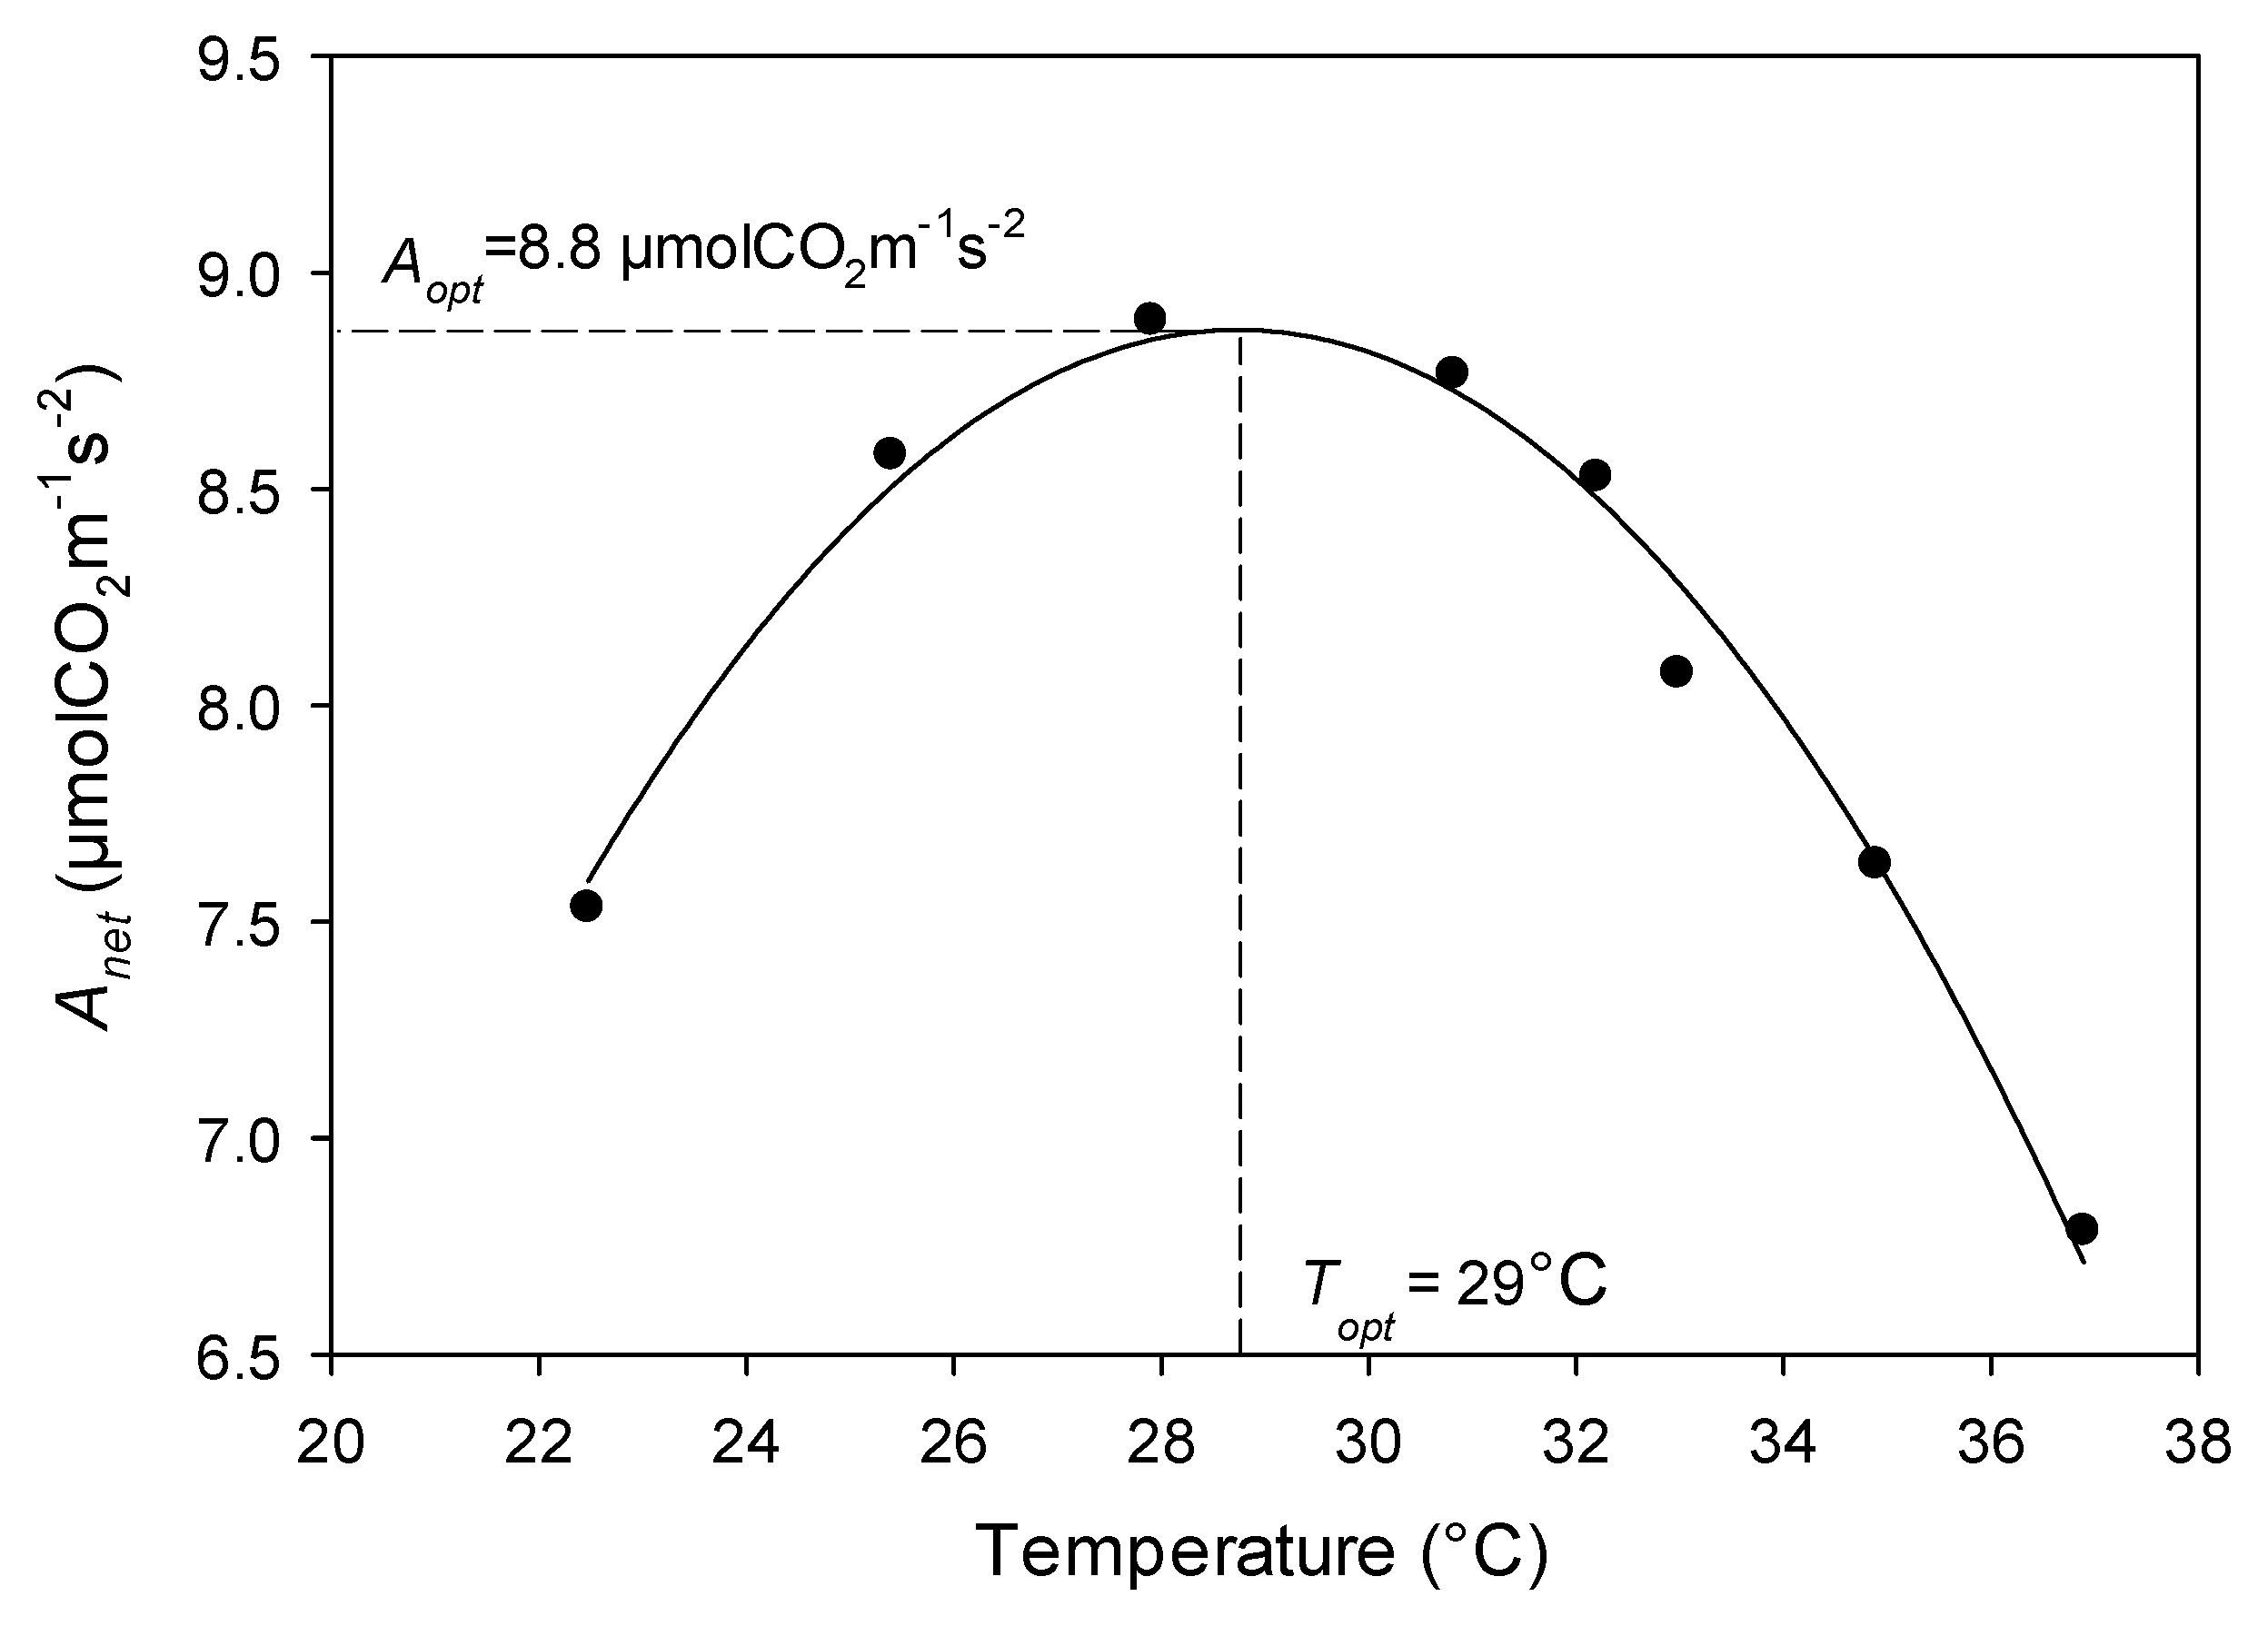
2.6. Photosynthesis Measurements and Parameter Extractions
2.7. Leaf Traits
2.8. Data Analysis
3. Results
3.1. Within-Canopy Variability of Photosynthetic Response to Temperature
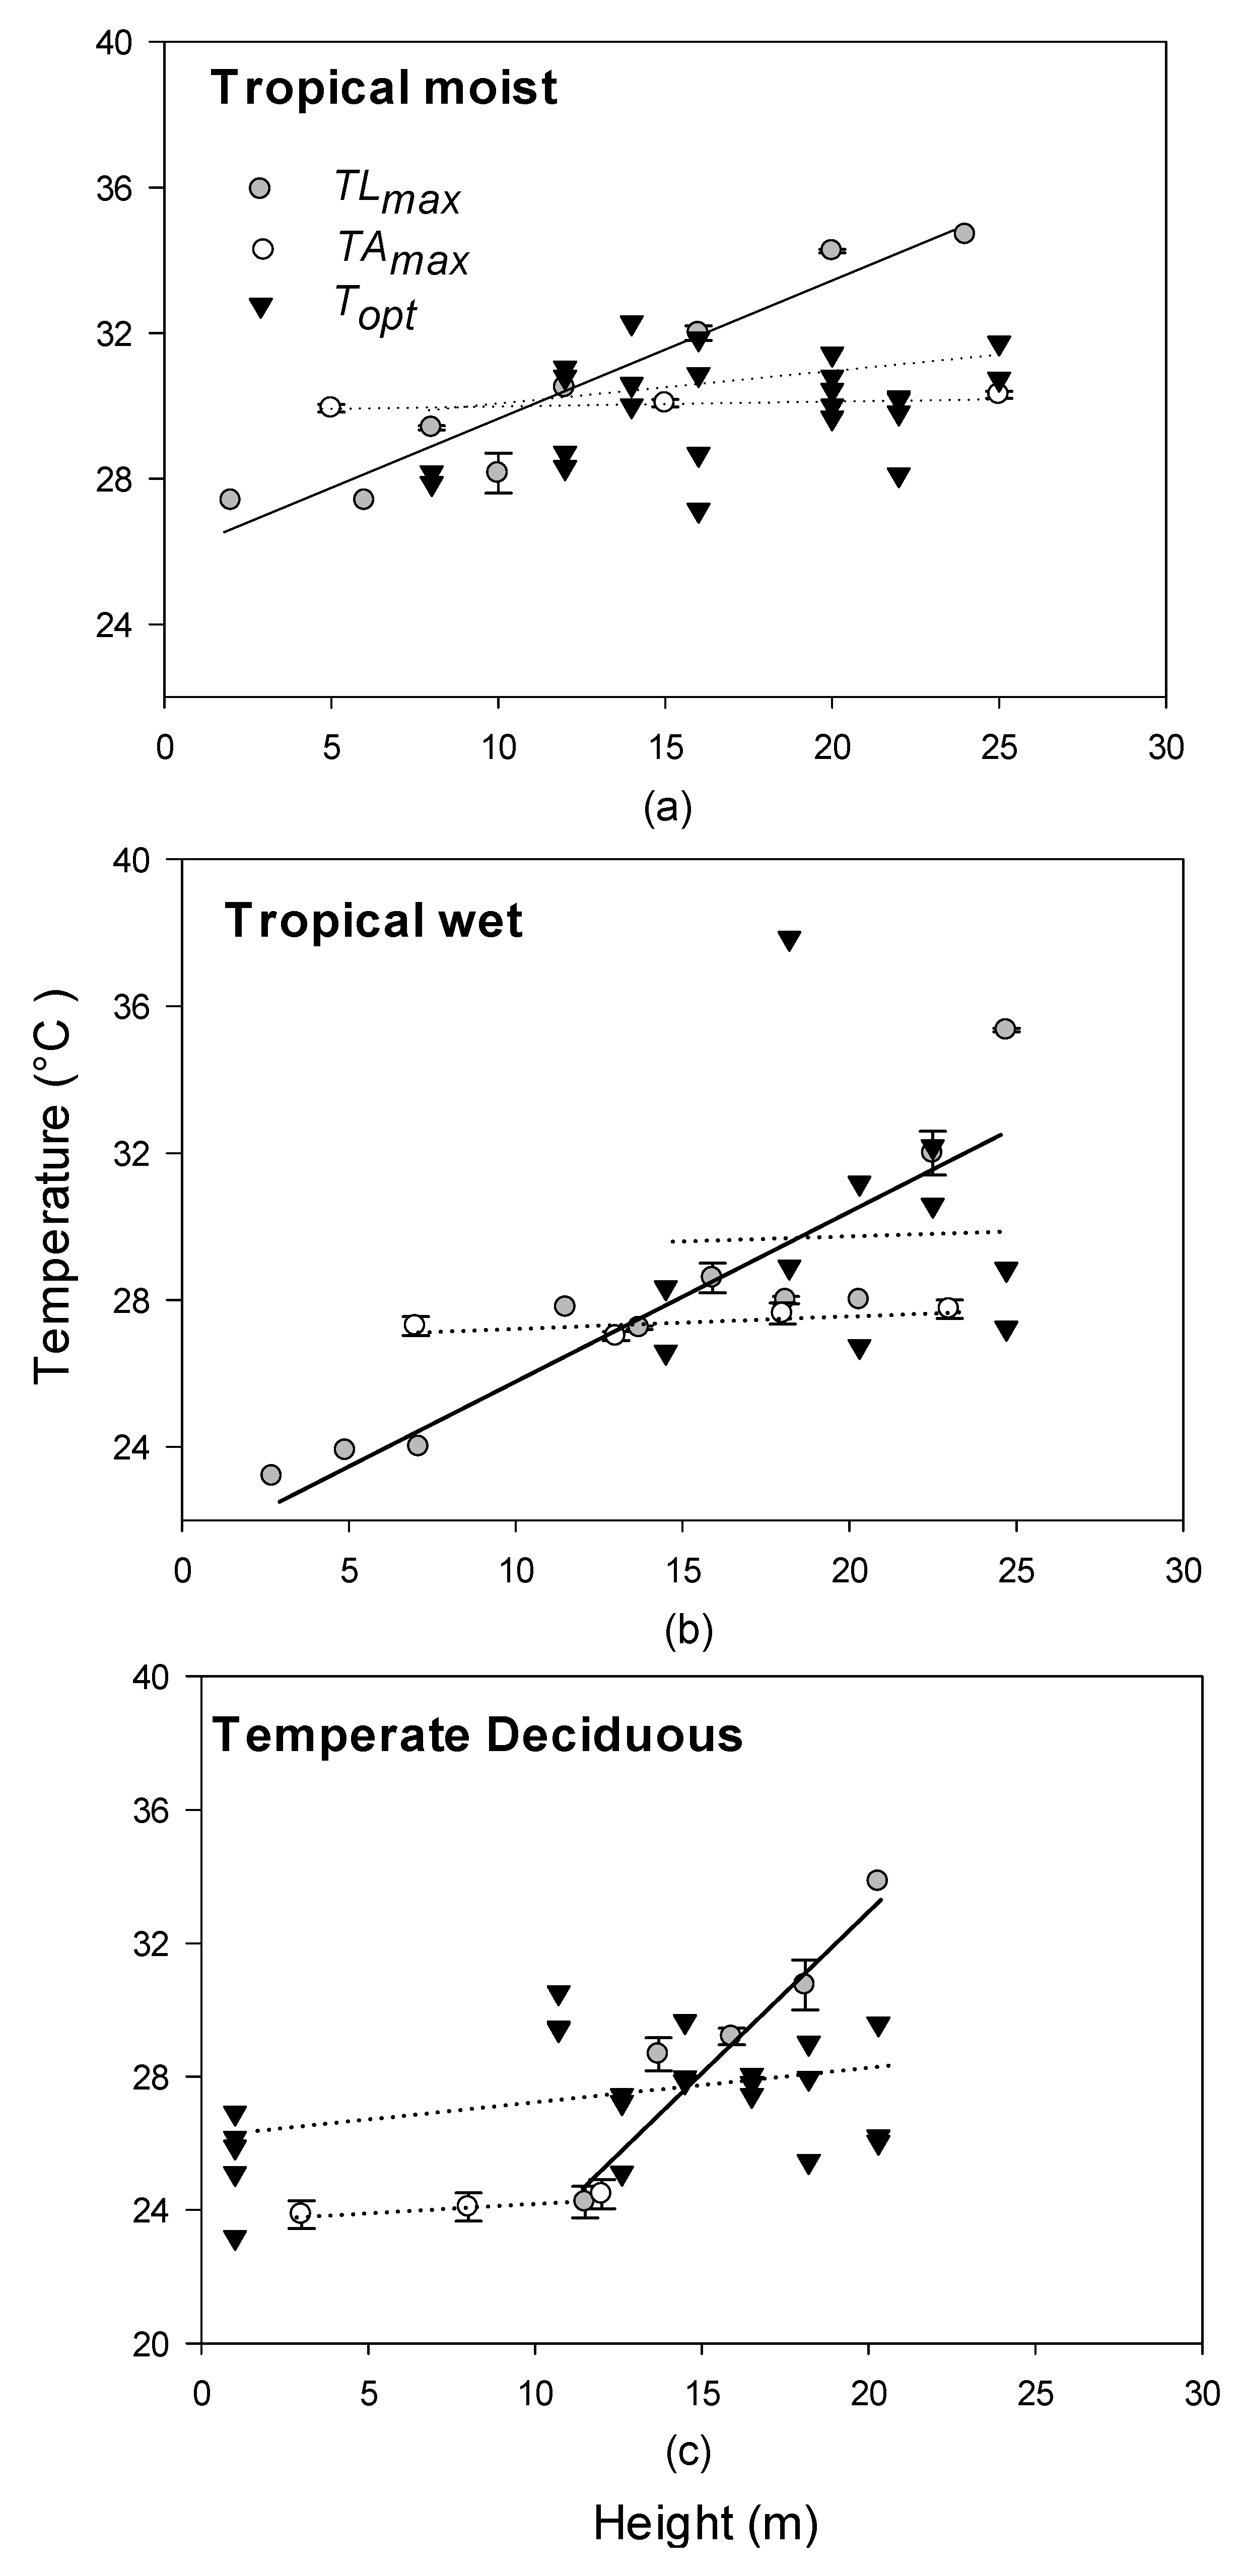
3.2. Relationships between Photosynthetic Temperature Optima and Maximum Leaf and Air Temperatures
3.3. Variation in Leaf Traits with Forest Type and across Vertical Canopy Gradients
3.4. Relationships between Photosynthetic Temperature Response Parameters and Leaf Functional Traits
4. Discussion
4.1. Effects of Height and Light on Photosynthetic-Temperature Response Curves
4.2. Relationships between Optimal Temperatures for Photosynthesis, Leaf Temperature, and Air Temperature across Different Forest Types
4.3. Leaf Functional Traits
5. Conclusions
Acknowledgements
Author Contributions
Conflicts of Interest
References
- Pan, Y.D.; Birdsey, R.A.; Phillips, O.L.; Jackson, R.B. The structure, distribution, and biomass of the world’s forests. Ann. Rev. Ecol. Evol. Syst. 2013, 44, 593–622. [Google Scholar] [CrossRef]
- Kirtman, B.P.; Min, D.; Infanti, J.M.; Kinter, J.L., III; Paolino, D.A.; Zhang, Q.; van den Dool, H.; Saha, S.; Mendez, M.P.; Becker, E. The North American Multi-Model Ensemble (NMME): Phase-1 seasonal to interannual prediction, phase-2 toward developing intra-seasonal prediction. Bull. Am. Meteorol. Soc. 2013, 95, 595–601. [Google Scholar]
- Alexander, L.; Allen, S.; Bindoff, N.; Bréon, F.; Church, J.; Cubasch, U.; Emori, S.; Forster, P.; Friedlingstein, P.; Gillett, N. Working group I Contribution to the IPCC Fifth Assessment Report: The Physical Science Basis Summary. In Climate Change; IPCC: Bern, Switzerland, 2013. [Google Scholar]
- Wood, T.E.; Cavaleri, M.A.; Reed, S.C. Tropical forest carbon balance in a warmer world: A critical review spanning microbial-to ecosystem-scale processes. Biol. Rev. 2012, 87, 912–927. [Google Scholar] [CrossRef] [PubMed]
- Doughty, C.E.; Goulden, M.L. Are tropical forests near a high temperature threshold? J. Geophys. Res. Biogeosci. 2008, 113. [Google Scholar] [CrossRef]
- Randerson, J.T.; Hoffman, F.M.; Thornton, P.E.; Mahowald, N.M.; Lindsay, K.; LEE, Y.H.; Nevison, C.D.; Doney, S.C.; Bonan, G.; Stöckli, R. Systematic assessment of terrestrial biogeochemistry in coupled climate—Carbon models. Glob. Chang. Biol. 2009, 15, 2462–2484. [Google Scholar] [CrossRef]
- Farquhar, G.D.; von Caemmerer, S.; Berry, J.A. A biochemical model of photosynthetic CO2 assimilation in leaves of C3 species. Planta 1980, 149, 78–90. [Google Scholar] [CrossRef] [PubMed]
- Medlyn, B.; Dreyer, E.; Ellsworth, D.; Forstreuter, M.; Harley, P.; Kirschbaum, M.; Le Roux, X.; Montpied, P.; Strassemeyer, J.; Walcroft, A. Temperature response of parameters of a biochemically based model of photosynthesis. II. A review of experimental data. Plant Cell Environ. 2002, 25, 1167–1179. [Google Scholar] [CrossRef]
- Gonzalez-Meler, M.A.; Rucks, J.S.; Aubanell, G. Mechanistic insights on the responses of plant and ecosystem gas exchange to global environmental change: Lessons from Biosphere 2. Plant Sci. 2014, 226, 14–21. [Google Scholar] [CrossRef] [PubMed]
- Atkin, O.; Atkinson, L.; Fisher, R.; Campbell, C.; Zaragoza Castells, J. Using temperature-dependent changes in leaf scaling relationships to quantitatively account for thermal acclimation of respiration in a coupled global climate-vegetation model. Glob. Chang. Biol. 2008, 14, 2709–2726. [Google Scholar] [CrossRef]
- Smith, N.; Dukes, J. Plant respiration and photosynthesis in global-scale models: Incorporating acclimation to temperature and CO2. Glob. Chang. Biol. 2013, 19, 45–63. [Google Scholar] [CrossRef] [PubMed]
- Weerasinghe, L.K.; Creek, D.; Crous, K.Y.; Xiang, S.; Liddell, M.J.; Turnbull, M.H.; Atkin, O.K. Canopy position affects the relationships between leaf respiration and associated traits in a tropical rainforest in Far North Queensland. Tree Physiol. 2014, 34, 564–584. [Google Scholar] [CrossRef] [PubMed]
- Huntingford, C.; Zelazowski, P.; Galbraith, D.; Mercado, L.M.; Sitch, S.; Fisher, R.; Lomas, M.; Walker, A.P.; Jones, C.D.; Booth, B.B. Simulated resilience of tropical rainforests to CO2-induced climate change. Nat. Geosci. 2013, 6, 268–273. [Google Scholar] [CrossRef]
- Cavaleri, M.A.; Reed, S.C.; Smith, W.K.; Wood, T.E. Urgent need for warming experiments in tropical forests. Glob. Chang. Biol. 2015, 21, 2111–2121. [Google Scholar] [CrossRef] [PubMed]
- Vårhammar, A.; Wallin, G.; McLean, C.M.; Dusenge, M.E.; Medlyn, B.E.; Hasper, T.B.; Nsabimana, D.; Uddling, J. Photosynthetic temperature responses of tree species in Rwanda: Evidence of pronounced negative effects of high temperature in montane rainforest climax species. New Phytol. 2015, 206, 1000–1012. [Google Scholar] [CrossRef] [PubMed]
- Cox, P.M.; Pearson, D.; Booth, B.B.; Friedlingstein, P.; Huntingford, C.; Jones, C.D.; Luke, C.M. Sensitivity of tropical carbon to climate change constrained by carbon dioxide variability. Nature 2013, 494, 341–344. [Google Scholar] [CrossRef] [PubMed]
- Clark, D.A. Sources or sinks? The responses of tropical forests to current and future climate and atmospheric composition. Philos. Trans. R. Soc. Lond. Ser. B Biol. Sci. 2004, 359, 477–491. [Google Scholar] [CrossRef] [PubMed]
- Richards, P.W. The Tropical Rain Forest: An Ecological Study; The University Press: Cambridge, UK, 1952. [Google Scholar]
- Holdridge, L.R. Life Zone Ecology; Tropical Science Center: San Jose, CA, USA, 1967. [Google Scholar]
- Marín-Spiotta, E.; Sharma, S. Carbon storage in successional and plantation forest soils: A tropical analysis. Glob. Ecol. Biogeogr. 2013, 22, 105–117. [Google Scholar] [CrossRef]
- Slot, M.; Rey-Sanchez, C.; Gerber, S.; Lichstein, J.W.; Winter, K.; Kitajima, K. Thermal acclimation of leaf respiration of tropical trees and lianas: Response to experimental canopy warming, and consequences for tropical forest carbon balance. Glob. Chang. Biol. 2014, 20, 2915–2926. [Google Scholar] [CrossRef] [PubMed]
- Doughty, C.E. An in situ leaf and branch warming experiment in the Amazon. Biotropica 2011, 43, 658–665. [Google Scholar] [CrossRef]
- Aitken, S.N.; Yeaman, S.; Holliday, J.A.; Wang, T.; Curtis-McLane, S. Adaptation, migration or extirpation: Climate change outcomes for tree populations. Glob. Chang. Biol. 2008, 1, 95–111. [Google Scholar] [CrossRef] [PubMed]
- Filewod, B.; Thomas, S.C. Impacts of a spring heat wave on canopy processes in a northern hardwood forest. Glob. Chang. Biol. 2014, 20, 360–371. [Google Scholar] [CrossRef] [PubMed]
- Hikosaka, K.; Ishikawa, K.; Borjigidai, A.; Muller, O.; Onoda, Y. Temperature acclimation of photosynthesis: Mechanisms involved in the changes in temperature dependence of photosynthetic rate. J. Exp. Bot. 2006, 57, 291–302. [Google Scholar] [CrossRef] [PubMed]
- Berry, J.; Bjorkman, O. Photosynthetic response and adaptation to temperature in higher plants. Ann. Rev. Plant Physiol. 1980, 31, 491–543. [Google Scholar] [CrossRef]
- Yamori, W.; Hikosaka, K.; Way, D.A. Temperature response of photosynthesis in C3, C4, and CAM plants: Temperature acclimation and temperature adaptation. Photosynth. Res. 2014, 119, 101–117. [Google Scholar] [CrossRef] [PubMed]
- Graham, E.A.; Mulkey, S.S.; Kitajima, K.; Phillips, N.G.; Wright, S.J. Cloud cover limits net CO2 uptake and growth of a rainforest tree during tropical rainy seasons. Proc. Natl. Acad. Sci. USA 2003, 100, 572–576. [Google Scholar] [CrossRef] [PubMed]
- Sage, R.F.; Way, D.A.; Kubien, D.S. Rubisco, Rubisco activase, and global climate change. J. Exp. Bot. 2008, 59, 1581–1595. [Google Scholar] [CrossRef] [PubMed]
- Salvucci, M.E.; Crafts-Brandner, S.J. Relationship between the heat tolerance of photosynthesis and the thermal stability of Rubisco activase in plants from contrasting thermal environments. Plant Physiol. 2004, 134, 1460–1470. [Google Scholar] [CrossRef] [PubMed]
- Von Caemmerer, S.; Quick, W.P. Rubisco: Physiology in vivo. In Photosynthesis; Leegood, R.C., Sharkey, T.D., von Caemmerer, S., Eds.; Springer: Dordrecht, The Netherlands, 2000; pp. 85–113. [Google Scholar]
- Way, D.A.; Oren, R. Differential responses to changes in growth temperature between trees from different functional groups and biomes: A review and synthesis of data. Tree Physiol. 2010, 30, 669–688. [Google Scholar] [CrossRef] [PubMed]
- Bonan, G.B. Forests and climate change: Forcings, feedbacks, and the climate benefits of forests. Science 2008, 320, 1444–1449. [Google Scholar] [CrossRef] [PubMed]
- Clark, D.A.; Piper, S.; Keeling, C.; Clark, D.B. Tropical rain forest tree growth and atmospheric carbon dynamics linked to interannual temperature variation during 1984–2000. Proc. Natl. Acad. Sci. USA 2003, 100, 5852–5857. [Google Scholar] [CrossRef] [PubMed]
- Battaglia, M.; Beadle, C.; Loughhead, S. Photosynthetic temperature responses of Eucalyptus globulus and Eucalyptus nitens. Tree Physiol. 1996, 16, 81–89. [Google Scholar] [CrossRef] [PubMed]
- Slot, M.; Winter, K. In situ temperature response of photosynthesis of 42 tree and liana species in the canopy of two Panamanian lowland tropical forests with contrasting rainfall regimes. New Phytol. 2017, 214, 1103–1117. [Google Scholar] [CrossRef] [PubMed]
- Slot, M.; Winter, K. Photosynthetic acclimation to warming in tropical forest tree seedlings. J. Exp. Bot. 2017, 68, 2275–2284. [Google Scholar] [CrossRef] [PubMed]
- Tan, Z.-H.; Zeng, J.; Zhang, Y.-J.; Slot, M.; Gamo, M.; Hirano, T.; Kosugi, Y.; Da Rocha, H.R.; Saleska, S.R.; Goulden, M.L. Optimum air temperature for tropical forest photosynthesis: Mechanisms involved and implications for climate warming. Environ. Res. Lett. 2017. [Google Scholar] [CrossRef]
- Cunningham, S.; Read, J. Comparison of temperate and tropical rainforest tree species: Photosynthetic responses to growth temperature. Oecologia 2002, 133, 112–119. [Google Scholar] [CrossRef] [PubMed]
- Kirschbaum, M. Direct and indirect climate change effects on photosynthesis and transpiration. Plant Biol. 2004, 6, 242–253. [Google Scholar] [CrossRef] [PubMed]
- Rey-Sánchez, A.C.; Slot, M.; Posada, J.M.; Kitajima, K. Spatial and seasonal variation in leaf temperature within the canopy of a tropical forest. Clim. Res. 2016, 71, 75–89. [Google Scholar] [CrossRef]
- Sefcik, L.T.; Zak, D.R.; Ellsworth, D.S. Photosynthetic responses to understory shade and elevated carbon dioxide concentration in four northern hardwood tree species. Tree Physiol. 2006, 26, 1589–1599. [Google Scholar] [CrossRef] [PubMed]
- Niinemets, Ü. Photosynthesis and resource distribution through plant canopies. Plant Cell Environ. 2007, 30, 1052–1071. [Google Scholar] [CrossRef] [PubMed]
- Van de Weg, M.J.; Meir, P.; Williams, M.; Girardin, C.; Malhi, Y.; Silva-Espejo, J.; Grace, J. Gross primary productivity of a high elevation tropical montane cloud forest. Ecosystems 2014, 17, 751–764. [Google Scholar] [CrossRef]
- Dai, Y.; Dickinson, R.E.; Wang, Y.-P. A two-big-leaf model for canopy temperature, photosynthesis, and stomatal conductance. J. Clim. 2004, 17, 2281–2299. [Google Scholar] [CrossRef]
- Koch, G.W.; Amthor, J.S.; Goulden, M.L. Diurnal patterns of leaf photosynthesis, conductance and water potential at the top of a lowland rain forest canopy in Cameroon: Measurements from the Radeau des Cimes. Tree Physiol. 1994, 14, 347–360. [Google Scholar] [CrossRef] [PubMed]
- Catovsky, S.; Holbrook, N.; Bazzaz, F. Coupling whole-tree transpiration and canopy photosynthesis in coniferous and broad-leaved tree species. Can. J. For. Res. 2002, 32, 295–309. [Google Scholar] [CrossRef]
- Reich, P.B.; Ellsworth, D.S.; Walters, M.B. Leaf structure (specific leaf area) modulates photosynthesis–nitrogen relations: Evidence from within and across species and functional groups. Funct. Ecol. 1998, 12, 948–958. [Google Scholar] [CrossRef]
- Evans, J.R. Photosynthesis and nitrogen relationships in leaves of C3 plants. Oecologia 1989, 78, 9–19. [Google Scholar] [CrossRef] [PubMed]
- Field, C.H.; Mooney, H.A. Photosynthesis-Nitrogen Relationship in Wild Plants. In On the Economy of Plant Form and Function, Proceedings of the Sixth Maria Moors Cabot Symposium, Evolutionary Constraints on Primary Productivity, Adaptive Patterns of Energy Capture in Plants, Harvard Forest, Petersham, MA, USA, 1 August 1983; Cambridge University Press: Cambridge, NY, USA, 1986. [Google Scholar]
- Rozendaal, D.; Hurtado, V.; Poorter, L. Plasticity in leaf traits of 38 tropical tree species in response to light; relationships with light demand and adult stature. Funct. Ecol. 2006, 20, 207–216. [Google Scholar] [CrossRef]
- Crous, K.Y.; Ellsworth, D.S. Canopy position affects photosynthetic adjustments to long-term elevated CO2 concentration (FACE) in aging needles in a mature Pinus taeda forest. Tree Physiol. 2004, 24, 961–970. [Google Scholar] [CrossRef] [PubMed]
- Walker, A.P.; Beckerman, A.P.; Gu, L.; Kattge, J.; Cernusak, L.A.; Domingues, T.F.; Scales, J.C.; Wohlfahrt, G.; Wullschleger, S.D.; Woodward, F.I. The relationship of leaf photosynthetic traits—Vcmax and Jmax—To leaf nitrogen, leaf phosphorus, and specific leaf area: A meta-analysis and modeling study. Ecol. Evol. 2014, 4, 3218–3235. [Google Scholar] [CrossRef] [PubMed]
- Poorter, H.; Niinemets, Ü.; Poorter, L.; Wright, I.J.; Villar, R. Causes and consequences of variation in leaf mass per area (LMA): A meta-analysis. New Phytol. 2009, 182, 565–588. [Google Scholar] [CrossRef] [PubMed]
- Cavaleri, M.A.; Oberbauer, S.F.; Clark, D.B.; Clark, D.A.; Ryan, M.G. Height is more important than light in determining leaf morphology in a tropical forest. Ecology 2010, 91, 1730–1739. [Google Scholar] [CrossRef] [PubMed]
- Coble, A.; Cavaleri, M. Light drives vertical gradients of leaf morphology in a sugar maple (Acer saccharum) forest. Tree Physiol. 2014, 34, 146–158. [Google Scholar] [CrossRef] [PubMed]
- Coble, A.P.; Autio, A.; Cavaleri, M.A.; Binkley, D.; Ryan, M.G. Converging patterns of vertical variability in leaf morphology and nitrogen across seven Eucalyptus plantations in Brazil and Hawaii, USA. Trees 2014, 28, 1–15. [Google Scholar] [CrossRef]
- Xiang, S.; Reich, P.B.; Sun, S.C.; Atkin, O.K. Contrasting leaf trait scaling relationships in tropical and temperate wet forest species. Funct. Ecol. 2013, 27, 522–534. [Google Scholar] [CrossRef]
- Vitousek, P.M. Beyond global warming: Ecology and global change. Ecology 1994, 75, 1861–1876. [Google Scholar] [CrossRef]
- Cleveland, C.C.; Townsend, A.R. Nutrient additions to a tropical rain forest drive substantial soil carbon dioxide losses to the atmosphere. Proc. Natl. Acad. Sci. USA 2006, 103, 10316–10321. [Google Scholar] [CrossRef] [PubMed]
- Vitousek, P.M. Litterfall, nutrient cycling, and nutrient limitation in tropical forests. Ecology 1984, 65, 285–298. [Google Scholar] [CrossRef]
- Bloomfield, K.J.; Farquhar, G.D.; Lloyd, J. Photosynthesis-nitrogen relationships in tropical forest tree species as affected by soil phosphorus availability: A controlled environment study. Funct. Plant Biol. 2014, 41, 820–832. [Google Scholar] [CrossRef]
- Raaimakers, D.; Boot, R.; Dijkstra, P.; Pot, S. Photosynthetic rates in relation to leaf phosphorus content in pioneer versus climax tropical rainforest trees. Oecologia 1995, 102, 120–125. [Google Scholar] [CrossRef] [PubMed]
- Gleason, S.M.; Read, J.; Ares, A.; Metcalfe, D.J. Phosphorus economics of tropical rainforest species and stands across soil contrasts in Queensland, Australia: Understanding the effects of soil specialization and trait plasticity. Funct. Ecol. 2009, 23, 1157–1166. [Google Scholar] [CrossRef]
- Jarvi, M.P.; Burton, A.J. Acclimation and soil moisture constrain sugar maple root respiration in experimentally warmed soil. Tree Physiol. 2013, 33, 949–959. [Google Scholar] [CrossRef] [PubMed]
- Campione, M.A.; Nagel, L.M.; Webster, C.R. Herbaceous-layer community dynamics along a harvest-intensity gradient after 50 years of consistent management. Open J. For. 2012, 2, 97. [Google Scholar] [CrossRef]
- Monroe, W.H. The Karst Landforms of Puerto Rico; US Department of the Interior, Geological Survey: Washington, DC, USA, 1976.
- Lugo, A.E.; da Silva, J.F.; Uribe, A.M.S. Balance de carbono en un bosque novedoso de Castilla elastica: Resultados preliminares. Asoc. Maest. Cienc. Puerto Rico 2008, 22, 13–27. [Google Scholar]
- Ewel, J.J.; Whitmore, J.L. Ecological life zones of Puerto Rico and US Virgin Islands. In Ecological Life Zones of Puerto Rico and US Virgin Islands; US Department of Agriculture: Rio Piedras, PR, USA, 1973. [Google Scholar]
- Kitajima, K.; Mulkey, S.S.; Wright, S.J. Variation in crown light utilization characteristics among tropical canopy trees. Ann. Bot. 2005, 95, 535–547. [Google Scholar] [CrossRef] [PubMed]
- Brako, L.; Zarucchi, J.L. Catalogue of the Flowering Plants and Gymnosperms of Peru; Missouri Botanical Garden: St. Louis, MO, USA, 1993. [Google Scholar]
- Comita, L.S.; Thompson, J.; Uriarte, M.; Jonckheere, I.; Canham, C.D.; Zimmerman, J.K. Interactive effects of land use history and natural disturbance on seedling dynamics in a subtropical forest. Ecol. Appl. 2010, 20, 1270–1284. [Google Scholar] [CrossRef] [PubMed]
- Myster, R.W.; Walker, L.R. Plant successional pathways on Puerto Rican landslides. J. Trop. Ecol. 1997, 13, 165–173. [Google Scholar] [CrossRef]
- Scatena, F.; Silver, W.; Siccama, T.; Johnson, A.; Sanchez, M. Biomass and nutrient content of the Bisley experimental watersheds, Luquillo Experimental Forest, Puerto Rico, before and after Hurricane Hugo, 1989. Biotropica 1993, 25, 15–27. [Google Scholar] [CrossRef]
- Harris, N.L.; Lugo, A.E.; Brown, S.; Heartsill Scalley, T. Luquillo Experimental Forest: Research History and Opportunities; USDA Forest Service: Washington, DC, USA, 2012.
- Lugo, A.E.; Batlle, C.T.R. Leaf production, growth rate, and age of the palm Prestoea montana in the Luquillo Experimental Forest, Puerto Rico. J. Trop. Ecol. 1987, 151–161. [Google Scholar] [CrossRef]
- Weaver, P.; Medina, E.; Pool, D.; Dugger, K.; Gonzales-Liboy, J.; Cuevas, E. Ecological observations in the dwarf cloud forest of the Luquillo Mountains in Puerto Rico. Biotropica 1986, 18, 79–85. [Google Scholar] [CrossRef]
- Frangi, J.L.; Lugo, A.E. A flood plain palm forest in the Luquillo Mountains of Puerto Rico five years after Hurricane Hugo. Biotropica 1998, 30, 339–348. [Google Scholar] [CrossRef]
- Reagan, D.P.; Waide, R.B. The Food Web of a Tropical Rain Forest; University of Chicago Press: Chicago, IL, USA, 1996. [Google Scholar]
- Heartsill-Scalley, T.; Scatena, F.; Estrada, C.; McDowell, W.; Lugo, A. Disturbance and long-term patterns of rainfall and throughfall nutrient fluxes in a subtropical wet forest in Puerto Rico. J. Hydrol. 2007, 333, 472–485. [Google Scholar] [CrossRef]
- Lugo, A.E.; Wadsworth, F.H. Dacryodes excelsa vahl tabonuco. Silv. N. Am. 1990, 2, 284. [Google Scholar]
- Zimmerman, J.K.; Everham III, E.M.; Waide, R.B.; Lodge, D.J.; Taylor, C.M.; Brokaw, N.V. Responses of tree species to hurricane winds in subtropical wet forest in Puerto Rico: Implications for tropical tree life histories. J. Ecol. 1994, 911–922. [Google Scholar] [CrossRef]
- Birdsey, R.A.; Weaver, P.L. Forest Area Trends in Puerto Rico; US Department of Agriculture: New Orleans, LA, USA, 1987.
- Ducrey, M. Influence of Shade on Photosynthetic Gas Exchange of Seven Tropical Rain-Forest Species from Guadeloupe (French West Indies). In Annales des Sciences Forestières; EDP Sciences: Les Ulis, France, 1994; pp. 77–94. [Google Scholar]
- Gendron, F.; Messier, C.; Comeau, P.G. Comparison of various methods for estimating the mean growing season percent photosynthetic photon flux density in forests. Agric. For. Meteorol. 1998, 92, 55–70. [Google Scholar] [CrossRef]
- Silva, L.C.R.; Anand, M. Probing for the influence of atmospheric CO2 and climate change on forest ecosystems across biomes. Glob. Ecol. Biogeogr. 2013, 22, 83–92. [Google Scholar] [CrossRef]
- Cavieres, L.A.; Rada, F.; Azócar, A.; García-Núñez, C.; Cabrera, H.M. Gas exchange and low temperature resistance in two tropical high mountain tree species from the Venezuelan Andes. Acta Oecol. 2000, 21, 203–211. [Google Scholar] [CrossRef]
- Kenzo, T.; Ichie, T.; Watanabe, Y.; Yoneda, R.; Ninomiya, I.; Koike, T. Changes in photosynthesis and leaf characteristics with tree height in five dipterocarp species in a tropical rain forest. Tree Physiol. 2006, 26, 865–873. [Google Scholar] [CrossRef] [PubMed]
- Kenzo, T.; Yoneda, R.; Sano, M.; Araki, M.; Shimizu, A.; Tanaka-Oda, A.; Chann, S. Variations in leaf photosynthetic and morphological traits with tree height in various tree species in a Cambodian tropical dry evergreen forest. Jpn. Agric. Res. Q. 2012, 46, 167–180. [Google Scholar] [CrossRef]
- Delagrange, S.; Messier, C.; Lechowicz, M.J.; Dizengremel, P. Physiological, morphological and allocational plasticity in understory deciduous trees: Importance of plant size and light availability. Tree Physiol. 2004, 24, 775–784. [Google Scholar] [CrossRef] [PubMed]
- Körner, C.H.; Diemer, M. In situ photosynthetic responses to light, temperature and carbon dioxide in herbaceous plants from low and high altitude. Funct. Ecol. 1987, 1, 179–194. [Google Scholar] [CrossRef]
- Ferrar, P.J.; Slatyer, R.O.; Vranjic, J.A. Photosynthetic temperature acclimation in Eucalyptus species from diverse habitats, and a comparison with Nerium oleander. Funct. Plant Biol. 1989, 16, 199–217. [Google Scholar]
- Chazdon, R.L.; Pearcy, R.W.; Lee, D.W.; Fetcher, N. Photosynthetic responses of tropical forest plants to contrasting light environments. In Tropical Forest Plant Ecophysiology; Springer: Boston, MA, USA, 1996; pp. 5–55. [Google Scholar]
- Leakey, A.; Press, M.; Scholes, J. High-temperature inhibition of photosynthesis is greater under sunflecks than uniform irradiance in a tropical rain forest tree seedling. Plant Cell Environ. 2003, 26, 1681–1690. [Google Scholar] [CrossRef]
- Reich, P.B.; Walters, M.B.; Ellsworth, D.S. From tropics to tundra: Global convergence in plant functioning. Proc. Natl. Acad. Sci. USA 1997, 94, 13730–13734. [Google Scholar] [CrossRef] [PubMed]
- Wright, I.J.; Reich, P.B.; Westoby, M.; Ackerly, D.D.; Baruch, Z.; Bongers, F.; Cavender-Bares, J.; Chapin, T.; Cornelissen, J.H.; Diemer, M. The worldwide leaf economics spectrum. Nature 2004, 428, 821–827. [Google Scholar] [CrossRef] [PubMed]
- Cernusak, L.A.; Winter, K.; Dalling, J.W.; Holtum, J.A.M.; Jaramillo, C.; Korner, C.; Leakey, A.D.B.; Norby, R.J.; Poulter, B.; Turner, B.L.; et al. Tropical forest responses to increasing atmospheric CO2: Current knowledge and opportunities for future research. Funct. Plant Biol. 2013, 40, 531–551. [Google Scholar] [CrossRef]
- Malhi, Y. The productivity, metabolism and carbon cycle of tropical forest vegetation. J. Ecol. 2012, 100, 65–75. [Google Scholar] [CrossRef]
- Peters, E.B.; Wythers, K.R.; Zhang, S.; Bradford, J.B.; Reich, P.B. Potential climate change impacts on temperate forest ecosystem processes. Can. J. For. Res. 2013, 43, 939–950. [Google Scholar] [CrossRef]
- Leakey, A.; Scholes, J.; Press, M. Physiological and ecological significance of sunflecks for dipterocarp seedlings. J. Exp. Bot. 2005, 56, 469–482. [Google Scholar] [CrossRef] [PubMed]
- Iverson, L.R.; McKenzie, D. Tree-species range shifts in a changing climate: Detecting, modeling, assisting. Landsc. Ecol. 2013, 28, 879–889. [Google Scholar] [CrossRef]
- Janzen, D.H. Why mountain passes are higher in the tropics. Am. Nat. 1967, 233–249. [Google Scholar] [CrossRef]
- Ellsworth, D.S.; Reich, P.B. Canopy structure and vertical patterns of photosynthesis and related leaf traits in a deciduous forest. Oecologia 1993, 96, 169–178. [Google Scholar] [CrossRef] [PubMed]
- Ellsworth, D.S.; Reich, P.B. Leaf mass per area, nitrogen content and photosynthetic carbon gain in Acer saccharum seedlings in contrasting forest light environments. Funct. Ecol. 1992, 423–435. [Google Scholar] [CrossRef]
- Elser, J.J.; Bracken, M.E.; Cleland, E.E.; Gruner, D.S.; Harpole, W.S.; Hillebrand, H.; Ngai, J.T.; Seabloom, E.W.; Shurin, J.B.; Smith, J.E. Global analysis of nitrogen and phosphorus limitation of primary producers in freshwater, marine and terrestrial ecosystems. Ecol. Lett. 2007, 10, 1135–1142. [Google Scholar] [CrossRef] [PubMed]
- Reich, P.B.; Walters, M.B.; Ellsworth, D.S.; Uhl, C. Photosynthesis-nitrogen relations in Amazonian tree species. Oecologia 1994, 97, 62–72. [Google Scholar] [CrossRef] [PubMed]
- Stitt, M. The flux of carbon between the chloroplast and cytoplasm. In Plant Physiology, Biochemistry and Molecular Biology; Longmans: London, UK, 1997; pp. 382–400. [Google Scholar]
- Rychter, A.M.; Rao, I. Role of phosphorus in photosynthetic carbon metabolism. Handb. Photosynth. 2005, 2, 123–148. [Google Scholar]
- Bassow, S.L.; Bazzaz, F.A. Intra-and inter-specific variation in canopy photosynthesis in a mixed deciduous forest. Oecologia 1997, 109, 507–515. [Google Scholar] [CrossRef] [PubMed]
- Hidaka, A.; Kitayama, K. Relationship between photosynthetic phosphorus-use efficiency and foliar phosphorus fractions in tropical tree species. Ecol. Evol. 2013, 3, 4872–4880. [Google Scholar] [CrossRef] [PubMed]


| Site | Species Measured | Species Code | Elevation (m) | MAP (mm) | MAGT (°C) | Tower Height (m) |
|---|---|---|---|---|---|---|
| Temperate Deciduous | Acer saccharum | Acer | 189 | 879 | 17.4 | 19 |
| Tropical Moist | Ocotea leucoxylon | Oco | 122 | 1295 | 25.5 | 25 |
| Guarea guidonia | Gua | |||||
| Castilla elastica | Cas | |||||
| Tropical Wet | Dacryodes excelsa | Dac | 361 | 3936 | 24.8 | 24.7 |
| Species/Forest | n | Topt | Aopt |
|---|---|---|---|
| Acer | 23 | 27.4(0.4)b | 7.31(0.55)b |
| Oco | 6 | 30.3(0.5)a | 11.51(0.96)a |
| Gua | 4 | 29.5(0.8)ab | 7.03(3.03)ab |
| Cas | 14 | 30.0(0.4)a | 9.88(0.65)a |
| Dac | 12 | 29.9(0.9)a | 4.90(0.59)b |
| Temperate Deciduous | 23 | 27.4(0.4)B | 7.31(0.55)A |
| Tropical Moist | 24 | 30.0(0.3)A | 9.76(0.69)B |
| Tropical Wet | 12 | 29.9(0.9)A | 4.90(0.59)A |
| Species/Forest | n | LMA | Parea | Pmass | Narea | Nmass |
|---|---|---|---|---|---|---|
| Acer | 23 | 44.5(3.3)c | 0.085(0.005)b | 1.72(0.04)a | 0.94(0.07)c | 21.2(0.7)b |
| Oco | 6 | 114.7(11.8)ab | 0.104(0.014)ab | 0.88(0.06)c | 2.93(0.34)a | 25.5(1.0)ab |
| Gua | 4 | 77.7(8.6)abc | 0.140(0.005)a | 1.85(0.15)a | 2.16(0.27)ab | 29.2(4.8)a |
| Cas | 14 | 87.7(11.7)b | 0.118(0.010)a | 1.43(0.07)b | 2.21(0.30)ab | 25.1(0.5)a |
| Dac | 12 | 122.0(10.3)a | 0.096(0.007)ab | 0.80(0.03)c | 1.73(0.13)b | 14.6(0.7)c |
| Temperate Deciduous | 23 | 44.5(3.3)C | 0.085(0.005)B | 1.72(0.04)A | 0.94(0.07)C | 21.2(0.7)B |
| Tropical Moist | 24 | 92.8(7.9)B | 0.118(0.007)A | 1.36(0.08)B | 2.38(0.21)A | 25.9(0.9)A |
| Tropical Wet | 12 | 122.0(10.3)A | 0.096(0.007)AB | 0.80(0.03)C | 1.73(0.13)B | 14.6(0.7)C |
| Height | LMA | Parea | Pmass | Narea | Nmass | |
|---|---|---|---|---|---|---|
| Temperate Deciduous | R2 | 0.72 | 0.062 | 0.14 | 0.76 | 0.03 |
| p-value | <0.001 *** | <0.001 *** | 0.13 ns | <0.001 *** | 0.42 ns | |
| n | 23 | 17 | 17 | 23 | 23 | |
| slope | 2.00 | 0.004 | −0.02 | 0.04 | 0.09 | |
| intercept | 19.9 | 0.01 | 2.03 | 0.41 | 20.1 | |
| Tropical Moist | R2 | 0.44 | 0.03 | 0.5 | 0.36 | 0.06 |
| p-value | <0.001 ** | 0.42 ns | <0.001 *** | <0.001 *** | 0.26 ns | |
| n | 24 | 24 | 24 | 24 | 24 | |
| slope | 5.2 | 0.001 | −0.05 | 0.12 | −0.20 | |
| intercept | 4.60 | 0.10 | 2.34 | 0.29 | 29.3 | |
| Tropical Wet | R2 | 0.49 | 0.30 | 0.17 | 0.37 | 0.14 |
| p-value | 0.02 * | 0.08 ns | 0.21 ns | 0.05 * | 0.28 ns | |
| n | 11 | 11 | 11 | 11 | 11 | |
| slope | 4.10 | 0.002 | −0.01 | 0.002 | −0.23 | |
| intercept | 50.1 | 0.05 | 0.94 | 1.80 | 18.7 |
| ln (DIFN) | LMA | Parea | Pmass | Narea | Nmass | |
|---|---|---|---|---|---|---|
| Temperate Deciduous | R2 | 0.41 | 0.25 | 0.00 | 0.49 | 0.04 |
| p-value | 0.001 *** | 0.039 ns | 0.94 ns | <0.001 *** | 0.37 ns | |
| n | 23 | 17 | 17 | 23 | 23 | |
| slope | 5.39 | 0.01 | 0.002 | 0.12 | 0.36 | |
| intercept | 60.5 | 0.005 | 1.72 | 1.30 | 22.3 | |
| Tropical Moist | R2 | 0.04 | 0.02 | 0.02 | 0.01 | 0.02 |
| p-value | 0.37 ns | 0.50 ns | 0.47 ns | 0.65 ns | 0.45 ns | |
| n | 24 | 24 | 24 | 24 | 24 | |
| slope | 6.39 | 0.004 | −0.05 | 0.08 | −0.58 | |
| intercept | 107 | 0.12 | 1.20 | 2.56 | 24.6 | |
| Tropical Wet | R2 | 0.56 | 0.31 | 0.27 | 0.01 | 0.37 |
| p-value | 0.01 ** | 0.07 ns | 0.10 ns | 0.81 ns | 0.05 * | |
| n | 11 | 11 | 11 | 11 | 11 | |
| slope | 15.5 | 0.01 | −0.03 | −0.02 | −0.80 | |
| intercept | 154 | 0.11 | 0.72 | 1.86 | 13.0 |
© 2018 by the authors. Licensee MDPI, Basel, Switzerland. This article is an open access article distributed under the terms and conditions of the Creative Commons Attribution (CC BY) license (http://creativecommons.org/licenses/by/4.0/).
Share and Cite
Mau, A.C.; Reed, S.C.; Wood, T.E.; Cavaleri, M.A. Temperate and Tropical Forest Canopies are Already Functioning beyond Their Thermal Thresholds for Photosynthesis. Forests 2018, 9, 47. https://doi.org/10.3390/f9010047
Mau AC, Reed SC, Wood TE, Cavaleri MA. Temperate and Tropical Forest Canopies are Already Functioning beyond Their Thermal Thresholds for Photosynthesis. Forests. 2018; 9(1):47. https://doi.org/10.3390/f9010047
Chicago/Turabian StyleMau, Alida C., Sasha C. Reed, Tana E. Wood, and Molly A. Cavaleri. 2018. "Temperate and Tropical Forest Canopies are Already Functioning beyond Their Thermal Thresholds for Photosynthesis" Forests 9, no. 1: 47. https://doi.org/10.3390/f9010047
APA StyleMau, A. C., Reed, S. C., Wood, T. E., & Cavaleri, M. A. (2018). Temperate and Tropical Forest Canopies are Already Functioning beyond Their Thermal Thresholds for Photosynthesis. Forests, 9(1), 47. https://doi.org/10.3390/f9010047