Article

Identifying Green Infrastructure as a Basis for an Incentive Mechanism at the Municipality Level in Biscay (Basque Country)

by
Gloria Rodríguez-Loinaz
1,2,*,
Lorena Peña
1,3,
Igone Palacios-Agundez
1,2,
Ibone Ametzaga
1,3 and
Miren Onaindia
1,3
1
UNESCO Chair in Sustainable Development and Environmental Education, University of the Basque Country—UPV/EHU, Barrio Sarriena s/n, Leioa 48940, Spain
2
Mathematics and Experimental Sciences Didactics Department, University of the Basque Country—UPV/EHU, Barrio Sarriena s/n, Leioa 48940, Spain
3
Department of Plant Biology and Ecology, University of the Basque Country—UPV/EHU, Barrio Sarriena s/n, Leioa 48940, Spain
*
Author to whom correspondence should be addressed.
Forests 2018, 9(1), 22; https://doi.org/10.3390/f9010022
Submission received: 4 December 2017 / Revised: 2 January 2018 / Accepted: 4 January 2018 / Published: 10 January 2018

Abstract

:
The contributions of green infrastructure (GI) to human well-being have been widely recognised; however, pathways for its systematic implementation are missing. Local governments can play a crucial role in the conservation of GI, and a formal recognition of this role in budgeting systems would foster the inclusion of GI in their agenda. The aim of this study is to identify the principal components of GI at the local level to form a basis for a compensatory economic scheme. We identified the principal components of GI based on the mapping of biodiversity conservation and ecosystem services provision. Furthermore, we analysed the potentiality of an incentive mechanism to promote GI based on the protection status of GI. Finally, an incentive mechanism to promote GI at the municipality level was proposed. The results showed that the GI of Biscay is mainly composed of the natural forests presented in the area, and that 50% of the principal components of the GI are not protected. Furthermore, one third of the protected principal components of the GI only has protection at the municipality level. So, we propose a Payment for Ecosystem Services (PES)-like scheme at the municipality level based on the cover of natural forests, where the objective is the conservation and promotion of the GI.

1. Introduction

The environmental problems that humanity faces due to the Global Change have become a relevant concern for decision-makers all over the world, as social and political modifications are needed to ensure life support functions and human well-being [1,2,3]. This has given rise to the inclusion of sustainable development as a major objective in political agendas. Since the concept of sustainable development first became a major concern, a number of methods, frameworks, and tools have been developed to achieve that objective. In this context, the Millennium Ecosystem Assessment (MEA) [4] has played an important role. This assessment made visible how this global change in ecosystems affects human well-being, as well as the relevance of the appropriate management of these ecosystems to ensure sustainable development [4,5]. The MEA established an innovative framework that links changes in ecosystems and human well-being through the so-called ecosystem services (ES). ES are the “benefits human populations derive, directly or indirectly, from ecosystem functions” [6] such as food, clean water, flood control, climate regulation, erosion control, and recreation [4].
Human life and well-being depend on these services; therefore, many initiatives are being developed to safeguard and enhance ES provision [7]. Among them, the Green Infrastructure Strategy launched by the European Union is one of the most relevant ones. Green infrastructure (GI) often tends to be confounded with generic ‘green space’, meaning land that is not built upon [8]. Nevertheless, GI is defined as a strategically planned network of natural and semi-natural areas, features, and green spaces in terrestrial, freshwater, coastal, and marine areas in both urban and rural landscapes, which together enhance ecosystem health and resilience, contribute to biodiversity conservation, and benefit human populations through the maintenance and enhancement of ES [9]. So, in an open landscape, not all green areas qualify as GI [7].
Landscape planning is recognised internationally as an important tool in protecting biodiversity and ES for the long term [10,11,12,13,14]. GI is already considered to be part of a more strategic approach to landscape management [15]. One of the key strengths offered by GI to landscape planners is its multifunctionality [7,8]. Incorporating the GI concept into integrated spatial planning has the potential to maintain and improve landscapes’ multifunctionality [16] and resilience, as well as provide environmental, social, and economic benefits [17,18,19] to the ecosystem-based adaptation to climate change [20,21].
Although the relevance of the use of GI as a spatial planning tool has been widely recognised [22,23], and GI investments have been put high on the agenda in many European countries [24], the pathways for its systematic implementation are missing [3,25] and no dedicated funding is available in many regions [8]. In the absence of adequate international responses, local governments can have a pivotal role [3], as for GI planning, a fine spatial scale is needed. Local spatial planning downloads the more broadly defined national or regional plans to the terrain, and adapts them to the biophysics and social context of the area.
GI planning requires local management efforts where many local stakeholders (local administration, land owners, residents, etc.) get involved [15]; however, the benefits of GI may accrue to a larger regional or state-wide group of stakeholders [26]. Due to this scale mismatch between efforts and benefits, incentives mechanisms at the local level are needed. Initiatives, such as Payment for Ecosystem Services (PES), have gained popularity in recent years [27,28,29]. PES schemes provide a market-based mechanism where beneficiaries of well-defined ES pay service providers to promote conservation activities [30]. One of the main drawbacks of these PES schemes is that they usually follow a plot scale approach, where usually the provision of only one service is prioritised. This approach does not take into consideration the existing synergies and trade-offs between different services, nor the dependence of many ES on processes that take place at the landscape scale [11,16]. So, a change is needed, and PES should focus on the promotion of GI at the landscape level to conserve multifunctional landscapes where many different services are provided [31,32].
The MEA [4] anticipated increased degradation of GI over the next few decades, and advocated for social and political change to address this problem. To foster this transition, new tools that map, model, and evaluate GI and its benefits, as well as incentive mechanisms, are needed [33]. So, the aim of this study is to identify the principal components of GI at the local level to form a basis for a compensatory economic scheme. In this framework, three objectives were established: (a) to define a methodology to map the principal components of GI at the local (Biscay province) level; (b) to investigate the potentiality of a PES scheme to protect and promote GI; and (c) to propose a financial incentive mechanism at the municipality level for the conservation and recovery of their GI. This case study was carried out in Biscay (the Basque Country).

2. Materials and Methods
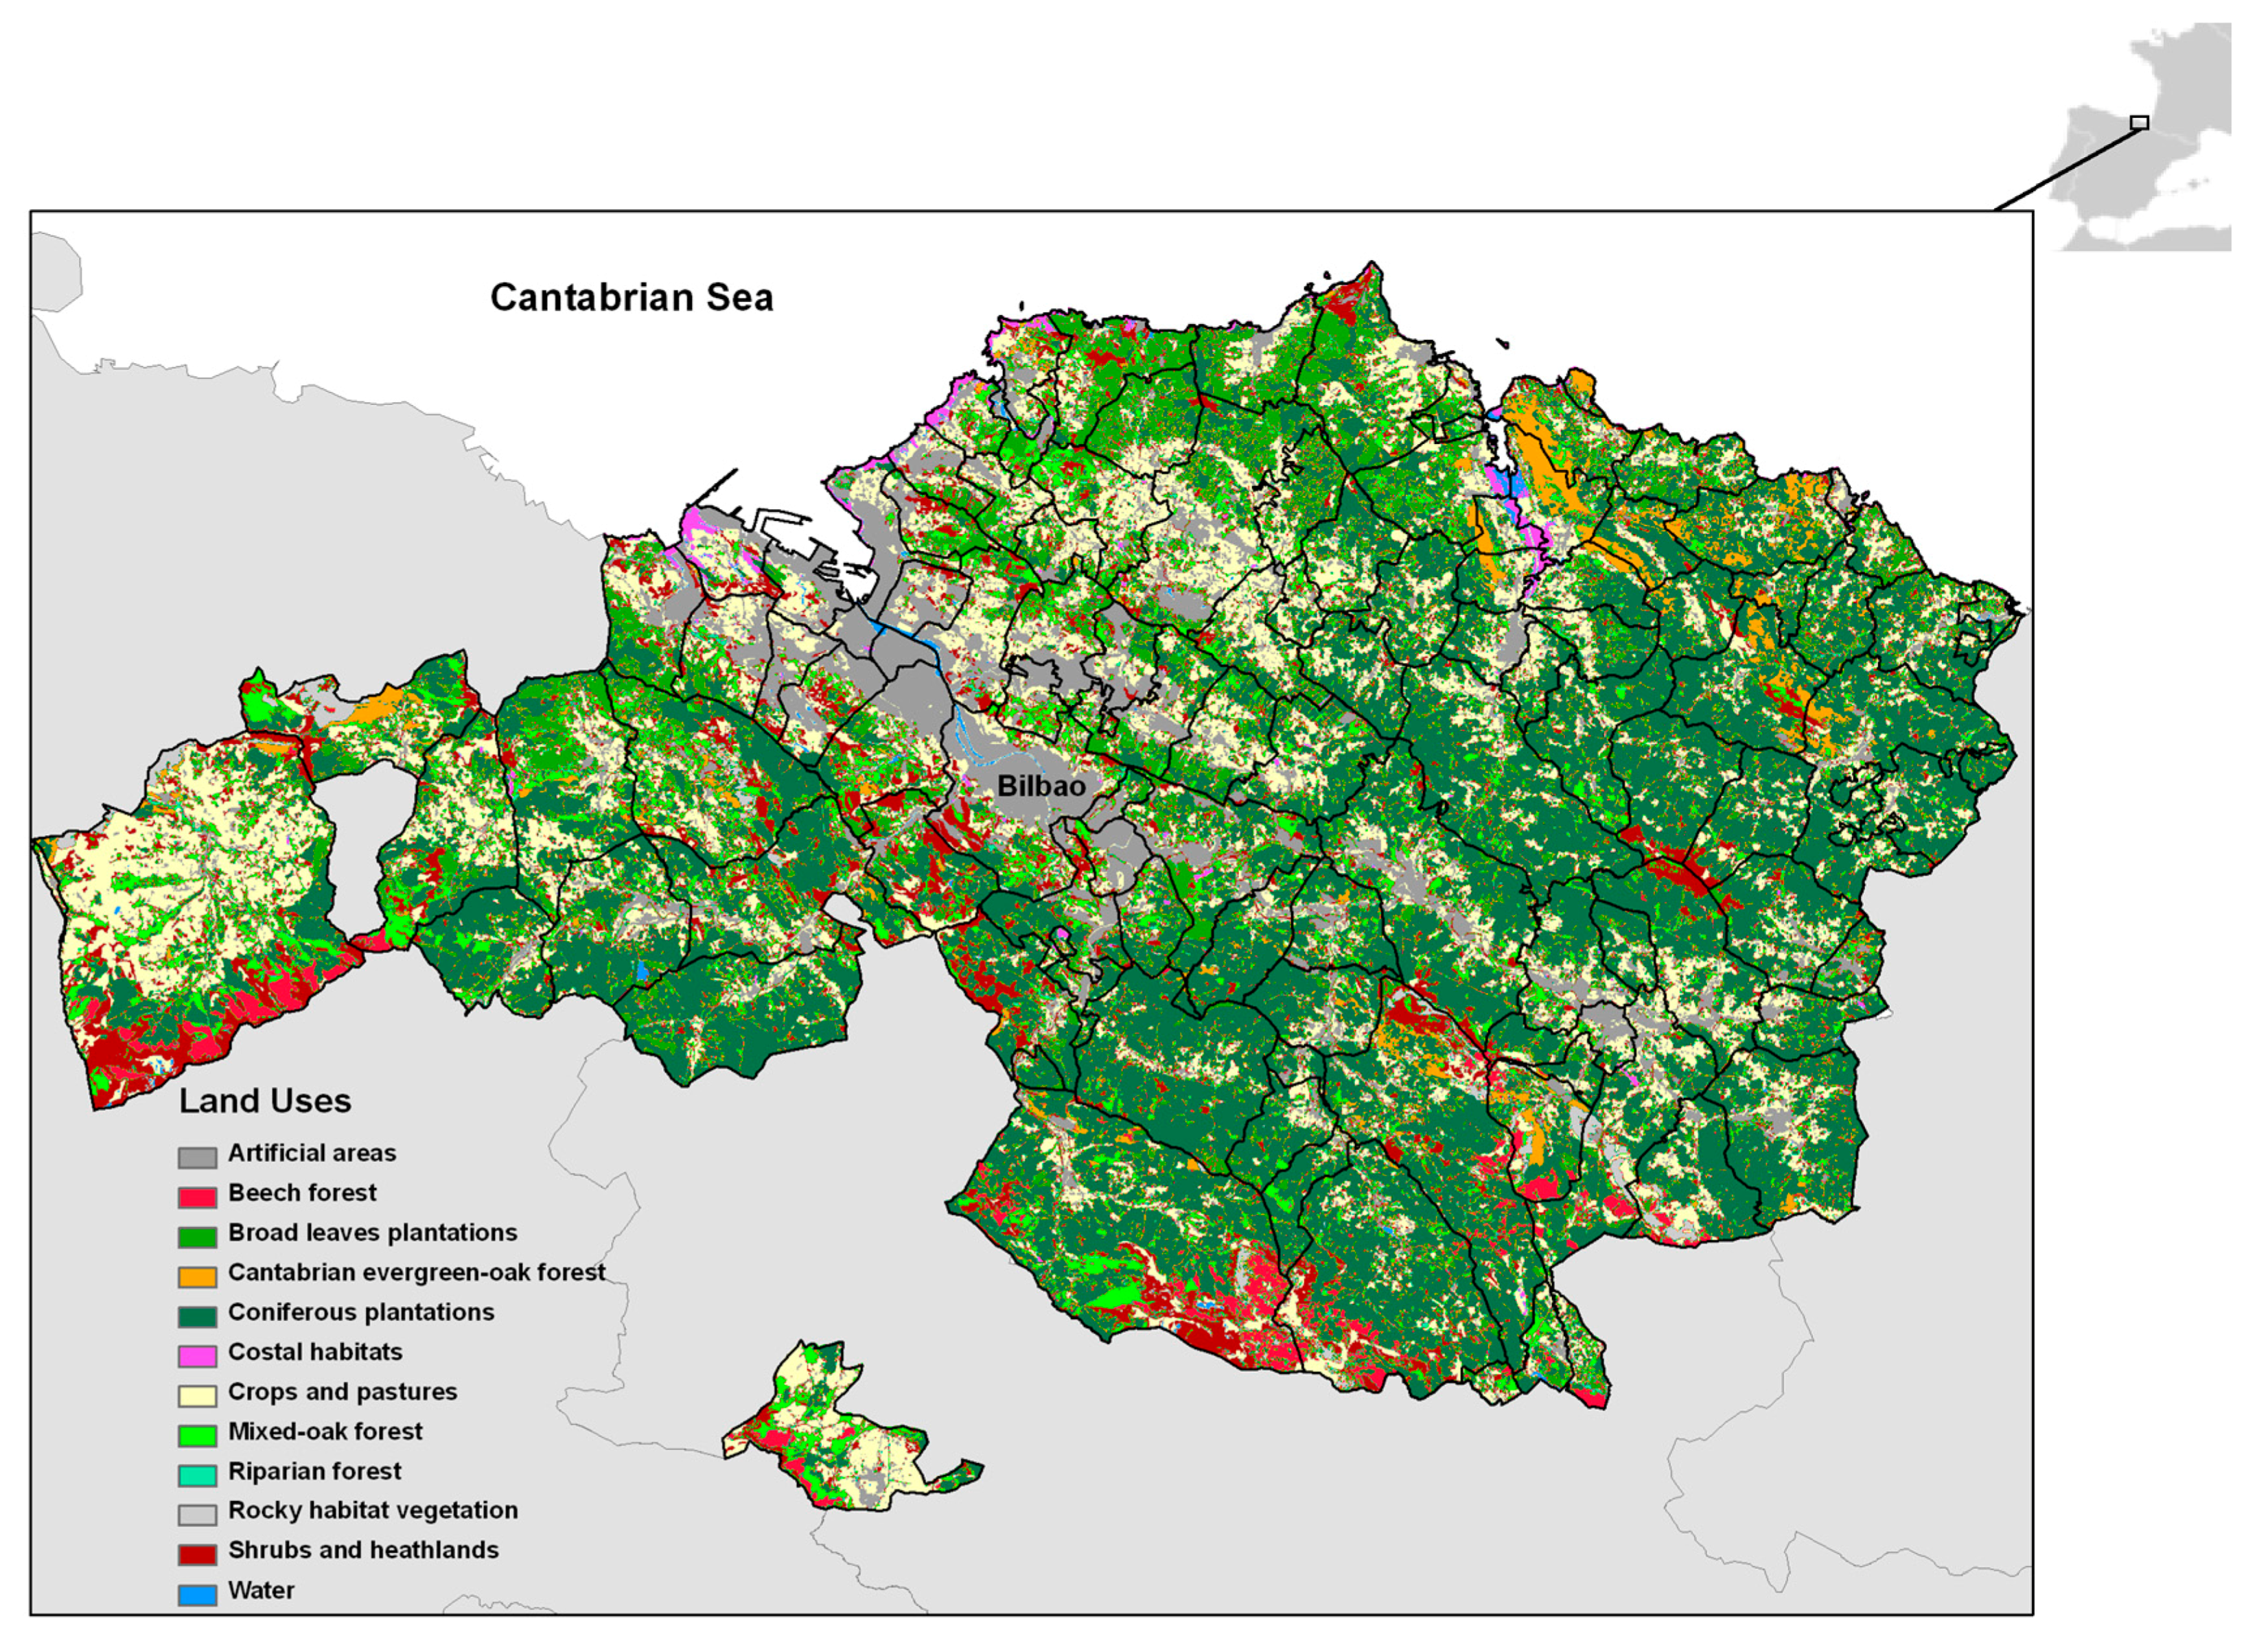
2.1. Study Area

This study was carried out in the Biscay province (area 2.213 km2), located in the north of the Iberian Peninsula (43°46′ N to 42°92′ N, 03°45′ W to 02°40′ W). It comprises 113 municipalities, where the 1,140,000 inhabitants presented are not homogeneously distributed, with most of them concentrated in a large nucleus around the city of Bilbao, the capital of the province (Figure 1).
The region has a temperate and humid climate and a mountainous topography; in half of the territory there are slopes >30%, and the altitude varies from 0 to 1500 m above sea level. The main primary forest types in Biscay are Cantabrian evergreen oak forests (Quercus ilex L.), mixed oak forests (Quercus robur L.), and beech forests (Fagus sylvatica L.). These forests, which we will refer to as “natural forest”, are the potential vegetation of approximately 80% of the region, but today they only cover 13% of the area, while timber plantations cover 45%, and crops and pastures cover 21% [34] (Figure 1).

2.2. Assessment of the GI

The assessment of the principal components of the GI of Biscay was based on the mapping of biodiversity conservation and the supply of eight ES: provisioning services (food production, timber production, water supply), regulating services (pollination, flood control, carbon storage), and cultural services (recreation and aesthetic beauty). These services were selected due to their relevance on the study area and the availability of data for the mapping.

2.2.1. Mapping of Biodiversity and Ecosystem Services

A GIS-based approach was designed to spatially estimate the contribution of the different land uses to biodiversity conservation and the eight ES studied. The software used for the geoprocessing was ArcGIS 9.3 [35], and the base data of land uses utilised for the mapping was the European Nature Information System (EUNIS) map, scale 1:10,000, of the Basque Country for the year 2009 [36].
Biodiversity conservation and ES were mapped as five ranges: very high contribution, high, medium, low, and very low/null. These ranges were defined using Jenks’ natural breaks distribution [7,37], except for biodiversity conservation and timber production (see below).

Biodiversity Conservation

Following Onaindia et al. [37], biodiversity conservation was mapped as a function of plant richness, successional level, and the existence of a legally protected feature.
B = f(r, q, p),
where B = Biodiversity; r = richness, as the number of native plant species; q = the habitat quality (successional level); and p = the degree to which the land is legally protected.
The number of vascular plant species in each land use was calculated based on the literature [37], and plotted on a scale from 1 to 4, where: >65 = 4; 45–65 = 3; 25–45 = 2; and <25 = 1. The succession level valued as follows: 4 = forests and coastal habitats, 3 = bushes, 2 = grasslands, and 1 = others. Finally, the values for legal protection were: 1, legally protected by European directives; and 0, non-protected.
To define five ranges, the maximum value obtained in the area was divided into five equal thresholds.

Food Production

For food production, we mapped the productivity of the land as follows:
FP = AP/AS,
in the case of crops; where FP = food productivity (Tm food/ha); AP = agricultural production (Tm); and AS = surface of agricultural areas (ha).
FP = MP/PS,
in the case of pastures; where FP = food productivity (Tm food/ha); MP = meat production (Tm); and PS = surface of pasture (ha).
The productions and surfaces of the different crops and livestock were obtained from the Statistic Institute of the Basque Country [38].
In this case, as the EUNIS map does not distinguish between different productions, the base map of land uses was adapted using the vegetation map of the area [39], where different productions such as potatoes, beetroot, and cereals are mapped.

Timber Production

To map timber production, we used the net annual growth [40] of timber plantations. The data was obtained from the Forest Inventory of the Basque Country [34]. It can be argued that the use of this index could be an overestimation of timber production, as the annual growth is higher than the annual volume felled. However, as it has been previously mentioned, we are mapping the service supply. The use of the annual volume felled would be appropriate to map the demand of the service.
Once the net annual growth of timber plantations was mapped, three ranges—very high, high, and medium—were determined using the Jenks’ natural breaks distribution. A low value of the service was assigned to natural forests without taking into account their net annual growth, as they are not exploited for timber production; and a null value was assigned to the non-forest ecosystems.

Water Supply

The water supply calculation was based on the TETIS model developed for the region [41], whereby the volume of water produced by the area is determined primarily by: (a) the rainfall patterns, which depend mainly on the regional climate and topography; and (b) the ecosystems, which also play a key role, as they regulate evapotranspiration. Thus, water supply was calculated as follows:
R = PETc,
where R is the annual water flow (mm year−1), P is the annual rainfall (mm year−1), and ETc is the corrected annual potential evapotranspiration (mm year−1). The potential evapotranspiration was modified by correction factors for the different vegetation types to obtain a more realistic value for the evapotranspiration. The correction factors used were those in the InVEST—Integrated Valuation of Ecosystem Services and Tradeoffs programme (Stanford University: Stanford, CA, USA; University of Minnesota: Minneapolis, MN, USA) [42]. The annual potential evapotranspiration and annual rainfall maps were supplied by the Water Information System of the Ministry of Agriculture, Food, and Environment of Spain, and obtained through the SIMPA—the Spanish acronym meaning “Integrated System for Rainfall-Runoff Modeling”— model [43].

Pollination

For pollination, we estimated an index of the likely abundance of pollinator species nesting on each cell in the landscape, given the availability of nesting sites and food resources nearby, and the foraging distance for pollinators. To calculate this index, we used version 2.6.0 of the InVEST programme [42]. The data of nesting site and flower availability for each land use and data of foraging distance for pollinators were calculated based on the literature [44,45].

Flood Control

For flood control service, we used as a proxy the maximum potential retention of rainwater from the different land uses in a river basin, based on the empirical curve number method [46,47], which is calculated by the following formula:
S = (254,100/CN) − 254,
where S = the maximum potential retention of rainwater from the ecosystems (mm) and CN = the curve number (without units). The curve number (CN) is a hydrological parameter that is determined by the permeability of soil and vegetation cover. In addition, the effect of the slope was also introduced, an amendment made by the Centre for Hydrographical Studies of Spain (CEDEX) [48].
The CN data for the different combinations of land use, slope, and soil type was obtained from the tables prepared by the CEDEX [48]. The slope map was obtained from the Laser Imaging Detection and Ranging—LIDAR flights for 2013, with a resolution of 25 m [49]. The hydrological soil group map was obtained by the reclassification of the soil map of the Basque Government based on the soil permeability.

Carbon Storage

Following Onaindia et al. [37], we estimated the amount of carbon stored in the biomass and soil for the different land uses. For the valuation of carbon stored in the soil, we used the “Inventory of organic carbon stored in the first 30 cm of the soil” of the Basque Country [50]. As for carbon stored as biomass, we focussed on the carbon stored in living trees (aboveground and belowground), which was obtained as follows [51]:
CB = V × BEF × (1 + R) × D × CF,
where CB = the C stocks in living biomass (TmC ha−1); V = the merchantable volume (m3 ha−1); BEF = the biomass expansion factor, including branches and leaves (without units); R = the root-to-shoot ratio, including belowground tree biomass (without units); D = the basic wood density (Tm d.m. m−3 merchantable volume); CF = the C fraction of dry matter (TmC Tm d.m.−1). Finally, we calculated the total C storage (biomas + soil).

Recreation Potential

Following Peña et al. [52], we considered two components for mapping recreation supply: the recreation potential and accessibility. The recreation potential was mapped taking into account five territorial features associated with aesthetic attractiveness for recreational activities: (1) the degree of naturalness; (2) the presence of natural protected areas; (3) the presence of water bodies; (4) the presence of sites of geological interest (SGI); and (5) the presence of mountain summits. We valued each feature using different data and indicators (see Table 1). Finally, the recreation potential was calculated by aggregating the values of the five features described above giving equal weights to all of them [53]. In general, ecosystems with the highest naturalness are more attractive for recreation activities [54,55,56,57], in the same way as for protected areas. Moreover, the presence of water bodies, SGI in the landscape, and mountain summits are related to a higher recreational value, as people can perform different recreational activities in them.
The delivery of services strictly depends on the presence of people in the ecosystems. In general, good accessibility and good infrastructure networks help facilitate more recreational activities [56,57]. So, accessibility was mapped considering: (1) the accessibility of the site; and (2) natural and constructed infrastructures that were in place to guide or be enjoyed by visitors. We valued each feature using different data and indicators (see Table 2). Finally, the accessibility was calculated by aggregating the values of the two features described above, and giving equal weights to both of them [53].
Finally, the recreation service was calculated by aggregating the values of the recreation potential and accessibility, and giving equal weights to both of them.

Aesthetic Beauty

The aesthetic enjoyment of landscapes that the environment provides to society depends on both the aesthetic perception of the society and the intrinsic characteristics of the landscapes. Therefore, the aesthetic enjoyment of landscape was mapped taking into account six features associated with aesthetic attractiveness: (1) the social perception; (2) the type of relief; (3) the diversity of landscape; (4) the presence of water bodies; (5) the influence of landmarks; and (6) the influence of negative elements in the landscapes. We valued each feature using different data and indicators (see Table 3). In general, the presence of water bodies and/or landmarks in the environmental unit [57,59,60], a higher diversity of landscapes, and a higher difference in relief [61,62,63,64] were related to a higher aesthetic value [65]; however, the influence of negative elements in the landscapes as wind farms, actives quarries, landfills, roads, and railroads were related to a lower aesthetic value. The social perception was calculated using the visual survey method described in Peña et al. [52]. For assessing the type of relief and the diversity of landscape, we used viewshed as a quantification unit. Viewshed can be considered a unit for describing the territory based on visibility criteria, because it consists of the set of intervisible points [66]. Finally, the aesthetic beauty was calculated by aggregating the values of the first five features described above and subtracting the value of the influence of negative elements in the landscapes, giving equal weights to all of them.

2.2.2. Identification of the Principal Components of GI

The definition of GI is so broad that GI often tends to be confounded with generic ‘green space’, meaning land that is not built upon [8]. Nevertheless, in the open landscape, not all green areas qualify as GI [7], so we identify only the principal components of the GI of the study area. We defined as “principal components of the GI” the elements of the landscape that have a high contribution to biodiversity conservation and high contribution to at least three ES. These elements meet the criteria regarding the multifunctionality and biodiversity conservation of GI.
In this definition, we have considered all services to be of equal weight. It can be argued that ES will differ in the amount they contribute to human well-being—some may be extremely important and others less so—and therefore should not have the same weight in the selection process. However, the existing valuation techniques are not able to measure the real contribution of the different services to the human well-being [68]. Furthermore, the same service in the same region can be valued differently by different groups of people in the same area depending on their education level, personal income, previous experience, and so on [69,70]. Usually, some services that are critical for human well-being are undervalued, because they do not have a market value or are less visible [71]. To avoid the general tendency to prioritise marketed and more visible services, we highlight the importance of conserving multifunctional elements of the landscapes through considering all services to be of equal weight.
To identify these principal elements of the GI, a spatial multi-criteria analysis (SMCA) was used, as the integration of a landscape approach within the SMCA framework allows for this type of spatial prioritisation [33]. For this analysis, the maps of the eight ES were considered, and the map of biodiversity conservation were used. All of these maps were overlapped, and all of the elements with a high or very high value for biodiversity conservation and a high or very high value for at least three services were selected and identified as principal components of the GI.

2.3. Protection Status of the Principal Components of the GI

To analyse the necessity or potentiality of an incentive mechanism to promote GI, we studied the protection status of the principal components of the GI of Biscay. In the Basque Country, there are several protection figures: Natura2000 sites, natural parks, protected biotopes, and biosphere reserves. These areas are delimited by the Basque Government through the Territory Planning Guidelines (TPG). On a second level, the sectorial (agroforestry, wetlands, highway, etc.) and partial (15 sub-areas) territorial plans, which are fixed by the Basque and provincial governments, downscale the TPG and protect more areas. Finally, apart from the protection figures at the regional level, municipalities also have their special protection areas fixed by their municipal territorial planning [72]. In this category, municipalities include the areas protected by the supra-municipal figures and other areas relevant for biodiversity conservation at the municipality scale, giving a protection to areas that have not been protected by supra-municipality figures. In some cases, this municipal protection is more restrictive than the supra-municipal one.
For this study, we considered both municipal and supra-municipal protection figures. In the case of the Urdaibai Biosphere Reserve, we only considered the areas that have been declared as special protection or protection zones by the Governance Plan for Use and Management of the area, which was approved in 1993 [73].

3. Results

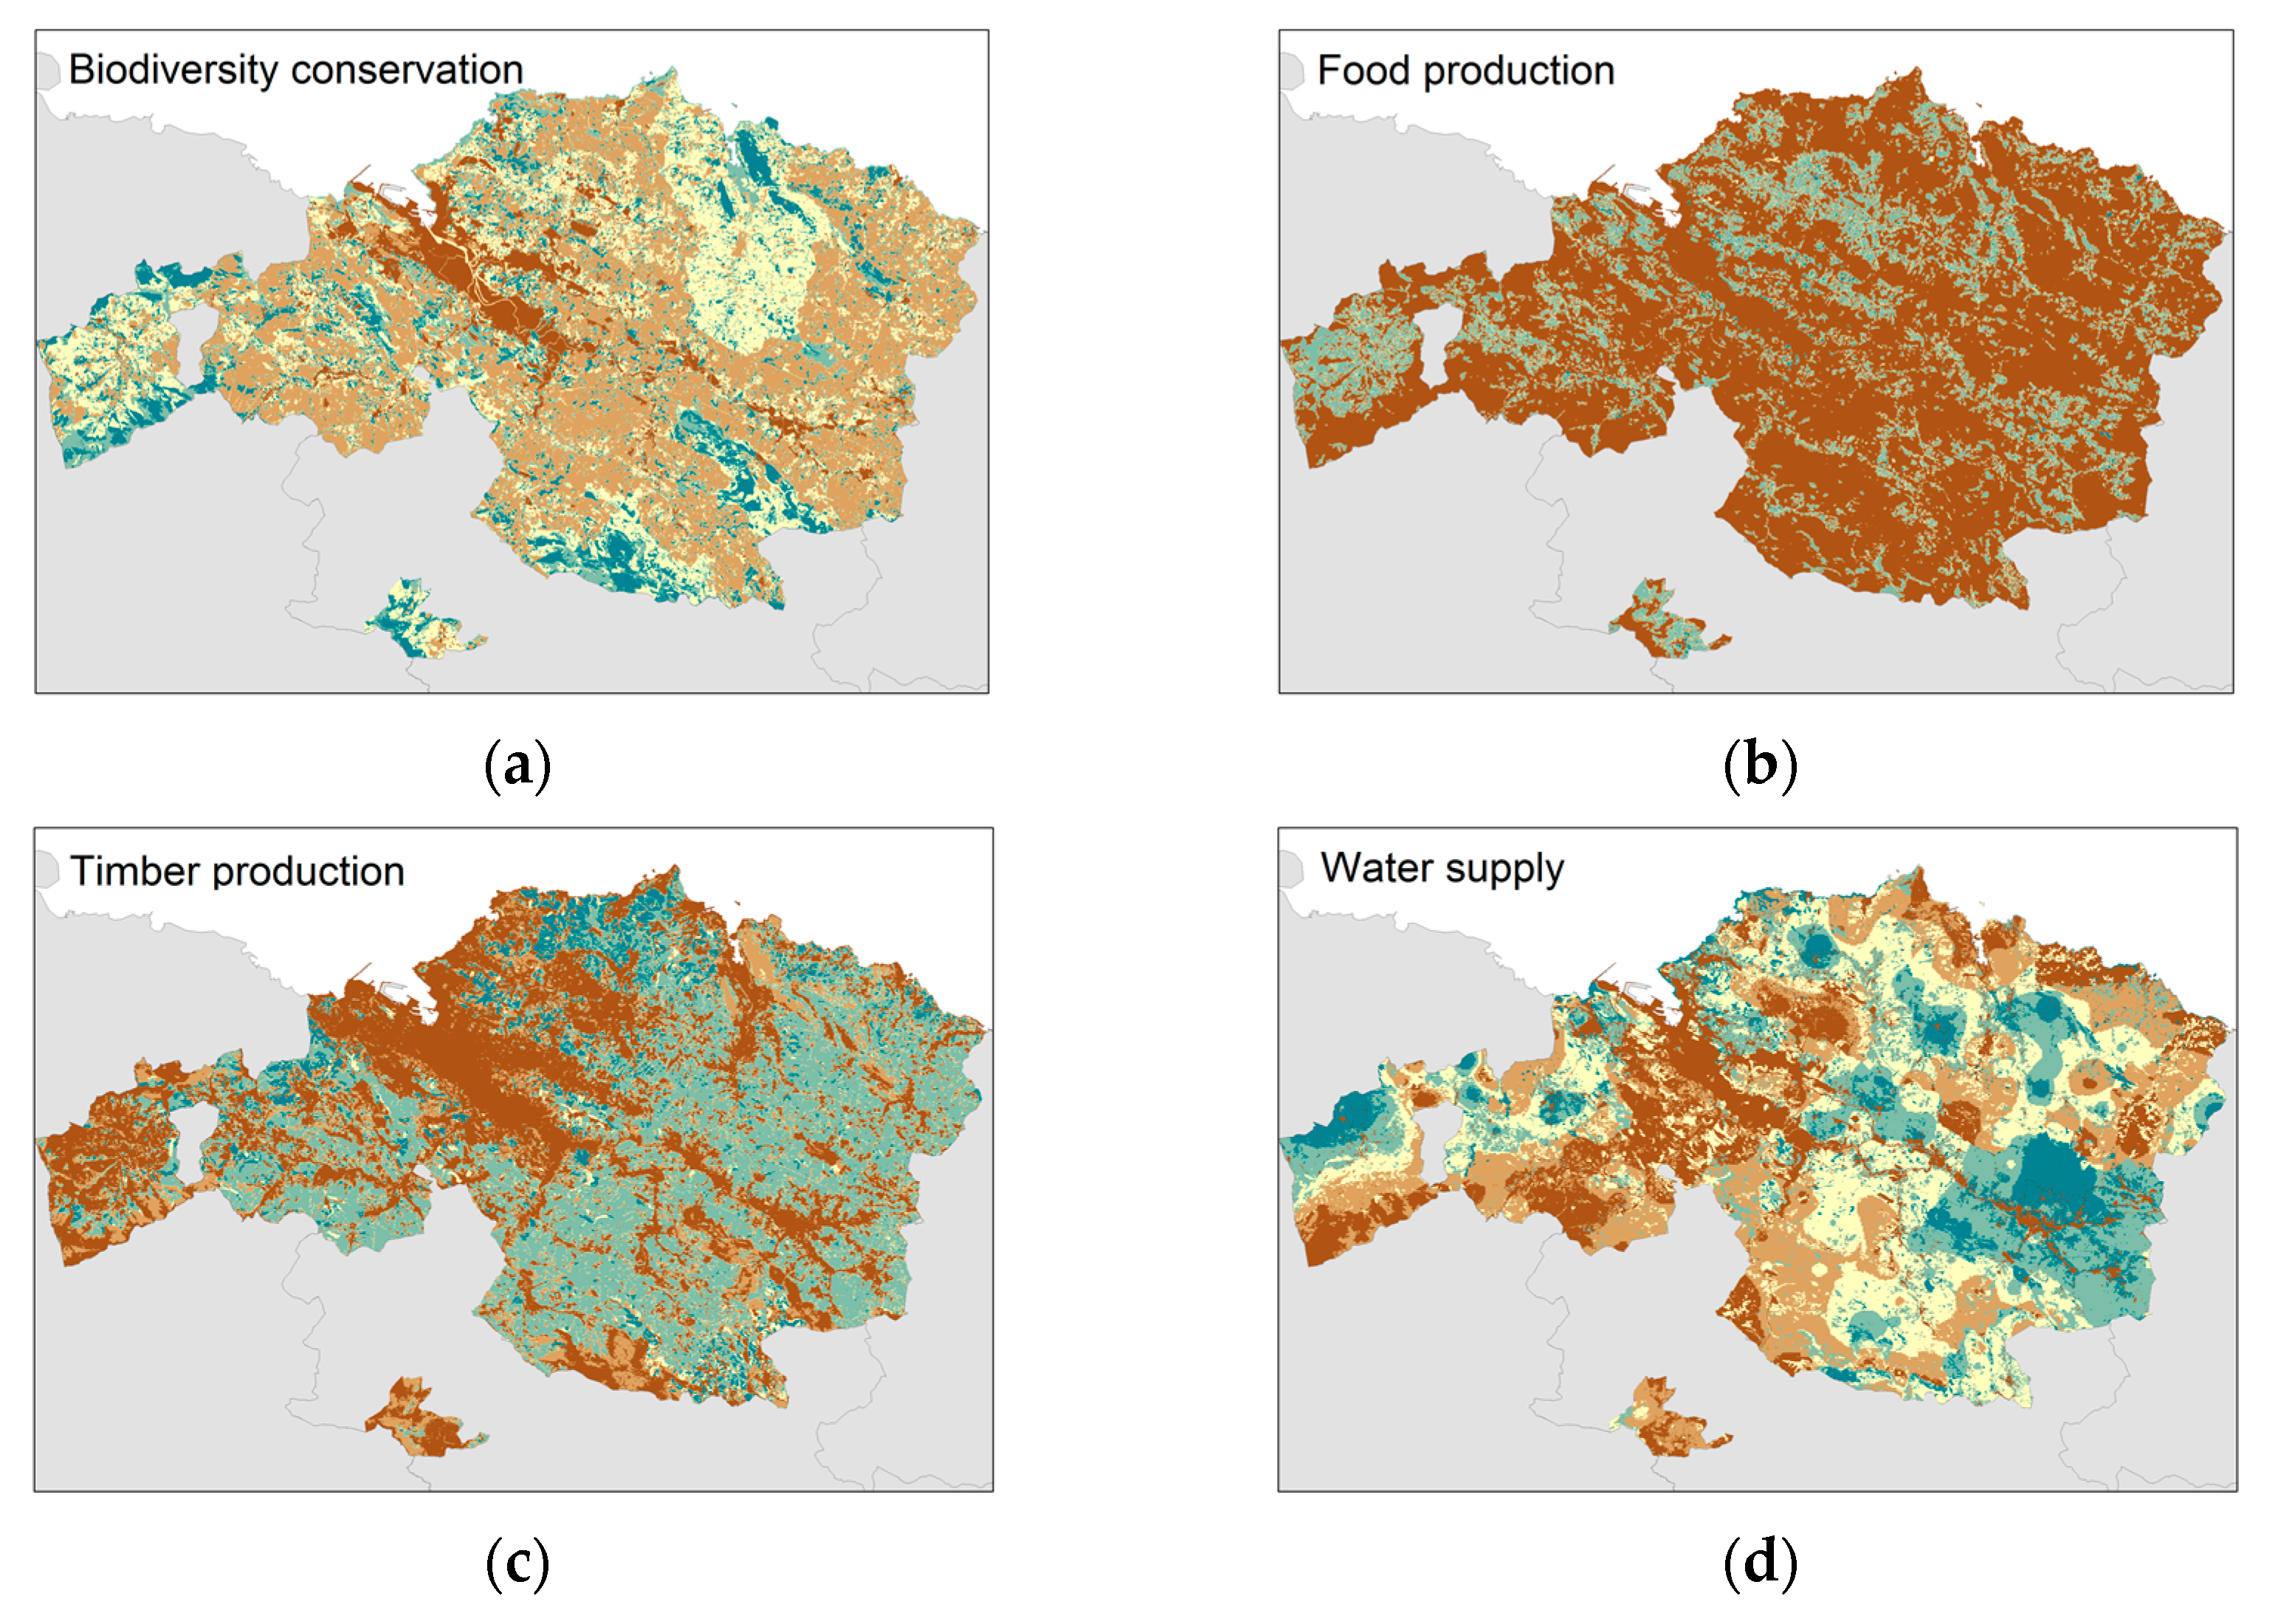
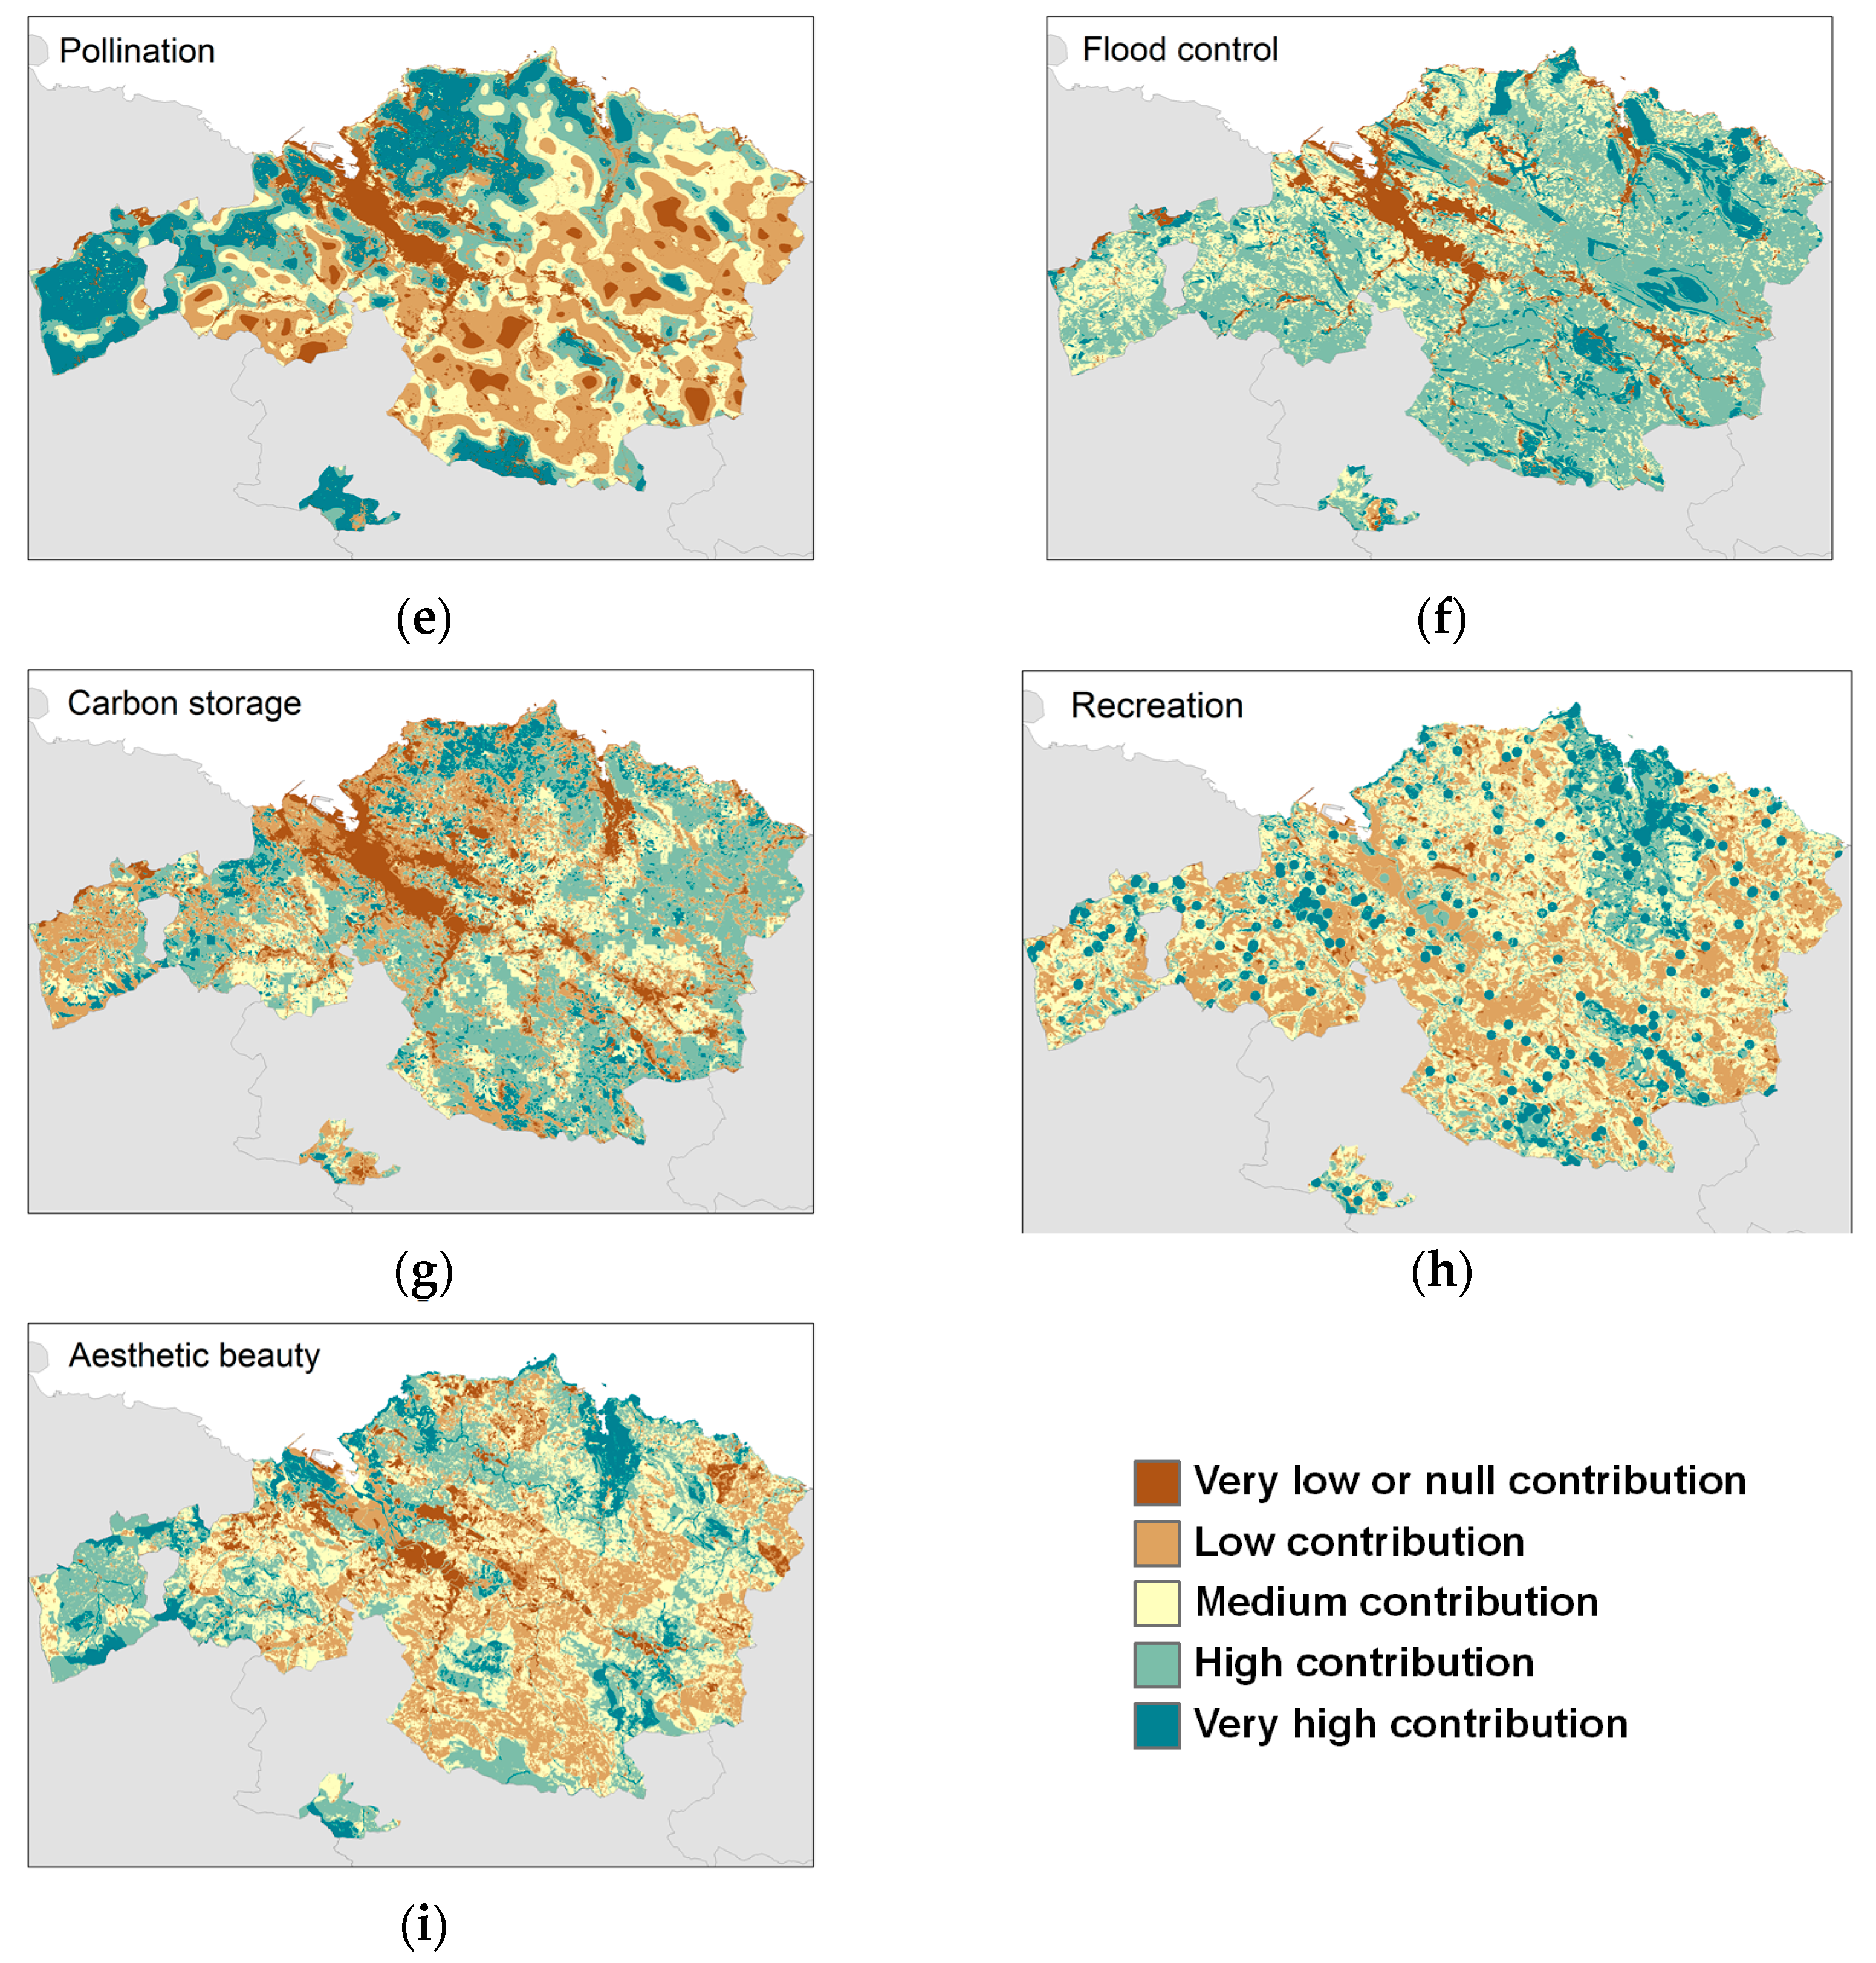
3.1. Spatial Distribution of ES Provision in Biscay

The results of the mapping procedure for biodiversity conservation have showed that 21% of the surface of Biscay has a high/very high contribution to biodiversity conservation (Figure 2). The land uses that contribute the most to biodiversity are natural forests, with 100% of them contributing in a high or very high way, followed by other natural ecosystems and shrubs and heathlands (Table 4).
For provisioning services, 20% of the area has a high/very high contribution to food production, 44% to timber production, and 31% to water supply (Figure 2). The crops and pastures (96%) are the main provider in the first case, the forest plantations (95%) in the second case, and shrubs and heathlands (69%), other natural ecosystems (60%), and crops and pastures (55%) in the last case (Table 4).
For regulating services, 37% of the area has a high/very high contribution to pollination, 63% to flood control, and 39% to carbon storage (Figure 2). The land uses that contribute the most to pollination are crops and pastures, shrubs and heathlands, and natural forest, with nearly 60% of them contributing in a high or very high way (Table 4). As for flood control and carbon storage, forest lands (natural and plantations) are the main providers (>85% and 100%, respectively) (Table 4).
Regarding cultural services, 25% of the area has a high contribution to recreation, and 33% to aesthetic beauty (Figure 2). Natural ecosystems (forest and non-forest) are the ones that contribute the most to both cultural services, with more than 65% of them contributing in a high or very high way (Table 4). As for aesthetic beauty, crops and pastures also play a key role, with nearly 65% of them having a high or very high contribution (Table 4).

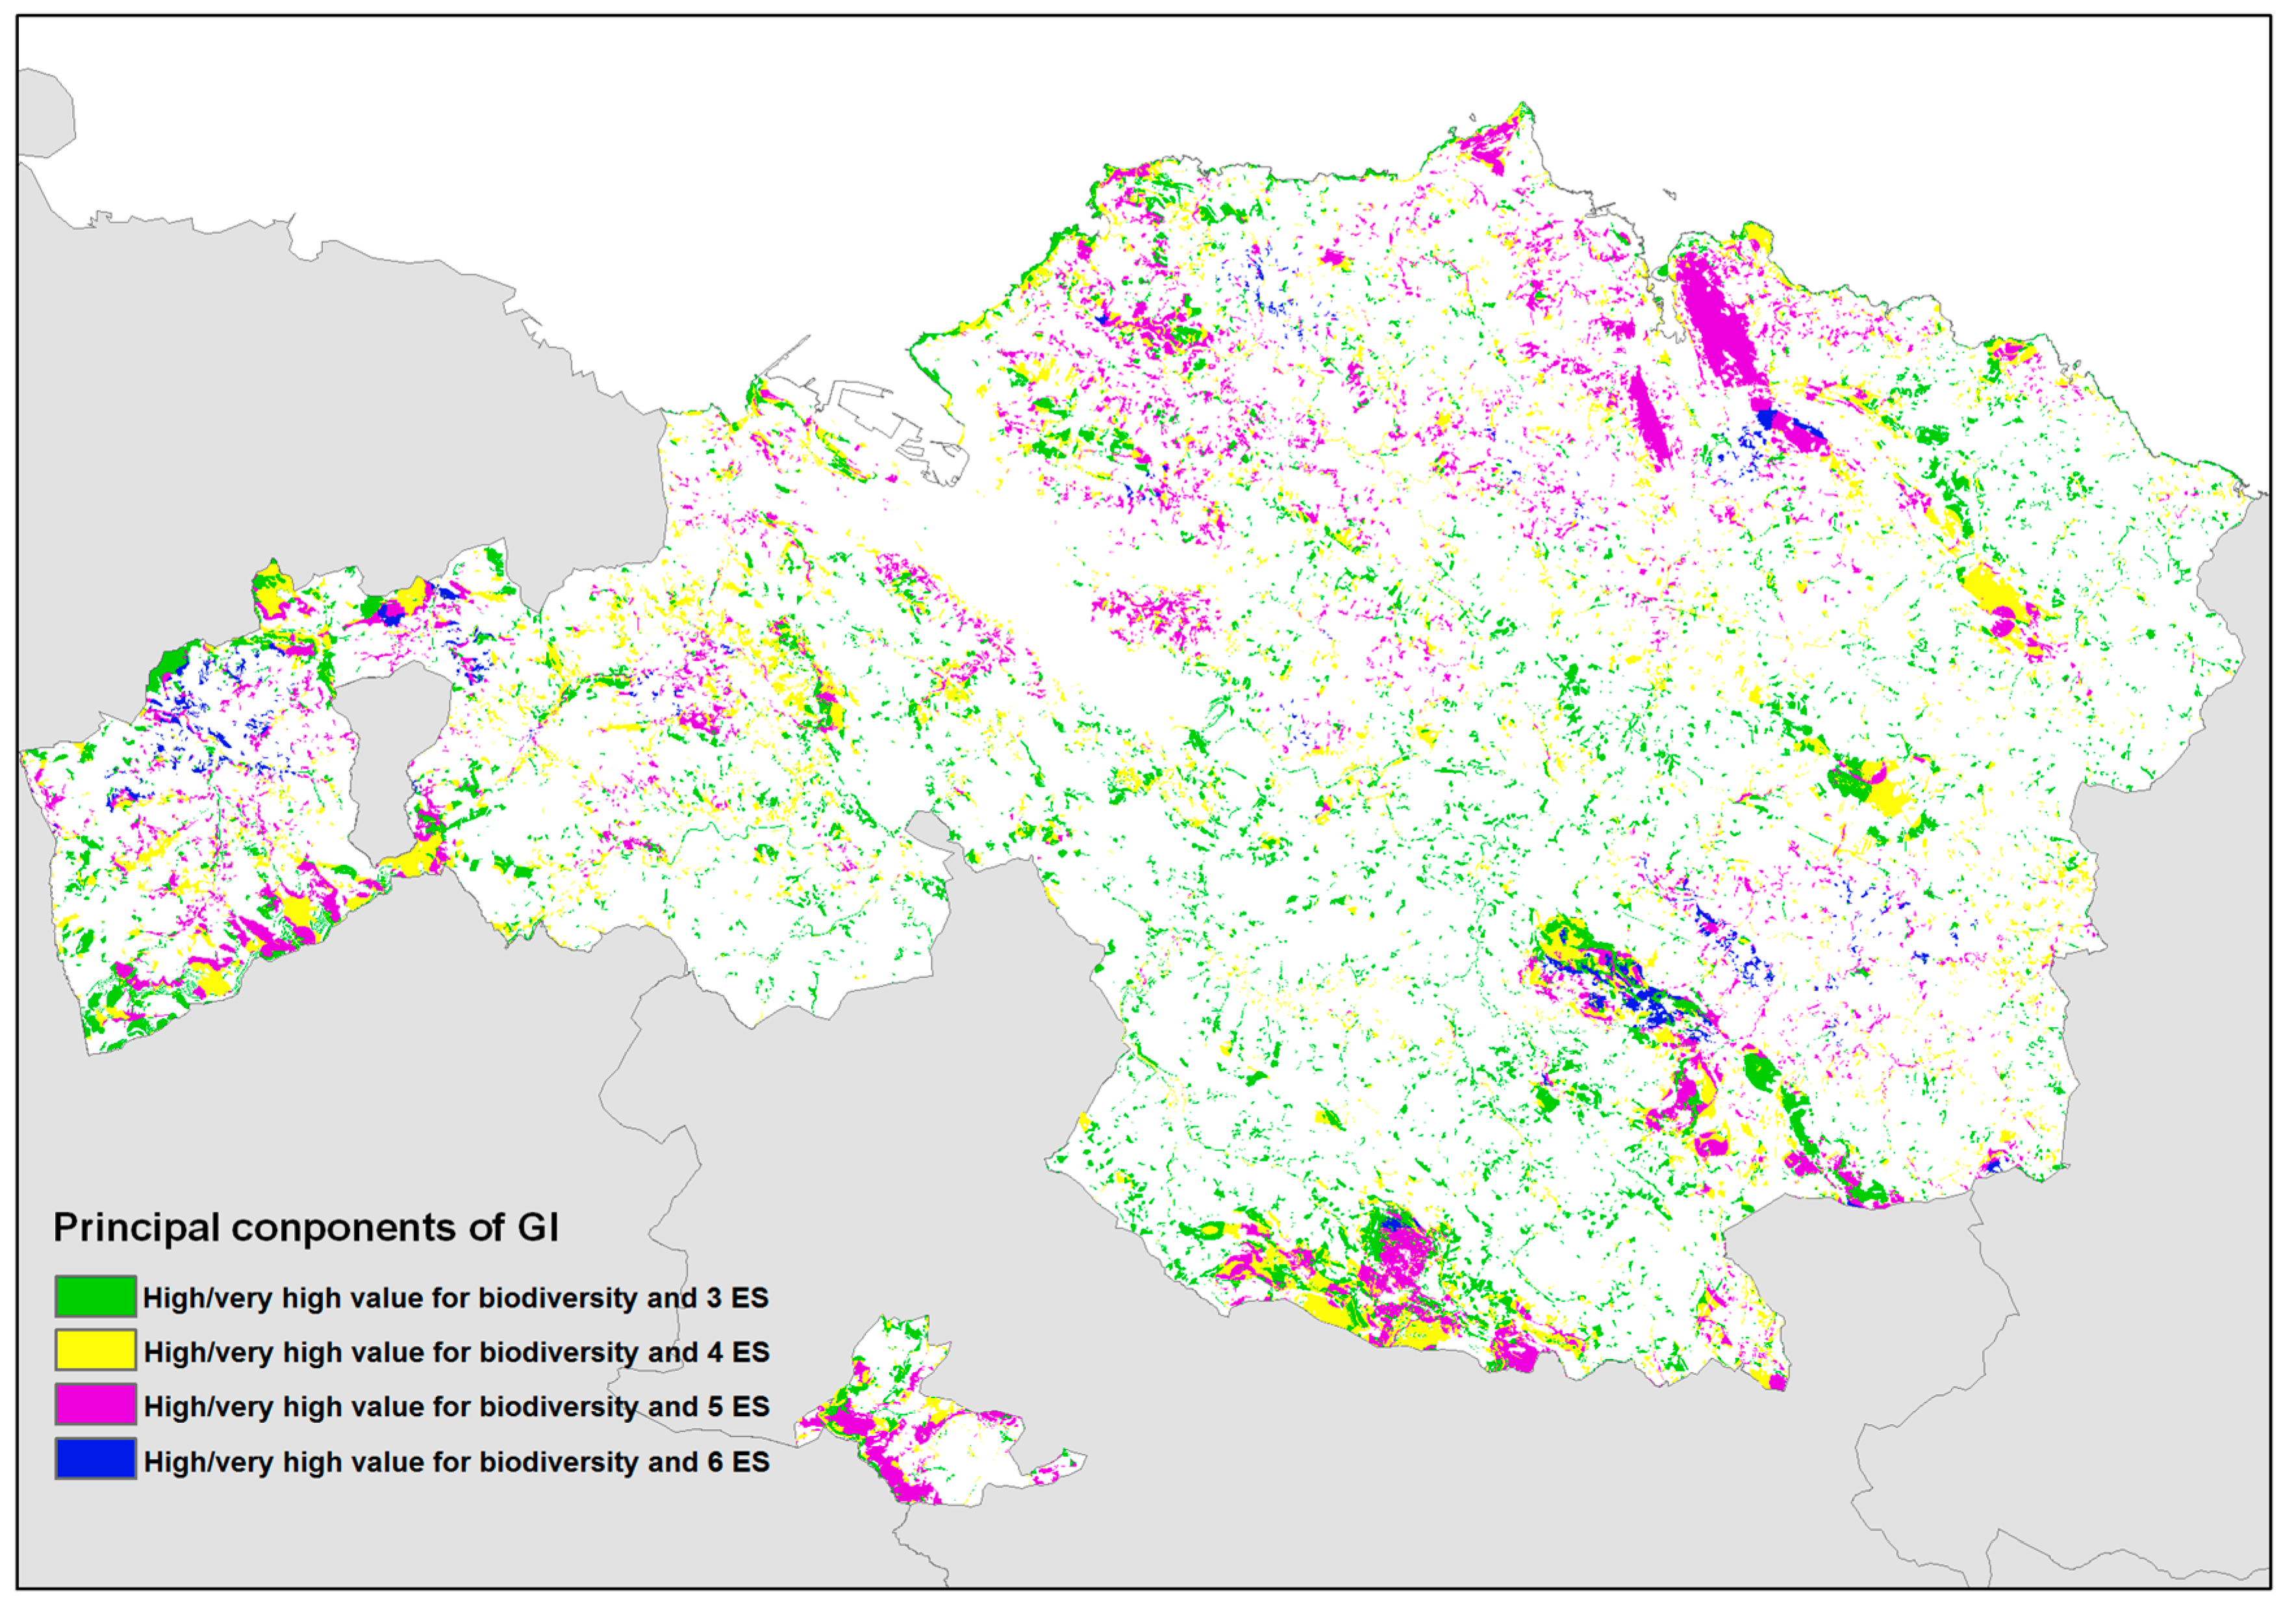
3.2. Principal Components of the GI of Biscay

The results of the SMCA have identified the principal components of the GI of Biscay that cover 16% of the territory (Figure 3). All of these elements have a high contribution to biodiversity conservation and to at least three services.
As for the services supplied by these principal components of GI, not all of them are equally presented. On one hand, provisioning services have the lowest presence, as any area with a high contribution to food or timber production is included, and only 35% of the GI has a high contribution to water supply. On the other hand, regulating and cultural services have a high presence, with 64% of the area having a high contribution to pollination, 86% to flood control, 70% to carbon sequestration, 73% to recreation, and 73% to aesthetic beauty.
Finally, in relation to the land uses that form these GIs, most of them are natural ecosystems (forest and non-forest), with shrubs and heathlands also present on 20% of the surface. It is worth mentioning that almost all of the natural forests have been identified as principal components of the GI (Table 5).

3.3. Protection Status of the GI

The results have showed that only half of the principal components of the GI described are inside areas where a protection figure exists. From them, 68% have protection at the municipality and supra-municipality levels (all of the areas protected at the supra-municipality level have to be also protected at the municipality level), but 32% of them only have protection at the municipality level. It is remarkable that in the not-protected elements, the proportion of natural forest is even higher than in the all of the principal GI, raising 83% of the area.

4. Discussion

The importance of preserving multifunctional landscapes has been previously highlighted [16,31]. The conservation of GI is crucial in order to achieve this objective. As a result, the methodology presented in this study can be a very useful tool for land planners, as it allows for identifying the most relevant elements of GI in a given area that are a prerequisite to designing a GI network at the landscape level. A similar methodology was used by Liquete et al. [7] to map GI at the European scale. However, as the authors explain, “the Pan-European case study was not designed to support the management of individual local sites”. As synergies and trade-offs between ES are produced at regional or local levels, and they may differ from those perceived at larger scales [32], Liquete et al. [7] recommend tuning up their methodology for each regional study. The methodology presented here can be a good example of downscaling of the Pan-European methodology for its adaptation to the context and available data at the local level in the Basque Country. So, the methodology presented here would be very useful for policy-makers and land managers of the area, because it provides relevant information to local scale decision-making.
Identifying, promoting, and preserving a multifunctional GI network can provide a wide range of benefits, including ecological, economic and social benefits [7,15]. As a result, many governments have policies that seek to protect designated GI from the negative impacts of development. For example, in Ontario, Canada, development is not allowed within and adjacent to significant GI, unless no negative impact to their features and functions is demonstrated [10]. The results of this study have showed that the conservation of the principal components of the GI of Biscay contribute to the maintenance of regulating and cultural services of the area. Traditionally, regulation and cultural services have been degraded as a result of actions taken to increase the supply of provisioning ES [71,74]. This has happened because, while most regulating and cultural services are external to the market system, provisioning services have a real market value [6,75]. As safeguarding non-marketed ecosystem services is crucial from both human and economic perspectives, conservation and an increment in the ecosystems that supply those services, through the planning of a GI network, is needed.

4.1. Why an Incentive Mechanism?

In the Basque Country, multiple services are supplied by the landscape; however, as most of these services are considered externalities [71,75], the municipalities that supply these services do not receive any economic compensation. In Biscay, the amount of money that each municipality receives is fixed by the provincial government, and based on factors such as its population and the contribution of its economic activities to the gross domestic product [76]. In this scenario, the existing great differences between municipalities in relation to their contribution to ES provision [16] are not considered, even though they are fundamental for human well-being.
Our results have showed that municipalities play an important role in the protection and conservation of the GI, as one third of the protected principal components of the GI of Biscay only has protection at the municipality level. However, 50% of the principal components of the GI are not protected. In Biscay, although the projections show a population reduction in the following years, the home demand will increase due to changes in family structures [38]. Many municipalities, especially the most rural ones, could go for the urbanisation of new areas to attract new residents. This way, the population would increase, as well as the budget assigned to them. This could suppose a big pressure against GI conservation, as urban sprawl is one of the main causes of the depletion of GI [1,77,78]. So, based on an opportunity cost principle, understanding it at the cost of a missed opportunity or the costs associated with forgone opportunities to convert land to profitable uses [79], municipalities that devote their lands to GI conservation and promotion should receive an economic compensation [26].

4.2. A GI-Based PES Scheme

Once the potential of economic incentives to protect and promote GI at the municipality level has been shown, a financial incentive mechanism is needed. We propose a GI-based PES-like scheme where the objective is the conservation of multifunctional landscapes through the conservation and promotion of GI. Taking into account that most of the principal elements of the GI in Biscay are natural forest, and that almost all of the forest has been included, we propose the cover of natural forest as an indicator of the GI that a municipality presents, in order to establish the associated incentives. Previous studies in the area have shown that municipalities dominated by forest ecosystems have more multifunctional landscapes [16]. Furthermore, the role of natural forests as important component of GI has been widely highlighted [17,26,80] as they have a higher value in the provision of ES in comparison to other land uses [37,81].
An index called MESLI (multiple ecosystem services landscape index), which measures and promotes landscape functionality at the municipality level, has been previously developed for the area [16]. It showed its capacity to sort municipalities as a function of their contribution to multiple ES; however, to establish an incentive mechanism based on it would be somewhat inconvenient, as it would require the calculation of complex indicators. The same would happen with the use of the total cover of the principal components of the GI, as its calculation requires complex mapping procedures. The use of a simpler index, such as the cover of natural forest, can facilitate the process, as the adoption of an innovation requires acceptance by the technicians of the administration, and it depends on their positive or negative attitude toward it [82]. On one hand, the degree to which a new tool is perceived as easy to understand and implement exerts an influence on perceived usefulness [83]. On the other hand, perceived internal readiness to adoption of a new tool has a positive effect on the perceived usefulness associated with it [82]. The proposed index, the cover of natural forest, meets both conditions, as it is easy to understand and its calculation does not require any extra effort, because it is included in the official statistic of the Basque Country [38].
The GI-based PES-like scheme that we propose as an incentive mechanism will use this index, the cover of natural forests, as a basis. In this scheme, the buyer would be the government, acting on behalf of ES users (i.e., citizens), and the payments would be given to the community administrations (i.e., municipalities) for investment in social services and community infrastructures that would benefit all of the inhabitants. This innovative landscape approach for PES, which values the provision of multiple services, involves only a buyer—the provincial government—and a seller—the municipality—and benefits all community members. This GI-based PES-like scheme solves most of the limitations common to most PES approaches, such as high establishment and transaction costs [27], limited ecosystem service provision, and low inclusivity of participation [30,84,85]. Furthermore, in a situation such as the one proposed here, where multiple ES act at different scales from local to global, the only feasible approach is financial support by a government body [86].
Participating in this initiative is a political decision, as it requires an amount of money devoted to this incentive mechanism. In 2015, the provincial government devoted 816 millions Euros to finance municipalities [76]. One option could be the redistribution of the same budget taking into account a new factor: the cover of natural forest of the municipality. This would not suppose an extra cost for the provincial government, but it could cause conflicts, as some municipalities would be winners and others would be losers. Another option could be to increase the amount of money devoted for municipalities budgeting. To finance the extra cost, among other alternatives, the provincial government could reallocate the budget set aside for the maintenance of the timber sector, which was 4.3 million Euros in 2015 [87], and nowadays is not profitable due to globalisation and the reduction of the demand by the building sector. In this case, conflicts would also appear, but this is a common issue in planning for multifunctionality [8,88]. Besides, the extra budget could be financed with extra taxes. In this context, a recent study carried out in the Basque Country [69] showed that nearly 6% of a green area’s users were willing to pay extra taxes for environmental protection and the provision of ES; 20% would pay through voluntary contributions, and 30% would devote 0.7% of their income. Taking into account these results, the viability of this option in the study area is questionable, but it could be an option in other contexts.
A common matter of concern in PES schemes is the lack of additionality. Would the conservation of GI be lower if the incentive mechanism did not exist? It can be argued that there would not be environmental additionality associated with the GI-based PES-like scheme proposed here, as the payment is made as a function of the GI already being presented on the landscape, and no change in land use or management to promote it is required. However, although this scheme does not stress additionality, it could have a positive effect on GI conservation and promotion for three reasons. First, the prospective of higher incomes could motivate municipalities to devote their public lands to the recovery of natural forest. Second, the actual system of protected areas has been the cause of many conflicts between conservationists and the rural population [31]. With the implementation of the PES proposed here, these local communities would receive direct benefits, such as education and health infrastructures, from the protection of nature, which could increase their interest in conservation activities [31,89]. Finally, GI protection and promotion requires interventions not only inside of protection areas; conservation also needs to be mainstreamed across sectors, institutions, and stakeholders that are not primarily concerned with conservation. As the investment of the payments does not have to be set aside for nature conservation, but rather could be used for community projects and infrastructure, this scheme could help mitigate diverging departmental interests of the municipality administration encouraging sustainability issues mainstreaming. This is crucial in order to move sustainability into the core of municipal decision-making and foster a transition to sustainability [3].
Finally, another matter of concern in the PES scheme here proposed is the ownership of the land, as nearly 80% of the surface of Biscay is privately owned. It can be argued that if the municipalities are paid by the provincial governments on the basis of the natural forest cover, they would be cashing money from something they do not own (mostly) and sharing the benefits with the local community, but not with the forest owners. This could cause important conflicts; however, forest owners could also benefit from the scheme proposed here, as it could have a positive impact on the social perception of the forest sector of the area. Foresters of the region feel they are marginalised by broader society, as they are considered responsible for the negative effects their activities can cause on the environment [21,81], but receive little support or acknowledgement for good practice. With the PES scheme proposed here, the conservation of the natural forest presented in their lands would have a positive impact in the area, which could help to change the negative perception that a part of the society has about the forests sector.

5. Conclusions

The GI concept is receiving increased attention in political discourse; however, stakeholder involvement in its assessment is in its infancy. Systematically including GI considerations in land planning will help reduce the loss of ES associated with future land use changes. Municipalities play a crucial role in land management, and therefore the conservation of GI, so formal recognition of this role in municipalities’ budgeting and accounting systems would foster the inclusion of GI in their agenda.
A prerequisite for GI conservation is to identify the elements of the GI presented in an area. In this point, mapping procedures can play an important role. The methodology here presented is a good example of the use of mapping to identify the principal components of GI at the local scale, which could be adapted for its use in other areas as a function of the data availability.
Our results have shown that the GI of Biscay is mainly composed of the natural forests presented in the area, so an incentive mechanism to promote their conservation would contribute to safeguarding and enhancing ES provision and biodiversity conservation. The index that was proposed here as a basis for that incentive mechanism, the cover of natural forest, can be easily calculated and could facilitate the process. However, it has to be noted that this index is appropriate for the study area, but its extrapolation to other areas would require specific research in those places.
With the PES-like scheme presented here, the principal obstacle for GI conservation—the lack of political support and economic resources—would be solved as government’s commitment to GI implementation would be clear, and economic resources would be set aside for it. Furthermore, as the different departments of the municipality administration would benefit, GI and ES conservation and promotion would be included on the municipalities’ agenda, fostering sustainable territorial planning transition. However, the viability of a PES scheme as the one proposed here would need more research due to the potential problems that could appear related to land ownership and the funding mechanism.

Acknowledgments

We gratefully acknowledge financial support from the Department of Universities, Research and Education of the Basque Government (code: IT1113-16), the UNESCO Chair on Sustainable Development and Environmental Education of the University of the Basque Country, and the Department of Environment and Regional Planning of the Basque Government and the Department of Sustainability and Environment of Biscay Provincial Council (Ecosystem Services Assessment of the Basque Country Project).

Author Contributions

G.R.-L. and M.O. were responsible for the study design; all the authors designed the mapping methodology; G.R.-L. and L.P. made the maps of ecosystem services; G.R.-L. analysed the data and wrote the paper; all the authors contributed to discuss and evaluate the main contents.

Conflicts of Interest

The authors declare no conflict of interest.

References

  1. La Greca, P.; La Rosa, D.; Martinico, F.; Privitera, R. Agricultural and green infrastructures: The role of non-urbanised areas for eco-sustainable planning in a metropolitan region. Environ. Pollut. 2011, 159, 2193–2202. [Google Scholar] [CrossRef] [PubMed]
  2. Steffen, W.; Sanderson, R.A.; Tyson, P.D.; Jäger, J.; Matson, P.A.; Moore, B., III; Oldfield, F.; Richardson, K.; Schellnhuber, H.-J.; Turner, B.L.; Wasson, R.J. Global Change and the Earth System: A Planet under Pressure; Springer: New York, NY, USA, 2004; p. 336. ISBN 3-540-40800-2. [Google Scholar]
  3. Wamsler, C.; Luederitz, C.; Brink, E. Local levers for change: Mainstreaming ecosystem-based adaptation into municipal planning to foster sustainability transitions. Glob. Environ. Chang. 2014, 29, 189–201. [Google Scholar] [CrossRef]
  4. Millennium Ecosystem Assesment. Ecosystems and Human Wellbeing: Current State and Trends; Island Press: Washington, DC, USA, 2005; Volume 1, p. 948. ISBN 9781559632270. [Google Scholar]
  5. Onaindia, M.; Madariaga, I.; Palacios, I.; Arana, X. Nature and Human Well-Being in Biscay. In Ecosystem Services Assessment; Research Applied to Management; University of the Basque Country (UPV/EHU): Leioa, Spain, 2015; p. 130. ISBN 978-84-9082-207-4. [Google Scholar]
  6. Costanza, R.; d’Arge, R.; de Groot, R.; Farber, S.; Grasso, M.; Hannon, B.; Limburg, K.; Naeem, S.; O’Neill, R.V.; Paruelo, J.; et al. The value of the world’s ecosystem services and natural capital. Nature 1997, 387, 253–260. [Google Scholar] [CrossRef]
  7. Liquete, C.; Kleeschulte, S.; Dige, G.; Maes, J.; Grizzetti, B.; Olah, B.; Zulian, G. Mapping green infrastructure based on ecosystem services and ecological networks: A Pan-European case study. Environ. Sci. Policy 2015, 54, 268–280. [Google Scholar] [CrossRef]
  8. Garmendia, E.; Apostolopoulou, E.; Adams, W.M.; Bormpoudakis, D. Biodiversity and Green Infrastructure in Europe: Boundary object or ecological trap? Land Use Policy 2016, 56, 315–319. [Google Scholar] [CrossRef]
  9. Naumann, S.; McKenna, D.; Kaphengst, T.; Pieterse, M.; Rayment, M. Design, Implementation and Cost Elements of Green Infrastructure Projects; Final Report to the European Commission, DG Environment, Contract No. 070307/2010/577182/ETU/F.1. Ecologic Institute and GHK Consulting; European Commission: Brussels, Belgium, 2011; Available online: http://ec.europa.eu/environment/enveco/biodiversity/pdf/ GI_DICE_FinalReport.pdf (accessed on 24 December 2013).
  10. McWilliam, W.; Brown, R.; Eagles, P.; Seasons, M. Evaluation of planning policy for protecting green infrastructure from loss and degradation due to residential encroachment. Land Use Policy 2015, 47, 459–467. [Google Scholar] [CrossRef]
  11. Vogler, K.C.; Ager, A.A.; Day, M.A.; Jennings, M.; Bailey, J.D. Prioritization of Forest Restoration Projects: Tradeoffs between Wildfire Protection, Ecological Restoration and Economic Objectives. Forests 2015, 6, 4403–4420. [Google Scholar] [CrossRef]
  12. Martínez, M.L.; Pérez-Maqueo, O.; Vázquez, G.; Castillo-Campos, G.; García-Franco, J.; Mehltreter, K.; Equihua, M.; Landgrave, R. Effects of land use change on biodiversity and ecosystem services in tropical montane cloud forests of Mexico. For. Ecol. Manag. 2009, 258, 1856–1863. [Google Scholar] [CrossRef]
  13. Nanni, A.S.; Grau, H.R. Land-Use Redistribution Compensated for Ecosystem Service Losses Derived from Agriculture Expansion, with Mixed Effects on Biodiversity in a NW Argentina Watershed. Forests 2017, 8, 303. [Google Scholar] [CrossRef]
  14. Rodríguez-Loinaz, G.; Amezaga, I.; Onaindia, M. Does forest fragmentation affect the same way all growth-forms? J. Environ. Manag. 2012, 94, 125–131. [Google Scholar] [CrossRef] [PubMed]
  15. Mell, I.C. Aligning fragmented planning structures through a green infrastructure approach to urban development in the UK and USA. Urban For. Urban Green. 2014, 13, 612–620. [Google Scholar] [CrossRef]
  16. Rodríguez-Loinaz, G.; Alday, J.G.; Onaindia, M. Multiple ecosystem services landscape index: A tool for multifunctional landscapes conservation. J. Environ. Manag. 2015, 147, 152–163. [Google Scholar] [CrossRef] [PubMed]
  17. Barbati, A.; Corona, P.; Salvati, L.; Gasparella, L. Natural forest expansion into suburban countryside: Gained ground for a green infrastructure? Urban For. Urban Green. 2013, 12, 36–43. [Google Scholar] [CrossRef] [Green Version]
  18. Connop, S.; Vandergert, P.; Eisenberg, B.; Collier, M.J.; Nash, C.; Clough, J.; Newport, D. Renaturing cities using a regionally-focused biodiversity-led multifunctional benefits approach to urban green infrastructure. Environ. Sci. Policy 2016, 62, 99–111. [Google Scholar] [CrossRef]
  19. Tzoulas, K.; Korpela, K.; Venn, S.; Yli-Pelkonen, V.; Kazmierczak, A.; Niemela, J.; James, P. Promoting ecosystem and human health in urban areas using green infrastructure: A literature review. Landsc. Urban Plan. 2007, 81, 167–178. [Google Scholar] [CrossRef]
  20. Colls, A.; Ash, N.; Ikkala, N. Ecosystem-Based Adaptation: A Natural Response to Climate Change; IUCN: Gland, Switzerland, 2009; p. 16. ISBN 978-2-8317-1215-4. [Google Scholar]
  21. Gain, D.; Watanabe, T. Unsustainability Risk Causality in a Private Industrial Forest: An Institutional Analysi of Factors Affecting Stand Ecosystem Services in Kochi Prefecture, Japan. Forests 2017, 8, 126. [Google Scholar] [CrossRef]
  22. McDonald, L.; Allen, W.; Benedict, M.; O’connor, K. Green infrastructure plan evaluation frameworks. J. Conservat. Plan. 2006, 1, 12–43. [Google Scholar]
  23. Tiwary, A.; Namdeo, A.; Fuentes, J.; Dore, A.; Hu, X.M.; Bell, M. Systems scale assessment of the sustainability implications of emerging green initiatives. Environ. Pollut. 2013, 183, 213–223. [Google Scholar] [CrossRef] [PubMed] [Green Version]
  24. Vandermeulen, V.; Verspecht, A.; Vermeire, B.; Van Huylenbroeck, G.; Gellynck, X. The use of economic valuation to create public support for green infrastructure investment in urban areas. Landsc. Urban Plan. 2011, 103, 198–206. [Google Scholar] [CrossRef]
  25. Palacios-Agundez, I.; Fernández de Manuel, B.; Rodríguez-Loinaz, G.; Peña, L.; Amezaga, I.; Alday, J.G.; Casado-Arzuaga, I.; Madariaga, I.; Arana, X.; Onaindia, O. Integrating stakeholders’ demands and scientific knowledge for the inclusion of ecosystem services in landscape planning. Landsc. Ecol. 2014, 29, 1423–1433. [Google Scholar] [CrossRef]
  26. Schmidt, J.P.; Moore, R.; Alber, M. Integrating ecosystem services and local government finances into land use planning: A case study from coastal Georgia. Landsc. Urban Plan. 2014, 122, 56–67. [Google Scholar] [CrossRef]
  27. Ferguson, I.; Levetan, L.; Crossman, N.D.; Bennett, L.T. Financial Mechanisms to Improve the Supply of Ecosystem Services from Privately-Owned Australian Native Forests. Forests 2016, 7, 34. [Google Scholar] [CrossRef]
  28. Schomers, S.; Matzdorf, B. Payments for ecosystem services: A review and comparison of developing and industrialized countries. Ecosyst. Serv. 2013, 6, 16–30. [Google Scholar] [CrossRef]
  29. Van Hecken, G.; Bastiaensen, J. Payments for ecosystem services: Justified or not? A political view. Environ. Sci. Policy 2010, 13, 785–792. [Google Scholar] [CrossRef]
  30. Wunder, S. Payments for environmental services: Some nuts and bolts. CIFOR Occas. Paper 2005, 24. [Google Scholar] [CrossRef]
  31. Gutman, P. Ecosystem services: Foundations for a new rural-urban compact. Ecol. Econ. 2007, 62, 383–387. [Google Scholar] [CrossRef]
  32. Willemen, L.; Veldkamp, A.; Verburg, P.H.; Hein, L.; Leemans, R. A multi-scale modelling approach for analysing landscape service dynamics. J. Environ. Manag. 2012, 100, 86–95. [Google Scholar] [CrossRef] [PubMed]
  33. Kremer, P.; Hamstead, Z.A.; McPhearson, T. The value of urban ecosystem services in New York City: A spatially explicit multicriteria analysis of landscape scale valuation scenarios. Environ. Sci. Policy 2016, 62, 57–68. [Google Scholar] [CrossRef]
  34. Basque Government. Forest Inventory of the Basque Country 2011; Environmental and Regional Planning Department of the Basque Government: Vitoria/Gasteiz, Spain, 2011. Available online: http://www.nasdap.ejgv.euskadi.net/r50-7212/es/contenidos/informacion/inventario forestal 2011/es agripes/inventario forestal 2011.html (accessed on 15 December 2013).
  35. Environmental Systems Research Institute (ESRI). ArcGIS 9.3; Environmental Systems Research Institute: Redlands, CA, USA, 2009. [Google Scholar]
  36. Basque Government. Map of Hábitats EUNIS; Environmental and Regional Planning Department of the Basque Government: Vitoria/Gasteiz, Spain, 2009. Available online: ftp://ftp.geo.euskadi.net/cartografia/ (accessed on 15 December 2013).
  37. Onaindia, M.; Fernandez de Manuel, B.; Madariaga, I.; Rodríguez-Loinaz, G. Co-benefits and trade-offs between biodiversity, carbon storage and water flow regulation. For. Ecol. Manag. 2013, 289, 1–9. [Google Scholar] [CrossRef]
  38. Eustat. Basque Statistical Institute. Available online: http://www.eustat.eus (accessed on 7 December 2016).
  39. Basque Government. Map of Vegetation of the Basque Country; Environmental and Regional Planning Department of the Basque Government: Vitoria/Gasteiz, Spain, 2009. Available online: ftp://ftp.geo.euskadi.net/cartografia/ (accessed on 15 December 2013).
  40. Conner, R.; Thompson, M. Timber growth, mortality, and change. In Forest Resources of the United States; General Technical Report, WO-78; Smith, W.B., Miles, P.D., Vissage, J.S., Pugh, S.A., Eds.; U.S. Department of Agriculture, Forest Service, Washington Office: Washington, DC, USA, 2009; pp. 64–66. [Google Scholar]
  41. Vélez, J.J.; Puricelli, M.; López, F.; Francés, F. Parameter extrapolation to ungauged basins with a hydrological distributed model in a regional framework. Hydrol. Earth Syst. Sci. 2009, 13, 229–246. [Google Scholar] [CrossRef]
  42. Sharp, R.; Tallis, H.T.; Ricketts, T.; Guerry, A.D.; Wood, S.A.; Chaplin-Kramer, R.; Nelson, E.; Ennaanay, D.; Wolny, S.; Olwero, N.; et al. VEST+ VERSION+ User’s Guide; The Natural Capital Project; Stanford University: Stanford, CA, USA; University of Minnesota: Minneapolis, MN, USA; The Nature Conservancy, and World Wildlife Fund: Gland, Switzerland, 2016; p. 338. Available online: http://data.naturalcapitalproject.org/nightly-build/invest-users-guide/html/#pdf-version-of-the-user-s-guide (accessed on 25 May 2015).
  43. Álvarez, J.; Sánchez, A.; Quintas, L. SIMPA, a GRASS based tool for Hydrological Studies. Int. J. Geoinform. 2005, 1, 1–13. [Google Scholar]
  44. Lonsdorf, E.; Kremen, C.; Ricketts, T.; Winfree, R.; Williams, N.; Greenleaf, S. Modelling pollination services across agricultural landscapes. Ann. Bot. 2009, 103, 1589–1600. [Google Scholar] [CrossRef] [PubMed]
  45. Zulian, G.; Maes, J.; Paracchini, M. Linking Land Cover Data and Crop Yields for Mapping and Assessment of Pollination Services in Europe. Land 2013, 2, 472–492. [Google Scholar] [CrossRef] [Green Version]
  46. Soulis, K.X.; Valiantzas, J.D. SCS-CN parameter determination using rainfall-runoff data in heterogeneous watersheds–the two-CN system approach. Hydrol. Earth Syst. Sci. 2012, 16, 1001–1015. [Google Scholar] [CrossRef] [Green Version]
  47. United States Department of Agriculture (USDA). National Engineering Handbook, Section 4, Hydrology; USDA, Soil Conservation Service, US Government Printing Office: Washington, DC, USA, 1972. Available online: https://policy.nrcs.usda.gov/18393.wba (accessed on 25 June 2015).
  48. Ferrer-Juliá, M. Análisis de Nuevas Fuentes de Datos para la Estimación del Parámetro Número de Curva: Perfiles de Suelos y Teledetección; CEDEX: Madrid, Spain, 2003; ISBN 84-7790-389-1. [Google Scholar]
  49. Basque Government. Slope Map of the Basque Country; Environmental and Regional Planning Department of the Basque Government: Vitoria/Gasteiz, Spain, 2013. Available online: ftp://ftp.geo.euskadi.net/cartografia/ (accessed on 5 September 2015).
  50. Neiker-Ihobe. Estudio Sobre la Potencialidad de los Suelos y la Biomasa de Zonas Agrícolas, Pascícolas y Forestales de la CAPV Como Sumideros de Carbono; Inedited Report; Neiker-Tecnalia: Derio, Basque Country, Spain, 2004. [Google Scholar]
  51. Penmam, J.; Gytarsky, M.; Hiraishi, T.; Krug, T.; Kruger, D.; Pipatti, R.; Buendia, L.; Miwa, K.; Ngara, T.; Tanabe, K.; et al. (Eds.) Good Practice Guidance for Land Use, Land-Use Change and Forestry; Institute for Global Environmental Strategies (IGES), Cambridge University Press: Cambridge, UK, 2003; p. 590. ISBN 4-88788-003-0. [Google Scholar]
  52. Peña, L.; Casado-Arzuaga, I.; Onaindia, M. Mapping recreation supply and demand using an ecological and social evaluation approach. Ecosyst. Serv. 2015, 13, 108–118. [Google Scholar] [CrossRef]
  53. Paracchini, M.L.; Zulian, G.; Kooperoinen, L.; Schägner, J.P.; Termansen, M.; Zandersen, M.; Perez-Soba, M.; Scholefield, P.A.; Bidoglio, G. Mapping cultural ecosystem services: A framework to assess the potential for outdoor recreation across the EU. Ecol. Indic. 2014, 45, 371–385. [Google Scholar] [CrossRef] [Green Version]
  54. Fuller, R.A.; Irvine, K.N.; Devine-Wright, P.; Warren, P.H.; Gaston, K.J. Psychological benefits of greenspace increase with biodiversity. Biol. Lett. 2007, 3, 390–394. [Google Scholar] [CrossRef] [PubMed]
  55. Hartig, T.; Staats, H. The need for psychological restoration as a determinant of environmental preferences. J. Environ. Psychol. 2006, 26, 215–226. [Google Scholar] [CrossRef]
  56. Maes, J.; Braat, L.; Jax, K.; Hutchins, M.; Furman, E.; Termansen, M.; Luque, S.; Paracchini, M.S.; Chauvin, C.; Williams, R.; et al. A Spatial Assessment of Ecosystem Services in Europe: Methods, Case Studies and Policy Analysis: Phase 1; PEER Report No 3; Partnership for European Environmental Research: Ispra, Italy, 2011. [Google Scholar]
  57. Willemen, L.; Verburg, P.H.; Hein, L.; van Mensvoort, M.E.F. Spatial characterization of landscape functions. Landsc. Urban Plan. 2008, 88, 34–43. [Google Scholar] [CrossRef]
  58. Loidi, J.; Ortega, M.; Orrantia, O. Vegetation science and the implementation of the habitat directive in Spain: Up-to-now experiences and further development to provide tools for management. Fitosociología 2007, 44, 9–16. [Google Scholar]
  59. Maes, J.; Paracchini, M.L.; Zulian, G.; Dunbar, M.B.; Alkemade, R. Synergies and trade-offs between ecosystem service supply, biodiversity, and habitat conservation status in Europe. Biol. Conserv. 2012, 155, 1–12. [Google Scholar] [CrossRef]
  60. Norton, L.R.; Inwood, H.; Crowe, A.; Baker, A. Trialling a method to quantify the ‘cultural services’ of the English landscape using Countryside Survey data. Land Use Policy 2012, 29, 449–455. [Google Scholar] [CrossRef] [Green Version]
  61. Hunziker, M.; Buchecker, M.; Hartig, T. Space and place—Two aspects of the human-landscape relationship. In A Changing World—Challenges for Landscape Research; Kienast, F., Ghosh, S., Wildi, O., Eds.; Springer: Berlin, Germany, 2007; pp. 47–62, ISBN-10 9048123909. [Google Scholar]
  62. Hunziker, M.; Felber, P.; Gehring, K.; Buchecker, M.; Bauer, N.; Kienast, F. Evaluation of landscape change by different social groups. Results of two empirical studies in Switzerland. Mt. Res. Dev. 2008, 28, 140–147. [Google Scholar] [CrossRef]
  63. Kienast, F.; Bolliger, J.; Potschin, M.; de Groot, R.; Verburg, P.H.; Heller, I.; Wascher, D.; Haines-Young, R. Assessing landscape functions with broad-scale environmental data: Insights gained from a prototype development for Europe. Environ. Manag. 2009, 44, 1099–1120. [Google Scholar] [CrossRef] [PubMed]
  64. Van Oudenhoven, A.; Petz, K.; Alkemade, R.; Hein, L.; de Groot, R. Framework for systematic indicator selection to assess effects of land management on ecosystem services. Ecol. Indic. 2012, 21, 110–122. [Google Scholar] [CrossRef]
  65. Frank, S.; Fürst, C.; Koschke, L.; Witt, A.; Makeschin, F. Assessment of landscape aesthetics—validation of a landscape metrics—Based assessment by visual estimation of the scenic beauty. Ecol. Indic. 2013, 32, 222–231. [Google Scholar] [CrossRef]
  66. Nahuelhual, L.; Carmona, A.; Lozada, P.; Jaramillo, A.; Aguayo, M. Mapping recreation and ecotourism as a cultural ecosystem service: An application at the local leven in Southern Chile. Appl. Geogr. 2013, 40, 71–82. [Google Scholar] [CrossRef]
  67. CPSS. Catálogo Abierto de Paisajes Singulares y Sobresalientes de la CAPV—Anteproyecto—Tomo I. Principios Generales para la Elaboración del Catálogo. Dirección de Biodiversidad y Participación Ambiental; Environmental and Regional Planning Department of the Basque Government: Vitoria/Gasteiz, Spain, 2005. Available online: http://www.ingurumena.ejgv.euskadi.eus/r49-3074/es/contenidos/informacion/paisaje/es_1094/catalogo.html (accessed on 22 February 2015).
  68. Baveye, P.; Baveye, J.; Gowdy, J. Monetary valuation of ecosystem services: It matters to get the timeline right. Ecol. Econ. 2013, 95, 231–235. [Google Scholar] [CrossRef]
  69. Casado-Arzuaga, I.; Madariaga, I.; Onaindia, M. Perception, demand and user contribution to ecosystem services in the Bilbao Metropolitan Greenbelt. J. Environ. Manag. 2013, 129, 33–43. [Google Scholar] [CrossRef] [PubMed]
  70. Williams, K.; Biedenweg, K.; Cerveny, L. Understanding Ecosystem Service Preferences across Residential Classifications near Mt. Baker Snoqualmie National Forest, Washington (USA). Forests 2017, 8, 157. [Google Scholar] [CrossRef]
  71. Gómez-Baggethun, E.; de Groot, R.; Lomas, P.L.; Montes, C. The history of ecosystem services in economic theory and practice: From early notions to markets and payment schemes. Ecol. Econ. 2010, 69, 1209–1218. [Google Scholar] [CrossRef]
  72. Udalmap. Municipalities’ Information System of the Basque Country, 2010. Available online: http://www.ogasun.ejgv.euskadi.net/r51-udalmap/es/contenidos/informacion/udalmap/es_udalmap/udalmap.html (accessed on 10 September 2016).
  73. Rodríguez-Loinaz, G.; Amezaga, I.; Onaindia, M. Efficacy of management policies on protection and recovery of natural ecosystems in the Urdaibai Biosphere Reserve. Nat. Areas J. 2011, 31, 358–367. [Google Scholar] [CrossRef]
  74. Kemkes, R.J.; Farley, J.; Koliba, C.J. Determining when payments are an effective policy approach to ecosystem service provision. Ecol. Econ. 2010, 69, 2069–2074. [Google Scholar] [CrossRef]
  75. Pattanayak, S.K.; Wunder, S.; Ferraro, P.J. Show Me the Money: Do Payments Supply Environmental Services in Developing Countries? Rev. Environ. Econ. Policy 2010, 4, 254–274. [Google Scholar] [CrossRef]
  76. Biscay County Council, Udalkutxa, Public Administration and Institutional Relations Department of the County Council of Biscay, Biscay, Spain, 2015. Available online: http://www.bizkaia.eus/home2/Temas/DetalleTema.asp?Tem_Codigo=6090&idioma=CA (accessed on 10 September 2016).
  77. European Environmental Agency (EEA). Urban Sprawl in Europe: The Ignored Challenge; Report 10; EEA: Copenhagen, Denmark, 2006; ISBN 92-9167-887-2. [Google Scholar]
  78. La Rosa, D.; Privitera, R. Characterization of non-urbanized areas for land-use planning of agricultural and green infrastructure in urban contexts. Landsc. Urban Plan. 2013, 109, 94–106. [Google Scholar] [CrossRef]
  79. Adams, V.M.; Pressey, R.L.; Naidoo, R. Opportunity costs: Who really pays for conservation? Biol. Conserv. 2010, 143, 439–448. [Google Scholar] [CrossRef]
  80. Pinho, P.; Correia, O.; Lecoq, M.; Munzi, S.; Vasconcelos, S.; Gonçalves, P.; Lopes, N. Evaluating green infrastructure in urban environments using a multi-taxa and functional diversity approach. Environ. Res. 2016, 147, 601–610. [Google Scholar] [CrossRef] [PubMed]
  81. Rodríguez-Loinaz, G.; Amezaga, I.; Onaindia, M. Use of native species to improve carbon sequestration and contribute towards solving the environmental problems of the timberlands in Biscay, northern Spain. J. Environ. Manag. 2013, 120, 18–26. [Google Scholar] [CrossRef] [PubMed]
  82. Carlet, F. Understanding attitudes toward adoption of green infrastructure: A case study of US municipal officials. Environ. Sci. Policy 2015, 51, 65–76. [Google Scholar] [CrossRef]
  83. Venkatesh, V.; Morris, M.G. Why don’t men ever stop to ask for directions? Gender, social influence, and their role in technology acceptance and usage behavior. MIS Q. 2000, 24, 115–139. [Google Scholar] [CrossRef]
  84. Wunder, S. The efficiency of payments for environmental services in tropical conservation. Conserv. Biol. 2007, 21, 48–58. [Google Scholar] [CrossRef] [PubMed]
  85. Wunder, S.; Engel, S.; Pagiola, S. Taking stock: A comparative analysis of payments for environmental services programs in developed and developing countries. Ecol. Econ. 2008, 65, 834–852. [Google Scholar] [CrossRef]
  86. Wunder, S. Payments for environmental services and the poor: Concepts and preliminary evidence. Environ. Dev. Econ. 2008, 13, 279–297. [Google Scholar] [CrossRef]
  87. Biscay County Council, Environment and Sustainability Department of the County Council of Biscay, Biscay, Spain, 2015. Available online: http://www.bizkaia.eus/home2/bizkaimedia/Contenido_Noticia.asp?TNo_Codigo=0&Not_Codigo=14901&Tem_Codigo=2&idioma=CA&dpto_biz=2&codpath_biz=2 (accessed on 10 September 2016).
  88. Hansen, R.; Pauleit, S. From multifunctionallity to multiple ecosystem services? A conceptual framework for multifunctionallity in green infrastructure planning for urban areas. Ambio 2014, 43, 516–529. [Google Scholar] [CrossRef] [PubMed]
  89. Görg, C.; Rauschmayer, F. Multi-level-governance and the politics of scale—The challenge of the Millennium Ecosystem Assessment. In Environmental Governance, Power and Knowledge in a Local-Global World; Kütting, G., Lipschutz, R., Eds.; Routledge: London, UK; New York, NY, USA, 2009; pp. 81–99. [Google Scholar]
Figure 1. Study area. Data source: European Nature Information System (EUNIS) habitat map of the Basque Country (ftp.geo.euskadi.net).
Forests 09 00022 g001
Figure 2. Maps of biodiversity conservation (a), food production (b), timber production (c), water supply (d), pollination (e), flood control (f), carbon storage (g), recreation (h), and aesthetic beauty (i).
Forests 09 00022 g002aForests 09 00022 g002b
Figure 3. Principal components of the green infrastructure (GI) of Biscay.
Forests 09 00022 g003
Table 1. Multi-source geospatial database developed for the case study. We used the mean values of recreational value of sites of geographical interest (SGI) to separate the SGIs into two groups regarding their use for leisure (useful and not useful).
DataData SourceDescriptionEvaluation
Land use/land cover map Basque Government (ftp.geo.euskadi.net/cartografia/)EUNIS, habitat types classification
NaturalnessOur elaboration based on the EUNIS and Loidi et al. [58]Index of degree of human influence on ecosystems. It comprises the damage or transformations caused by humans and how these ecosystems depend on human activity themselves [58]7: Natural forests, Continental habitat without vegetation; 6: Salt marshes, wetlands, Coastal habitats; 5: Continental waters, Shrubs, Heaths; 4: Grasslands–hedges, Reservoirs; 3: Forest plantations; 2: Parks; 1: Crops, Orchards, Invasive species, Quarries; 0: Artificial soil
Natural protected areas Basque Government (ftp.geo.euskadi.net/cartografia/)Presence of natural protected areas2: Natural parks, Protected biotopes, Biosphere reserve, Ramsar wetlands; 1: Natura 2000 network, Sites of naturalistic interest; 0: No protected areas or without naturalistic interest.
Presence of Water bodies (WB)Basque Government (ftp.geo.euskadi.net/cartografia/)Presence of rivers, water bodies, coastline related to recreation (bathing water, fishing, and beaches)3:Beaches; 2: WB used for fishing or bathing; 1: WB no used for fishing or bathing; 0: no WB
Presence of Sites of Geological Interest (SGI)Basque Government (ftp.geo.euskadi.net/cartografia/)Presence of SGI with recreational value.1: SGIs with recreational value ≥2; 0: SGIs with recreational value <2
Presence of mountain summitBasque Government (ftp.geo.euskadi.net/cartografia/) (www.mendikat.net) Presence of mountain summit and a buffer of 500 m.1: Buffer of 500 m around the mountain summit; 0: no mountain summits
Table 2. Multi-source geospatial database developed for the case study.
Data Data Source DescriptionEvaluation
Accessibility of the site Basque Government (ftp.geo.euskadi.net/cartografia/)Presence of roads and paths.2: Buffer of 200 m around accessible roads to motor vehicles (highways, roads, etc.); 1: Buffer of 200 m around limited roads to motor vehicles (paths, trails, bike paths); 0: no presence of roads and paths.
InfrastructuresOur elaboration based on the Universal Transverse Mercator—UTM coordinates of infrastructures and Basque Government (ftp.geo.euskadi.net/cartografia/)Presence of infrastructure used for recreation activities3: Buffer of 500 m around constructed infrastructures (recreational areas, wine cellars, museums, ecological parks, theme parks and centers, interpretation centers, bird observatories, landmarks and biking centers), natural infrastructures (caves and climbing sites).
Table 3. Multi-source geospatial database and valuation methods for aesthetic beauty service. We used the mean values of index of relief and index of landscapes diversity to separate the viewsheds into two groups regarding the type of relief (mountainous and flat) and type of landscape (diverse and homogeneous), respectively.
DataData SourceDescriptionEvaluation
Social perceptionOur elaboration based on the EUNIS and social preferences based on mail-in photo-questionnairesSocial preferences of different environmental units for their aesthetic value.See Peña et al. [52].
Relief Basque Government (ftp.geo.euskadi.net/cartografia/)Index of relief for each viewshed [67].1: Viewshed with index of relief ≥32;
0: Viewshed with index of relief <32.
Diversity of landscapesBasque Government (ftp.geo.euskadi.net/cartografia/)Index of landscape diversity (ILD) for each viewshed [67].1: Viewshed with ILD ≥ 1.70;
0: Viewshed with ILD < 1.70.
Presence of Water bodies (WB)Basque Government (ftp.geo.euskadi.net/cartografia/)Presence of rivers, water bodies, coastline, reservoirs. 1: Landscapes with coastline influence; buffer of 50 m around the river; buffer of once the radius of water bodies and reservoirs; 0: No WB or buffers outside our own viewshed.
Visual influence of landmarksBasque Government (ftp.geo.euskadi.net/cartografia/) 1: Buffer of 2000 m around the landmark;
0: No visual influence of landmark.
Visual influence of negative elementsBasque Government (ftp.geo.euskadi.net/cartografia/) 1: Buffer of 4000 m around wind farms; buffer of once the diameter of actives quarries around them; buffer of once the radius of landfills; buffer of 2000 m around highways and double carriageways; buffer of 750 m around other roads; buffer of 200 m around railroads and funicular; 0: no visual influence of negative elements.
Table 4. Distribution of land uses as a function of their level of contribution in % to biodiversity conservation and eight selected ecosystem services (ES).
Biodiversity and Ecosystem ServicesLevel of ContributionType of Ecosystem
Natural ForestOther Natural EcosystemsCrop and PasturesShrubs and HeathlandsForest PlantationsArtificial Areas
Biodiversity conservationLow/very low0026084100
Medium0137425160
High/very high1008707500
Food provisionLow/very low1001000100100100
Medium004000
High/very high0096000
Timber provisionLow/very low1001001001000100
Medium000050
High/very high0000950
Water supplyLow/very low542918104799
Medium29102720311
High/very high17605569220
PollinationLow/very low158012274593
Medium2782614324
High/very high57126259233
Flood controlLow/very low08210092
Medium497065126
High/very high96102935882
Carbon storageLow/very low0865351093
Medium014474907
High/very high1000001000
RecreationLow/very low3216295279
Medium25166341375
High/very high738222301116
Aesthetic beautyLow/very low112195375
Medium34634343617
High/very high65936447117
Table 5. Contribution of the different land uses to the principal components of the GI (% of GI) and percentage of each land use that has been defined as principal components of the GI (% of that land use defined as GI).
% of GI% of that Land Use Defined as GI
Natural forest7491
Other natural ecosystems652
Crop and pastures00
Shrubs and heathlands2044
Forest Plantations00
Artificial areas00

