1. Introduction
Changes in snow-cover duration are one of the ecologically most influential consequences of global climate change in high-mountain ecosystems. At the same time, such changes are particularly difficult to predict, as they depend on complex interactions of altered precipitation and temperature in different seasons. Generally, snow cover in the northern hemisphere has been decreasing in the last decades [
1]. This trend is also observed in many mountain areas [
2,
3,
4,
5], but depending on the local climate, some mountain ranges have also experienced increases [
6]. In the European Alps, snow-cover duration is clearly decreasing: snowmelt in spring has advanced by about 26 days, on average, between 1970 and 2015 (across 11 Swiss stations between ca. 1100 and 2500 m a.s.l. [
7]). This trend is observed across elevations up to 2500~3000 m, so including the current treeline and adjoining alpine areas, and is expected to continue in the coming decades [
8,
9].
Snow-manipulation experiments have been widely used to study the effect of changes in snow-cover duration on alpine and arctic tundra vegetation. According to a recent meta-analysis [
6], the effects of snow manipulations depend on the species groups studied. Overall plant productivity tends to decline with delayed snowmelt, but this pattern is not universal and appears to be mostly driven by grasses, while the growth of forbs tends to increase and dwarf shrubs are not very responsive. Interestingly, according to this meta-analysis, the length of the change in snowmelt date (ranging from <1 to >3 weeks) does not affect the strength of the effect on productivity.
Alpine treelines outside the tropics are generally subject to winter snow cover, but snow is not a primary driver of treeline position, at least not at the global scale. At that scale, treeline positions agree best in their mean growing-season temperature, given a minimum growing season length [
10,
11], indicating that they are caused by a lack of warmth for growth. Low air temperatures affect trees before low vegetation, because tree canopies are better coupled to the atmosphere and hence warm up less in the sun than smaller plants. However, in treeline studies focussed on tree seedlings, cold-related stress and photoinhibition have been identified as most critical for this life stage, rather than a lack of warmth for growth [
12,
13,
14]. Consequently, treeline positions and dynamics at the local scale can very well be driven by snow-cover patterns, as indicated by natural seedling distributions and sapling survival and growth patterns [
15,
16,
17,
18,
19].
In winter, seedlings in temperate-zone mountains will usually be covered by snow and are thus protected from the harshest conditions. As a result, for instance, small
Larix seedlings can ‘afford’ to be evergreen [
20]. Emergence from snow cover results in exposure to stresses like frost, high solar radiation, wind abrasion, and winter desiccation. Adult trees may be seriously limited by these stress factors [
21,
22,
23], but seedlings may suffer harsher conditions (e.g., stronger frosts)
and may be more vulnerable due to their small size. Their small size implies smaller water reserves and hence a higher susceptibility to damage by winter desiccation [
24]. Likewise, the relatively small carbohydrate reserves, in relation to the high proportion of vulnerable tissues, may delay the replacement of lost or damaged tissue. Tree seedlings can also be more frost sensitive than adult trees, e.g., in
Lophozonia (formerly
Nothofagus)
menziesii (Hook.f.) Heenan & Smissen [
25], but for other taxa, e.g., most
Pinus and many
Abies species, this does not appear to be the case [
26].
Although deciduous and coniferous treeline trees and seedlings are generally highly frost tolerant in winter [
26,
27,
28], frost hardening may be less developed under snow due to the relatively high temperatures here compared to outside [
29]. Snow-covered plant parts and seedlings are therefore particularly vulnerable upon sudden exposure [
30]. Earlier snowmelt implies exposure to more frost events [
31]. Observed higher temperatures and earlier snowmelt in the last decades are not necessarily accompanied by a reduction in the number of frost events during the growing season [
32]. This unfavourable combination of abiotic conditions would result in increased freezing damage, as indicated, e.g., by the results of experimental warming in
Larix decidua L. trees at the treeline [
33]. Interestingly, most frost damage in that warming experiment occurred in the first two to three weeks after snowmelt.
Low temperatures can be especially damaging when combined with high solar radiation. Cold-induced photoinhibition and possibly photodamage affect tree regeneration at Australian evergreen eucalypt treelines [
14] and North-American conifer (
Picea and
Abies) treelines [
13,
34]. High sky exposure also appears to restrict tree establishment at treelines in New Zealand, as well as in the tropical Andes, although there the physiological mechanisms are less clear [
23,
35,
36]. At alpine treelines, cold-induced photoinhibition can occur at any time of the year, due to the large daily temperature fluctuations at these elevations, but it is more likely in spring and autumn, when nights are colder. The importance of cold-induced photoinhibition for long-term seedling performance is unclear, however, even for those species where photoinhibition is known to occur.
Prolonged protection under snow has obvious advantages in terms of reduced exposure to climatic stressors, but it also shortens the growing season [
18]. A shorter season does not only reduce the time available for growth, but also that for tissue ripening. It has been suggested that insufficient tissue ripening in the cool, short growing season may leave trees and, in particular, seedlings vulnerable to freezing damage or winter desiccation [
28,
37,
38]. The response of tree seedlings to differences in snow cover thus has various interacting dimensions [
15,
39]. Apart from time for growth and damage through early-season stress, further potentially important dimensions include the growth of parasitic snow fungi (worse with late snowmelt; [
16,
40]) and the timing and duration of soil water supply (better with late snowmelt). The relative importance of all of these dimensions may also differ between tree species and life stages.
In this paper, we explore the effect of shorter or longer snow cover in spring on physiological stress, growth, and survival of seedlings of five tree species in the subalpine zone just below alpine-treeline elevation in the French Alps. We explicitly studied two potential stress factors after emergence from snow cover: cold-induced photoinhibition (addressed through shading and night warming) and freezing damage (addressed through night warming). We hypothesized that: (1) early-emerging seedlings experience higher stress levels and have lower survival; (2) early-emerging seedlings have lower overall growth, in spite of the longer growing season, due to damage suffered early in the season; and (3) the negative effects of earlier snowmelt are ameliorated by shade and night warming.
2. Materials and Methods
2.1. Study Area and Tree Species
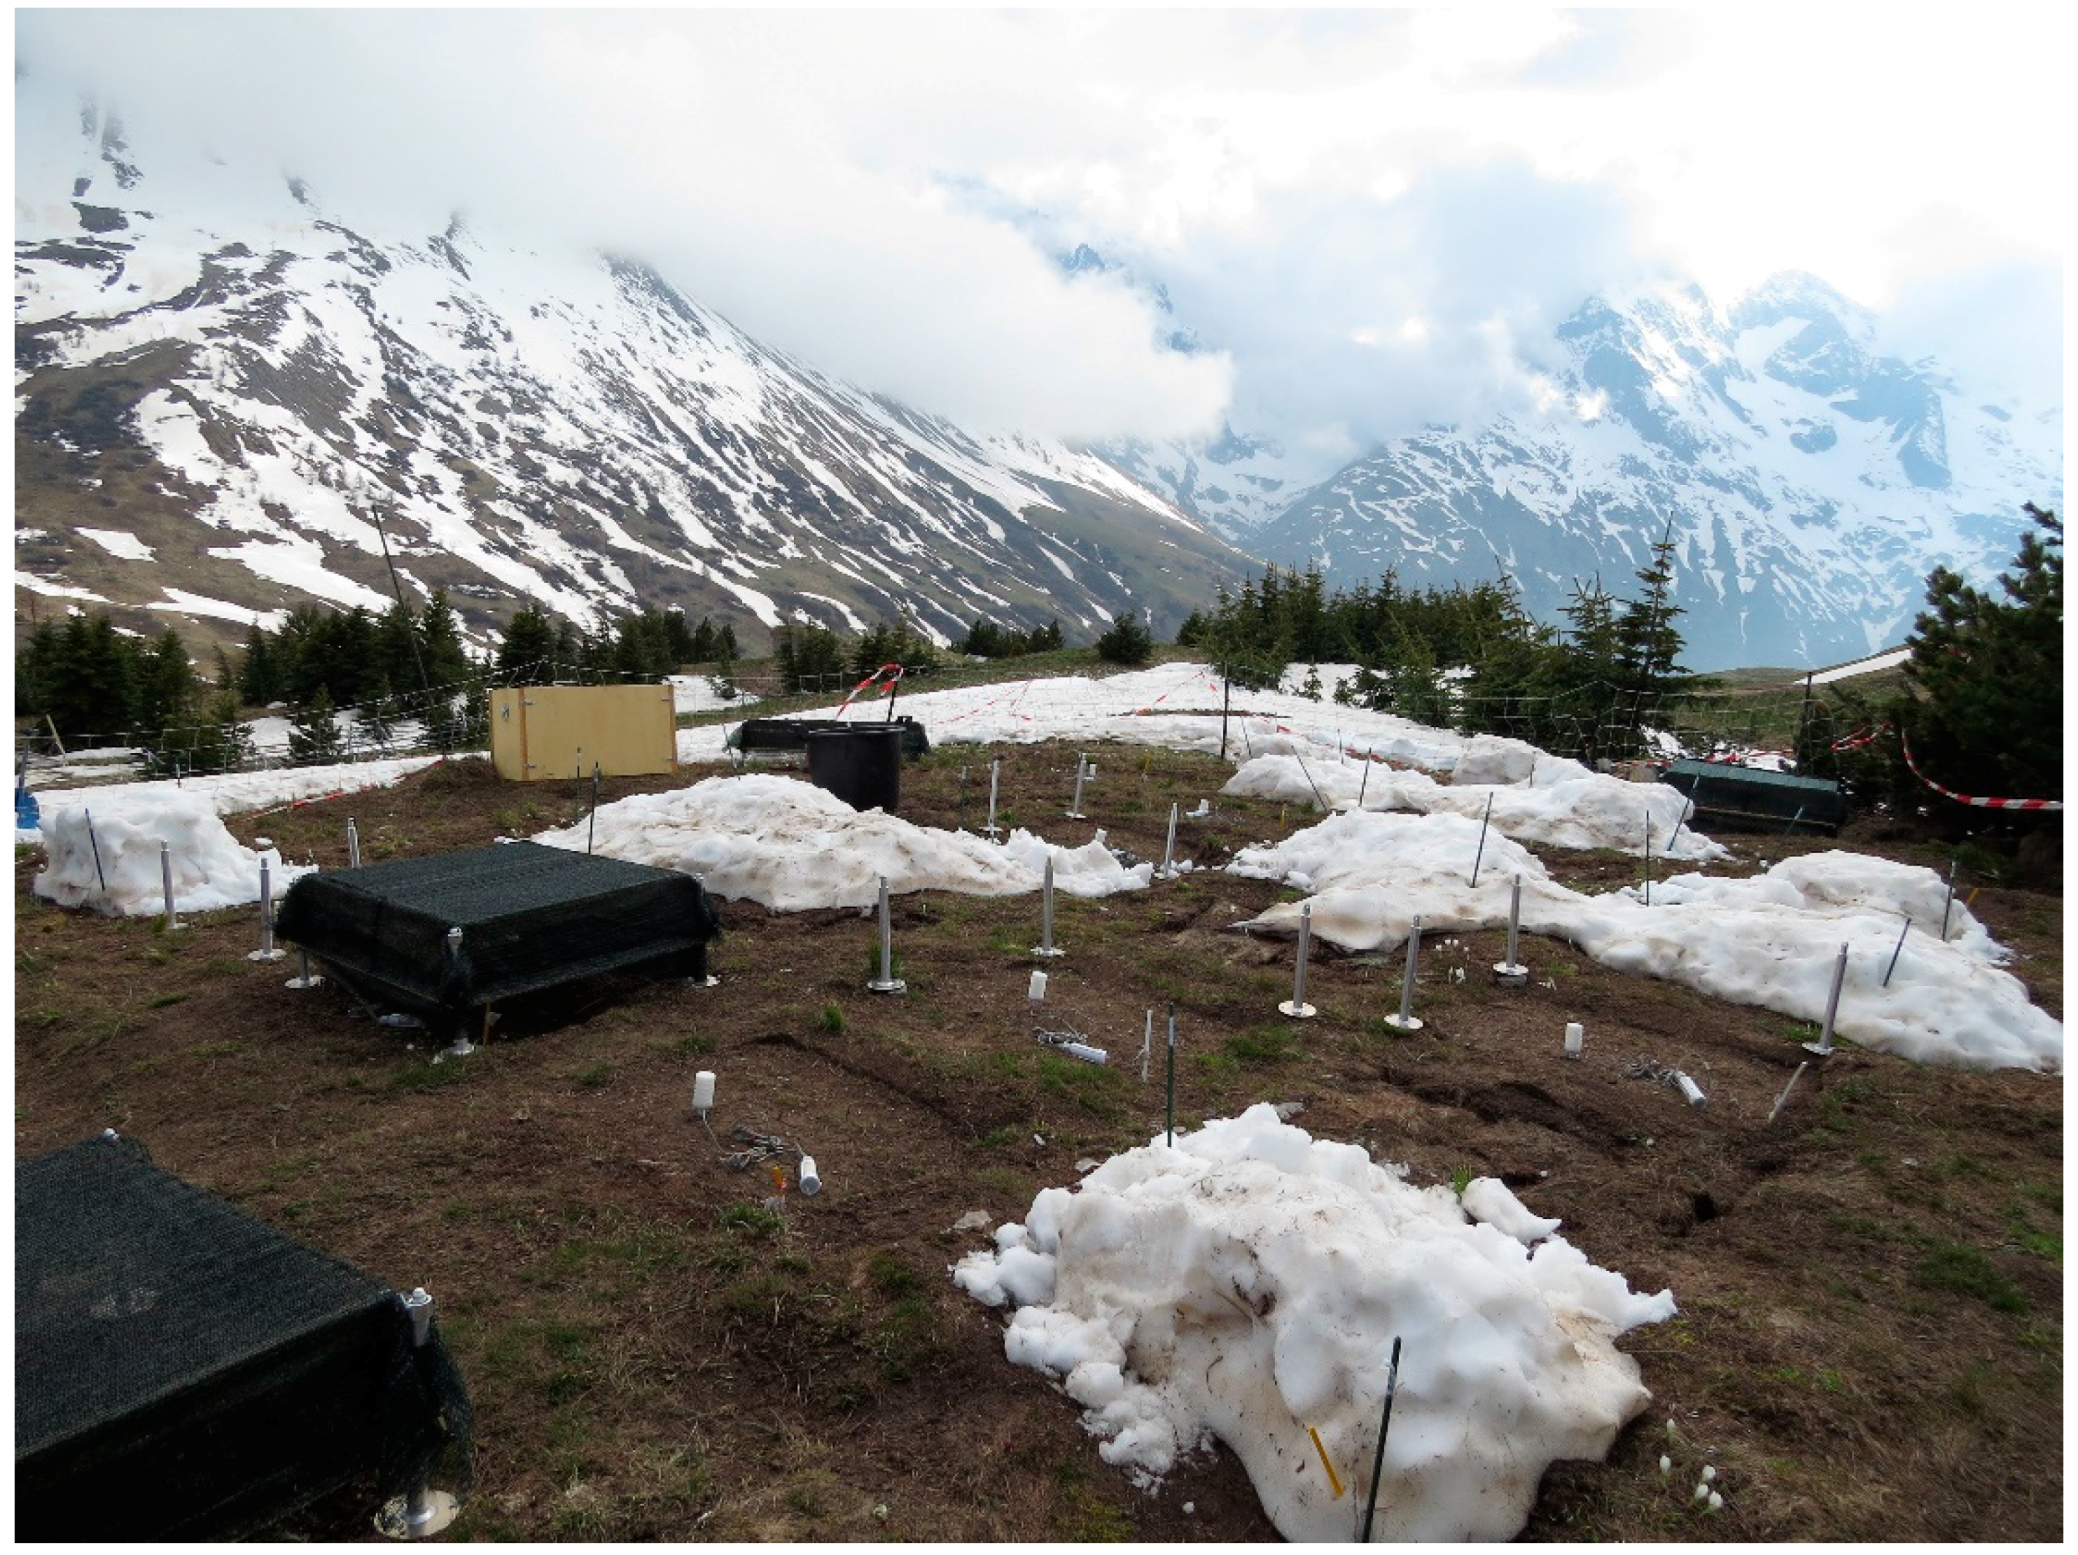
The experiment took place in the experimental garden of the Alpine Research Station Joseph Fourier in the French Alps, ca. 200 m below the regional natural treeline (Lautaret Pass, 2100 m a.s.l., 45°02′ N, 6°24′ E). This garden is situated in the transition zone between the wet outer Alps and the dryer inner Alps [
41]. The mean temperature of the warmest month (July) is 11 °C and the average annual precipitation is 1230 mm [
42]. Persistent snow cover typically lasts four to five months with a moderate depth of 2–3 m (Franck Delbart, Alpine Research Station Joseph Fourier, personal communication). Due to a long history of land use, there is no natural treeline at the Lautaret pass, with the subalpine vegetation consisting mostly of species-rich
Festuca paniculata (L.) Schinz & Thell.—meadows [
43].
We studied four important treeline-forming conifers in the European Alps:
Larix decidua L.,
Picea abies (L.) Karst,
Pinus cembra L., and
Pinus uncinata Ram. (the latter added in 2013), plus the broadleaved
Sorbus aucuparia L., which also grows up to the treeline [
44]. Seeds of subalpine origin were obtained from a commercial seed producer (Herzog Baum, Samen und Pflanzen GmbH, Gmunden, Austria) and a forestry office (Kantonaler Forstgarten Rodels, Rodels, Switzerland) providing seeds from the inner Alps. Only seeds of
Sorbus aucuparia were unavailable form the Alps and were obtained from a lower-montane origin in Hungary.
2.2. Experimental Design
Seedlings were planted in plots with six treatment combinations: two levels of snowmelt timing: early and late; combined with three levels of sky exposure: continuous exposure (control), daytime roof providing shade, and night-time roof providing passive warming (
Figure 1). The experimental plots were arranged in four blocks, set up perpendicular to the slope. Each of the six plots per block was randomly assigned to a treatment combination, except when treatment constructions would impact neighboring plots (e.g., due to shading). Ten seedlings per tree species were planted in one randomly assigned row per species in each of the 50 × 75-cm plots. Half the plots were planted in 2012, and the other half (new rows) in 2013. The experiment was thus repeated in two years, with seedlings planted in autumn 2012 and monitored in 2013 and 2014, and with seedlings planted in autumn 2013 and monitored in 2014.
All blocks were fenced against cattle. The 50 × 75-cm plots were excavated to a depth of 15 cm to remove all above- and belowground plant material. The soil of the plots within a block was then mixed and returned, creating a homogenous growth substrate within blocks. This treatment roughly resembles the disturbance of soil by, e.g., animal burrowing, which may play a role in tree establishment at treelines and provides a suitable substrate for tree seedlings [
39,
45]. Sky-exposure treatments were installed just before seedlings were exposed from under the snow. Shade was produced by shade roofs (70% reduction in photosynthetically active radiation compared to open air), covering the plots in the shade treatment during the day. These same roofs were placed over the plots in the night-warming treatments during the night to reduce radiative cooling. The roofs were 30-cm high and had 20-cm shade-cloth curtains on all sides to prevent the penetration of low-angle sunlight.
Plots were marked with 80-cm tall poles. When these became visible in spring, snow was removed from the early plots to a height of 5 cm above the ground, so that seedlings were uncovered by subsequent melting. This snow was moved onto the late plots, and snow cover was maintained here by adding snow from snow patches outside the experimental area for as long as possible. This resulted in a difference of twelve days between early and late plots in 2014. Snow cover thus lasted until, respectively, 16 and 28 May 2014. The previous winter (2012–2013) was very snow rich, with a quite late but suddenly warm spring and many late snow events until June. The early plots were exposed from under the snow several times (11–14, 22–25, and 27–28 May 2013) before final snowmelt (29 May 2013 for the early plots). Shade/night-warming roofs were installed during these exposed periods and removed again when new snow fell. After final snowmelt in the early plots, snow melted very fast, so that the late plots were snow-free seven days later in early June 2013.
2.3. Planting Procedures and Response Parameters
Seeds were germinated in spring 2012 and 2013 in Oldenburg (lowland northern Germany) and transferred to the Lautaret alpine botanical garden in late spring, when most were still in the cotyledonous stage. They were then kept in open-air nursery beds with 40% shade at midday but penetrating direct light for several hours a day over summer to acclimatize to the subalpine conditions before being transferred to the plots in early October 2012 and late September 2013, respectively. Conifer seedlings developed their first real needles in the subalpine nursery, or only in the second growing season, but did not grow much during that first acclimation summer. They were <5 cm tall (S. aucuparia, L aucuparia, <3 cm for the other species) upon outplanting and were planted bare-rooted, with a 5–6 cm distance between seedlings, so there was no crowding. To reduce the number of dimensions of the seedling responses to snow cover, focusing the experiments on climatic stress and growing-season length, we excluded soil-water effects by providing sufficient water to all plots, watering on days without natural precipitation throughout the growing season. Therefore, the extra soil water provided by the late-melting snow to the late plots and possibly to neighboring early plots should not have influenced the effects of these treatments.
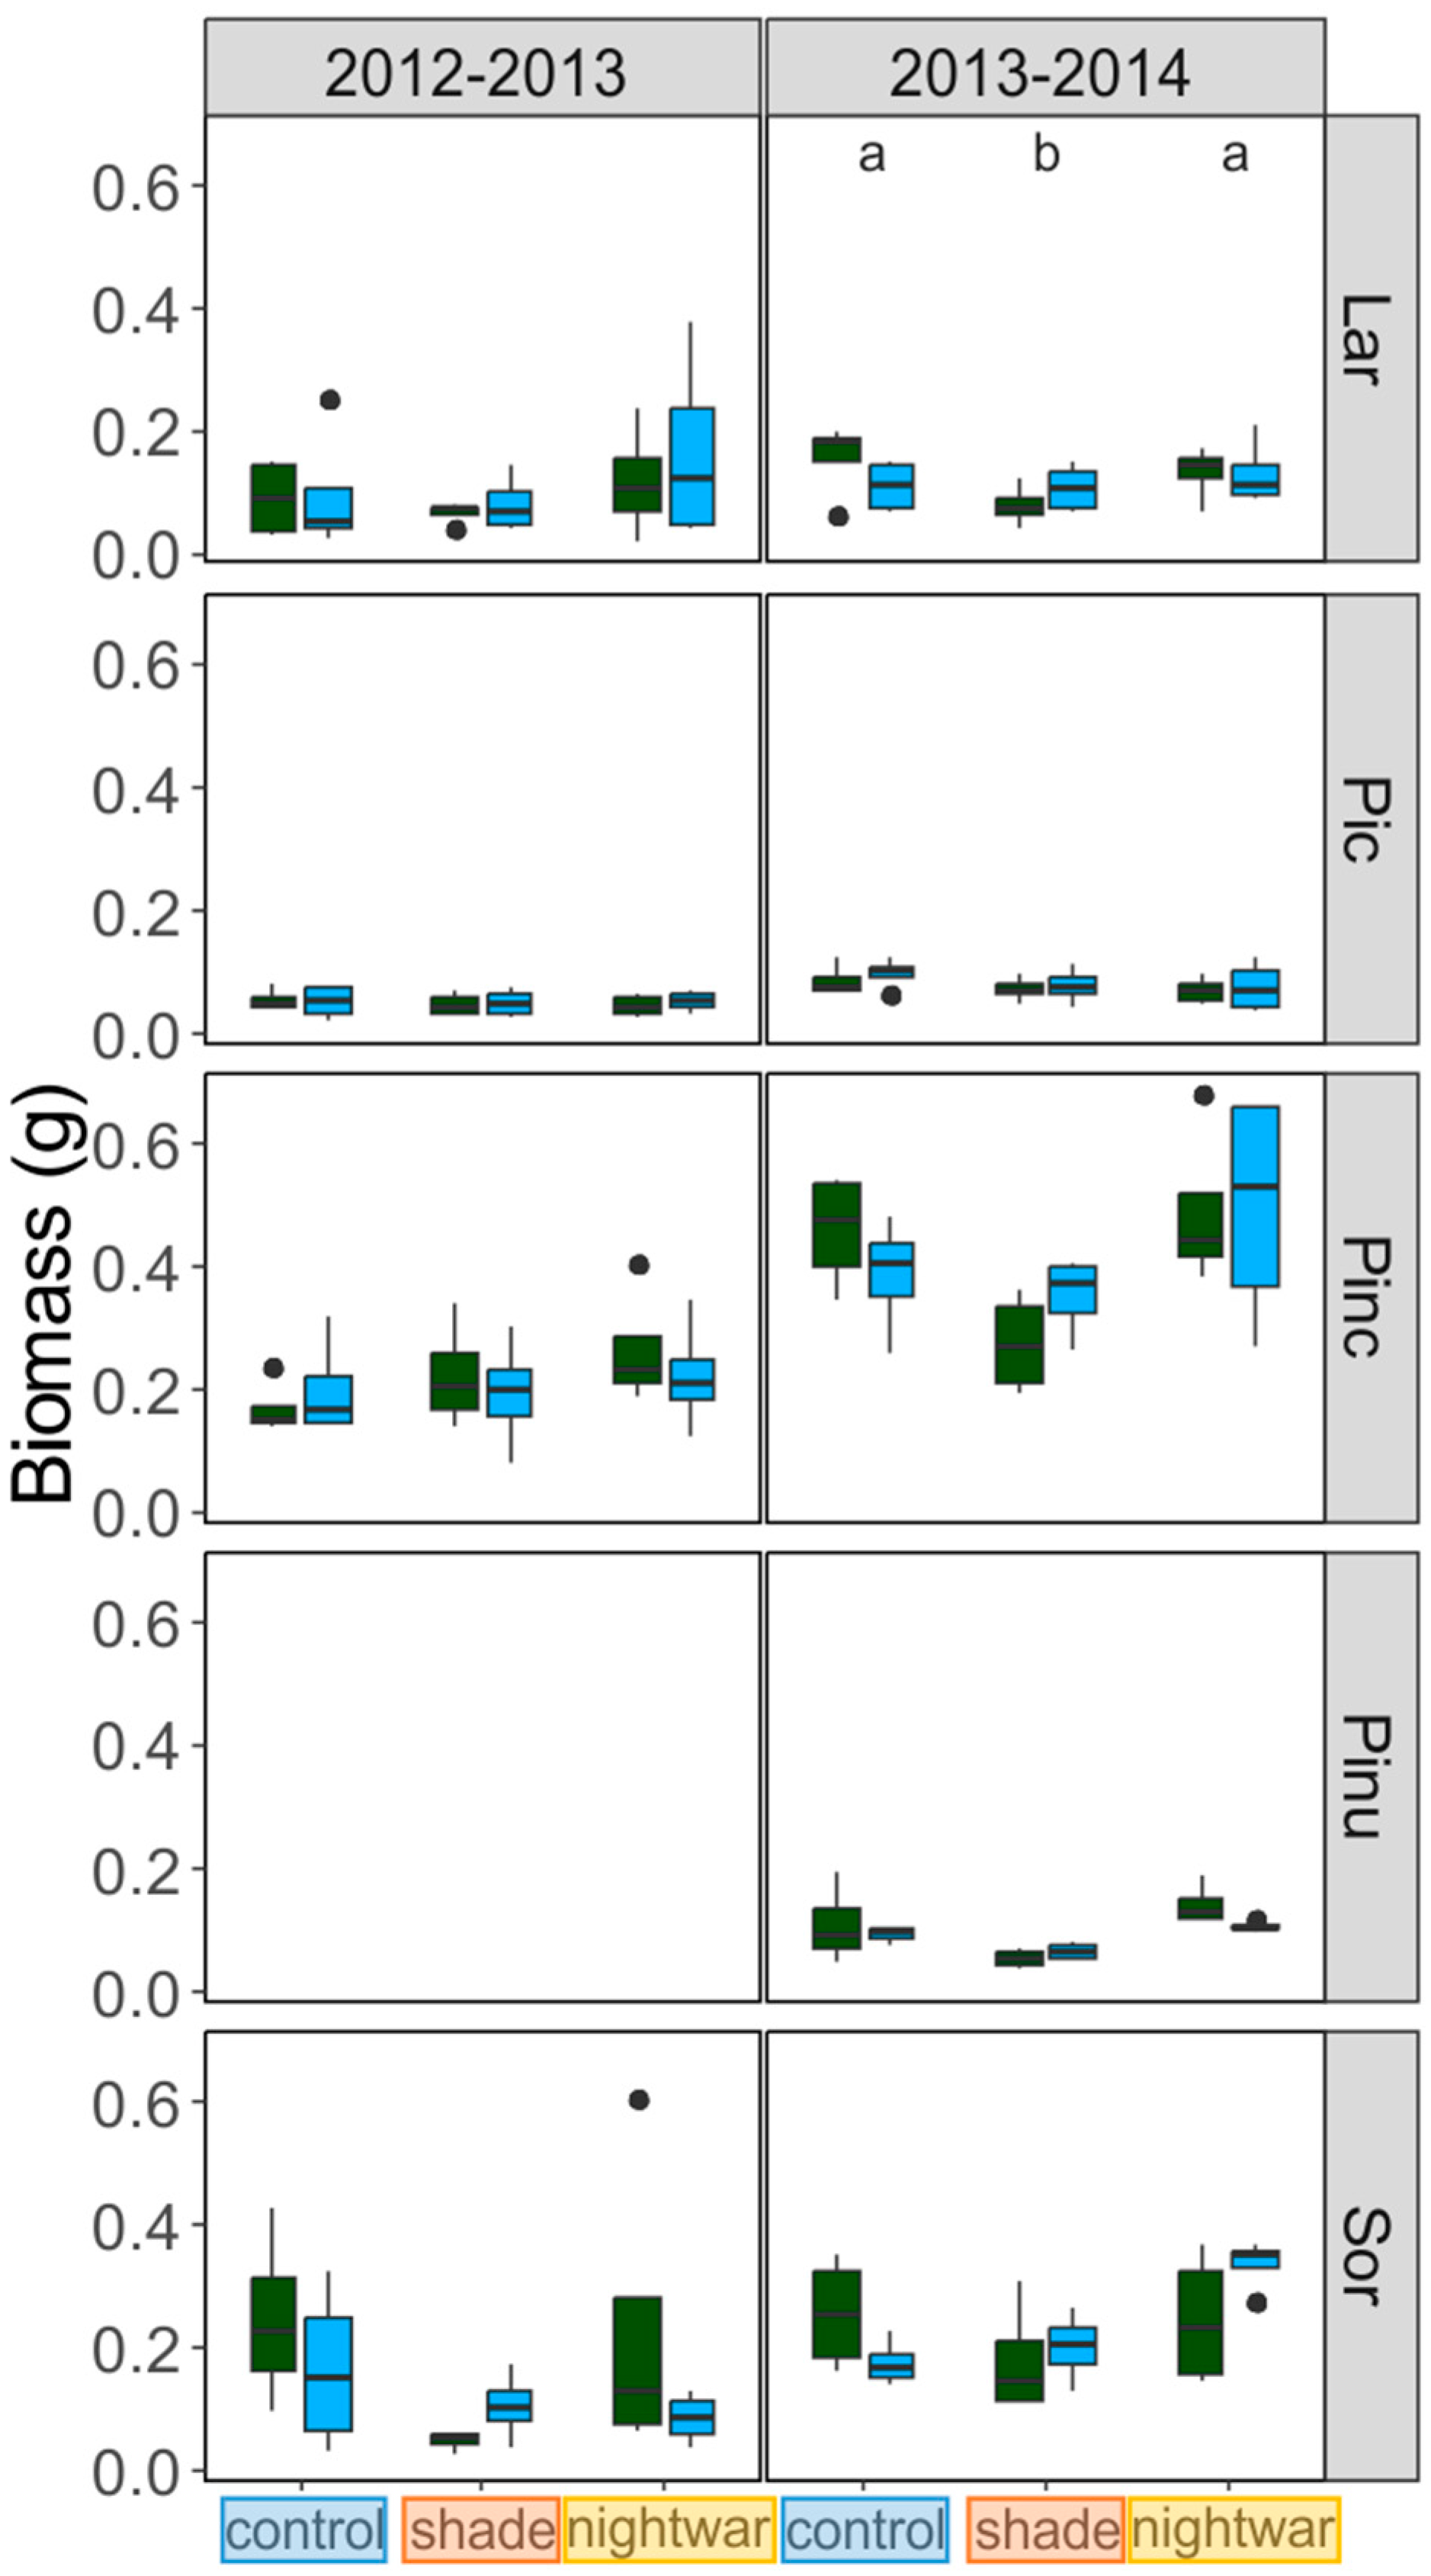
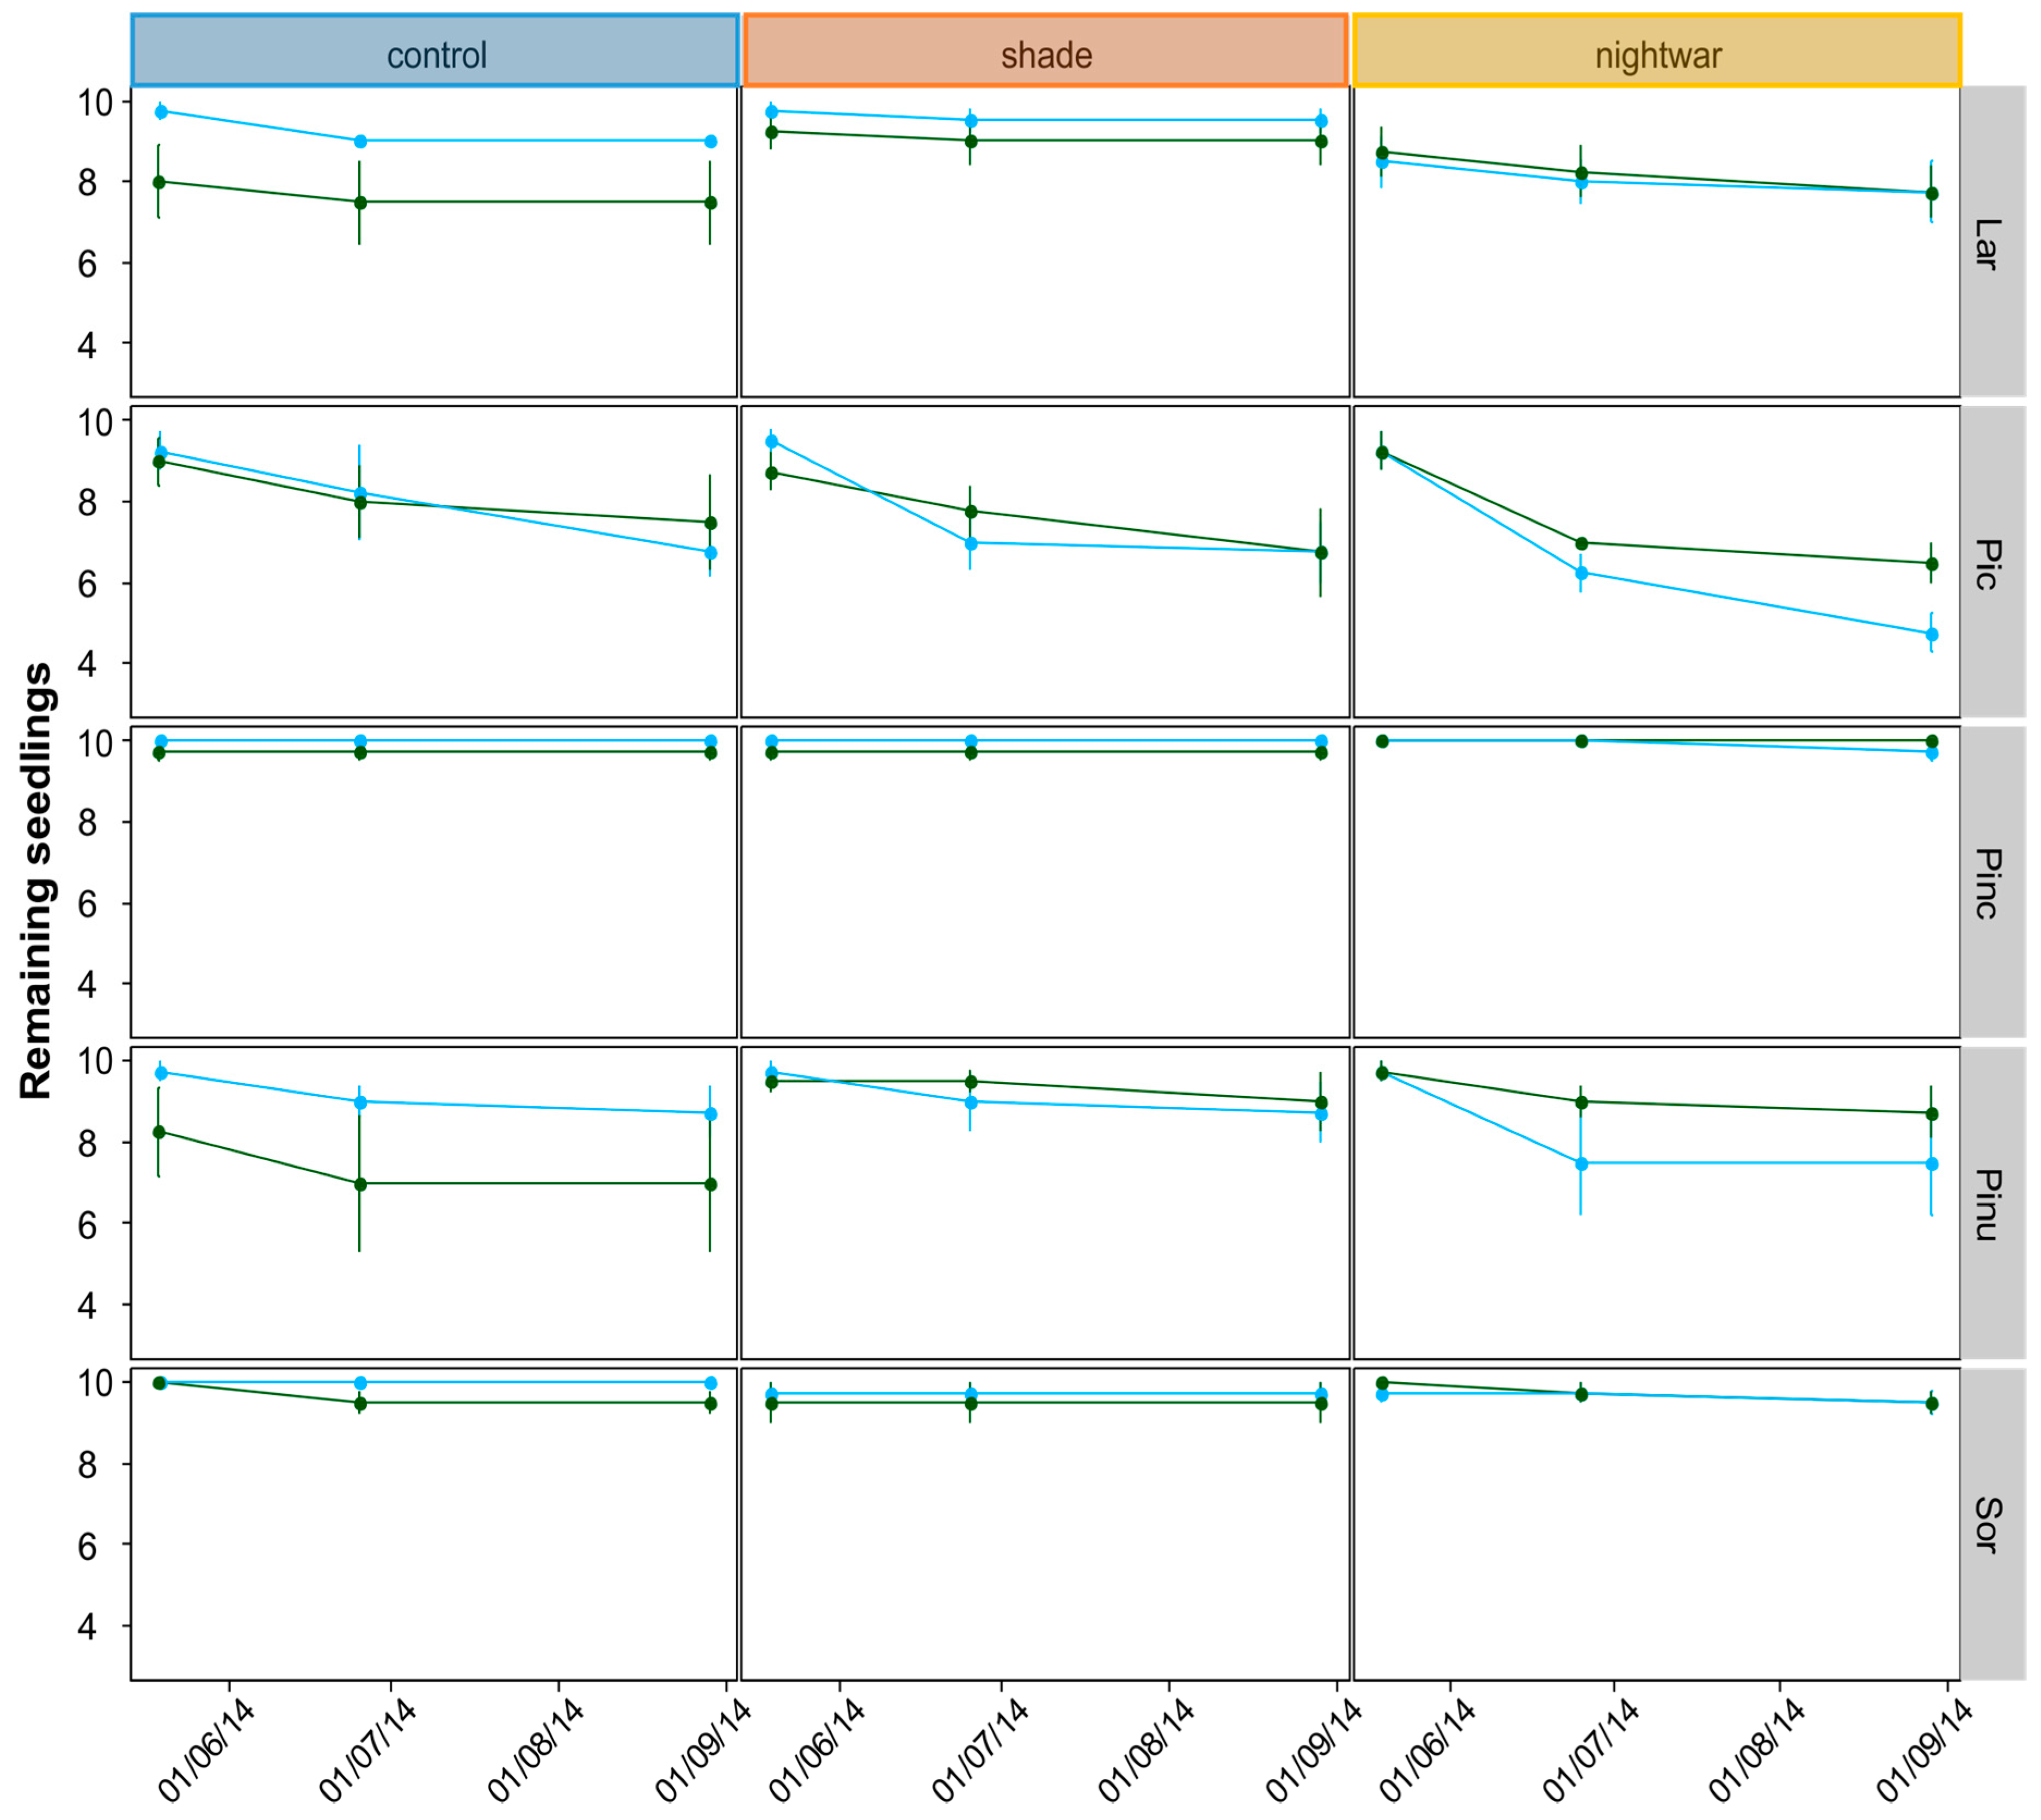
Starting at snowmelt, survival and the cause of observed mortality were recorded monthly during the growing season. Seedling size (height, longest-leaf length, number of shoots, and number of leaves) was recorded for all seedlings at the end of their first growing season in the field (August) and, for the 2012 seedlings, also after snowmelt in the second year (June). Biomass growth was studied by sampling two seedlings per plot (one in 2014) at the end of the growing season (September) and determining their dry weight.
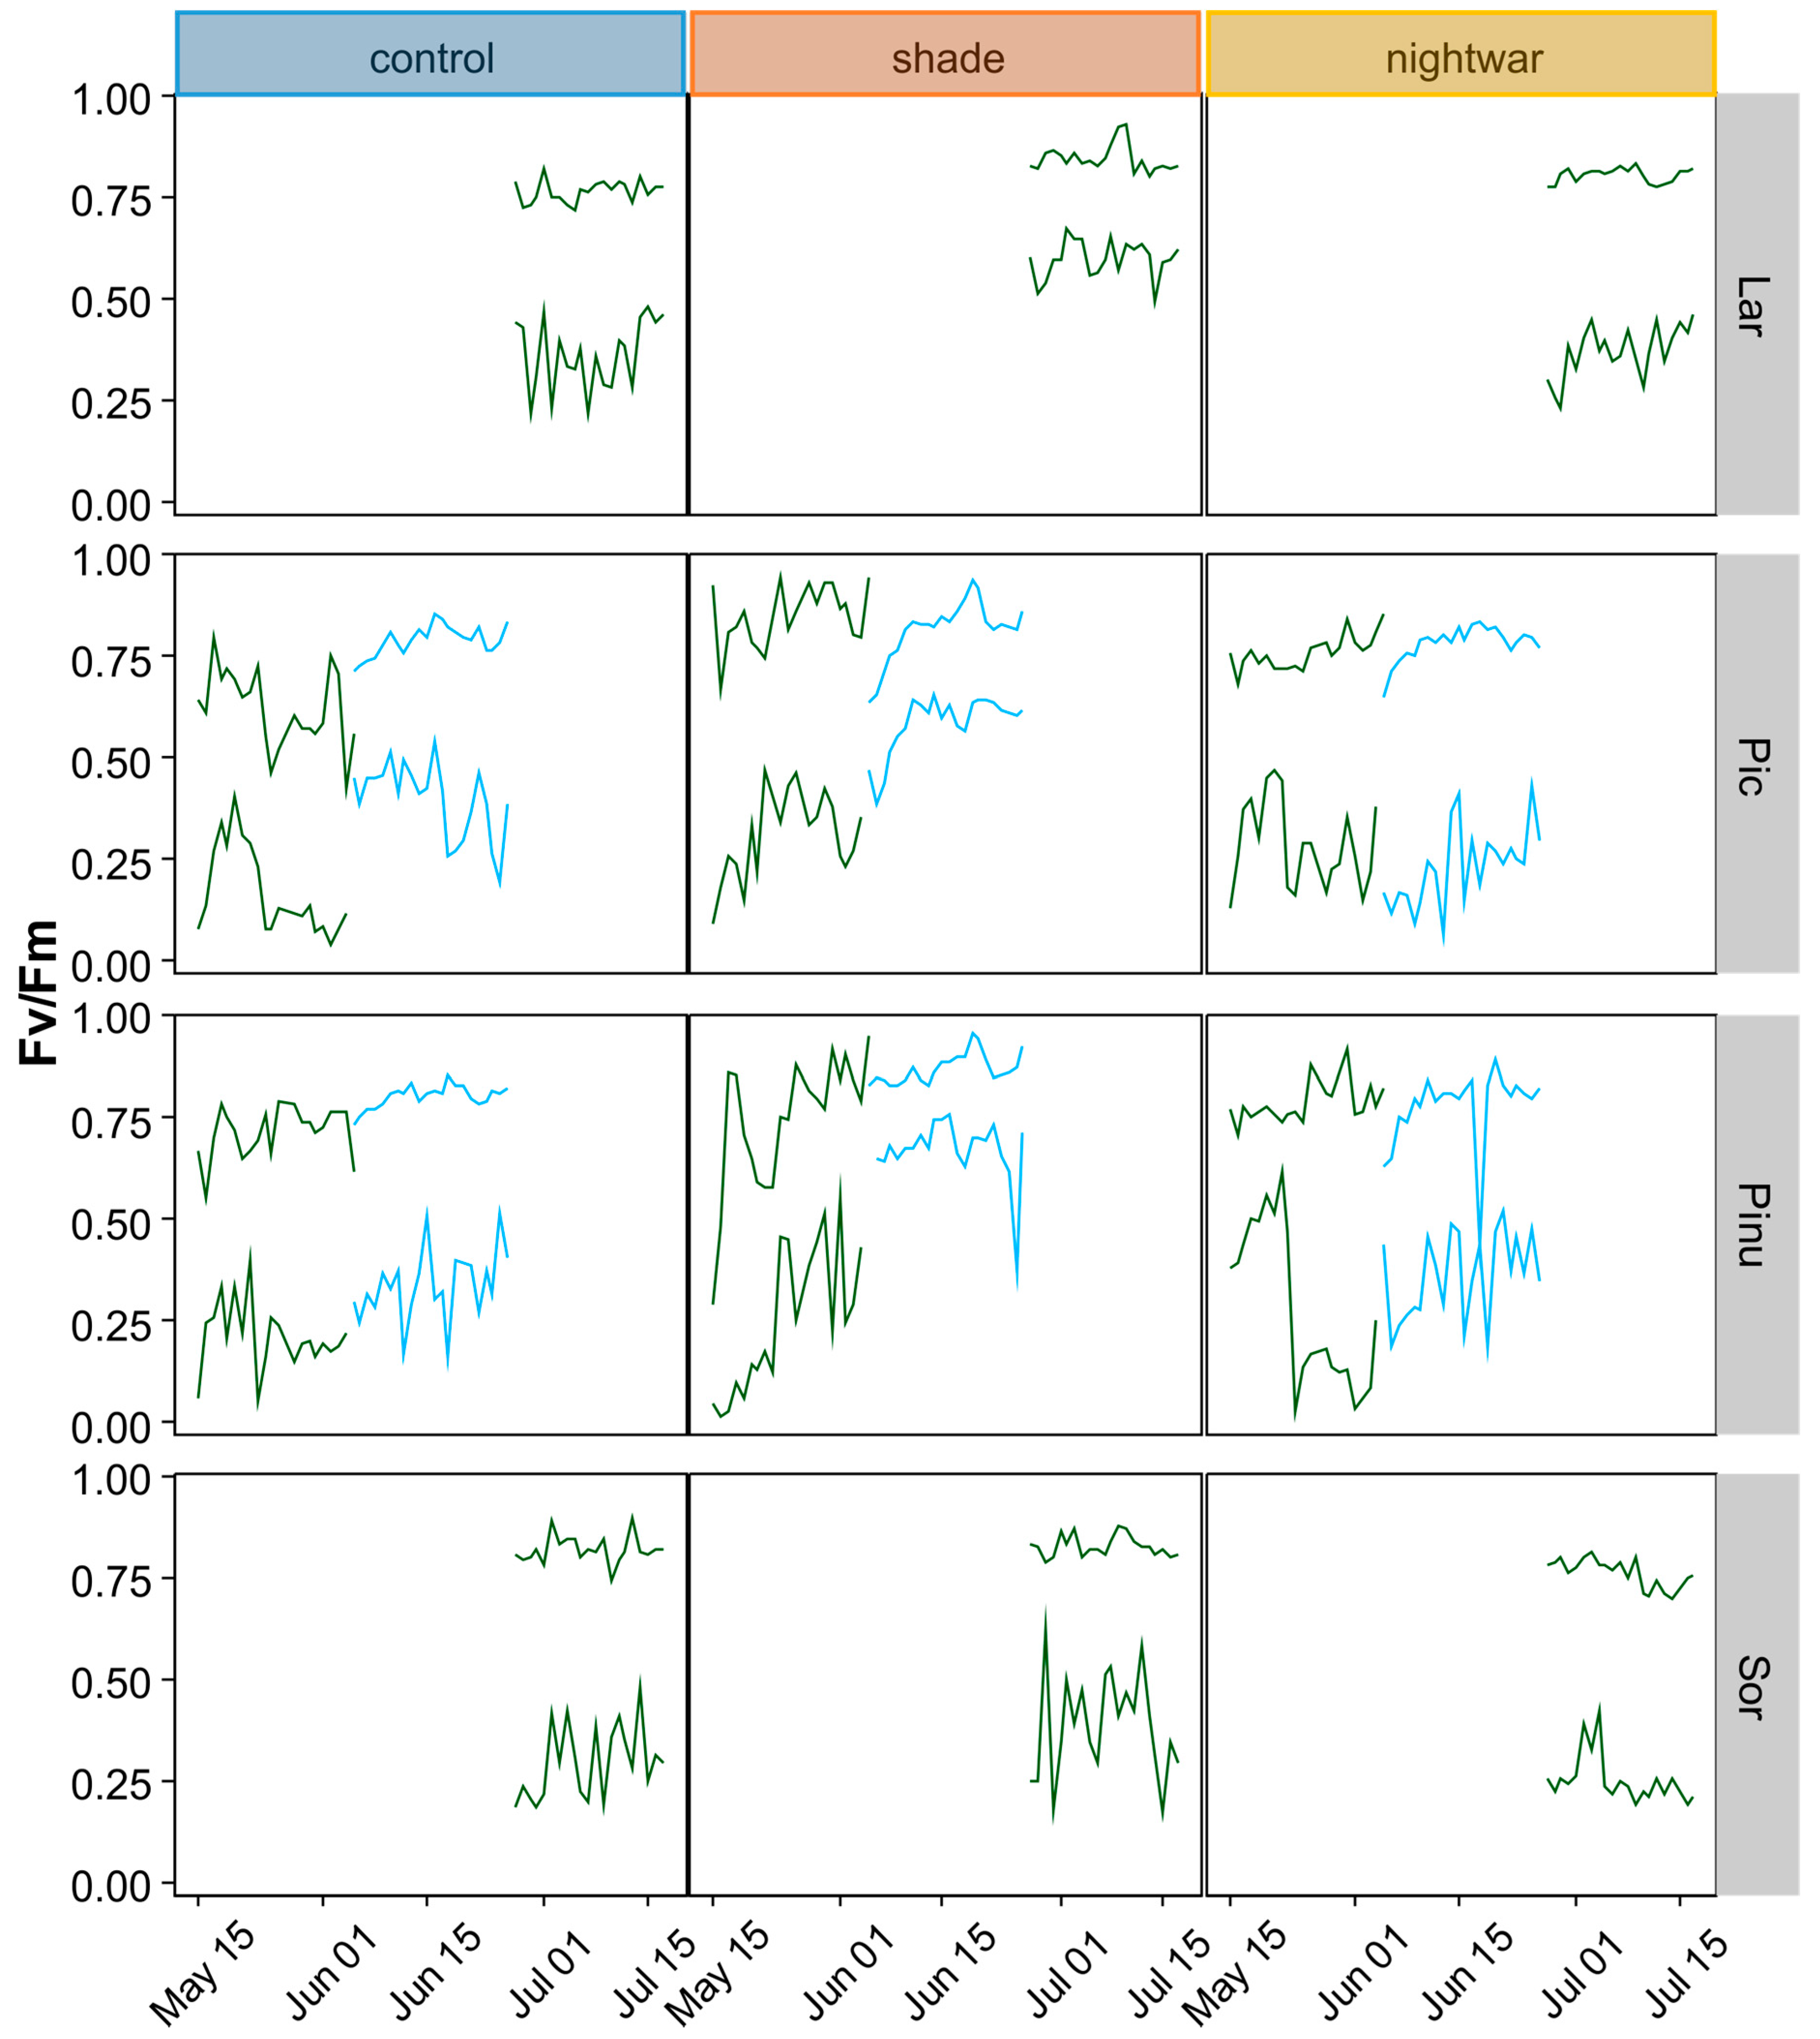
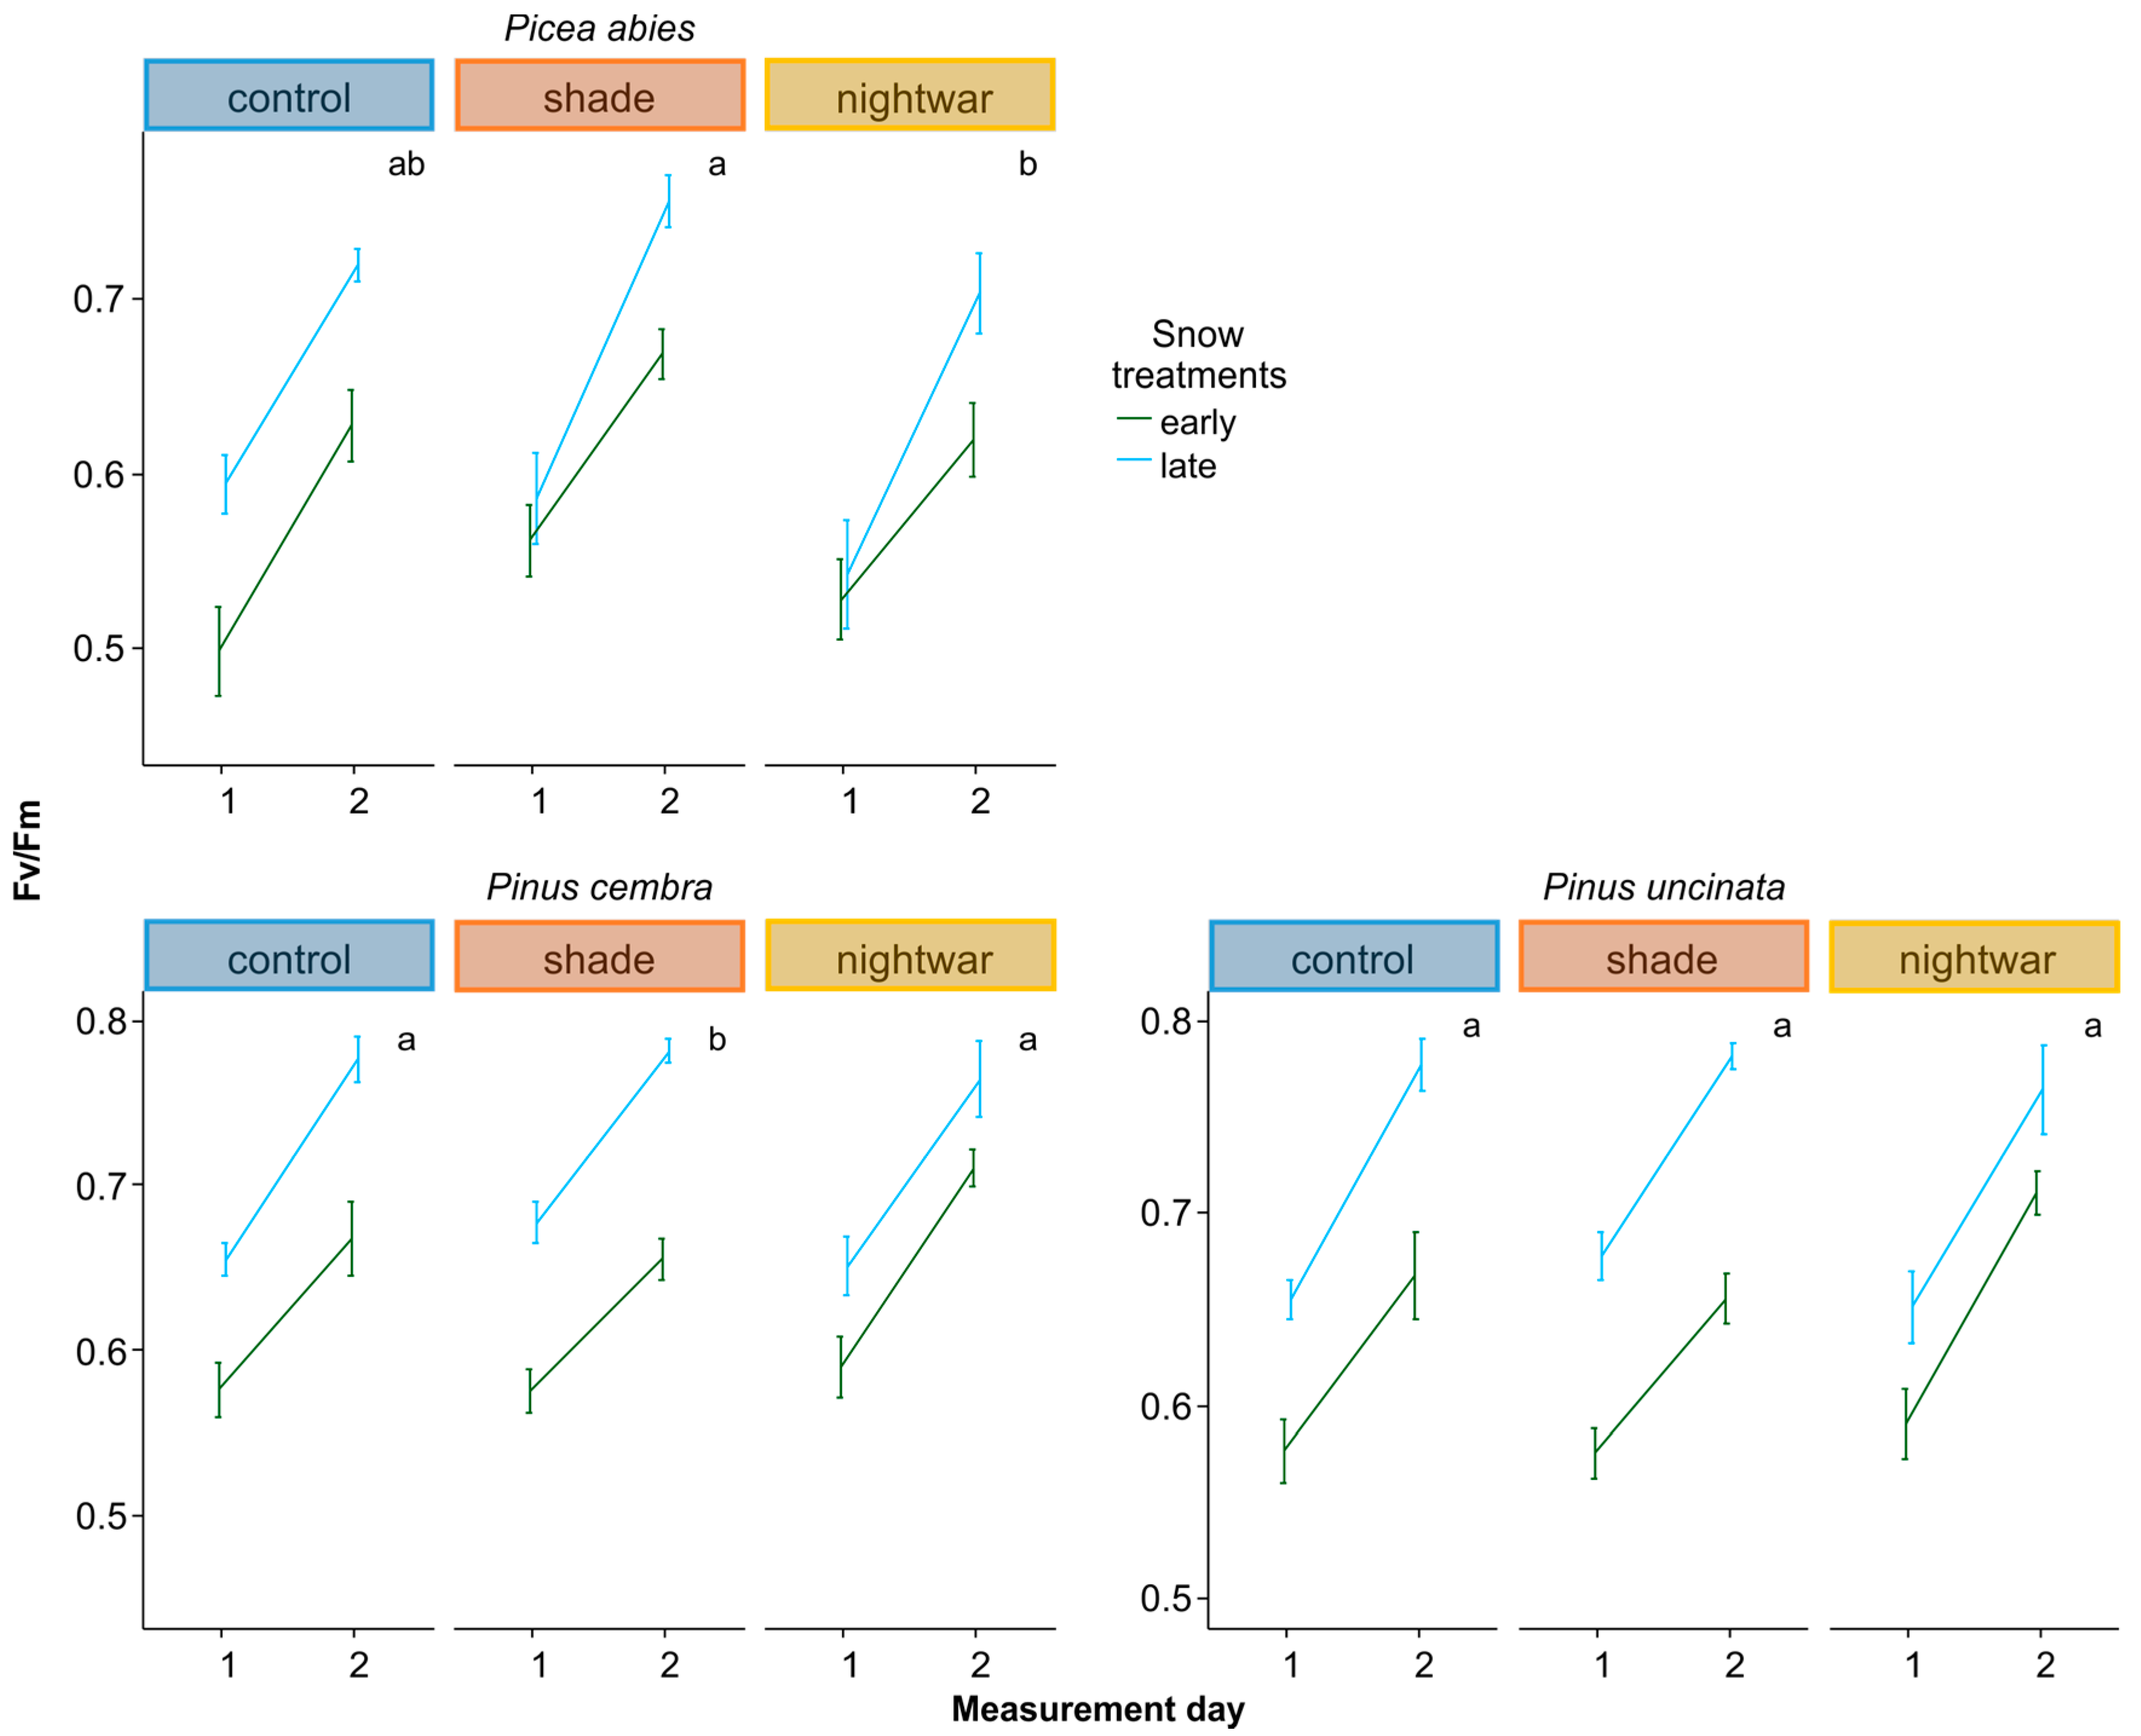
To assess whether seedlings were physiologically stressed, we measured chlorophyll fluorescence in summer 2013 and in spring 2014, determining pre-dawn quantum yield (Fv/Fm). Lower Fv/Fm values indicate a reduced quantum efficiency of photosynthesis, indicating that plants are increasingly stressed; values above ca. 0.7 are taken to be normal for healthy plants (0.83 corresponding to maximal efficiency), whereas values below are taken to indicate stress [
46]. In 2013, we determined Fv/Fm shortly after snowmelt (10–11 June) and in the middle of summer (25–28 July), spreading the measurements over several days (one to two blocks per day) because of the time needed to measure all seedlings and the necessity to measure before dawn. In 2014, we determined Fv/Fm on two days per snow treatment, eight and 20 days (eight and 16 days for the late plots) after snowmelt, in the seedlings planted in autumn 2013. We used a hand-held PAM-fluorometer (Mini PAM, Walz GmbH, Effeltrich, Germany). Additionally, to analyze the influence of weather conditions on physiological stress, we monitored chlorophyll fluorescence, determining Fv/Fm (or ΔF/Fm′ during daylight hours) every two hours, using a monitoring PAM-fluorometer (Moni-PAM, Walz GmbH, Effeltrich, Germany) with custom-made probes for measuring small seedlings at ground level. Simultaneous monitoring was done with six probes installed to measure six seedlings of two species in three treatments. Measurements took place during the first three weeks after emergence from snow (15 May to 4 June 2014 for the early-emerging plots and 5 to 26 June 2014 for the late-emerging plots) or after the development of leaves (27 June to 17 July for
Sorbus and
Larix).
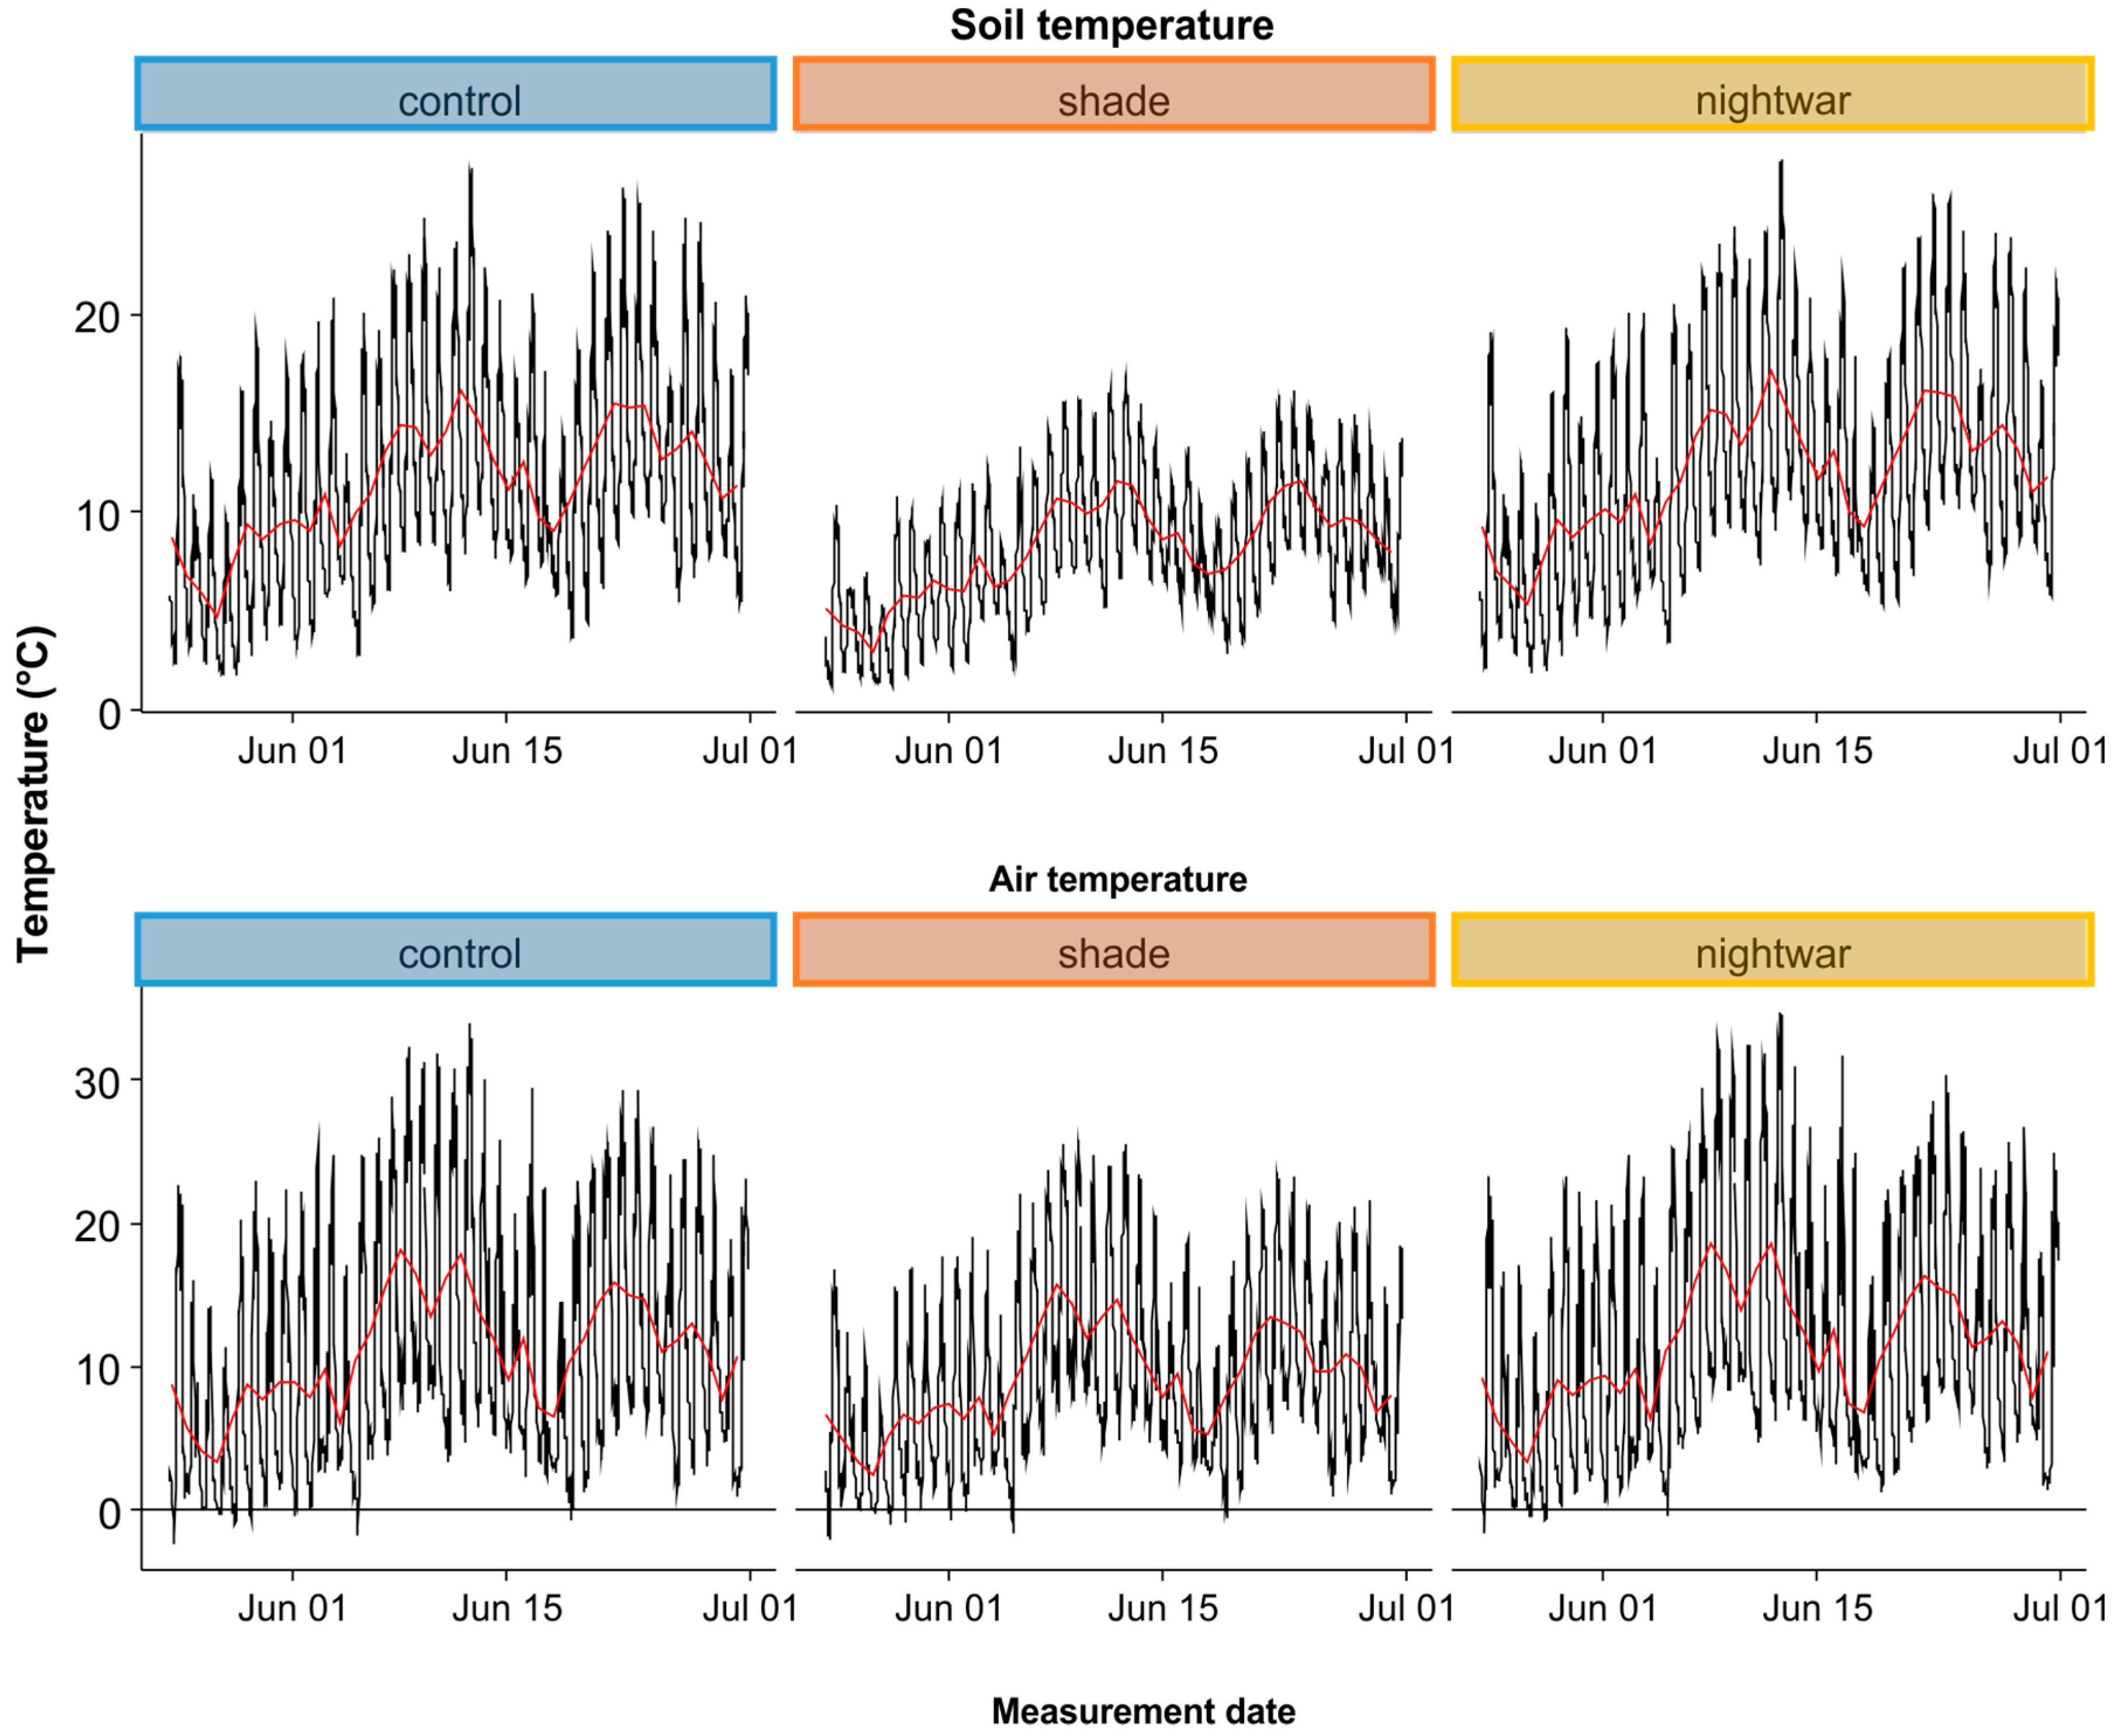
2.4. Microclimate
Sky-exposure treatment effects on microclimate were assessed with dataloggers with external temperature sensors (Model ProV2, Onset Corp, Bourne, MA, USA), monitoring air (sensor protected by a sunshield, at 10 cm above the ground) and soil (at 5-cm depth) temperature in three plots per treatment. All sensors were placed in a central position in the plot and data were recorded in 30-min intervals. Additional climate data were available from a standard weather station near the study site at the Lautaret pass (Reseau d’Observation Méteo du Massif Alpin—Col du Lautaret,
http://romma.fr).
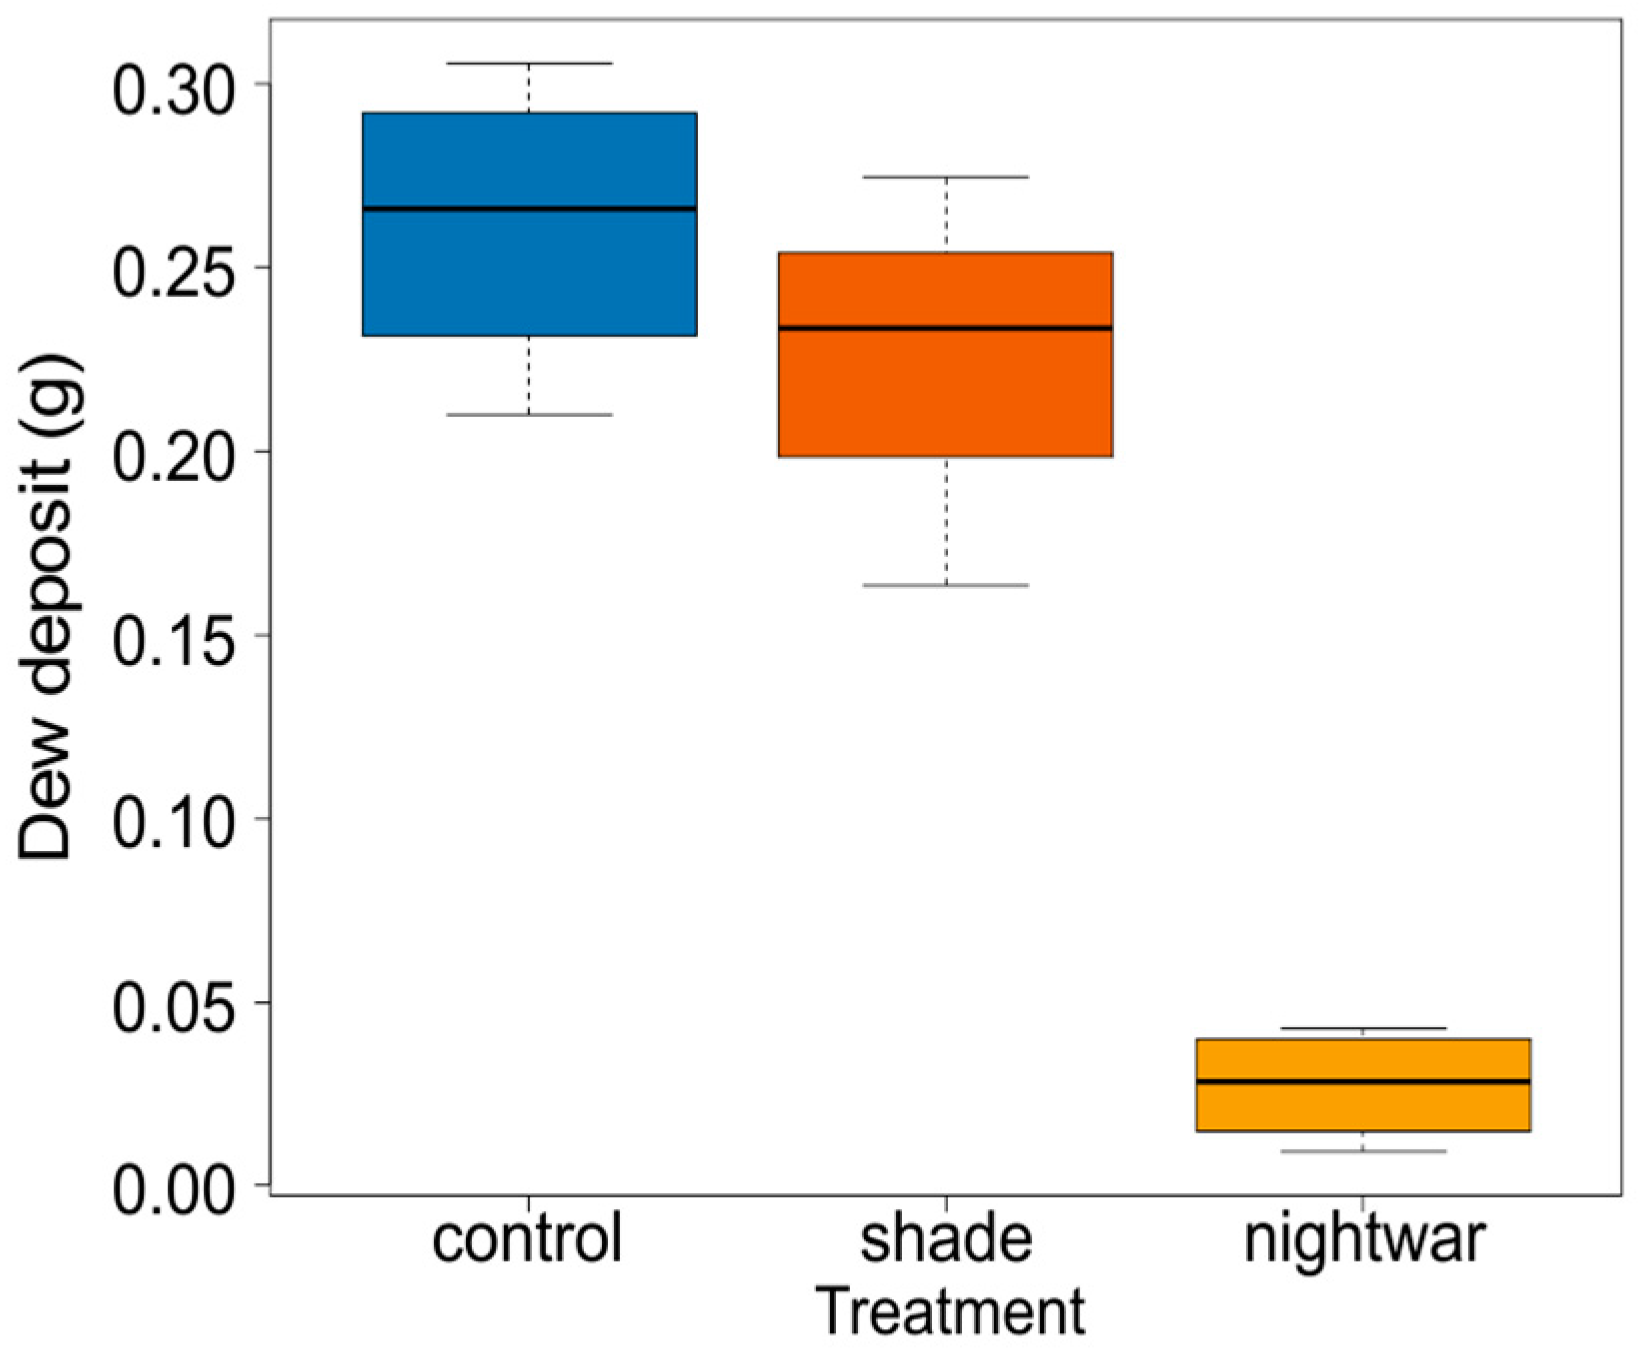
To show the effect of the night-warming treatment on dew-water input and night-time surface temperatures, we collected dew from the top of our temperature-sensor sunshields, which provided a standardized smooth white plastic surface (ca. 5-cm diameter) at about 10-cm height in all treatments. Dew was collected in the three sky-exposure treatments in the four blocks (12 observations) before sunrise on a morning with strong dewfall. To this end, 12 dry filter papers were sealed into plastic bags and weighed, then taken out in the field and used to absorb all dew from the respective sunshields, before being placed back into their bag and reweighed.
2.5. Statistical Analysis
To assess the effects of snowmelt timing and sky exposure and their interactions on seedling biomass, leaf fluorescence, and final mortality, we used generalized linear models (GLMs). The three response variables, Fv/Fm, mortality at the end of the 2014 growing season, and biomass at the end of the first growing season, were analyzed in separate models, and separately for seedlings planted in 2012 and in 2013. A gamma error distribution was used for Fv/Fm and biomass and a binomial distribution was used for mortality [
47]. Full models always included snow treatment, sky-exposure treatment, species, and their interactions, while block was included to control for spatial heterogeneity. Non-significant terms were removed from the full models using backward stepwise selection. Significant interaction terms were only maintained in the models when they improved the AIC by at least 10 units. Post-hoc comparisons were made using least-squares means [
48] and Tukey adjustments.
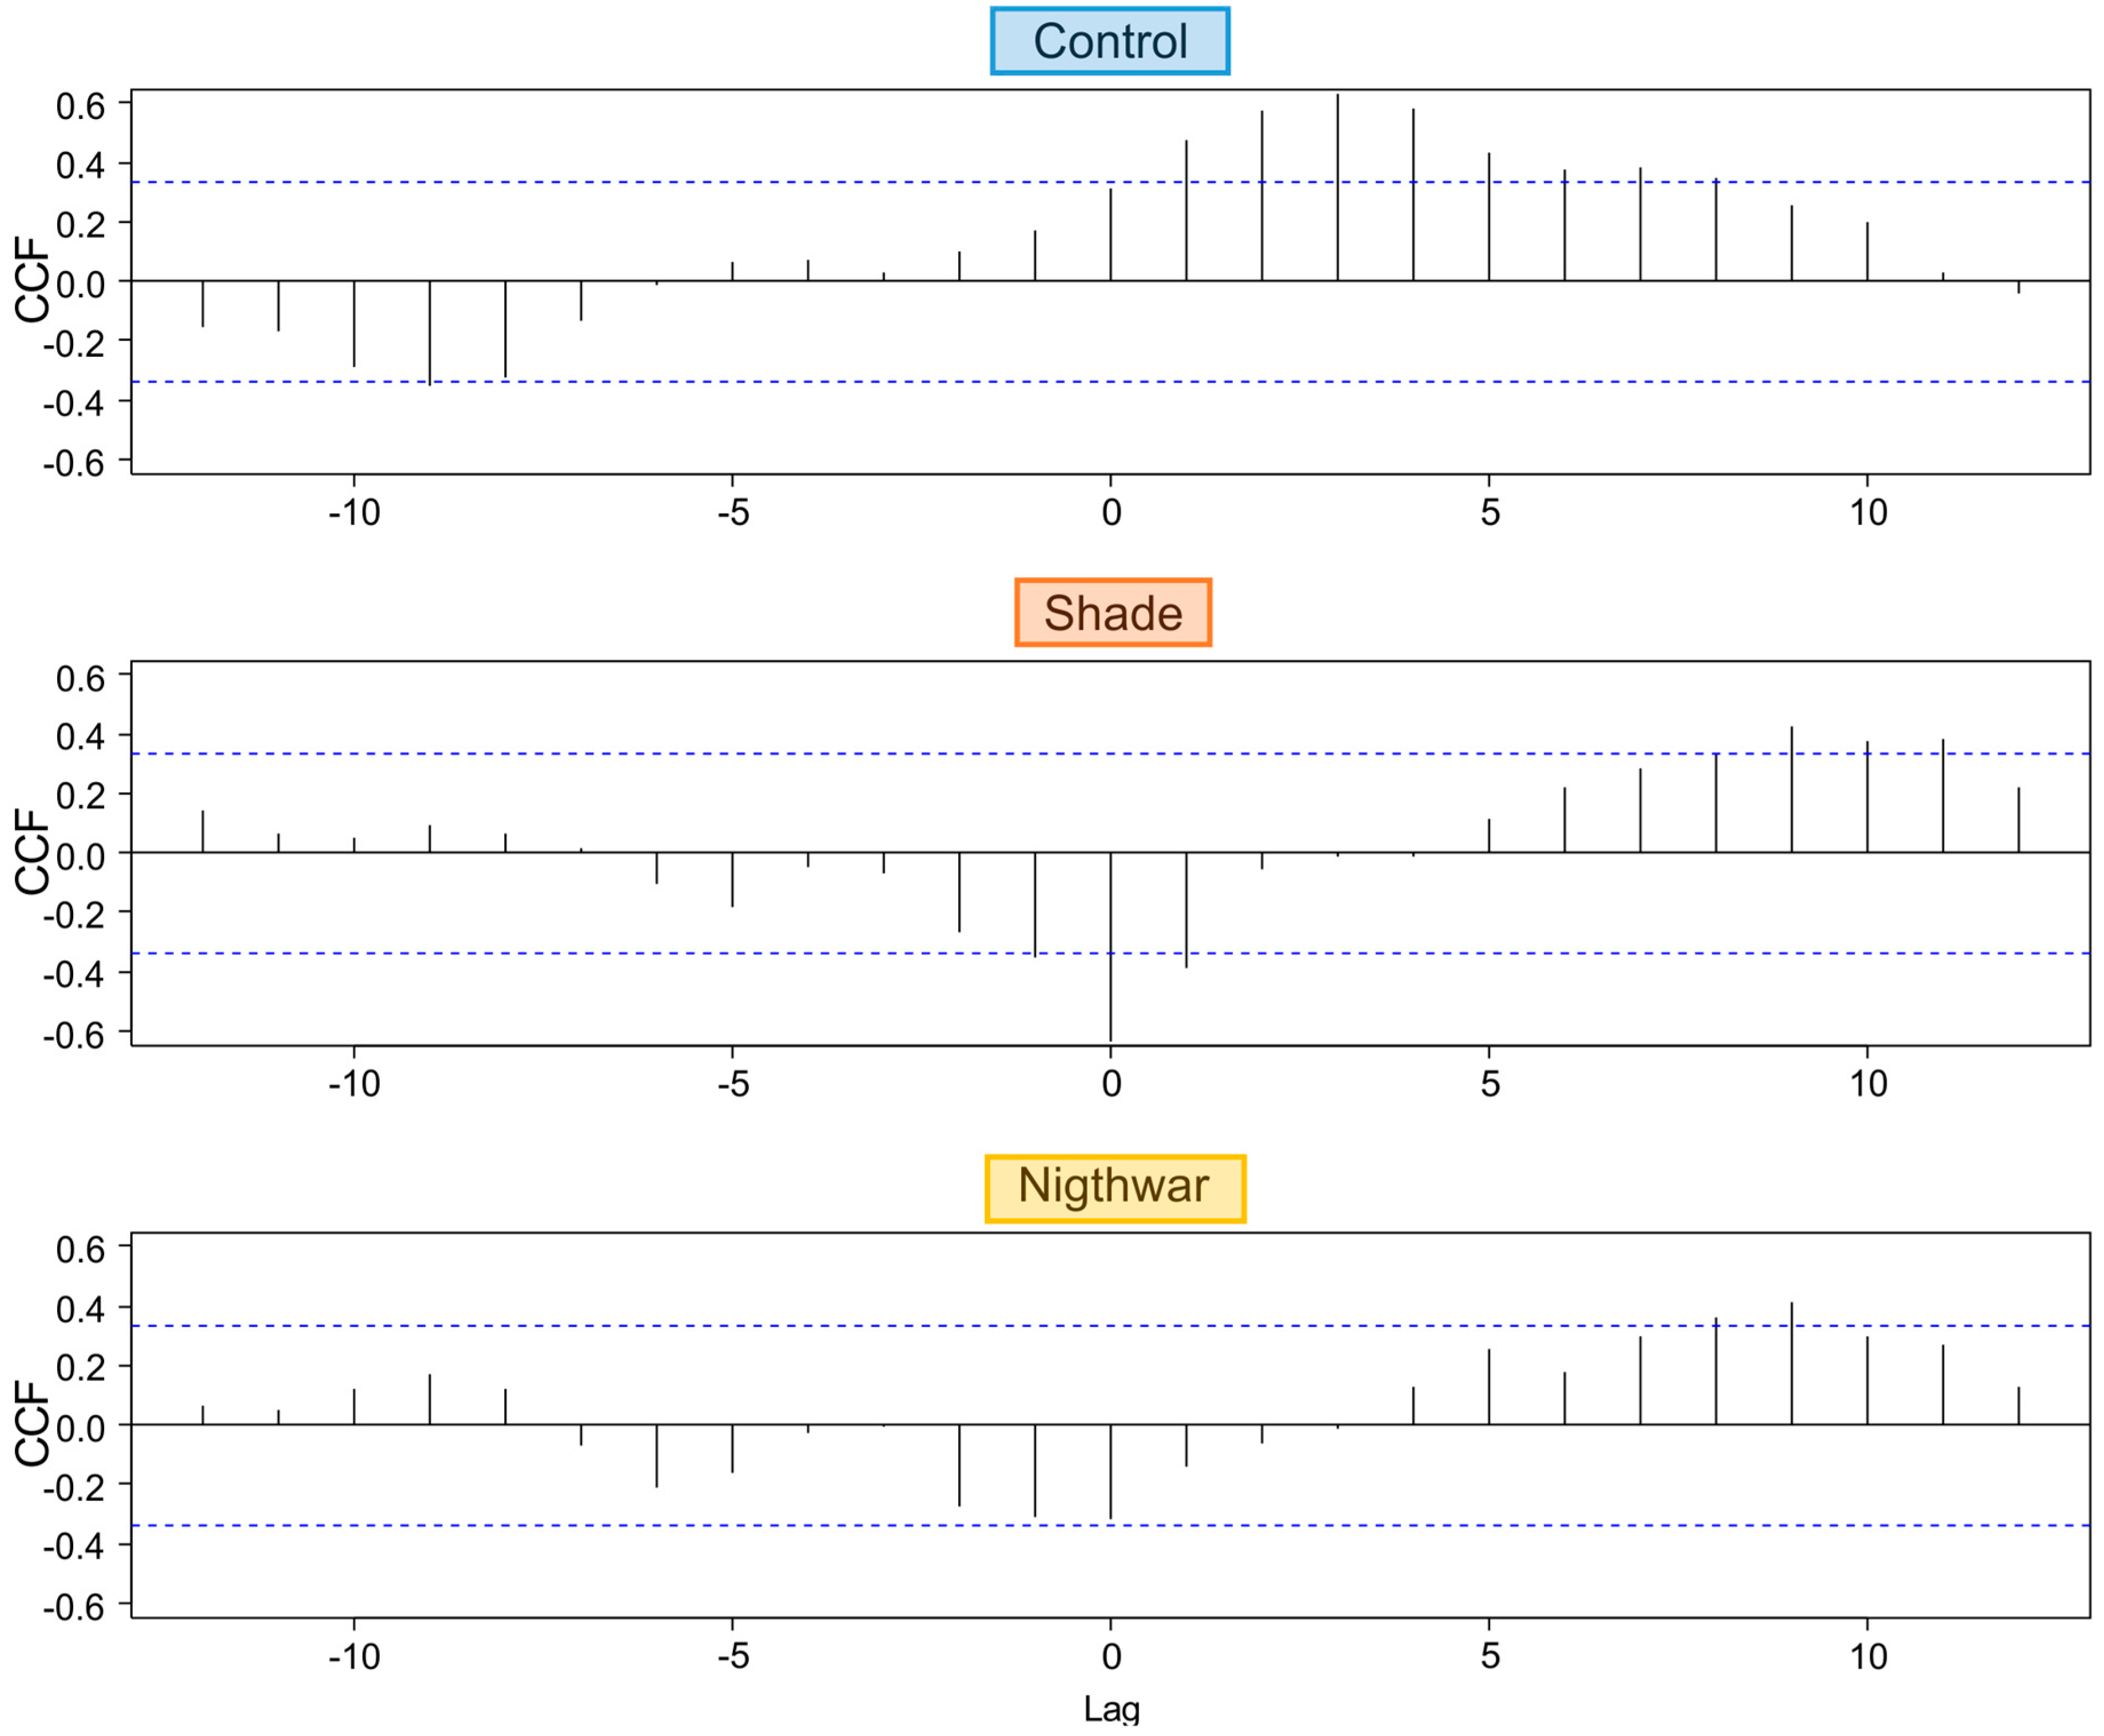
To test whether and for how long low night temperatures negatively affected pre-dawn Fv/Fm, we calculated cross-correlations between daily minimum temperature and daily maximum Fv/Fm for a period of 33 days. We used the R function
ccf [
49], which calculates estimates of the cross-correlation of two univariate series. The function is useful to predict lags (time units = days) over which variable “a” (here: minimum temperature) may predict variable “b” (here: maximum Fv/Fm).
To test not only the differences in final mortality (tested using GLM) but also in survival rates through time, we used a survival analysis separately for each species and for the seedlings planted in 2012 and 2013. Survival rates were based on deaths per monitoring time per treatment. Survival was averaged across blocks to create a survival curve (R function surv) per treatment and tree species. We used the R function pairwise_survdiff for pairwise comparisons of survival curves for the treatments (here we had to use the six treatment combinations as independent treatments), using a Bonferroni correction to obtain adjusted p values.
The effect of snow and sky-exposure treatments on growth, expressed in terms of plant morphology (height, leaf length, number of shoots and leaves), was assessed by means of a multivariate analysis of variance (MANOVA, [
50]). MANOVAs were performed separately for each species and measurement time, using the four size variables (height, leaf length, number of shoots and leaves) as dependent variables and snow and sky-exposure treatments, their interaction, and blocks as independent variables. After the overall MANOVA was calculated, univariate MANOVAs were obtained for each size variable.
Analyses were conducted using the software R 3.3.3 [
51] and the packages “lsmeans” [
48], “survival” [
52], “survminer” [
53], and “dunn.test” [
54].
4. Discussion
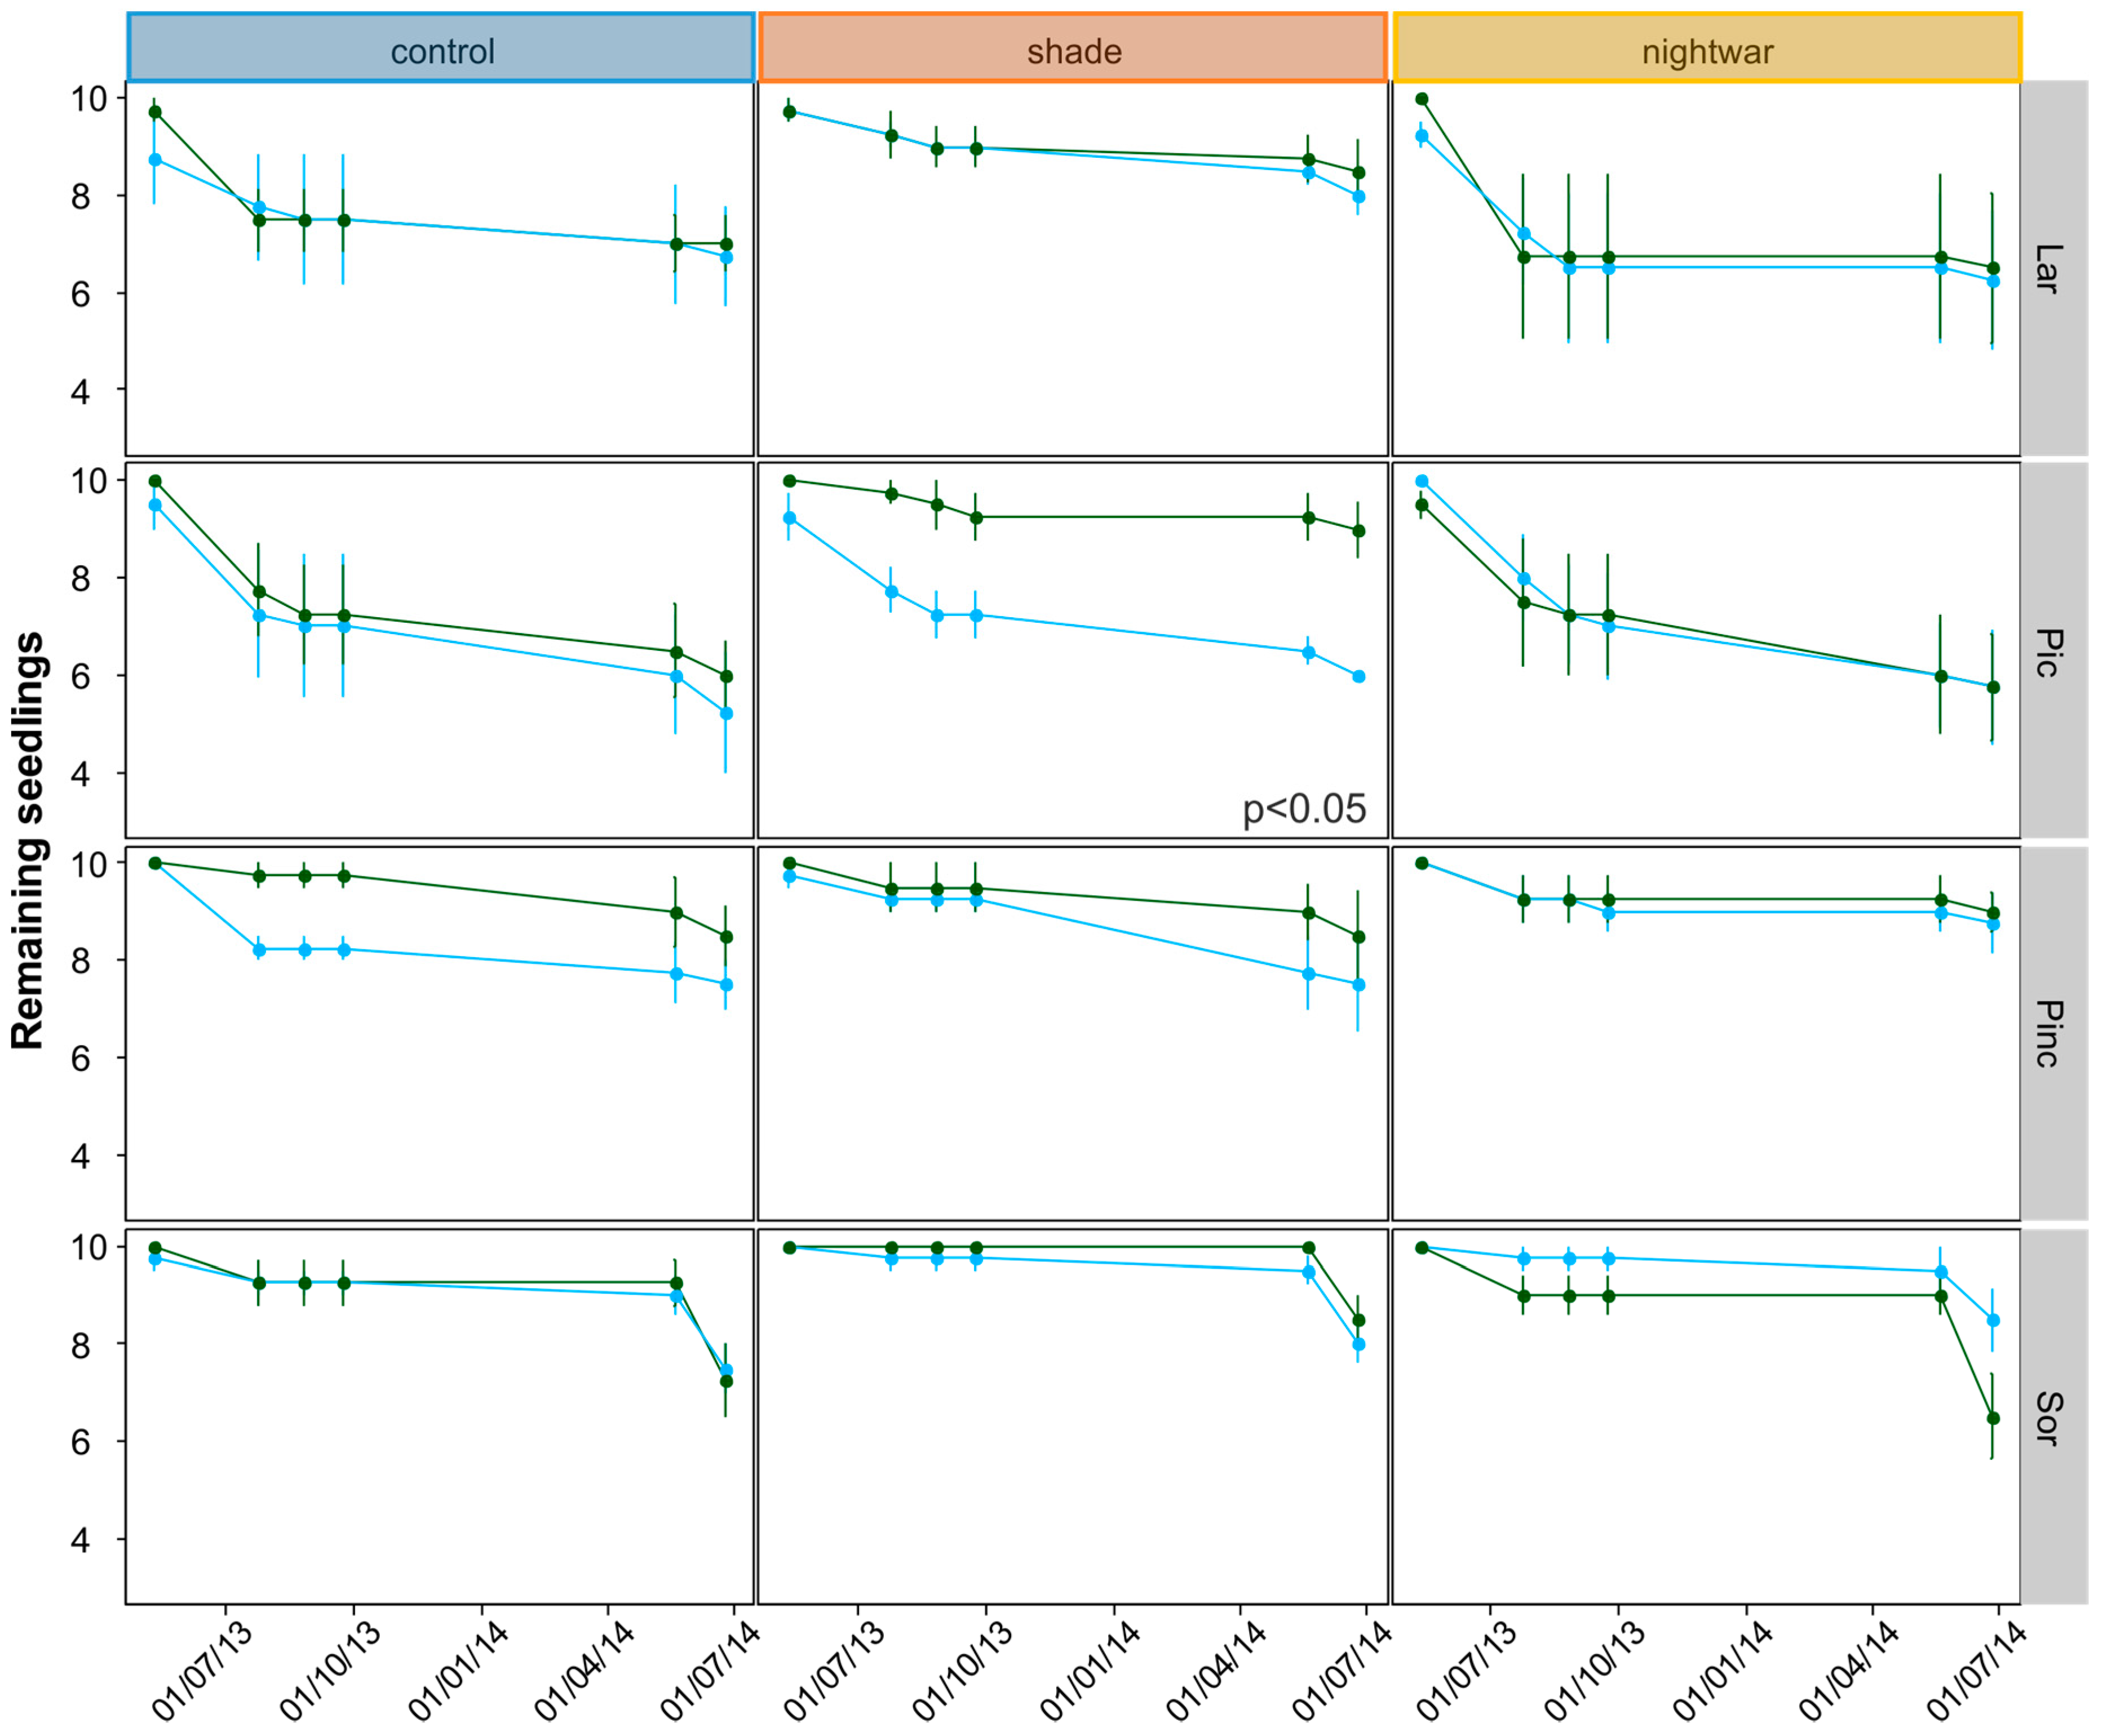
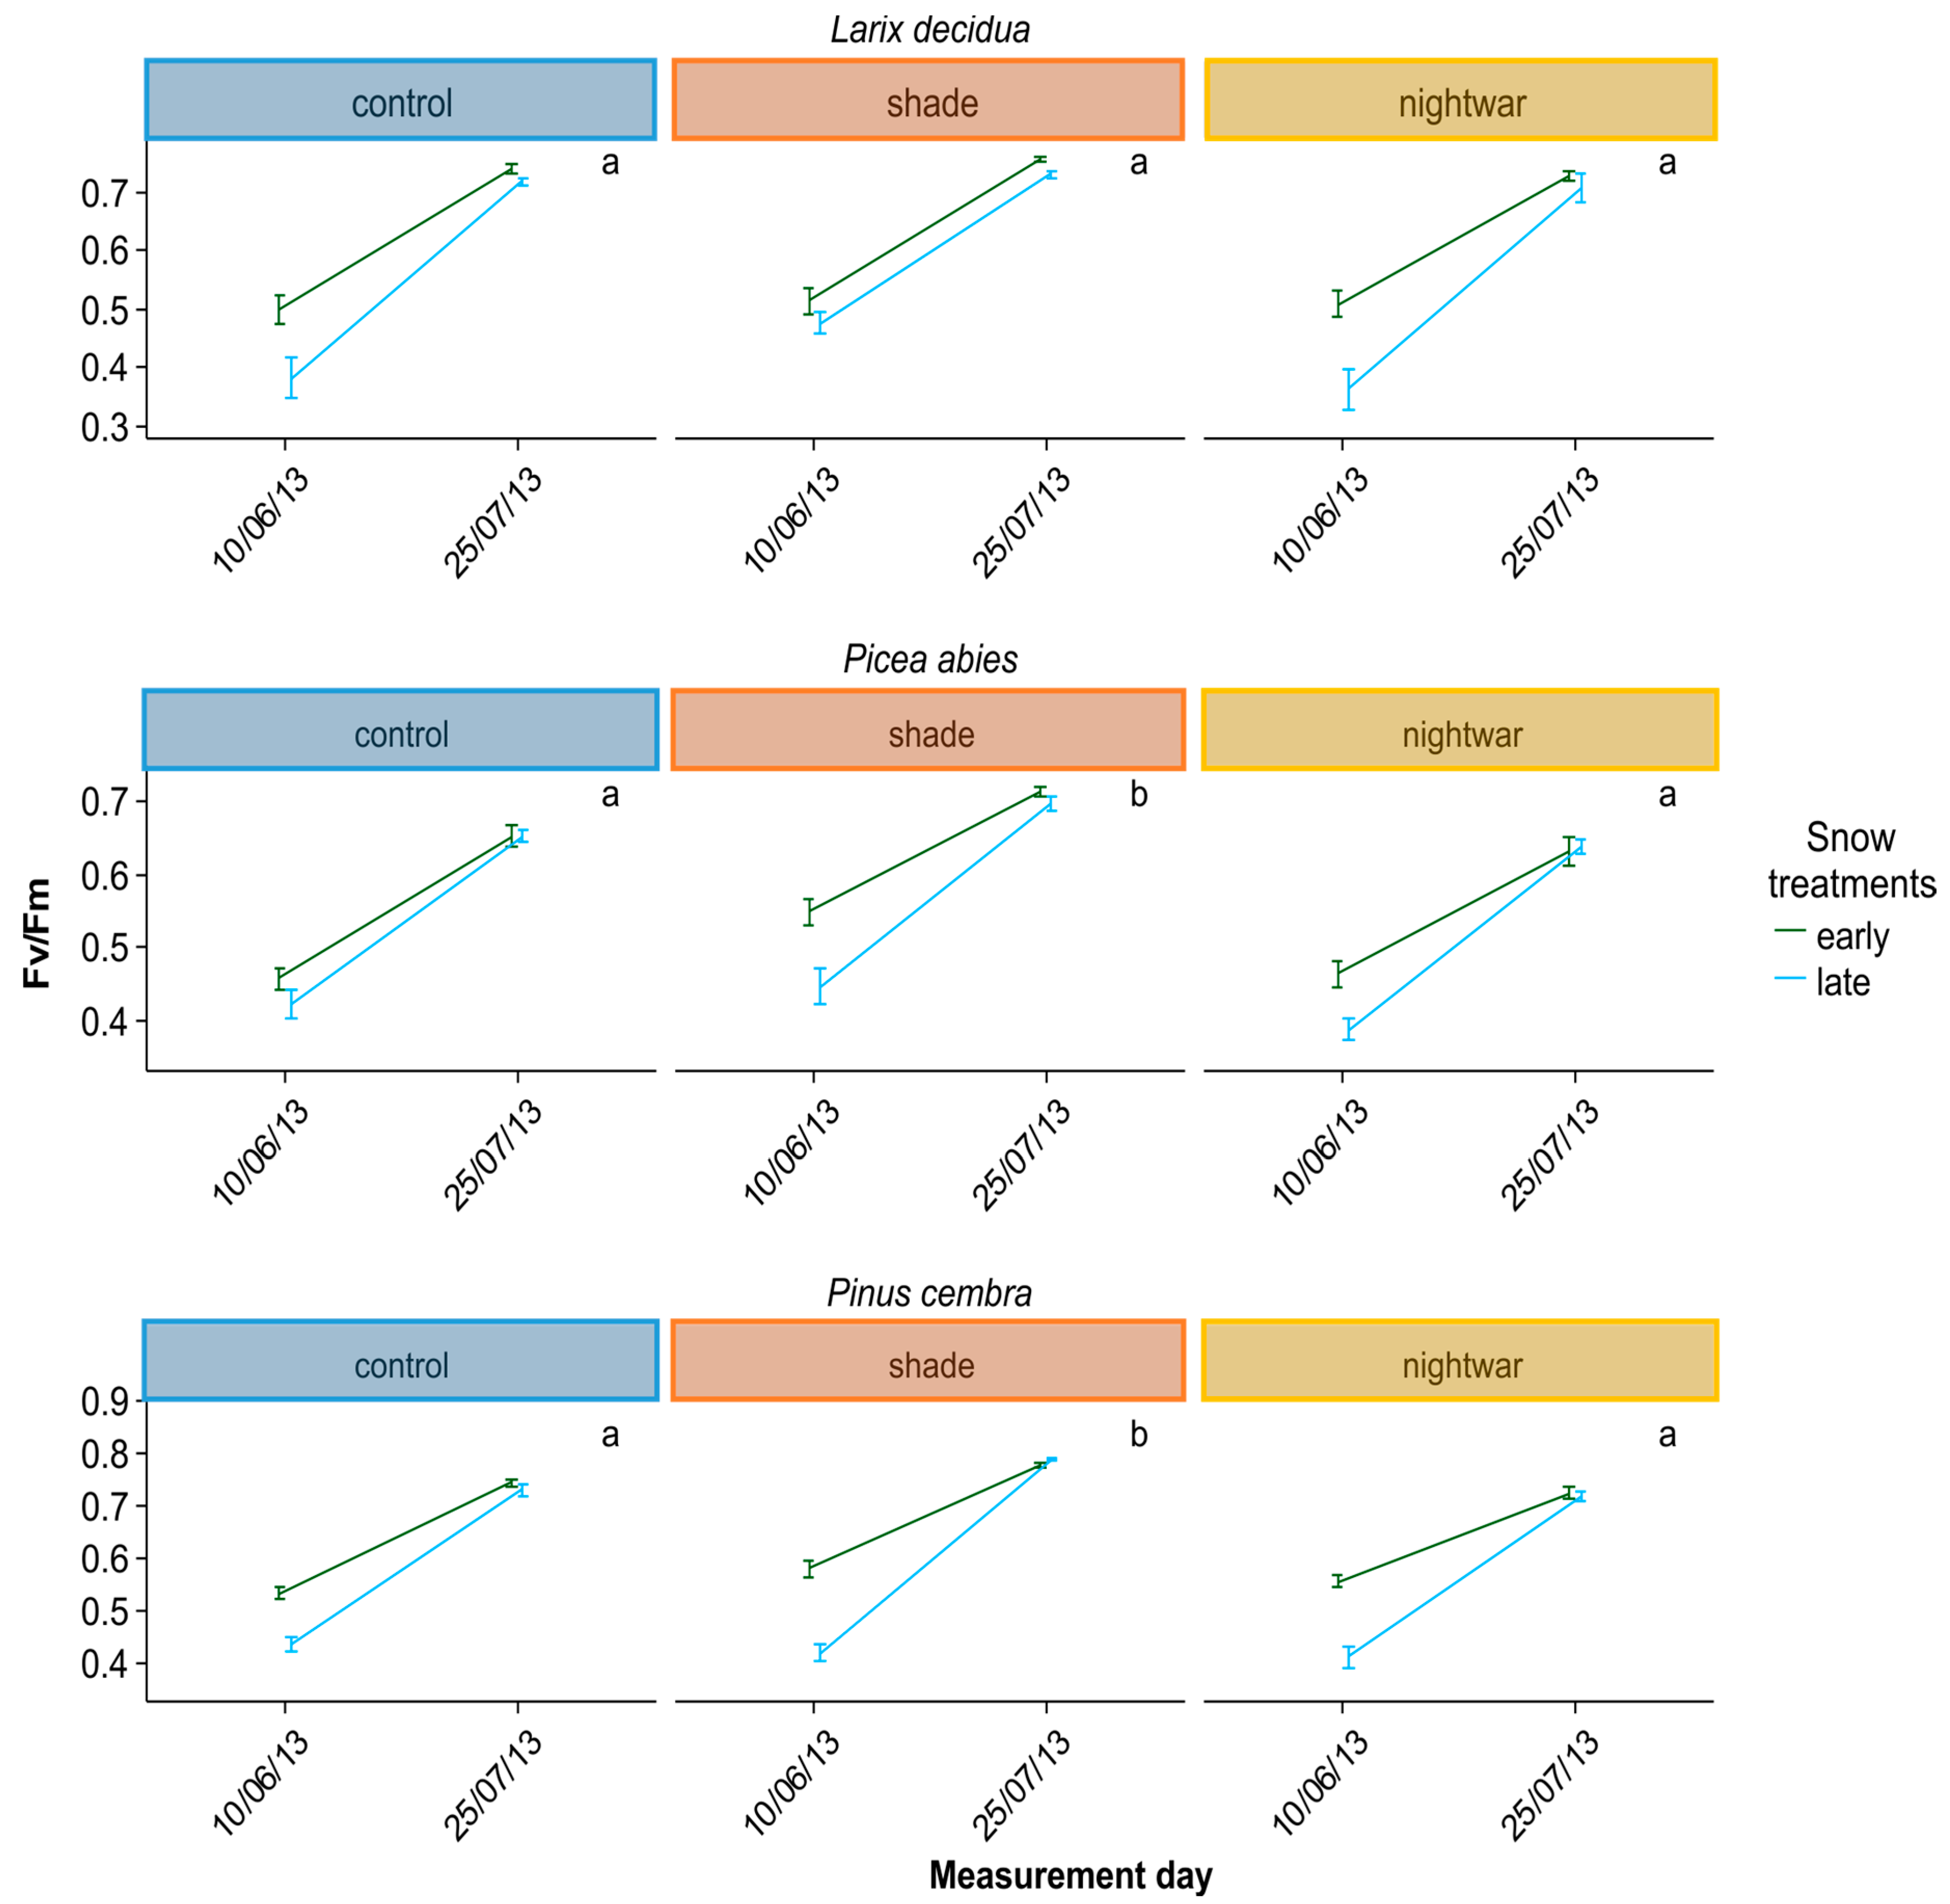
Even though all seedlings emerging early from the snow experienced stronger frosts and showed higher physiological stress in the first week after emergence than those emerging later, this stress was quickly overcome and the long-term differences in growth and survival were not clear-cut. The interactions between snowmelt timing and reduced sky exposure partly supported our hypotheses, but they were inconsistent between years and species. Overall, our hypothesis that early-emerging seedlings would experience higher stress levels was supported by the fluorescence measurement, and these negative effects were indeed reduced by shade, though not by night warming. Our hypothesis that early-emerging seedlings would show higher mortality which would be reduced by shade and night warming was supported only partly by the data. Our hypothesis that early-emerging seedlings would have lower overall growth was not supported by the data at all; no differences in biomass were found and for some species, seedlings were even slightly taller in the early plots.
Mortality after one growing season (seedlings planted 2013) differed between early- and late-emerging seedlings only in the unprotected control plots with higher mortality in early plots. This seems to be in line with our hypothesis that early-season stress after early snowmelt decreases seedling survival. However, protection did not increase survival in the early plots for the 2013 seedlings. Instead, survival was equally low in all protected plots as in the early control plots. Only the older, 2012 seedlings showed increased survival in the shade, and only in the early plots. This also seems to be in line with our hypothesis that protection is especially important early in the season. However, survival in the late-emerging unprotected plots should then be higher than in the early ones, but this was not the case for these seedlings, only for those planted in 2013. Apart from being inconsistent between years, differences in mortality between treatments were also very small. One of the reasons for these weak results may lie in the complexity of snow-cover effects. For example, in our experiment, fungi were a substantial cause of seedling death for some species only in some of the late-melting shaded plots. This suggests that in spite of reducing abiotic stress, protection by snow and shade can be associated with biotic stress, especially (snow) molds, and thus does not always have a net positive effect on survival [
16,
39].
Reduced sky exposure during the night (night-warming treatment) did not increase minimum soil temperatures, but it did increase minimum air and pre-dawn surface temperatures, leading to a reduction of cold stress. In this regard, the treatment resembles vegetation cover, which was shown to increase the minimum temperatures of seedling leaves in our study area, reducing the frequency of below-zero temperatures [
59]. Still, in contrast to a previous study in which night warming clearly stimulated photosynthetic capacity, determined by measuring CO
2 exchange, in treeline tree seedlings [
13], we did not find higher Fv/Fm values in the night-warming treatment compared to the control or shading treatment. Likewise, night warming did not affect seedling survival, indicating that frost protection in this relatively mild after-snowmelt period was not important, although it may well be important in controlling seedling mortality at more extreme treeline sites [
32,
60].
Reduced sky exposure during the day (shading) had stronger effects than night warming, attenuating physiological stress (increasing Fv/Fm) in both early and late emerging seedlings in two of the species (
P. cembra and
P. abies), while reducing mortality in early-emerging seedlings only (seedlings planted in 2012) or not at all (seedlings planted in 2013). On the negative side, although shading increased photosynthetic efficiency, it reduced end-of-season biomass, potentially compromising growth and survival in subsequent years. Even near the alpine treeline, where radiation levels can be damagingly high, light thus appears to be more important as a resource than as a stressor, though the light level at which this balance tips is species-specific [
13,
59].
The reduction of physiological stress in the shade happened in spite of this treatment having lower night temperatures and was probably due to decreased photoinhibition at lower light levels [
13]. The sustained positive effect of shade in different seasons (shortly after snowmelt and in the middle of summer) suggests that photoinhibition occurred throughout the growing season for the exposed
P. cembra and
P. abies. The lag in the response of Fv/Fm reduction after cold nights suggests that some of the photoinhibition was sustained and should therefore be considered photodamage rather than just indicative of photoprotection. However, our data do not allow us to conclude whether the reduced photosynthetic efficiency affected carbon gain or growth, because we do not know if seedling growth was carbon limited [
59]. Growth was lowest in the shade, likely due to a direct light limitation of photosynthesis that was not compensated for by the higher photosynthetic efficiency in the shaded seedlings. Direct measurements of carbon gain in younger (<0.5-years old) conifer seedlings at a North-American treeline [
13] suggested strong reductions (down to ca. 15%) in exposed conditions compared to shaded or night-warmed treatments in one of the studied species (
Abies lasiocarpa (Hook.) Nutt.), though not in the other (
Picea engelmannii Parry ex Engelm.). The species in our experiment (including a
Picea species) appear to behave more like the latter.
It could be argued that seedlings germinated in greenhouse conditions and outplanted into the alpine zone are not suitable for testing seedling tolerances to (sub)alpine conditions, because of unacclimated tissues and because the first critical stage after germination is omitted [
59,
61]. The second argument is especially important when drawing conclusions from experiments for seedling establishment in the field, because establishment requires the survival of all life stages and these can differ in their environmental responses [
62]. Therefore, we emphasize that our results are valid only for one- to three-year old seedlings and not for germination or subsequent germinant survival. We partly addressed the first argument by acclimatizing the seedlings in partly exposed subalpine conditions for one growing season before using them in the experiment. However, since growth is very slow at this elevation, seedlings still had their cotyledons, which expanded under greenhouse conditions, when outplanted. This could mean that (1) they had a higher stress-sensitivity than locally germinated seedlings would have had; and (2) seedlings with more growth became better acclimatized, possibly feeding back positively on growth. Therefore, it is possible that (1) the positive effects of shade and night warming would have been lower had seedlings emerged in unprotected subalpine conditions, even if these effects are consistent with previous findings [
13,
14,
35]; and (2) the variability in growth among individuals was exaggerated due to the origin of the seedlings, thereby possibly masking treatment effects. Letting seedlings germinate in the field to study subsequent seedling survival avoids potential acclimation issues, but the environmental filters in the germination and germinant stages may confound effects during later seedlings stages. A good compromise, and to our knowledge a new approach, might be field germination followed by randomized replanting. Thereby, a reciprocal reallocation of part of the seedlings to different treatments could shed light on the importance of early-life acclimation to, e.g., shade vs. exposed conditions.
In our experiment, frost events after early snowmelt were rare and moderate. At the treeline, ca. 200 m higher in elevation than our plots, minimum temperatures may be lower and snow may melt later. However, in the subalpine and alpine zone, horizontal variation in snowmelt timing and microclimate due to topographic heterogeneity can easily exceed variation along elevational gradients [
63]. Therefore, although our site was located below the treeline, the effects observed should not be fundamentally different from those at treeline elevation. The potential treeline elevation unlikely represents a sudden shift in the seedling-relevant microclimate, unless trees are actually present and modify environmental conditions. Still, early-season protection by snow and maximising growing-season length should both become more crucial with elevation. Additionally, for the subalpine and alpine zone in general, it is easy to imagine that in years with earlier snowmelt and longer exposure to early-season weather, frost damage may play a larger role and photoinhibition may more often turn into more severe photodamage. The same is true for mountain ranges with shorter snow-cover duration and for landscape positions with little snow cover or high melting rates. At treeline elevation in the European Alps, inter-annual variation in snowmelt timing can be up to a month [
64] and the difference between landscape positions can be up to four months [
63]. In situations with relatively early natural snowmelt, a shorter snow-cover duration may have stronger negative effects on tree seedlings, as emergence occurs during climatically more stressful times of the year. Likewise, in situations where snow cover naturally lasts well into the growing season, the limited growing-season length may become more critical and a change in snow-cover duration of a few weeks may have stronger impacts, as confirmed by comparing responses across sites [
6].
Spatial snowmelt gradients exert strong controls on species distributions in alpine vegetation [
63,
64,
65,
66]. Likewise, they can influence the spatial distribution of successful tree seedling establishment, as found, e.g., for mountain birch in Sweden [
67] and conifers in the Alps and Rocky Mountains [
17,
68], and as commonly recognized by forestry practitioners in the Alps [
69]. Due to such landscape-scale snow-cover patterns, and interactions with other environmental gradients (e.g., in nutrient availability [
70]), effects of shifts in snowmelt timing on alpine and subalpine vegetation will be spatially highly heterogeneous. Additionally, snow in the treeline ecotone can be redistributed and tends to melt differentially around tree islands, causing feedbacks between tree establishment and snow-cover duration [
15,
17].
In our experiment, two weeks was the maximum possible difference in snowmelt timing we could achieve experimentally, due to the fast melting in spring. Previous snow manipulation experiments in alpine and arctic tundra vegetation had similar time frames and many reported significant results (summarized in [
6]). Effects on phenology are nearly always found, while effects on growth and productivity are very variable. Because of the position of their overwintering organs, the response of tree seedlings should be similar to that of dwarf shrubs, rather than that of tall shrubs, herbs, or grasses. Dwarf-shrub growth responses to change in snowmelt timing are highly variable across sites and species [
6,
31]. It appears from our results that a similarly high variability can be found among tree seedlings.


