
Allometric Models to Predict Aboveground Woody Biomass of Black Locust (Robinia pseudoacacia L.) in Short Rotation Coppice in Previous Mining and Agricultural Areas in Germany


Abstract
1. Introduction
2. Materials and Methods
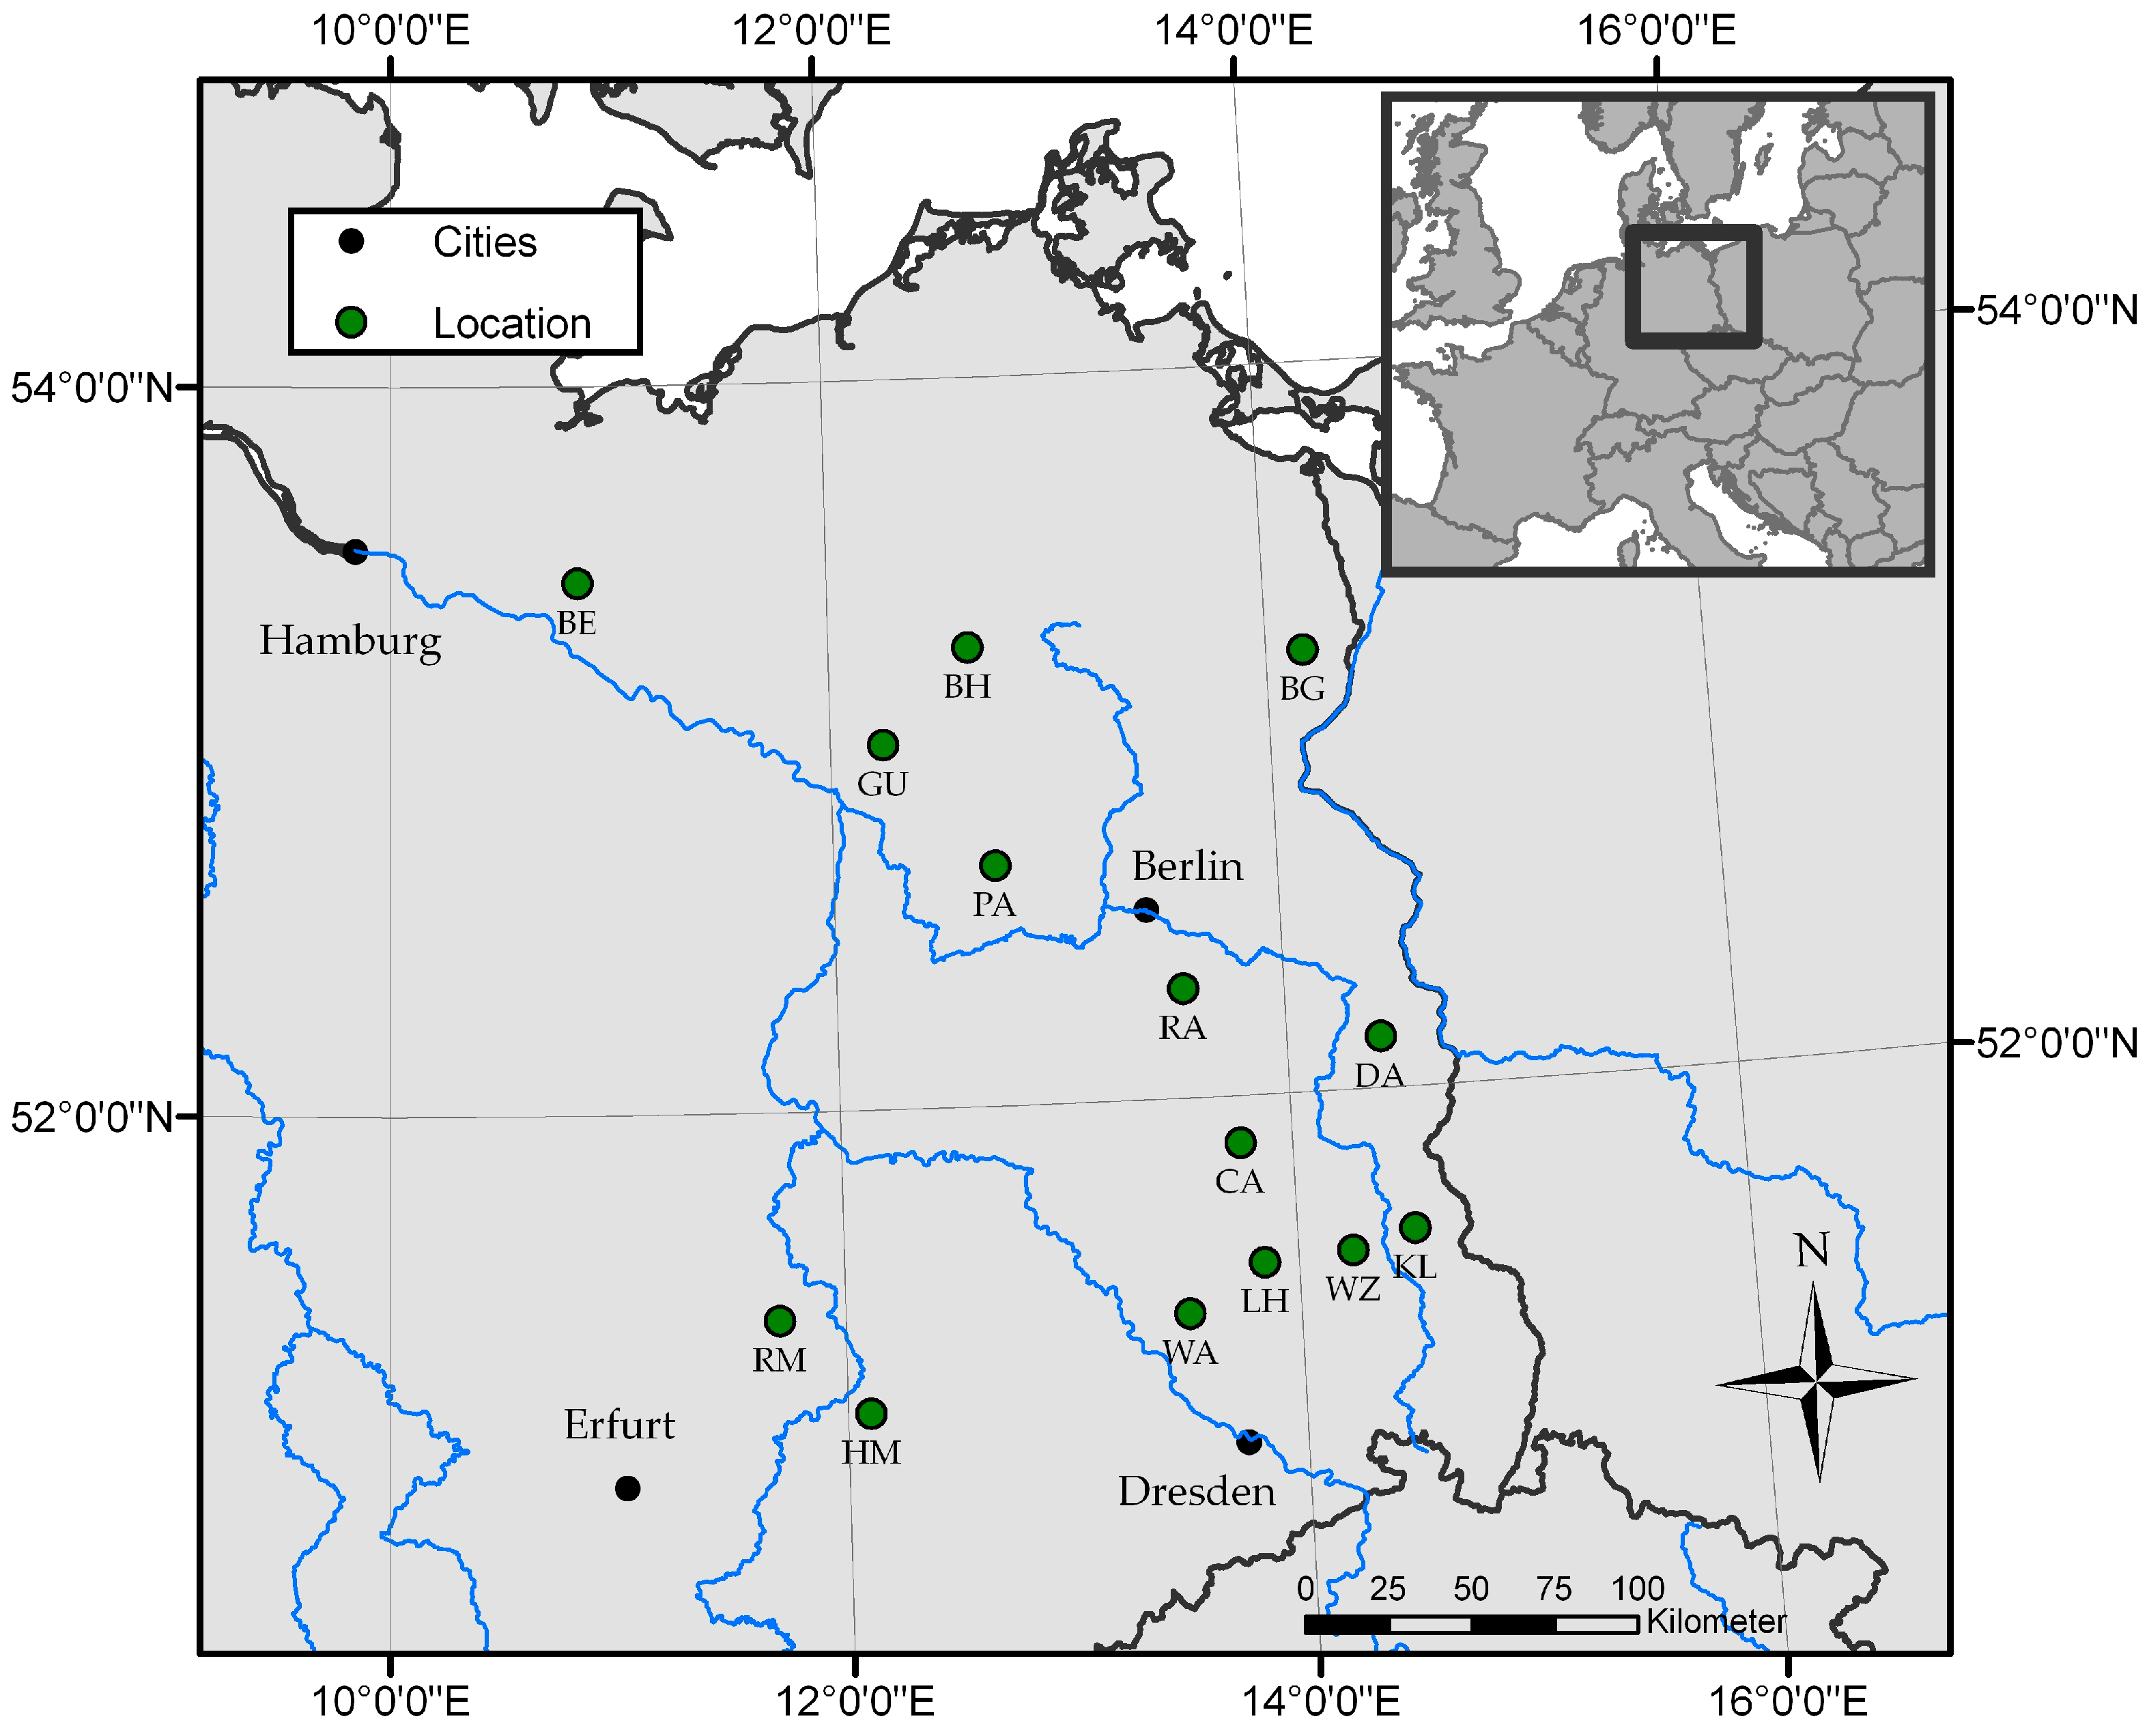
2.1. Site Description
2.2. Field Data Collection and Calculation
2.3. Climate Data
2.4. Statistical Analysis, Allometric Modelling and Total Biomass Production
3. Results
3.1. Yield Data
3.2. Correlation of Tree, Stand, and Climate Parameters
3.3. Allometric Models
3.4. Absolute Wood bioMass Productivity
4. Discussion
4.1. Correlation of Stand Parameter and Allometric Biomass Models
4.2. Total Woody Biomass Productivity
5. Conclusions
Acknowledgments
Author Contributions
Conflicts of Interest
Abbreviations
| AIC | Akaike Information Criterion |
| ANCOVA | Analyses of Covariance |
| ANOVA | Analyses of Variance |
| BA | Basal area |
| BIC | Bayesian Information Criterion |
| BM | Biomass (dry) |
| C | Core growth |
| CB | Crown base |
| CWB | Climatic water balance |
| DBH | Diameter at breast height |
| DMI | De Martonne Index |
| EEG | Erneuerbare-Energien-Gesetz (Renewable Energy law) |
| H | Height |
| NoP | Number of plants |
| PCA | Principle Component Analyses |
| PCT | Percentile of the basal area |
| RCD | Root collar diameter |
| S | Stump growth |
| SDI | Stand Density Index |
| SE | Standard error |
| SRC | Short rotation coppice |
| cR2 | Conditional coefficient of determination |
Appendix A


| Model | Variable | Coefficient | Estimate | SE | p-Value | cR2 | AIC | Variance | CI | |
|---|---|---|---|---|---|---|---|---|---|---|
| 2.5% | 97.5% | |||||||||
| M01H | Intercept | a | −4.2976 | 0.1141 | <0.001 | 0.9025 | 2458 | 0.3566 | −4.5215 | −4.0737 |
| H | b | 2.9365 | 0.0405 | <0.001 | 2.8570 | 3.0161 | ||||
| Agr01 | Intercept | a | −2.5903 | 0.0710 | <0.001 | 0.9143 | 1249 | 0.2602 | −2.7298 | −2.4508 |
| RCD | b | 2.2293 | 0.0357 | <0.001 | 2.1591 | 2.2995 | ||||
| Agr01H | Intercept | a | −4.4541 | 0.1454 | <0.001 | 0.9001 | 1507 | 0.3784 | −4.7396 | −4.1687 |
| H | b | 3.0152 | 0.0606 | <0.001 | 2.8962 | 3.1341 | ||||
| Agr02 | Intercept | a | −3.4829 | 0.1006 | <0.001 | 0.9368 | 1089 | 0.2145 | −3.6805 | −3.2853 |
| RCD | b | 1.4897 | 0.0633 | <0.001 | 1.3653 | 1.6141 | ||||
| H | c | 1.2090 | 0.0895 | <0.001 | 1.0334 | 1.3846 | ||||
| Agr03 | Intercept | a | −3.4077 | 0.07935 | <0.001 | 0.9533 | 1468 | 0.2139 | −3.5634 | −3.2520 |
| RCD | b | 1.5092 | 0.0399 | <0.001 | 1.4309 | 1.5876 | ||||
| H | c | 0.5853 | 0.1183 | <0.001 | 0.3532 | 0.8175 | ||||
| h/hg | d | 0.6366 | 0.1063 | <0.001 | 0.4280 | 0.8452 | ||||
| Agr04 | Intercept | a | −3.6913 | 0.0929 | <0.001 | 0.9510 | 1419 | 0.2056 | −3.8737 | −3.5090 |
| RCD | b | 1.9421 | 0.0961 | <0.001 | 1.7536 | 2.1307 | ||||
| H | c | 0.2777 | 0.1339 | 0.0383 | 0.0149 | 0.5405 | ||||
| h/hg | d | 0.5308 | 0.1056 | <0.001 | 0.3236 | 0.7380 | ||||
| h/d | e | 0.2626 | 0.0535 | <0.001 | 0.1576 | 0.3676 | ||||
| Min01 | Intercept | a | −2.8322 | 0.0726 | <0.001 | 0.9626 | 468 | 0.1353 | −2.9749 | −2.6894 |
| RCD | b | 2.4089 | 0.0330 | <0.001 | 2.3441 | 2.4737 | ||||
| Min01H | Intercept | a | −4.1685 | 0.2906 | <0.001 | 0.9132 | 765 | 0.3150 | −4.7393 | −3.5976 |
| H | b | 2.8313 | 0.0547 | <0.001 | 2.7238 | 2.9389 | ||||
| Min02 | Intercept | a | −3.5994 | 0.0482 | <0.001 | 0.9761 | 175 | 0.0768 | −3.6942 | −3.5046 |
| RCD | b | 1.5952 | 0.0407 | <0.001 | 1.5152 | 1.6754 | ||||
| H | c | 1.1811 | 0.0583 | <0.001 | 1.0665 | 1.2957 | ||||
| Min03 | Intercept | a | −3.4077 | 0.0793 | <0.001 | 0.9492 | 1436 | 0.0757 | −3.5634 | −3.2521 |
| RCD | b | 1.5092 | 0.0399 | <0.001 | 1.4309 | 1.5876 | ||||
| H | c | 0.5853 | 0.1183 | <0.001 | 0.3532 | 0.8175 | ||||
| h/hg | d | 0.6366 | 0.1063 | <0.001 | 0.4280 | 0.8452 | ||||
| Min04 | Intercept | a | −3.6913 | 0.0929 | <0.001 | 0.9510 | 1419 | 0.0757 | −3.8737 | −3.5089 |
| RCD | b | 1.9421 | 0.0961 | <0.001 | 1.7536 | 2.1307 | ||||
| H | c | 0.2777 | 0.1339 | 0.0383 | 0.0149 | 0.5405 | ||||
| h/hg | d | 0.5308 | 0.1056 | <0.001 | 0.3236 | 0.7380 | ||||
| h/d | e | 0.2626 | 0.0535 | <0.001 | 0.1576 | 0.3676 | ||||
| C01 | Intercept | a | −2.9081 | 0.0672 | <0.001 | 0.8759 | 832 | 0.2073 | −3.0400 | −2.7760 |
| RCD | b | 2.4654 | 0.0404 | <0.001 | 2.3859 | 2.5448 | ||||
| C01H | Intercept | a | −3.9640 | 0.1332 | <0.001 | 0.8111 | 1077 | 0.3223 | −4.2256 | −3.7024 |
| H | b | 2.8220 | 0.0596 | <0.001 | 2.7048 | 2.9391 | ||||
| C02 | Intercept | a | −3.6598 | 0.0769 | <0.001 | 0.9092 | 625 | 0.1497 | −3.8108 | −3.5088 |
| RCD | b | 1.6378 | 0.0628 | <0.001 | 1.5144 | 1.7612 | ||||
| H | c | 1.1972 | 0.0755 | <0.001 | 1.0490 | 1.3455 | ||||
| C03 | Intercept | a | −3.4077 | 0.0793 | <0.001 | 0.9492 | 1436 | 0.1473 | −3.5634 | −3.2521 |
| RCD | b | 1.5092 | 0.0399 | <0.001 | 1.4309 | 1.5876 | ||||
| H | c | 0.5853 | 0.1183 | <0.001 | 0.3532 | 0.8175 | ||||
| h/hg | d | 0.6366 | 0.1063 | <0.001 | 0.4280 | 0.8452 | ||||
| C04 | Intercept | a | −3.6913 | 0.0929 | <0.001 | 0.9510 | 1419 | 0.1473 | −3.8737 | −3.5089 |
| RCD | b | 1.9421 | 0.0961 | <0.001 | 1.7536 | 2.1307 | ||||
| H | c | 0.2777 | 0.1339 | 0.0383 | 0.0149 | 0.5405 | ||||
| h/hg | d | 0.5308 | 0.1056 | <0.001 | 0.3236 | 0.7380 | ||||
| h/d | e | 0.2626 | 0.0535 | <0.001 | 0.1576 | 0.3676 | ||||
| S01 | Intercept | a | −2.5393 | 0.0863 | <0.001 | 0.9168 | 1035 | 0.2040 | −2.7086 | −2.3700 |
| RCD | b | 2.1639 | 0.0308 | <0.001 | 2.1033 | 2.2244 | ||||
| S01H | Intercept | a | −4.5737 | 0.1627 | <0.001 | 0.9015 | 1383 | 0.3352 | −4.8930 | −4.2544 |
| H | b | 3.0490 | 0.0560 | <0.001 | 2.9390 | 3.1591 | ||||
| S02 | Intercept | a | −3.4286 | 0.1025 | <0.001 | 0.9405 | 845 | 0.1610 | −3.6298 | −3.2274 |
| RCD | b | 1.4806 | 0.0538 | <0.001 | 1.3750 | 1.5860 | ||||
| H | c | 1.1707 | 0.0793 | <0.001 | 1.0151 | 1.3262 | ||||
| S03 | Intercept | a | −3.4077 | 0.0793 | <0.001 | 0.9492 | 1436 | 0.1610 | −3.5634 | −3.2520 |
| RCD | b | 1.5092 | 0.0399 | <0.001 | 1.4308 | 1.5876 | ||||
| H | c | 0.5853 | 0.1183 | <0.001 | 0.3532 | 0.8175 | ||||
| h/hg | d | 0.6366 | 0.1063 | <0.001 | 0.4280 | 0.8452 | ||||
| S04 | Intercept | a | −3.6913 | 0.0929 | <0.001 | 0.9510 | 1419 | 0.1528 | −3.8737 | −3.5089 |
| RCD | b | 1.9421 | 0.0961 | <0.001 | 1.7535 | 2.1307 | ||||
| H | c | 0.2777 | 0.1339 | 0.0383 | 0.0149 | 0.5405 | ||||
| h/hg | d | 0.5308 | 0.1056 | <0.001 | 0.3236 | 0.7380 | ||||
| h/d | e | 0.2626 | 0.0535 | <0.001 | 0.1576 | 0.3676 | ||||
References
- Ernyey, J. Die Wanderwege der Robinie und ihre Ansiedlung in Ungarn. Magy. Botan. Lapok 1927, 25, 161–191. [Google Scholar]
- Vadas, E. Das Lehrrevier und der botanische Garten der königl. ung. forstl. Hochschule als Versuchsfeld; Joerges: Selmecbánya, Slovakia, 1914; pp. 1–25. [Google Scholar]
- Keresztesi, B.; Balla, I. The Black Locust; Akadémiai Kiadó: Budapest, Hungary, 1988; ISBN 963-054-696-5. [Google Scholar]
- Turnbull, J.W. Planted Forests: Contributions to the Quest for Sustainable Societies; Springer: Amsterdam, The Netherlands, 1999; pp. 37–52. ISBN 978-94-017-2689-4. [Google Scholar]
- Wüstenhagen, R.; Bilharz, M. Green energy market development in Germany: Effective public policy and emerging customer demand. Energy Policy 2006, 34, 1681–1696. [Google Scholar] [CrossRef]
- Bielefeldt, J.; Bolte, A.; Busch, G.; Dohrenbusch, A.; Kroiher, F.; Lamersdorf, N.; Schulz, U.; Stoll, B. Energieholzproduktion in der Landwirtschaft. Chancen und Risiken aus Sicht der Natur-und Umweltschutzes. NABU Bundesverb. 2008, 1, 17–19. [Google Scholar]
- Bemmann, A.; Butler Manning, D. Energieholzplantagen in der Landwirtschaft; Agrimedia: Hannover, Germany, 2013; ISBN 978-3-86263-081-3. [Google Scholar]
- Gomez, T.; Wagner, M. Culture and use of black locust. Hort Technol. 2001, 11, 279–288. [Google Scholar]
- Veste, M.; Böhm, C.; Quinkenstein, A.; Freese, D. Biologische Stickstoff-Fixierung der Robinie. AFZ-DerWald 2013, 2, 40–42. [Google Scholar]
- Mantovani, D.; Veste, M.; Böhm, C.; Vignudelli, M.; Freese, D. Spatial and temporal variation of drought impact on black locust (Robinia pseudoacacia L.) water status and growth. iForest 2015, 8, 743. [Google Scholar] [CrossRef]
- Moser, A.; Rötzer, T.; Pauleit, S.; Pretzsch, H. The urban environment can modify drought stress of small-leaved lime (Tilia cordata Mill.) and black locust (Robinia pseudoacacia L.). Forests 2016, 7, 71. [Google Scholar] [CrossRef]
- Richardson, D.M.; Rejmánek, M. Trees and shrubs as invasive alien species—A global review. Divers. Distrib. 2011, 17, 788–809. [Google Scholar] [CrossRef]
- Staska, B.; Essl, F.; Samimi, C. Density and age of invasive Robinia pseudoacacia modulate its impact on floodplain forests. Basic Appl. Ecol. 2014, 15, 551–558. [Google Scholar] [CrossRef]
- Vor, T.; Bolte, A.; Spellmann, H.; Ammer, C. Potenziale und Risiken Eingeführter Baumarten—Baumartenportraits mit Naturschutzfachlicher Bewertung; Universitätsverlag Göttingen: Göttingen, Germany, 2015; pp. 277–292. ISBN 978-3-86395-240-2. ISSN 1867-6731. [Google Scholar]
- Wilkinson, J.; Evans, E.; Bilsborrow, P.; Wright, C.; Hewison, W.; Pilbeam, D. Yield of willow cultivars at different planting densities in a commercial short rotation coppice in the north of England. Biomass Bioenergy 2007, 31, 469–474. [Google Scholar] [CrossRef]
- Pretzsch, H.; Biber, P. A re-evaluation of Reineke’s rule and stand density index. For. Sci. 2005, 51, 304–320. [Google Scholar]
- Dahlhausen, J.; Uhl, E.; Heym, M.; Biber, P.; Pretzsch, H. Biomass function for young oak trees grown on Nelder-trials at four different European sites. Trees 2017. [Google Scholar] [CrossRef]
- Larsen, S.U.; Jørgensen, U.; Lærke, P.E. Willow yield is highly dependent on clone and site. Bioenergy Res. 2014, 7, 1280–1292. [Google Scholar] [CrossRef]
- Stolarski, M.J.; Krzyżaniak, M.; Szczukowski, S.; Tworkowski, J.; Zalstrokuski, D.; Bieniek, A.; Golstrokaszewski, J. Effect of increased soil fertility on the yield and energy value of short-rotation woody crops. Bioenergy Res. 2015, 8, 1136–1147. [Google Scholar] [CrossRef]
- Böhm, C.; Quinkenstein, A.; Freese, D. Yield prediction of young black locust (Robinia pseudoacacia L.) plantations for woody biomass production using allometric relations. Ann. For. Res. 2011, 54, 215–227. [Google Scholar]
- Lindroth, A.; Båth, A. Assessment of regional willow coppice yield in Sweden on basis of water availability. For. Ecol. Manag. 1999, 121, 57–65. [Google Scholar] [CrossRef]
- Tahvanainen, L.; Rytkönen, V. Biomass production of Salix viminalis in southern Finland and the effect of soil properties and climate conditions on its production and survival. Biomass Bioenergy 1999, 16, 103–117. [Google Scholar] [CrossRef]
- Cierjacks, A.; Kowarik, I.; Joshi, J.; Hempel, S.; Ristow, M.; Lippe, M.; Weber, E. Biological flora of the British Isles: Robinia pseudoacacia. J. Ecol. 2013, 101, 1623–1640. [Google Scholar] [CrossRef]
- Göhre, K. Die Robinie und Ihr Holz; Dt. Bauernverlag: Berlin, Germany, 1952. [Google Scholar]
- Kowarik, I. Das Besondere der städtischen Flora und Vegetation Natur in der Stadt-der Beitrag der Landespflege zur Stadtentwicklung. Schr. Deutsch. Rates Landespfl. 1992, 61, 33–47. [Google Scholar]
- Geyer, W.A. Biomass yield potential of short-rotation hardwoods in the Great Plains. Biomass 1989, 20, 167–175. [Google Scholar] [CrossRef]
- Bongarten, B.C.; Huber, D.A.; Apsley, D.K. Environmental and genetic influences on short-rotation biomass production of black locust (Robinia pseudoacacia L.) in the Georgia Piedmont. For. Ecol. Manag. 1992, 55, 315–331. [Google Scholar] [CrossRef]
- Converse, T.E.; Betters, D.R. Biomass yield equations for short rotation black locust plantations in the central Great Plains. Biomass Bioenergy 1995, 8, 251–254. [Google Scholar] [CrossRef]
- Burner, D.; Pote, D.; Ares, A. Foliar and shoot allometry of pollarded black locust, Robinia pseudoacacia L. Agrofor. Syst. 2006, 68, 37–42. [Google Scholar] [CrossRef]
- Snyder, L.U.; Mueller, J.; Luginbuhl, J.; Brownie, C. Growth characteristics and allometry of Robinia pseudoacacia as a silvopastoral system component. Agrofor. Syst. 2007, 70, 41–51. [Google Scholar] [CrossRef]
- Rédei, K. Black Locust (Robinia pseudoacacia L.) Growing in Hungary; Hungarian Forest Research Institute: Sárvár, Hungary, 2013; pp. 67–71. [Google Scholar]
- Rédei, K. Black Locust (Robinia pseudoacacia L.) Growing in Hungary; Hungarian Forest Research Institute: Sárvár, Hungary, 1998. [Google Scholar]
- Müller, F. Die Robinie als Biomasseproduzent in Kurzumtriebsplantagen. Österr. Forstztg. 1990, 101, 22. [Google Scholar]
- Annighöfer, P.; Mölder, I.; Zerbe, S.; Kawaletz, H.; Terwei, A.; Ammer, C. Biomass functions for the two alien tree species Prunus serotina Ehrh. and Robinia pseudoacacia L. in floodplain forests of Northern Italy. Eur. J. For. Res. 2012, 131, 1619–1635. [Google Scholar] [CrossRef]
- Stankova, T.; Gyuleva, V.; Kalmukov, K.; Dimitrova, P.; Velizarova, E.; Dimitrov, D.N.; Hristova, H.; Andonova, E.; Kalaydzhiev, I.; Velinova, K. Biometric models fort the aboveground biomass of juvenile black locust trees. Silva Balc. 2016, 17, 21–30. [Google Scholar]
- Kraszkiewicz, A. Evaluation of the possibility of energy use black locust (Robinia pseudoacacia L.) dendromass acquired in forest stands growing on clay soils. J. Cent. Eur. Agric. 2013, 14, 388–399. [Google Scholar] [CrossRef]
- Lockow, K.-W.; Lockow, J. Ertragstafel für die Robinie (Robinia pseudoacacia L.); Gesellschaft zur Förderung schnellwachsender Baumarten in Norddeutschland: Grevesmühlen, Germany, 2015; ISBN 978-3-937431-99-4. [Google Scholar]
- Böhm, C. Tagungsband—Bäume in der Land(wirt)schaft–von der Theorie in die Praxis; Brandenburg Technical University Cottbus-Senftenberg—IKMZ University Library: Cottbus-Senftenberg, Germany, 2016; pp. 47–50. ISBN 978-3-940471-27-7. [Google Scholar]
- Peters, K.; Bilke, G.; Strohbach, B. Ertragsleistung sechsjähriger Robinien (Robinia pseudoacacia) auf vier ehemaligen Ackerstandorten unterschiedlicher Bodengüte in Brandenburg. Arch. Forstwes. Landschaftsökol. 2007, 41, 26–28. [Google Scholar]
- Werner, A.; Vetter, A.; Reinhold, G. Leitlinie zur Effizienten und Umweltverträglichen Erzeugung von Energieholz. Thüringer Landesanstalt für Landwirtschaft Jena. 2006. Available online: http://bibliothek.best-forschung.uni-goettingen.de/handle/best/1138 (accessed on 19 March 2017).
- Landeskompetenzzentrum Eberswalde Lange (LFE). Wissenstransfer in die Praxi—Beiträge zum 10. Winterkolloquium am 19. Februar 2015 in Eberswalde; Eberswalder Forstliche Schriftenreihe Band 59; Ministerium für Ländliche Entwicklung, Umwelt und Landwirtschaft (MLUL) des Landes Brandenburg—Landesbetrieb Forst Brandenburg: Brandenburg, Germany, 2015; p. 104. Available online: http://forst.brandenburg.de/cms/media.php/lbm1.a.3310.de/efs59.pdf (accessed on 9 January 2017).
- Annighöfer, P.; Ameztegui, A.; Ammer, C.; Balandier, P.; Bartsch, N.; Bolte, A.; Coll, L.; Collet, C.; Ewald, J.; Frischbier, N. Species-specific and generic biomass equations for seedlings and saplings of European tree species. Eur. J. For. Res. 2016, 135, 313–329. [Google Scholar] [CrossRef]
- Lüdemann, G. Die Robinie in den norddeutschen Bundesländern. Vorkommen, Herkunftsgebiete und Vermehrungsgut. Forst Holz 2005, 60, 447–449. [Google Scholar]
- Deutscher Wetterdienst (DWD), Archiv Monats- und Tageswerte. Available online: http://www.dwd.de (accessed on 10 January 2017).
- Ministerium für Ländliche Entwicklung und Verbraucherschutz des Landes Brandenburg (MLUV); Stiftung Natur Schutz Fonds Brandenburg. Kippen-Regosol; Steckbriefe Brandenburger Böden 2.1; Ministerium für Ländliche Entwicklung und Verbraucherschutz des Landes Brandenburg (MLUV): Potsdam, Germany, 2005; pp. 1–4. Available online: http://www.mlul.brandenburg.de/media_fast/4055/a_sb_2_1.pdf (accessed on 20 November 2016).
- ESRI. ArcGIS 9.2. © Environmental Systems Research Institute. 2007. Available online: http://www.esri.com/software/arcgis/eval-help/arcgis-92 (accessed on 19 March 2017).
- Atteslander, P. Methoden der Empirischen Sozialforschung; 13. neu bearbeitete und erweiterte Auflage; Erich Schmidt Verlag: Berlin, Germany, 2010; pp. 274–287. ISBN 978-3-503-12618-7. [Google Scholar]
- Pretzsch, H. Modellierung des Waldwachstums; Parey Buchverlag im Blackwell Wissenschafts-Verlag GmbH: Berlin, Germany, 2001; p. 143. ISBN 978-3-8001-4555-3. [Google Scholar]
- Pretzsch, H. Forest Dynamics, Growth, and Yield; Springer: Berlin/Heidelberg, Germany, 2009; pp. 307–308. ISBN 978-3-540-88306-7. [Google Scholar]
- Reineke, L.H. Perfecting a stand-density index for even-aged forests. J. Agric. Res. 1933, 46, 627–638. [Google Scholar]
- Pretzsch, H.; Del Rio, M.; Ammer Cand Avdagic, A.; Barbeito, I.; Bielak, K.; Brazaitis, G.; Coll, L.; Dirnberger, G.; Drössler, L.; Fabrika, M.; et al. Growth and yield of mixed versus pure stands of Scots pine (Pinus sylvestris L.) and European beech (Fagus sylvatica L.) analysed along a productivity gradient through Europe. Eur. J. For. Res. 2015, 134, 927–947. [Google Scholar] [CrossRef]
- Goetsch, S.; Peek, R. Vergleichende Feuchtebestimmung an Bohrkernen und geschnittenen Holzproben nach DIN 52 183 Holz als Roh-und Werkstoff. Eur. J. Wood Prod. 1987, 45, 300. [Google Scholar] [CrossRef]
- Hartmann, K.-U. Entwicklung Eines Ertragsschätzers für Kurzumtriebsbestände aus Pappel. Ph.D. Thesis, Technische Universität Dresden, Dresden, Germany, 12 August 2010. URN urn:nbn:de:bsz:14-qucosa-62853. Available online: http://www.qucosa.de/fileadmin/data/qucosa/documents/6285/Dissertation%20Hartmann.pdf (accessed on 14 September 2016).
- Ali, M.S.W. Modelling of Biomass Production Potential of Poplar in Short Rotation Plantations on Agricultural Lands of Saxony, Germany. Ph.D. Thesis, Technische Universität Dresden, Dresden, Germany, 3 March 2009. URN urn:nbn:de:bsz:14-ds-1237199867841-24821. Available online: http://www.qucosa.de/fileadmin/data/qucosa/documents/345/1237199867841-2482.pdf (accessed on 14 December 2016).
- De Martonne, E. L’indice d’aridité. Bull. l’Assoc. Géogr. Fr. 1926, 3, 3–5. [Google Scholar] [CrossRef]
- Pretzsch, H.; Dieler, J. Evidence of variant intra-and interspecific scaling of tree crown structure and relevance for allometric theory. Oecologia 2012, 169, 637–649. [Google Scholar] [CrossRef] [PubMed]
- Zenker, T. Verdunstungswiderstände und Gras-Referenzverdunstung. Ph.D. Thesis, Technische Universität Berlin, Berlin, Germany, 7 February 2003. Available online: https://www.depositonce.tu-berlin.de/bitstream/11303/1091/1/Dokument_1.pdf (accessed on 11 November 2016).
- Pearson, K. Principal components analysis. Lond. Edinb. Dublin Philos. Mag. J. 1901, 6, 566. [Google Scholar]
- Hedderich, J.; Sachs, L. Angewandte Statistik—Methodensammlung mit R; Springer: Berlin/Heidelberg, Germany, 2015; pp. 144–145. ISBN 978-3-662-45690-3. eBook ISBN 978-662-45691-0. [Google Scholar]
- Fisher, R.A. The use of multiple measurements in taxonomic problems. Ann. Eugen. 1936, 7, 179–188. [Google Scholar] [CrossRef]
- Nakagawa, S.; Schielzeth, H. A general and simple method for obtaining R2 from generalized linear mixed-effects models. Methods Ecol. Evol. 2013, 4, 133–142. [Google Scholar] [CrossRef]
- Yamaoka, K.; Nakagawa, T.; Uno, T. Application of Akaike’s information criterion (AIC) in the evaluation of linear pharmacokinetic equations. J. Pharmacokinet. Biopharm. 1978, 6, 165–175. [Google Scholar] [CrossRef] [PubMed]
- Schwarz, G. Estimating the dimension of a model. Ann. Stat. 1978, 6, 461–464. [Google Scholar] [CrossRef]
- Grünewald, H.; Böhm, C.; Quinkenstein, A.; Grundmann, P.; Eberts, J.; von Wühlisch, G. Robinia pseudoacacia L.: A lesser known tree species for biomass production. Bioenergy Res. 2009, 2, 123–133. [Google Scholar] [CrossRef]
- The Intergovernmental Panel on Climate Change (IPCC). Good Practice Guidance for Land Use, Land-Use Change and Forestry. Institute for Global Environmental Strategies for the IPCC: Kanagawa, Japan, 2003. Available online: http://www.ipcc-nggip.iges.or.jp/public/gpglulucf/gpglulucf_files/GPG_LULUCF_FULL.pdf (accessed on 13 April 2017).
- Yoon, T.K.; Park, C.-W.; Lee, S.J.; Ko, S.; Kim, K.N.; Son, Y.; Lee, K.-H.; Oh, S.; Lee, W.-K.; Son, Y. Allometric equations for estimating the aboveground volume offive common urban street tree species in Daegu, Korea. Urban For. Urban Green. 2013, 12, 344–349. [Google Scholar] [CrossRef]
- Moser, A.; Rötzer, T.; Pauleit, S.; Pretzsch, H. Structure and ecosystem services of small-leaved lime (Tilia cordata Mill.) and black locust (Robinia pseudoacacia L.) in urban environments. Urban For. Urban Green. 2015, 14, 1110–1121. [Google Scholar] [CrossRef]
- R Core Team. R: A Language and Environment for Statistical Computing—Version R 3.3.2 GUI 1.68. Available online: https://www.R-project.org/ (accessed on 2 November 2016).
- R Core Team. R: A Language and Environment for Statistical Computing. R Foundation for Statistical Computing: Vienna, Austria. Available online: https://www.R-project.org/ (accessed on 20 January 2017).
- Paradis, E.; Claude, J.; Strimmer, K. APE: Analyses of phylogenetics and evolution in R language. Bioinformatics 2004, 20, 289–290. [Google Scholar] [CrossRef] [PubMed]
- Wickham, H. Ggplot2: Elegant Graphics for Data Analysis, 2nd ed.; Springer: New York, NY, USA, 2009; ISBN 978-0-387-98141-3. Available online: https://books.google.de/books?hl=de&lr=&id=XgFkDAAAQBAJ&oi=fnd&pg=PR7&dq=ggplot2:+Elegant+Graphics+for+Data+Analysis.+&ots=sn54cUa03U&sig=WfaCqTndUS7RO7Ci2Y06h0dnjNI#v=onepage&q=ggplot2%3A%20Elegant%20Graphics%20for%20Data%20Analysis.&f=false (accessed on 20 January 2017).
- Elliott, K.J.; Boring, L.R.; Swank, W.T. Aboveground biomass and nutrient accumulation 20 years after clear-cutting a southern Appalachian watershed. Can. J. For. Res. 2002, 32, 667–683. [Google Scholar] [CrossRef]
- Blujdea, V.N.B.; Pilli, R.; Dutca, I.; Ciuvat, L.; Abrudan, I.V. Allometric biomass equations for young broadleaved trees in plantations in Romania. For. Ecol. Manag. 2012, 264, 172–184. [Google Scholar] [CrossRef]
- Forrester, D.; Tachauer, H.; Annighöfer, P.; Barbeito, I.; Pretzsch, H.; Ruiz-Peinado, R.; Stark, H.; Vaccinano, G.; Zlatanov, T.; Chakraborty, T.; et al. Biomass and leaf area equations for European tree species incorporating stand structure, tree age and climate. For. Ecol. Manag. 2017, 396, 160–175. [Google Scholar] [CrossRef]
- Grote, R.; Schuck, J.; Block, J.; Pretzsch, H. Oberirdische holzige Biomasse in Kiefern-/Buchen-und Eichen-/Buchen-Mischbeständen. Forstwiss. Cent. Ver. Tharandter Forstl. Jahrb. 2003, 122, 287–301. [Google Scholar] [CrossRef]
- Pretzsch, H.; Block, J.; Dieler, J.; Gauer, J.; Göttlein, A.; Moshammer, R.; Wunn, U. Nährstoffentzüge durch die Holz-und Biomassenutzung in Wäldern. Teil 1: Schätzfunktionen für Biomasse und Nährelemente und ihre Anwendung in Szenariorechnungen. Allg. For. Jagdztg. 2014, 185, 261–285. [Google Scholar]
- Fahrmeir, L.; Kneib, T.; Lang, S. Regression—Modelle, Methoden und Anwendungen; Springer: Berlin/Heidelberg, Germany; New York, NY, USA, 2009; pp. 19–58. ISBN 978-3-540-33932-8. ebook ISBN 978-3-642-01837-4; Available online: https://books.google.de/books?hl=de&lr=&id=iy8lBAAAQBAJ&oi=fnd&pg=PA1&dq=Regressionsmodelle+Fahrmeier&ots=jYlNYzSOqi&sig=DoyhB-SnteZBd46_yVnDw_Yw6Sc#v=onepage&q=Regressionsmodelle%20Fahrmeier&f=false (accessed on 20 March 2017).
- Drebenstedt, C. Braunkohlentagebau und Rekultivierung; Springer: Berlin/Heidelberg, Germany; New York, NY, USA, 1998; pp. 487–512. ISBN 978-3-642-63757-5. eBook ISBN 978-3-642-58846-4. [Google Scholar]
- Dietz, E.; Bachmann-Gigl, U.; Sutterer, N.; Burger, F. KUP-Scout: Ein Pappel-Ertragsmodell für Bayern. Available online: http://www.lwf.bayern.de/forsttechnik-holz/biomassenutzung/095992/index.php (accessed on 22 March 2017).
- Landgraf, D.; Heydeck, P. Pilzinfektionen in neu begründeten Robinienbeständen Fungal infections of recently planted black locust stands. AFZ-DerWald 2014, 2, 44–45. [Google Scholar]
- Bemmann, A.; Knust, C. Agrowood—Kurzumtriebsplantagen in Deutschland und europäische Perspektiven; Weißensee Verlag: Berlin, Germany, 2010; pp. 170–188. ISBN 978-3-89998-159-9. [Google Scholar]


| Site | Federal States * | Location | long (°E) | lat (°N) | ASL (m) | MAT (°C) | MAP (mm) | Former Utilization | Age (years) | Rotation |
|---|---|---|---|---|---|---|---|---|---|---|
| BE | MV | Bennin | 10°51′49″ | 53°27′45″ | 35 | 8.9 | 589 | Agriculture | 8 | 0 |
| BG | BB | Blumberg | 14°10′24″ | 53°12′25″ | 22 | 8.8 | 528 | Agriculture | 3 | 2 |
| BH | MV | Buchholz | 12°38′9″ | 53°15′34″ | 64 | 8.6 | 632 | Agriculture | 2 | 1 |
| CA | BB | Cahnsdorf | 13°45′54″ | 51°52′18″ | 63 | 9.4 | 555 | Agriculture | 5 | 0 |
| DA | BB | Grunow-Dammendorf | 14°25′5″ | 52°8′26″ | 70 | 9.4 | 555 | Agriculture | 3 | 1 |
| GU | BB | Gumtow | 12°14′11″ | 52°59′46″ | 61 | 7.4 | 495 | Agriculture | 2 | 1 |
| HM | ST | Hohenmölsen | 12°6′1″ | 51°10′23″ | 149 | 9.4 | 525 | Mining | 2 | 0 |
| KL | BB | Klein Loitz | 14°30′57″ | 51°36′35″ | 140 | 9.4 | 555 | Agriculture | 2 | 3 |
| LH | BB | Lauchhammer | 13°50′57″ | 51°32′20″ | 111 | 9.4 | 555 | Mining | 8 | 0 |
| PA | BB | Paulinenaue | 12°43′52″ | 52°39′44″ | 31 | 7.4 | 495 | Agriculture | 3 | 1 |
| RA | BB | Ragow | 13°33′7″ | 52°18′8″ | 41 | 9.8 | 584 | Mining | 7 | 0 |
| RM | ST | Röblingen | 11°42′42″ | 51°25′57″ | 149 | 9.4 | 525 | Mining | 7 | 0 |
| WA | BB | Wainsdorf | 13°29′40″ | 51°24′50″ | 92 | 9.3 | 671 | Agriculture | 1 | 2 |
| WZ | BB | Welzow | 14°14′7″ | 51°33′32″ | 123 | 9.4 | 555 | Mining | 1 | 1 |
| Name | Model |
|---|---|
| M01 | |
| M02 | |
| M03 | |
| M04 |
| Site | Plots | # n1 | ~ n2 | G * | # RCD [cm] | # DBH [cm] | ~ Tree Height [m] | ~ Wet Tree Biomass [kg] | ~ Dry Tree Biomass [kg] |
|---|---|---|---|---|---|---|---|---|---|
| Mining | 4311 | 700 | 4.2 (0.1–20.2) | 3.1 (0.1–13.0) | 4.4 (0.9–9.4) | 3.6 (0.02–34.00) | 2.36 (0.01–22.70) | ||
| HM | 4 | 586 | 100 | C | 2.8 (0.4–7.8) | 2.1 (0.2–4.3) | 3.9 (1.6–6.5) | 1.4 (0.07–4.98) | 0.86 (0.04–2.87) |
| LH | 6 | 952 | 150 | C | 5.4 (0.6–18.4) | 4.2 (0.5–12.0) | 5.3 (1.4–9.4) | 4.8 (0.19–32.11) | 3.17 (0.13–21.09) |
| RA | 1 | 152 | 25 | C | 6.4 (1.3–15.1) | 4.7 (0.8–9.3) | 6.1 (4.7–7.2) | 9.3 (2.57–23.40) | 6.10 (1.71–15.74) |
| RM | 9 | 1290 | 225 | C | 6.6 (0.5–20.2) | 4.6 (0.4–13.0) | 5.6 (1.5–9.0) | 6.2 (0.10–34.00) | 4.00 (0.06–22.70) |
| WZ | 8 | 1331 | 200 | S | 1.4 (0.1–3.7) | 1.1 (0.1–3.2) | 2.6 (0.9–4.9) | 3.6 (0.02–2.07) | 0.19 (0.01–1.27) |
| Agriculture | 5418 | 850 | 2.8 (0.1–16.7) | 2.4 (0.1–14.4) | 3.8 (0.7–9.9) | 2.31 (0.01–51.81) | 1.43 (0.01–32.15) | ||
| BE | 3 | 446 | 75 | C | 7.3 (2.3–16.7) | 5.7 (1.2–14.4) | 6.4 (3.0–9.9) | 8.68 (0.56–51.81) | 5.29 (0.34–32.15) |
| BG | 3 | 441 | 75 | S | 3.9 (1.2–9.7) | 3.4 (1.0–7.8) | 5.6 (2.0–7.9) | 3.77 (0.24–21.79) | 2.33 (0.14–13.62) |
| BH | 6 | 1000 | 150 | S | 1.3 (0.1–4.0) | 0.9 (0.1–2.8) | 2.3 (0.8–4.0) | 0.30 (0.01–1.77) | 0.18 (0.01–1.10) |
| CA | 3 | 470 | 75 | C | 4.7 (1.3–12.5) | 3.4 (0.4–7.7) | 5.2 (2.3–7.8) | 3.60 (0.40–17.3) | 2.28 (0.01–10.86) |
| DA | 3 | 422 | 75 | S | 4.9 (1.0–11.3) | 3.7 (0.9–8.6) | 5.6 (2.0–9.4) | 4.05 (0.08–19.59) | 2.52 (0.04–12.06) |
| GU | 8 | 1314 | 200 | S | 1.2 (0.1–4.4) | 0.9 (0.1–3.1) | 2.2 (0.7–4.3) | 0.36 (0.01–2.35) | 0.22 (0.01–1.41) |
| KL | 3 | 478 | 75 | S | 3.4 (0.7–12.8) | 2.7 (0.6–7.4) | 5.6 (3.0–9.0) | 3.03 (0.26–14.47) | 1.90 (0.17–8.90) |
| PA | 1 | 167 | 25 | S | 2.2 (0.3–6.5) | 1.7 (0.6–4.5) | 2.9 (0.7–5.0) | 1.59 (0.16–3.79) | 1.00 (0.10–2.39) |
| WA | 4 | 680 | 100 | S | 1.6 (0.3–3.8) | 1.0 (0.1–3.4) | 2.5 (1.0–4.1) | 0.69 (0.02–31.00) | 0.44 (0.02–20.15) |
| BMD | RCD | DBH | H | CB | Age | h_d | SDI | Bon | NoP | Prec | Temp | Sun | DMI | CWB | |
|---|---|---|---|---|---|---|---|---|---|---|---|---|---|---|---|
| BMD | 1 | 0.95 | 0.95 | 0.87 | 0.72 | 0.89 | −0.82 | 0.32 | −0.19 | −0.79 | 0.03 | 0.43 | −0.01 | −0.18 | 0.28 |
| RCD | 1 | 0.99 | 0.92 | 0.82 | 0.91 | −0.84 | 0.47 | −0.07 | −0.84 | −0.04 | 0.47 | 0.08 | −0.28 | 0.18 | |
| DBH | 1 | 0.94 | 0.85 | 0.90 | −0.82 | 0.49 | −0.03 | −0.84 | −0.07 | 0.45 | 0.11 | −0.30 | 0.15 | ||
| H | 1 | 0.91 | 0.75 | −0.71 | 0.68 | 0.23 | −0.80 | −0.10 | 0.54 | 0.31 | −0.37 | 0.10 | |||
| CB | 1 | 0.69 | −0.59 | 0.75 | 0.22 | −0.67 | −0.30 | 0.45 | 0.32 | −0.55 | 0.08 | ||||
| Age | 1 | −0.86 | 0.29 | −0.39 | −0.77 | −0.06 | 0.30 | −0.03 | −0.21 | 0.11 | |||||
| h_d | 1 | −0.20 | 0.34 | 0.93 | 0.12 | −0.19 | 0.10 | 0.23 | −0.29 | ||||||
| SDI | 1 | 0.58 | −0.29 | −0.07 | 0.64 | 0.64 | −0.38 | 0.02 | |||||||
| Bon | 1 | 0.08 | 0.09 | 0.48 | 0.59 | −0.14 | −0.18 | ||||||||
| NoP | 1 | 0.29 | −0.20 | −0.08 | 0.42 | −0.16 | |||||||||
| Prec | 1 | 0.42 | −0.12 | 0.90 | −0.06 | ||||||||||
| Temp | 1 | 0.53 | −0.02 | 0.11 | |||||||||||
| Sun | 1 | −0.39 | −0.46 | ||||||||||||
| DMI | 1 | −0.12 | |||||||||||||
| CWB | 1 |
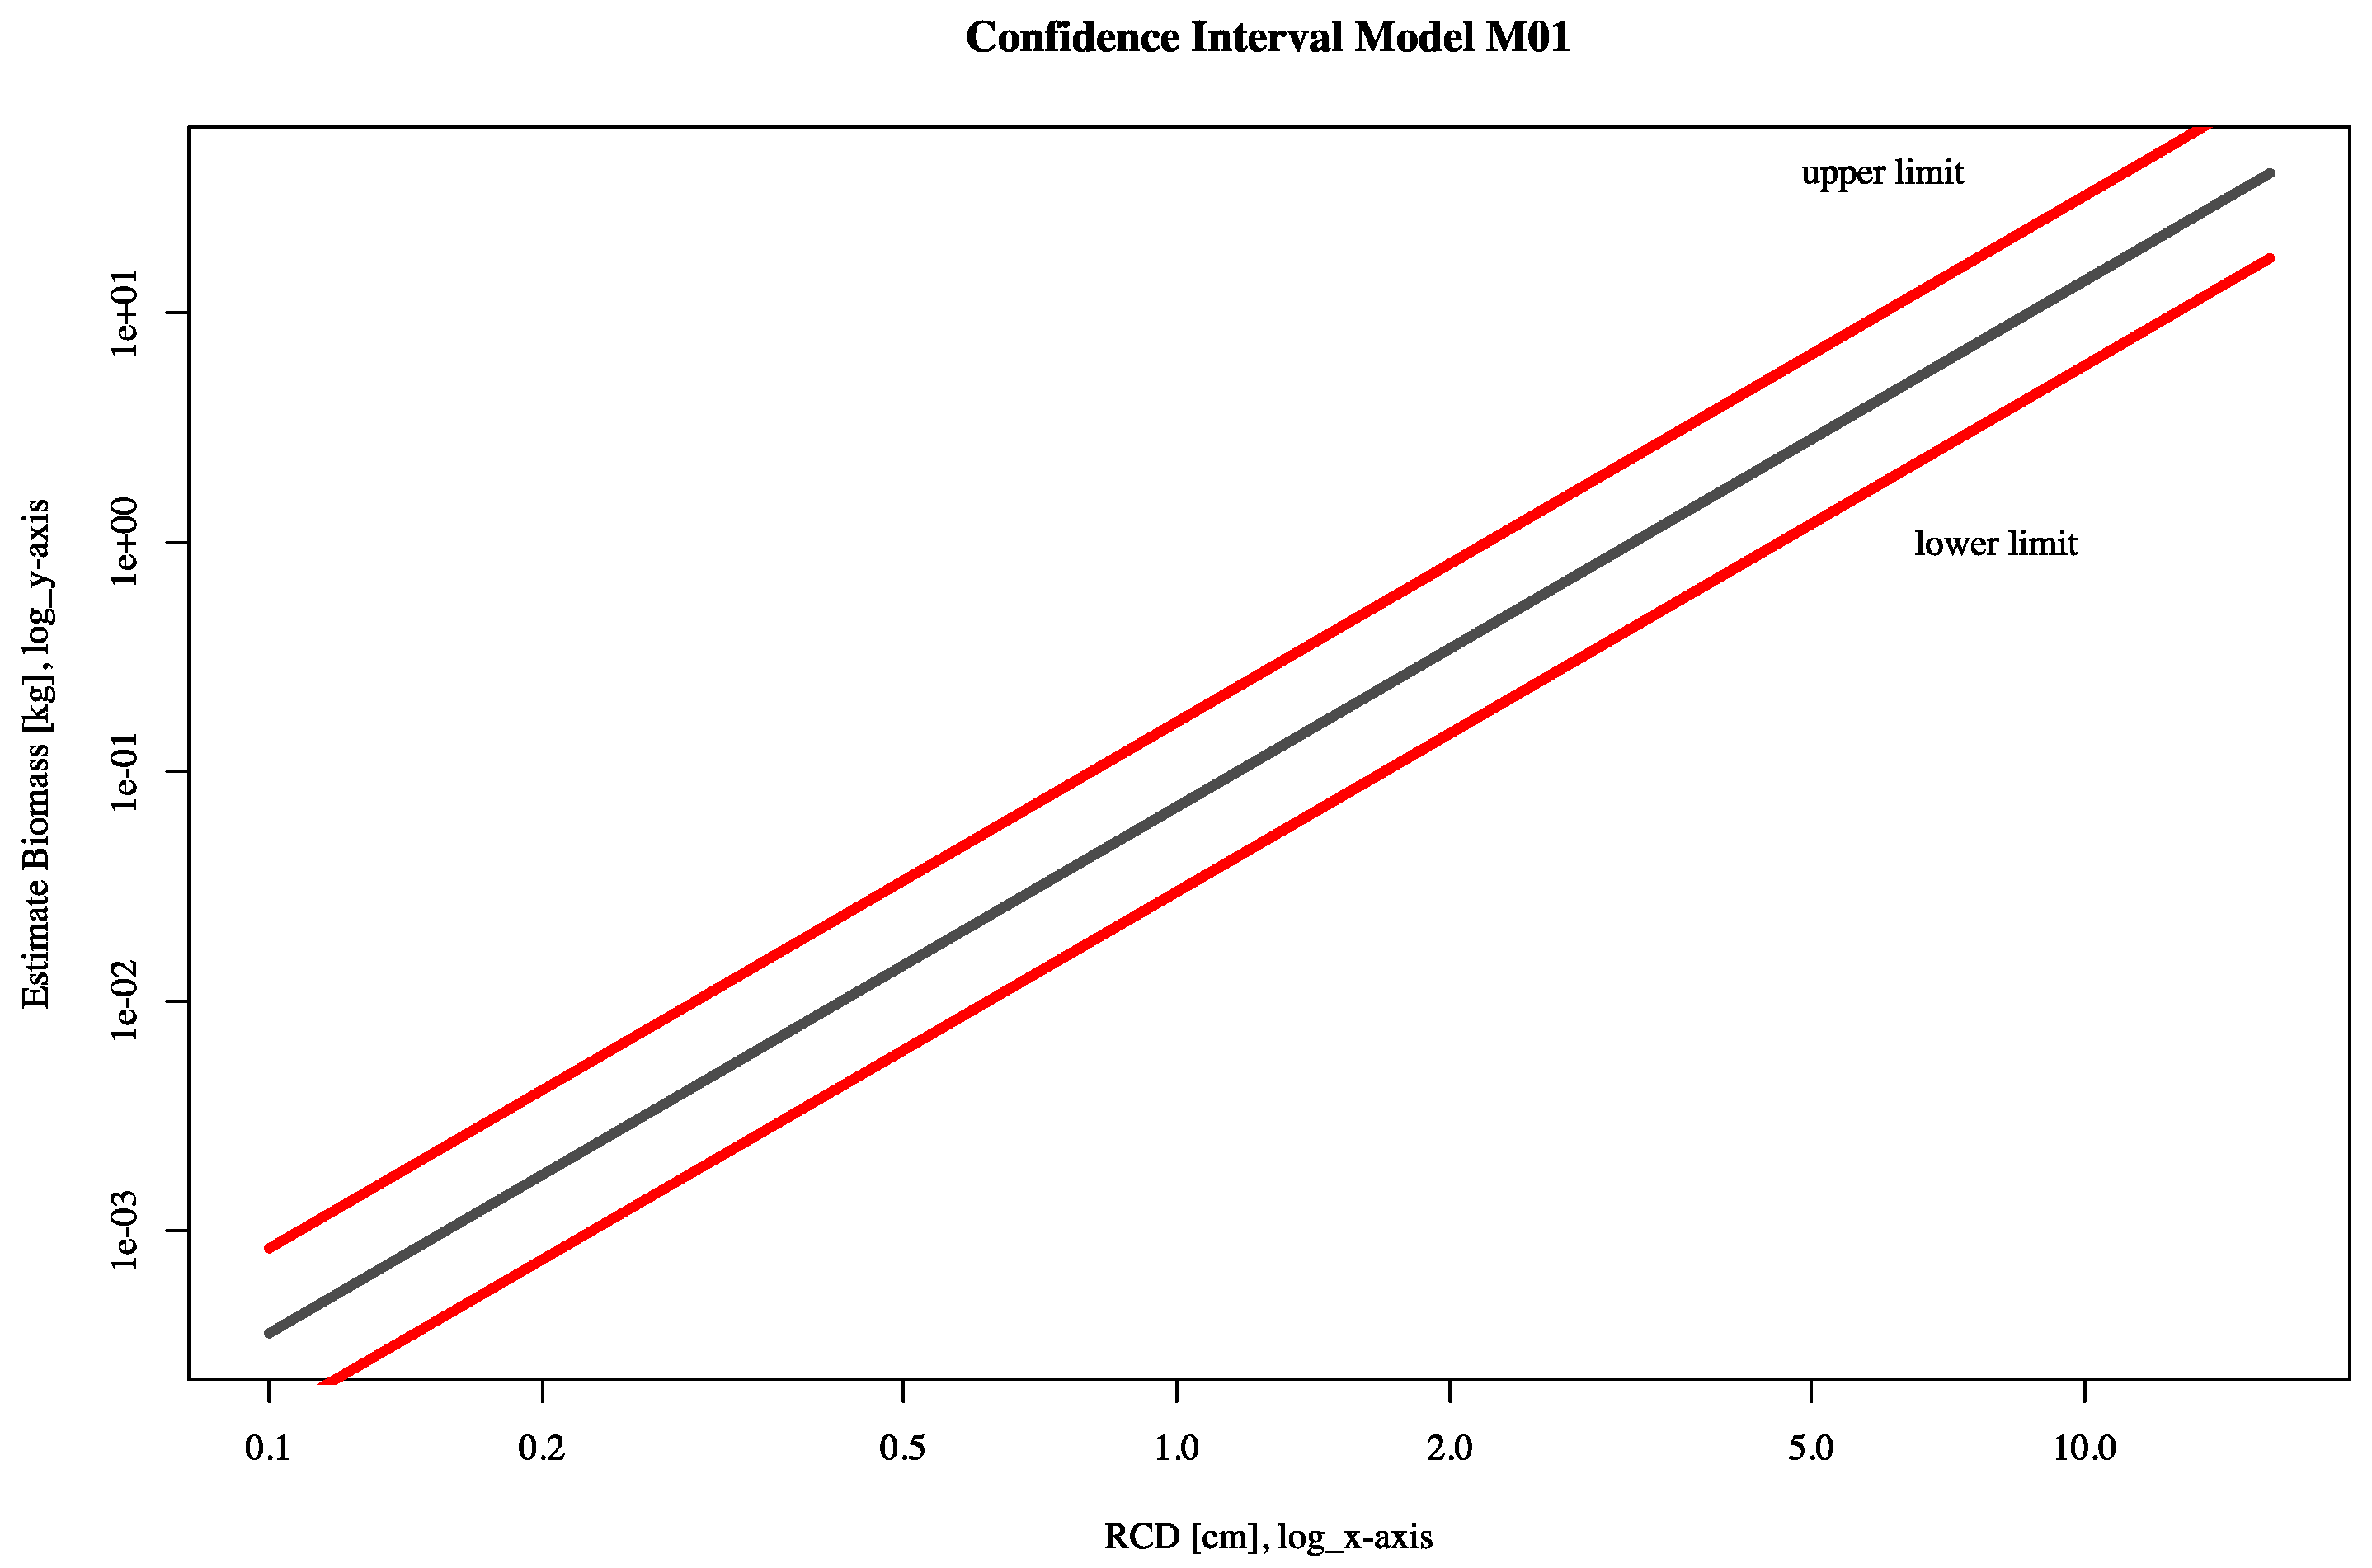
| Model | Variable | Coefficient | Estimate | SE | p-Value | cR2 | AIC | Variance | Confidence Interval | |
|---|---|---|---|---|---|---|---|---|---|---|
| 2.5% | 97.5% | |||||||||
| M01 | Intercept | a | −2.65499 | 0.0436 | <0.001 | 0.9353 | 1890 | 0.2061 | −2.7404 | −2.5696 |
| RCD | b | 2.29325 | 0.0239 | <0.001 | 2.2464 | 2.3401 | ||||
| M02 | Intercept | a | −3.50576 | 0.0649 | <0.001 | 0.9532 | 1466 | 0.1572 | −3.6331 | −3.3784 |
| RCD | b | 1.52190 | 0.0403 | <0.001 | 1.4429 | 1.6008 | ||||
| H | c | 1.20956 | 0.0541 | <0.001 | 1.1035 | 1.3156 | ||||
| M03 | Intercept | a | −3.40775 | 0.0794 | <0.001 | 0.9492 | 1437 | 0.1567 | −3.5634 | −3.2521 |
| RCD | b | 1.50926 | 0.0399 | <0.001 | 1.4309 | 1.5876 | ||||
| H | c | 0.58536 | 0.1183 | <0.001 | 0.3532 | 0.8175 | ||||
| h/hg | d | 0.63665 | 0.1063 | <0.001 | 0.4280 | 0.8452 | ||||
| M04 | Intercept | a | −3.69133 | 0.0930 | <0.001 | 0.9510 | 1419 | 0.1528 | −3.8736 | −3.5090 |
| RCD | b | 1.94216 | 0.0961 | <0.001 | 1.7536 | 2.1307 | ||||
| H | c | 0.27772 | 0.1340 | 0.0383 | 0.0149 | 0.5405 | ||||
| h/hg | d | 0.53084 | 0.1056 | <0.001 | 0.3236 | 0.7380 | ||||
| h/d | e | 0.26262 | 0.0535 | <0.001 | 0.1576 | 0.3676 | ||||
| Model | Variables | Parameter | Estimate | SE | p-Value |
|---|---|---|---|---|---|
| Mining vs. Agriculture | BM and RCD | a1 | −2.73527 | 0.0849 | <0.001 |
| a2 | 2.36960 | 0.0377 | <0.001 | ||
| a3 | 0.14295 | 0.1054 | 0.2 | ||
| a4 | −0.13925 | 0.0494 | <0.05 | ||
| Mining vs. Agriculture | BM and H | a1 | –4.90281 | 0.0696 | <0.001 |
| a2 | 3.35715 | 0.0478 | <0.001 | ||
| a3 | 0.42611 | 0.0846 | <0.001 | ||
| a4 | −0.37694 | 0.0602 | <0.001 | ||
| Core vs. stump | BM and RCD | a1 | −2.94658 | 0.0862 | <0.001 |
| a2 | 2.47837 | 0.0405 | <0.001 | ||
| a3 | 0.41101 | 0.1012 | <0.001 | ||
| a4 | −0.30298 | 0.0513 | <0.001 | ||
| Core vs. stump | BM and H | a1 | −4.12556 | 0.0970 | <0.001 |
| a2 | 2.91852 | 0.0590 | <0.001 | ||
| a3 | −0.42888 | 0.1070 | <0.001 | ||
| a4 | 0.02504 | 0.0711 | 0.725 |
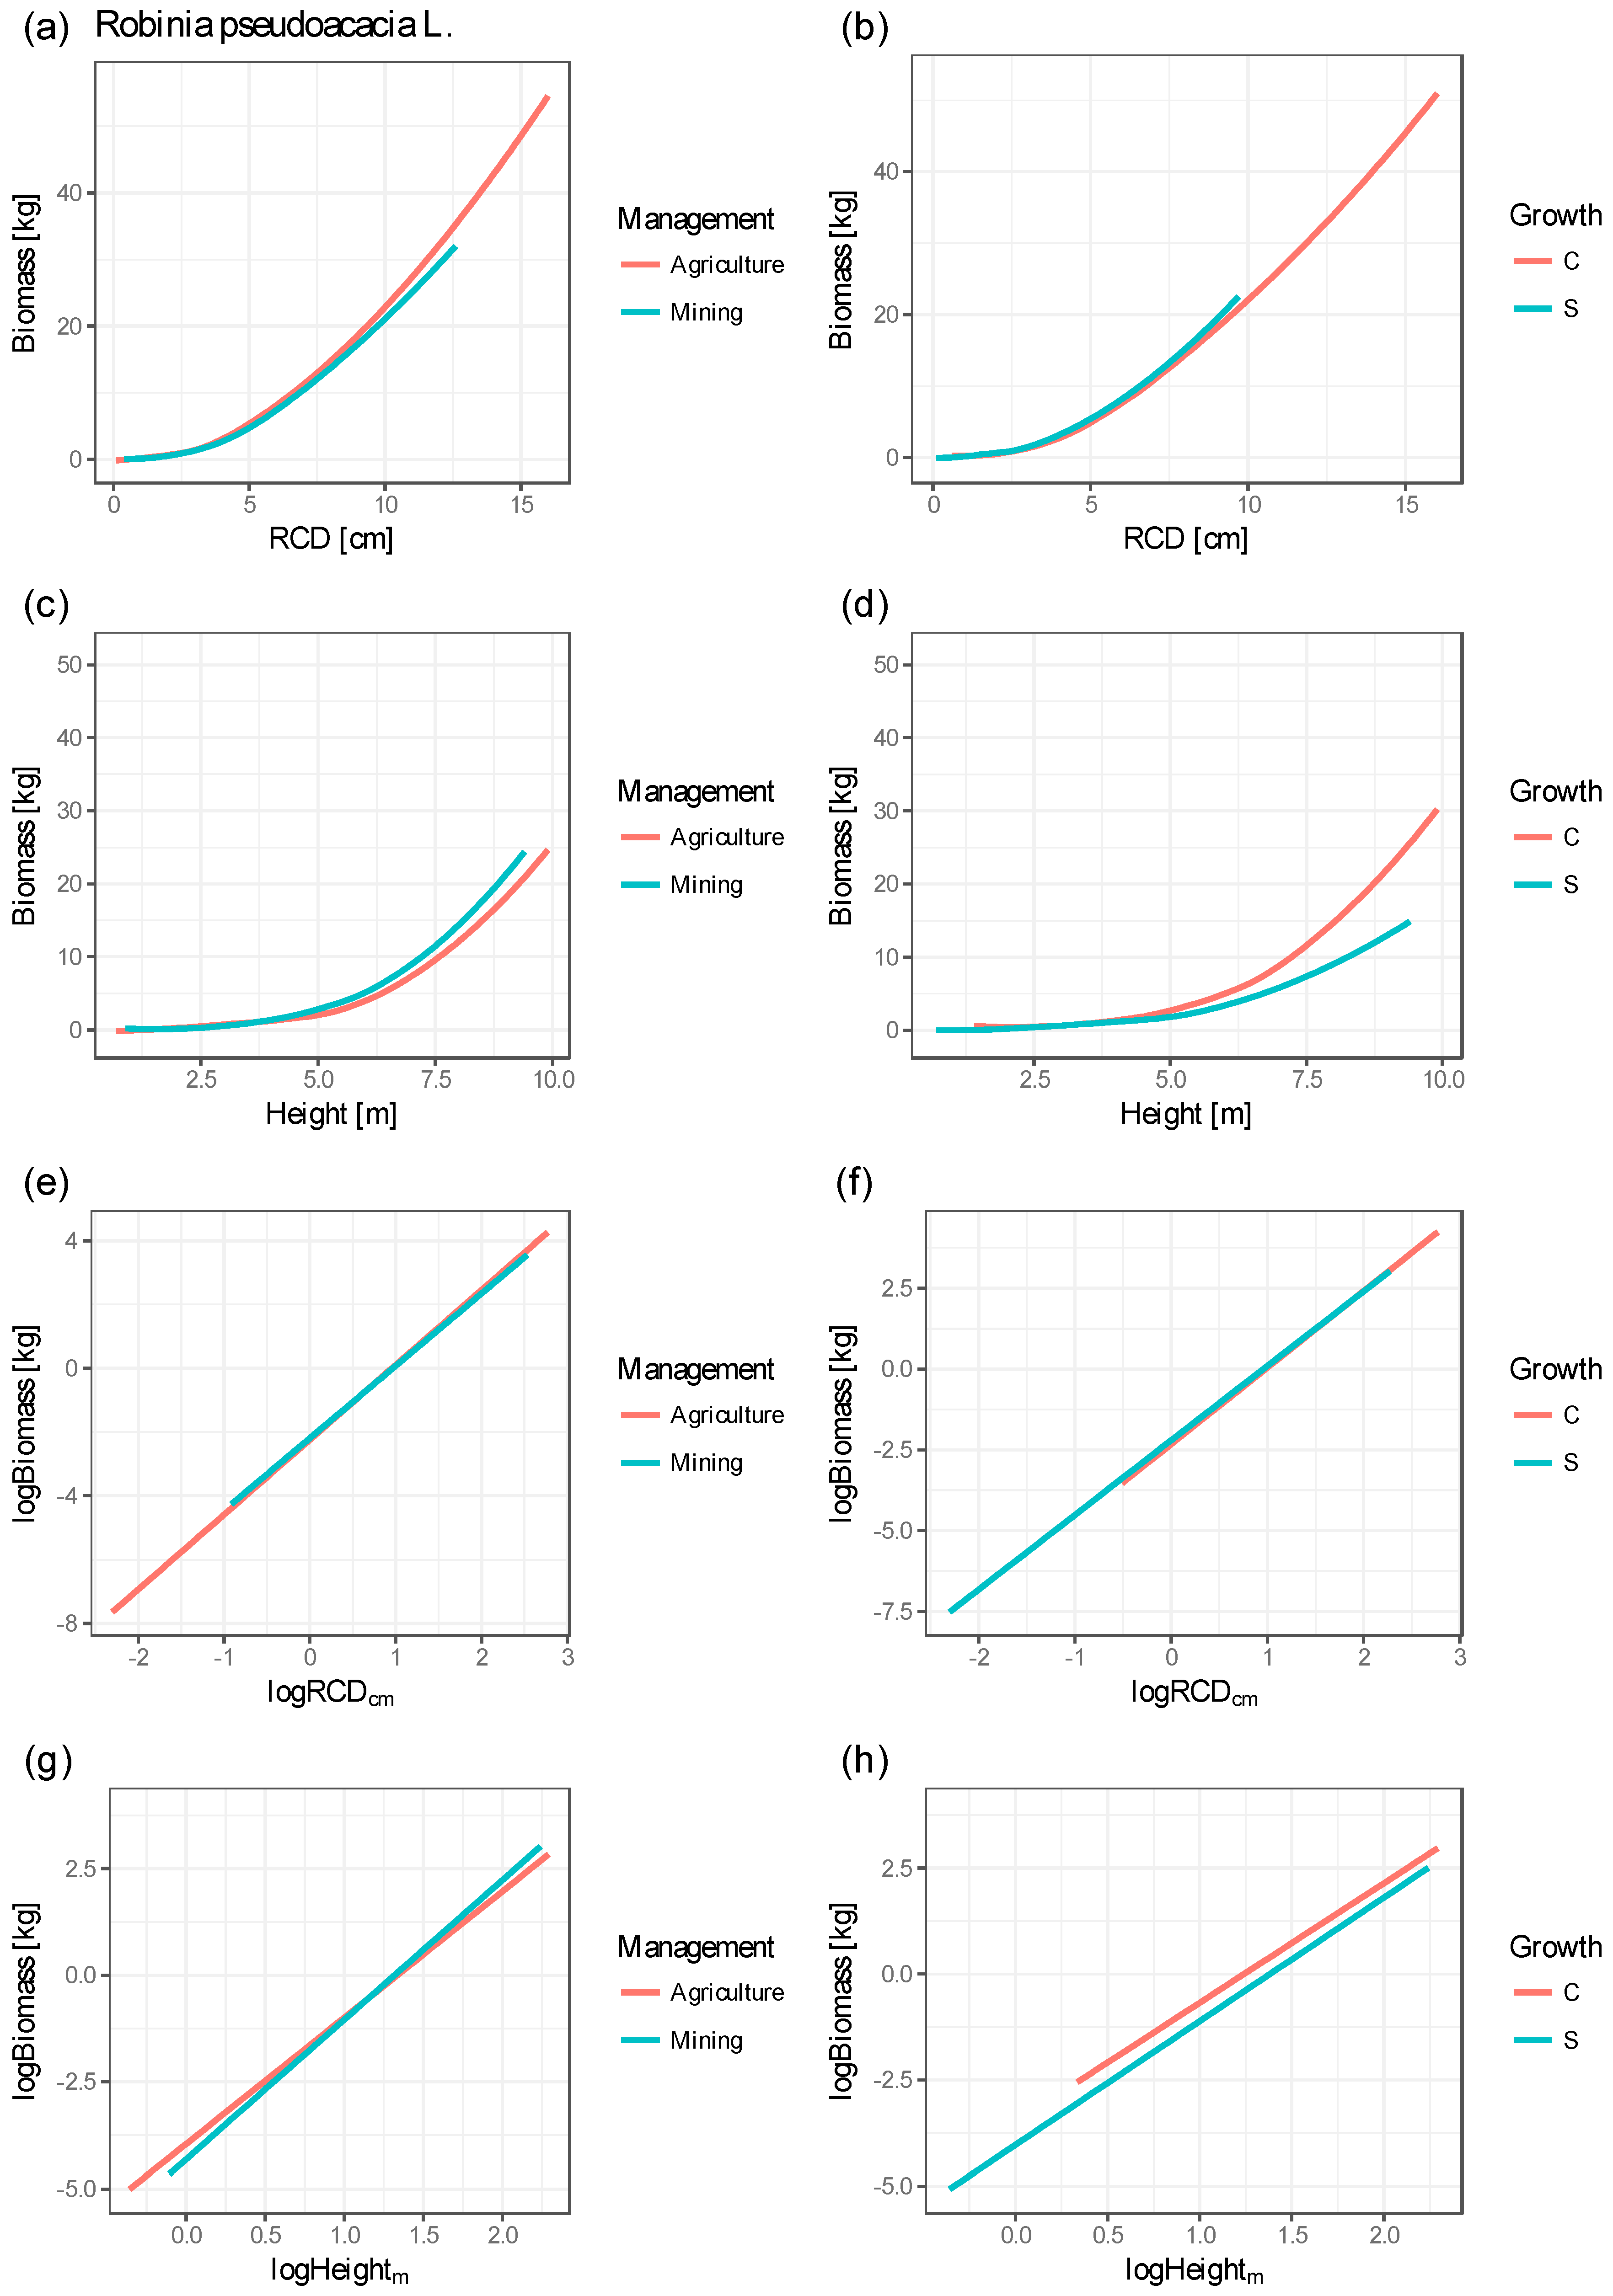
| Figure 3 | Explanatory Variable | Value | Min (kg) | Agr (kg) | Min–Agr (kg) | Hectare (to) | C (kg) | S (kg) | C–S (kg) | Hectare (to) |
|---|---|---|---|---|---|---|---|---|---|---|
| (a), (b) | RCD (cm) | 4.7 | 2.449 | 2.362 | 0.087 | 0.722 # | 2.478 | 2.247 | 0.231 | 1.923 # |
| 9.0 | 11.713 | 10.054 | 1.659 | 3.318 * | 12.292 | 9.164 | 3.128 | 6.256 * | ||
| (c), (d) | H (m) | 5.2 | 1.648 | 1.677 | 0.029 | 0.244 # | 1.991 | 1.573 | 0.418 | 3.480 # |
| 7.3 | 4.305 | 4.663 | 0.358 | 0.717 * | 5.185 | 4.425 | 0.760 | 1.520 * |
| Rank | Site | Former Utilization | n | Age | Biomass Wet | Biomass Dry | Carbon Sequestration (to ha−1 a−1) | ||
|---|---|---|---|---|---|---|---|---|---|
| (to ha−1) | (to ha−1 a−1) | (to ha−1) | (to ha−1 a−1) | ||||||
| 1 | KL | Agriculture | 75 | 2 | 44.2 | 22.1 | 27.6 | 13.8 | 6.9 |
| 2 | BG | Agriculture | 75 | 3 | 48.6 | 16.2 | 30.0 | 10.0 | 5.0 |
| 3 | DA | Agriculture | 75 | 3 | 44.7 | 14.9 | 27.9 | 9.3 | 4.7 |
| 4 | HM | Mining | 100 | 2 | 23.8 | 11.9 | 14.4 | 7.2 | 3.6 |
| 5 | CA | Agriculture | 75 | 5 | 55.5 | 11.1 | 35.5 | 7.1 | 3.6 |
| 6 | WZ | Mining | 200 | 1 | 9.8 | 9.8 | 6.0 | 6.0 | 3.0 |
| 7 | WA | Agriculture | 100 | 1 | 9.5 | 9.5 | 5.9 | 5.9 | 3.0 |
| 8 | RM | Mining | 225 | 7 | 55.3 | 7.9 | 37.1 | 5.3 | 2.7 |
| 9 | LH | Mining | 150 | 8 | 43.2 | 5.4 | 28.0 | 3.5 | 1.8 |
| 10 | RA | Mining | 25 | 7 | 34.3 | 4.9 | 22.4 | 3.2 | 1.6 |
| 11 | BE | Agriculture | 75 | 8 | 39.2 | 4.9 | 24.0 | 3.0 | 1.5 |
| 12 | BH | Agriculture | 150 | 2 | 7.6 | 3.8 | 4.6 | 2.3 | 1.2 |
| 13 | GU | Agriculture | 200 | 2 | 7.2 | 3.6 | 4.2 | 2.1 | 1.1 |
| 14 | PA | Agriculture | 25 | 3 | 4.8 | 1.6 | 3.0 | 1.0 | 0.5 |
© 2017 by the authors. Licensee MDPI, Basel, Switzerland. This article is an open access article distributed under the terms and conditions of the Creative Commons Attribution (CC BY) license (http://creativecommons.org/licenses/by/4.0/).
Share and Cite
Carl, C.; Biber, P.; Landgraf, D.; Buras, A.; Pretzsch, H. Allometric Models to Predict Aboveground Woody Biomass of Black Locust (Robinia pseudoacacia L.) in Short Rotation Coppice in Previous Mining and Agricultural Areas in Germany. Forests 2017, 8, 328. https://doi.org/10.3390/f8090328
Carl C, Biber P, Landgraf D, Buras A, Pretzsch H. Allometric Models to Predict Aboveground Woody Biomass of Black Locust (Robinia pseudoacacia L.) in Short Rotation Coppice in Previous Mining and Agricultural Areas in Germany. Forests. 2017; 8(9):328. https://doi.org/10.3390/f8090328
Chicago/Turabian StyleCarl, Christin, Peter Biber, Dirk Landgraf, Allan Buras, and Hans Pretzsch. 2017. "Allometric Models to Predict Aboveground Woody Biomass of Black Locust (Robinia pseudoacacia L.) in Short Rotation Coppice in Previous Mining and Agricultural Areas in Germany" Forests 8, no. 9: 328. https://doi.org/10.3390/f8090328
APA StyleCarl, C., Biber, P., Landgraf, D., Buras, A., & Pretzsch, H. (2017). Allometric Models to Predict Aboveground Woody Biomass of Black Locust (Robinia pseudoacacia L.) in Short Rotation Coppice in Previous Mining and Agricultural Areas in Germany. Forests, 8(9), 328. https://doi.org/10.3390/f8090328