C:N:P Stoichiometry and Carbon Storage in a Naturally-Regenerated Secondary Quercus variabilis Forest Age Sequence in the Qinling Mountains, China


Abstract
:1. Introduction
2. Materials and Methods
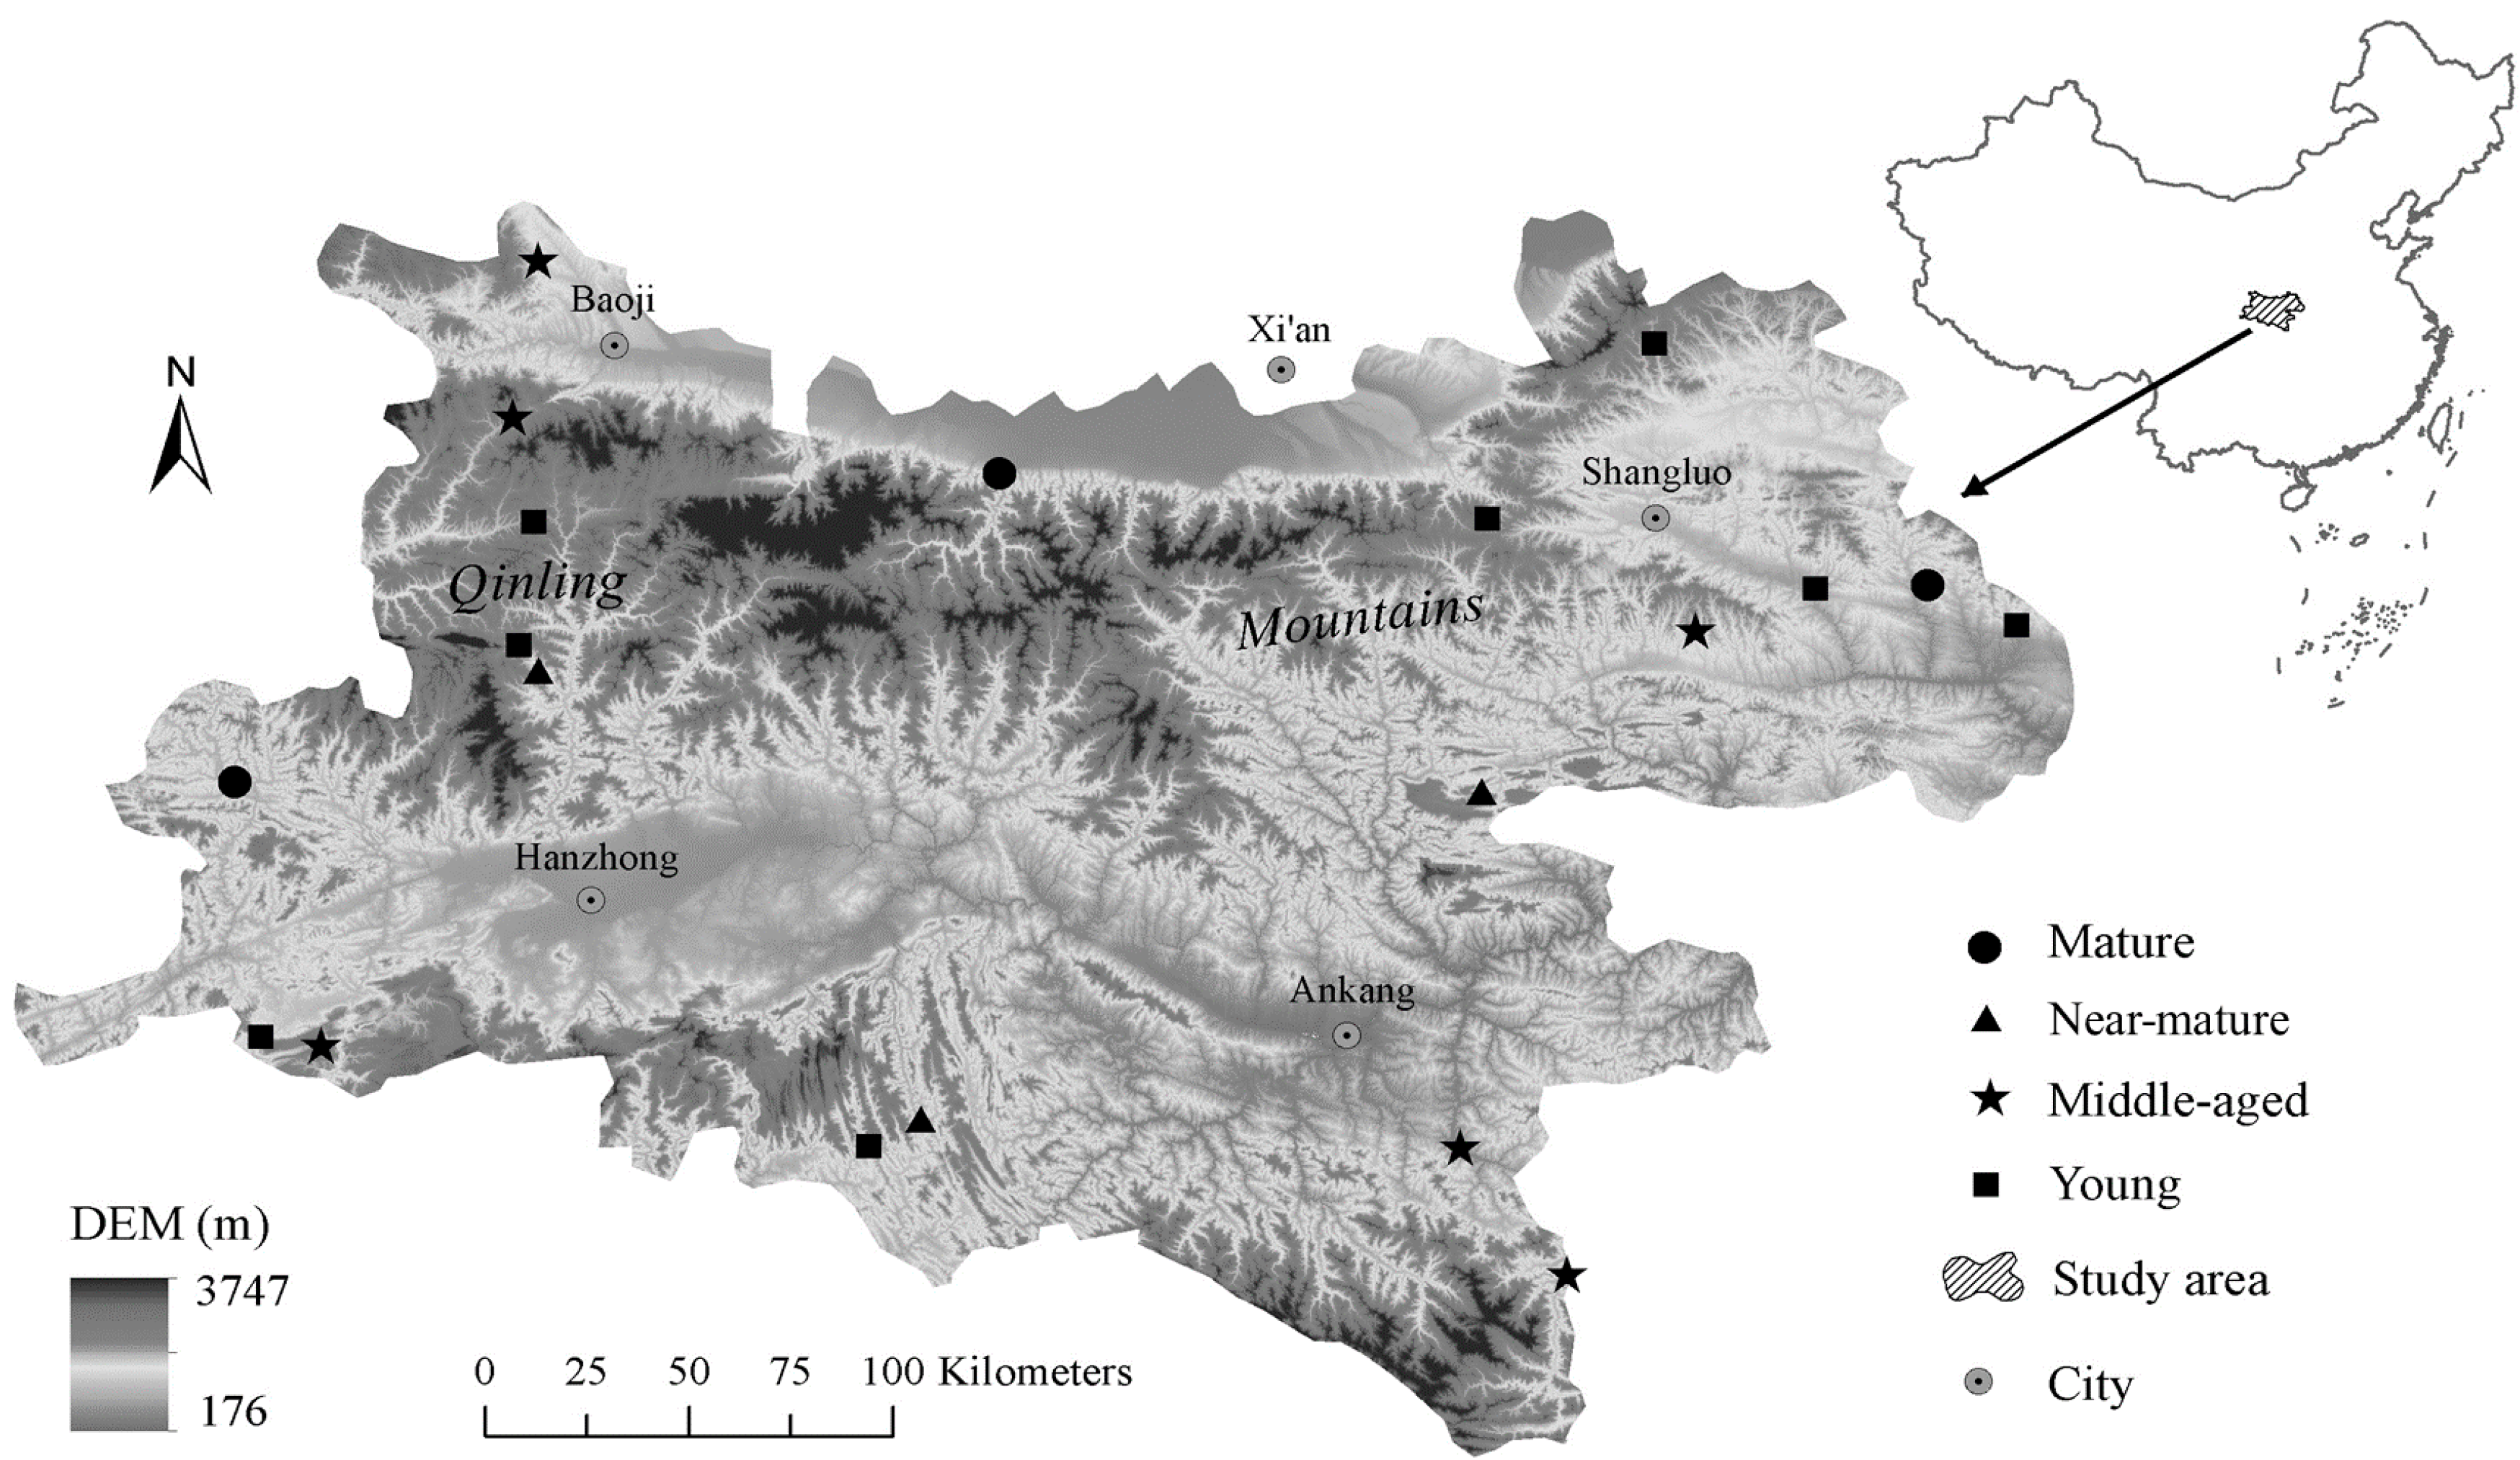
2.1. Site Description
2.2. Field Sampling and Measurements
2.3. Chemical Analysis
2.4. Data Analysis
3. Results
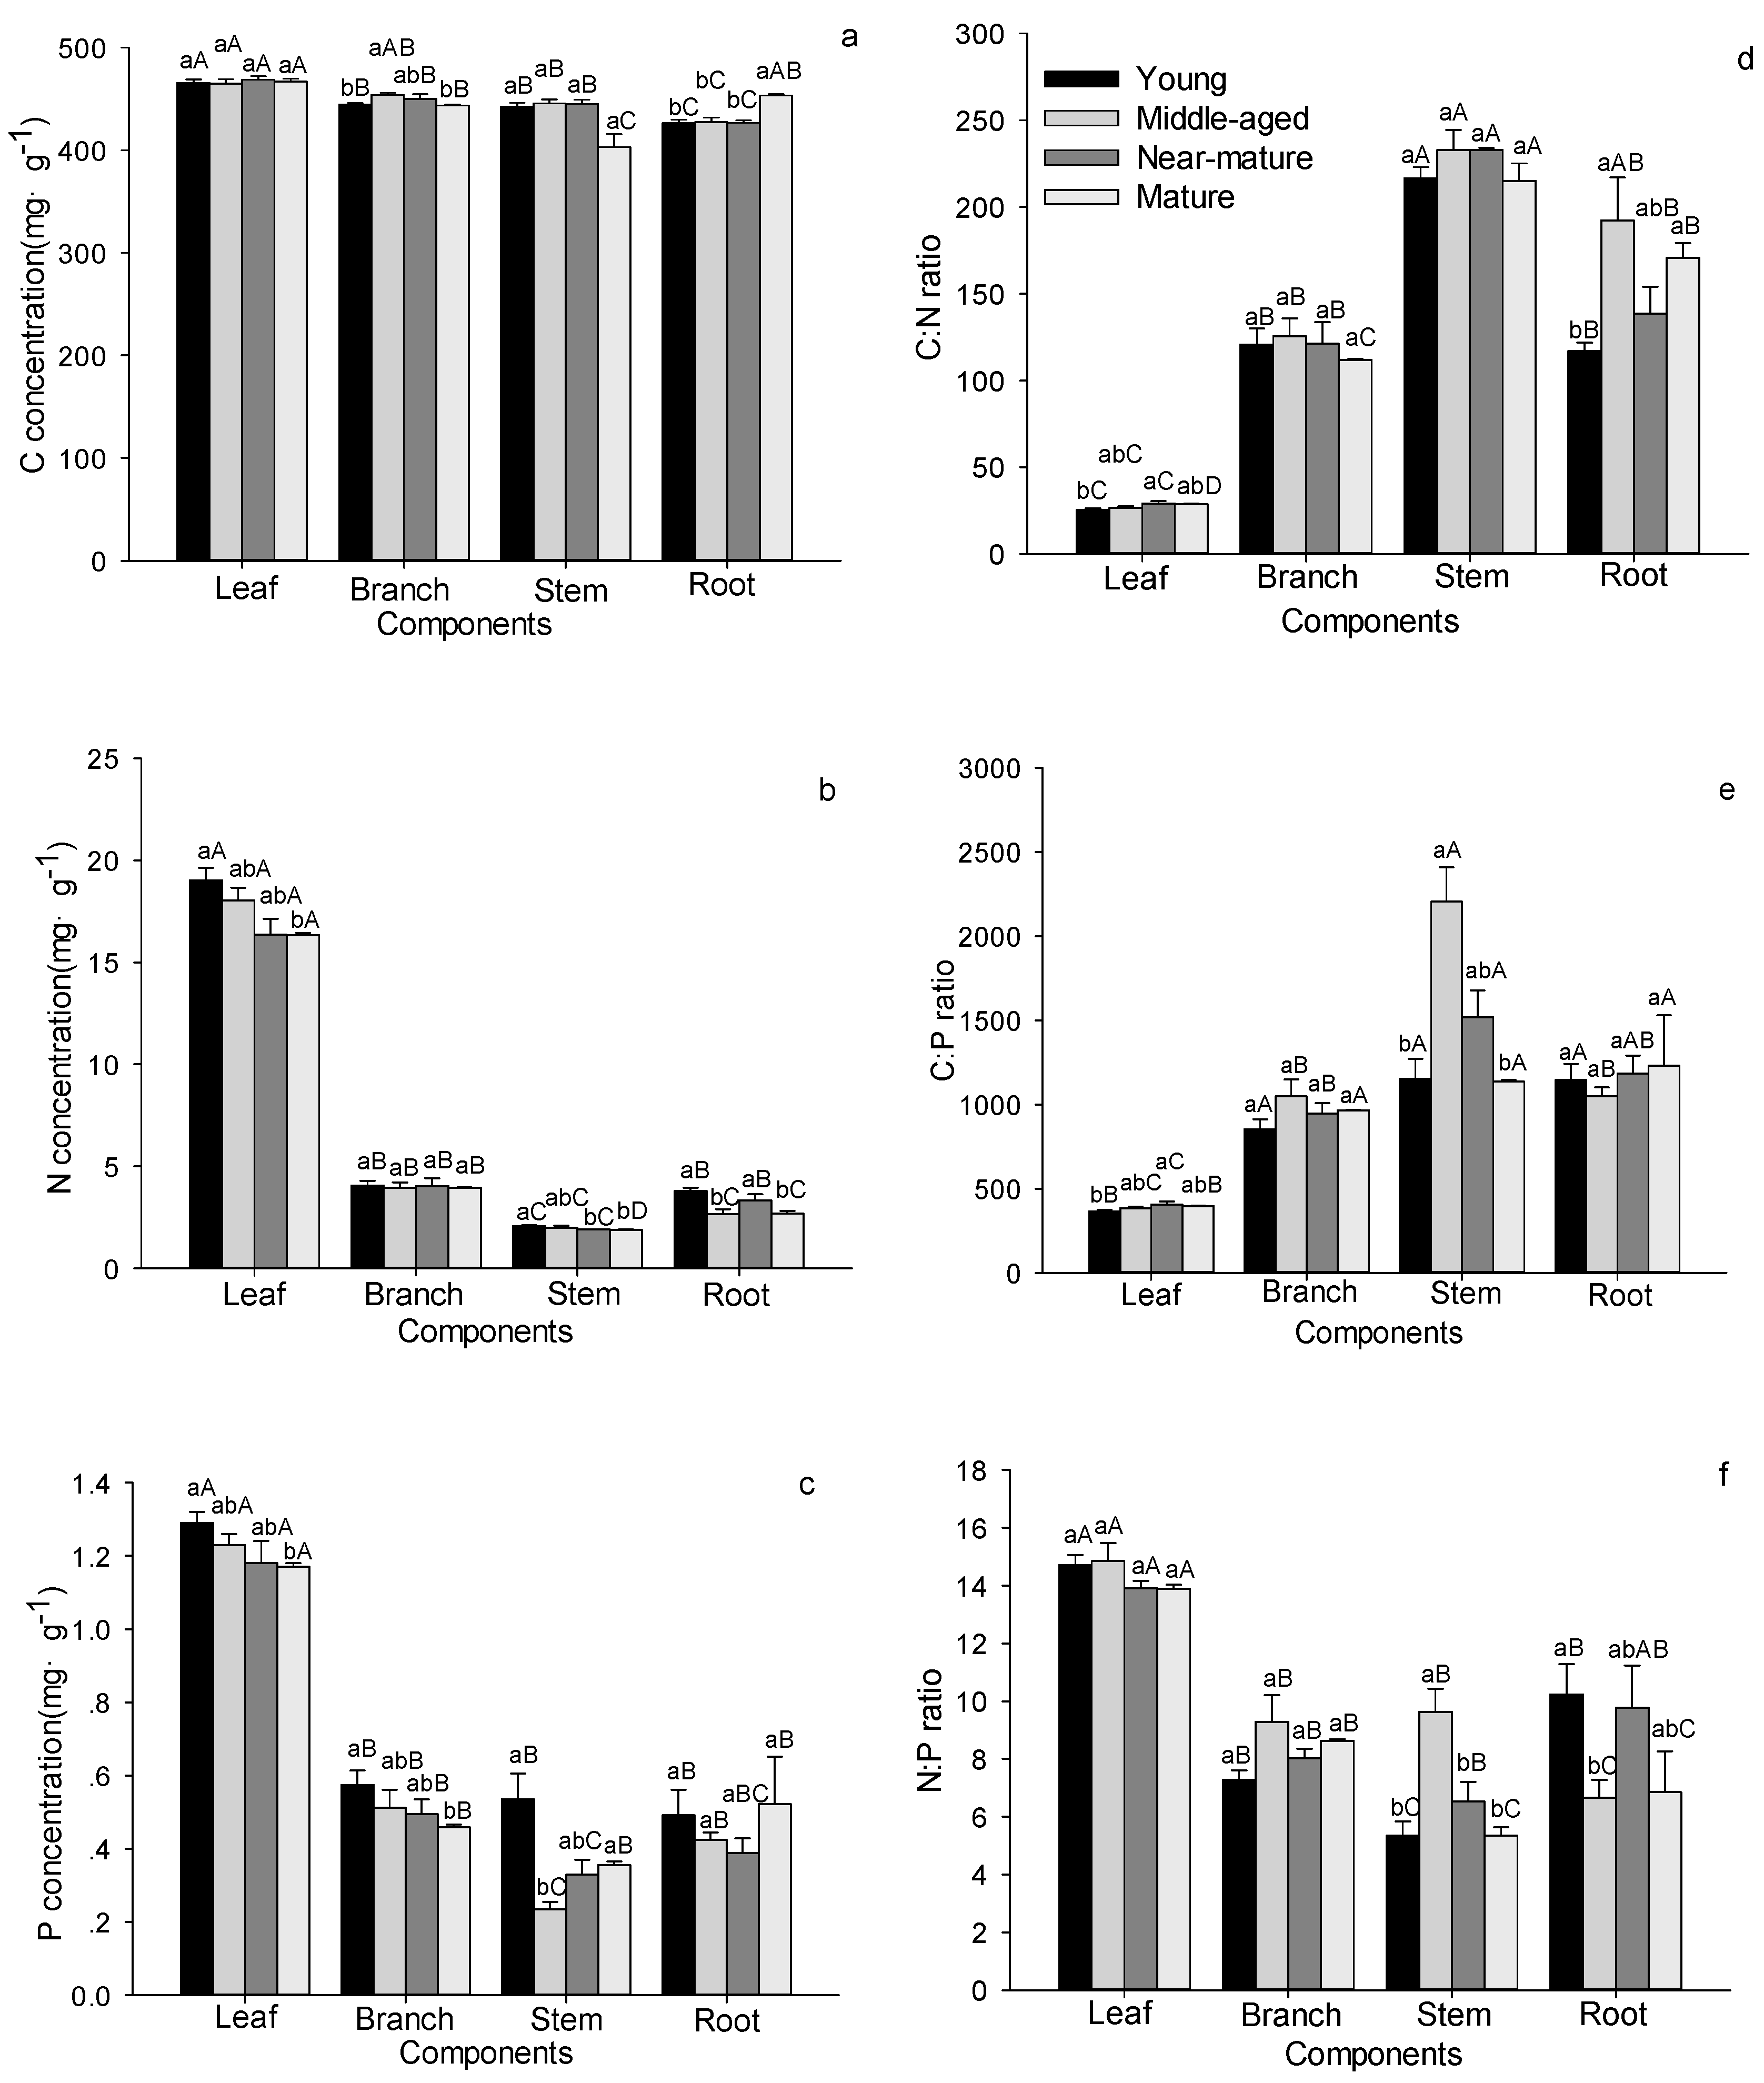
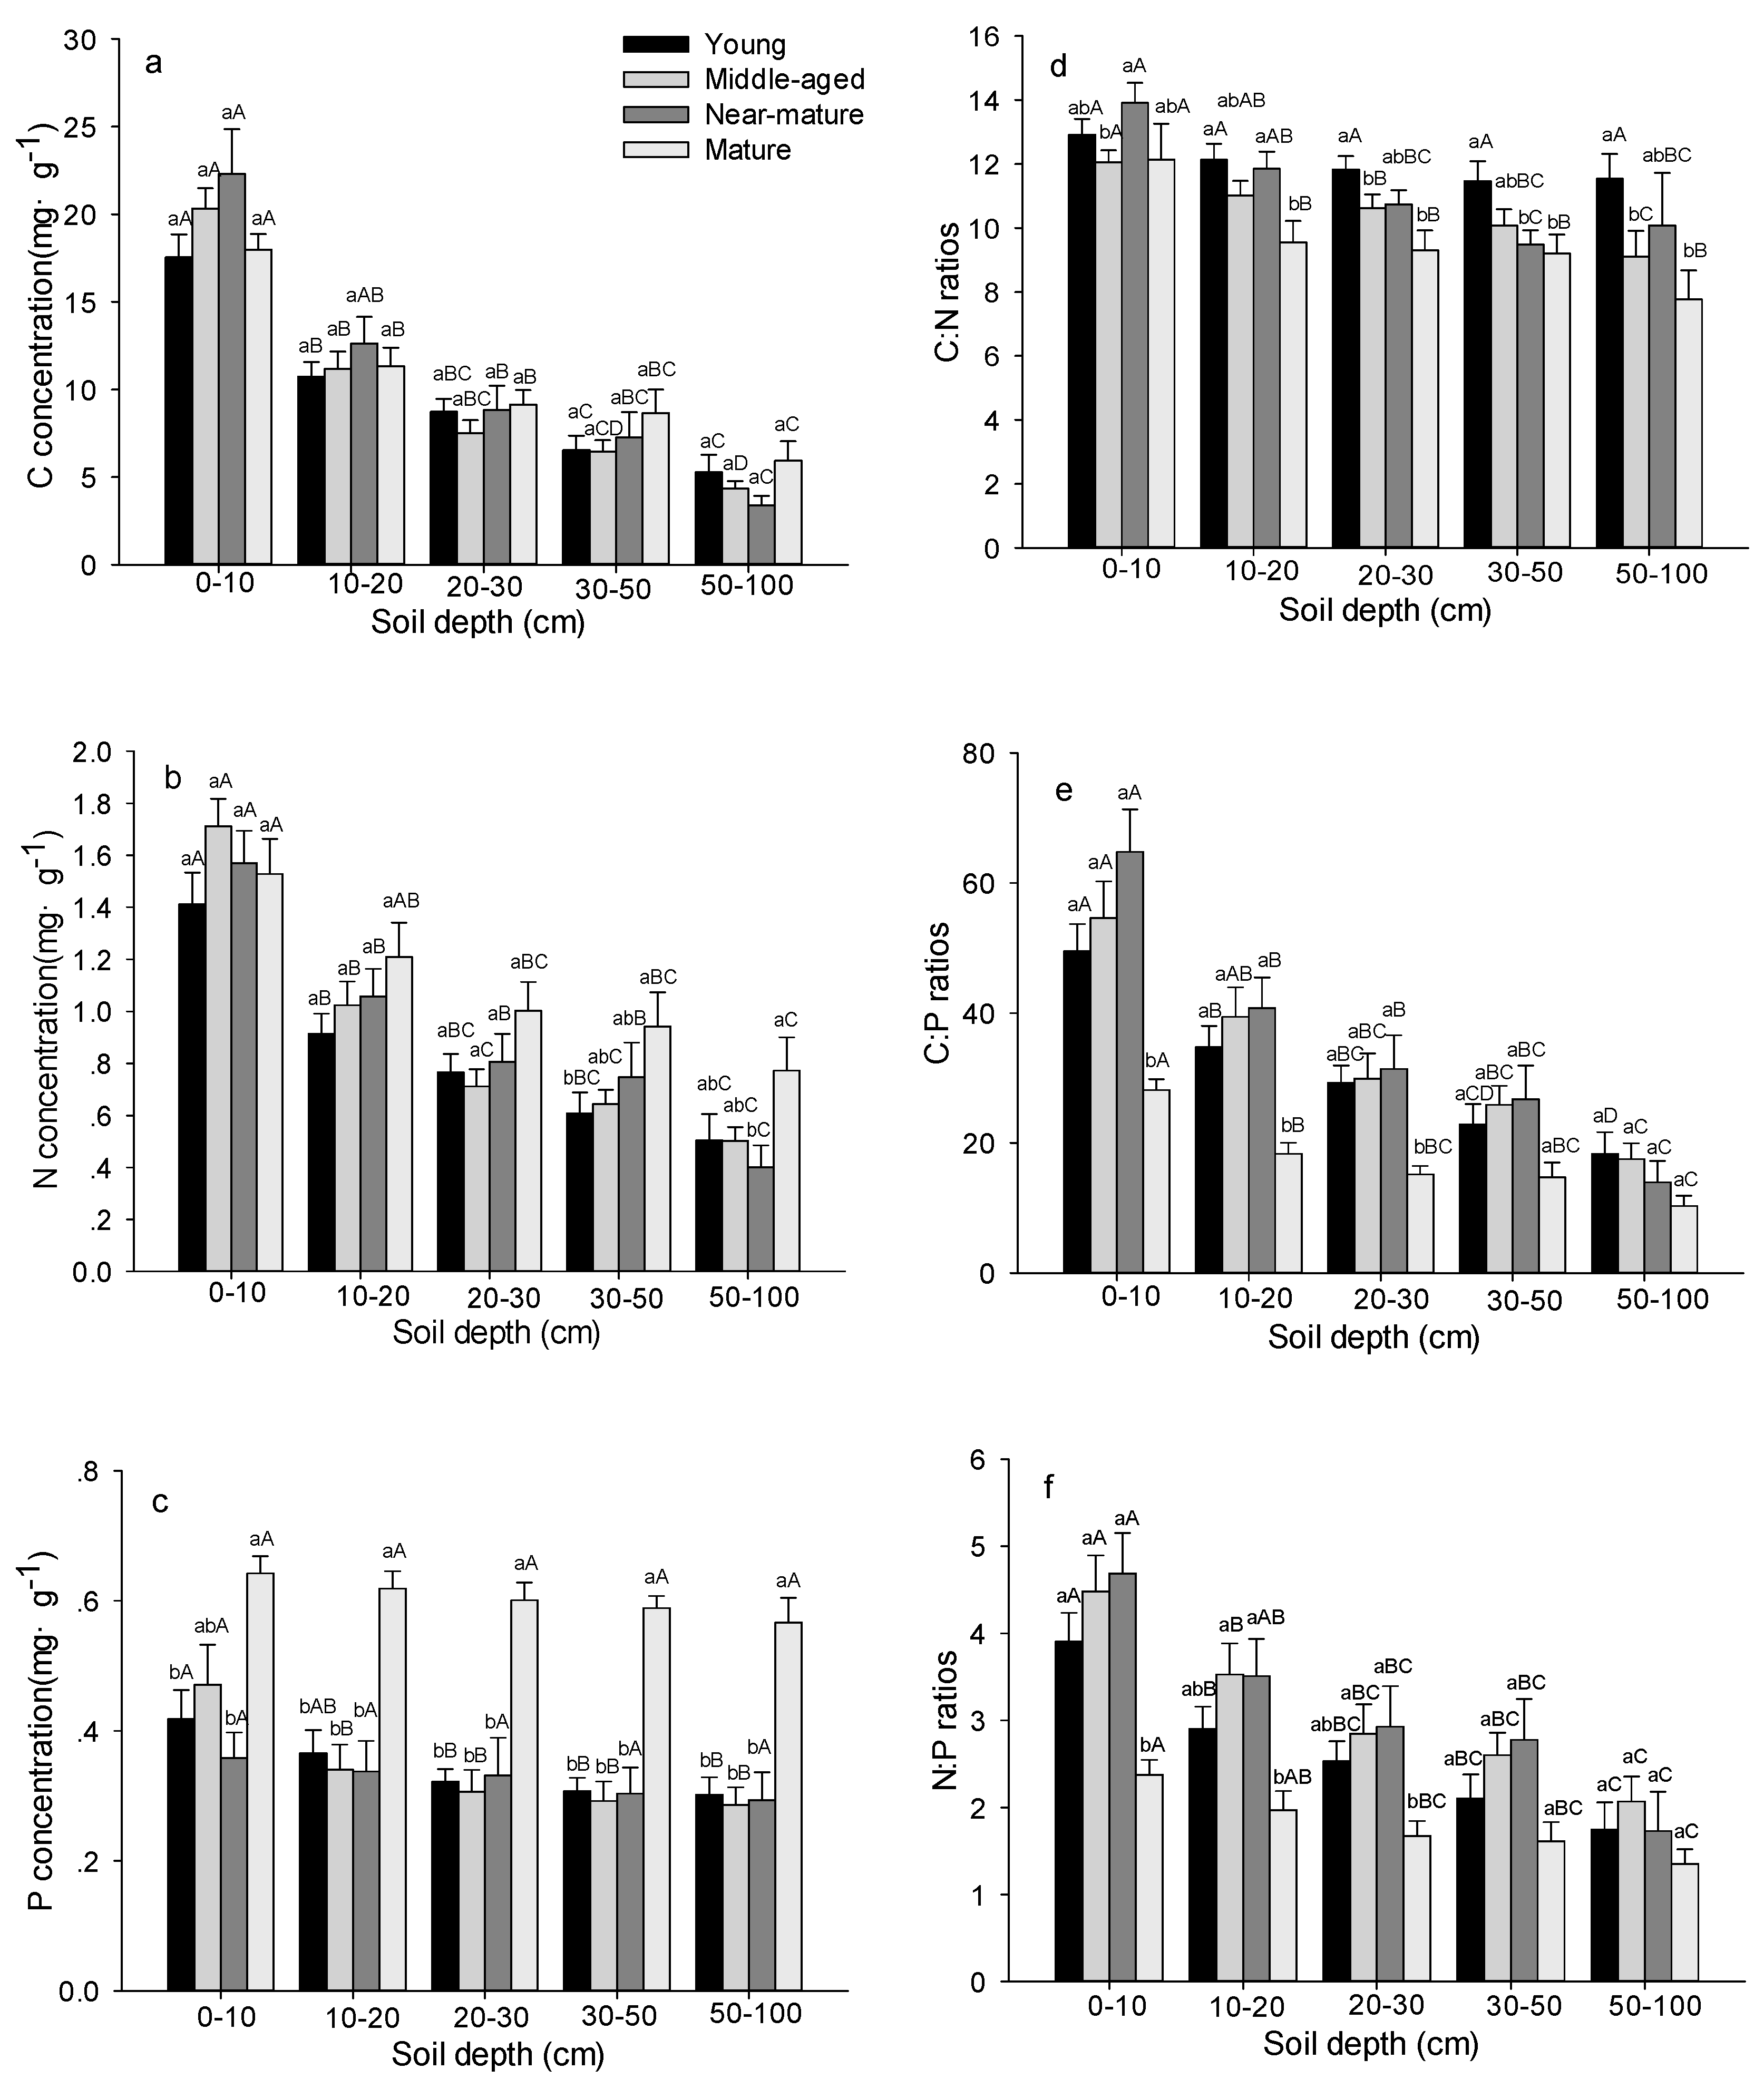
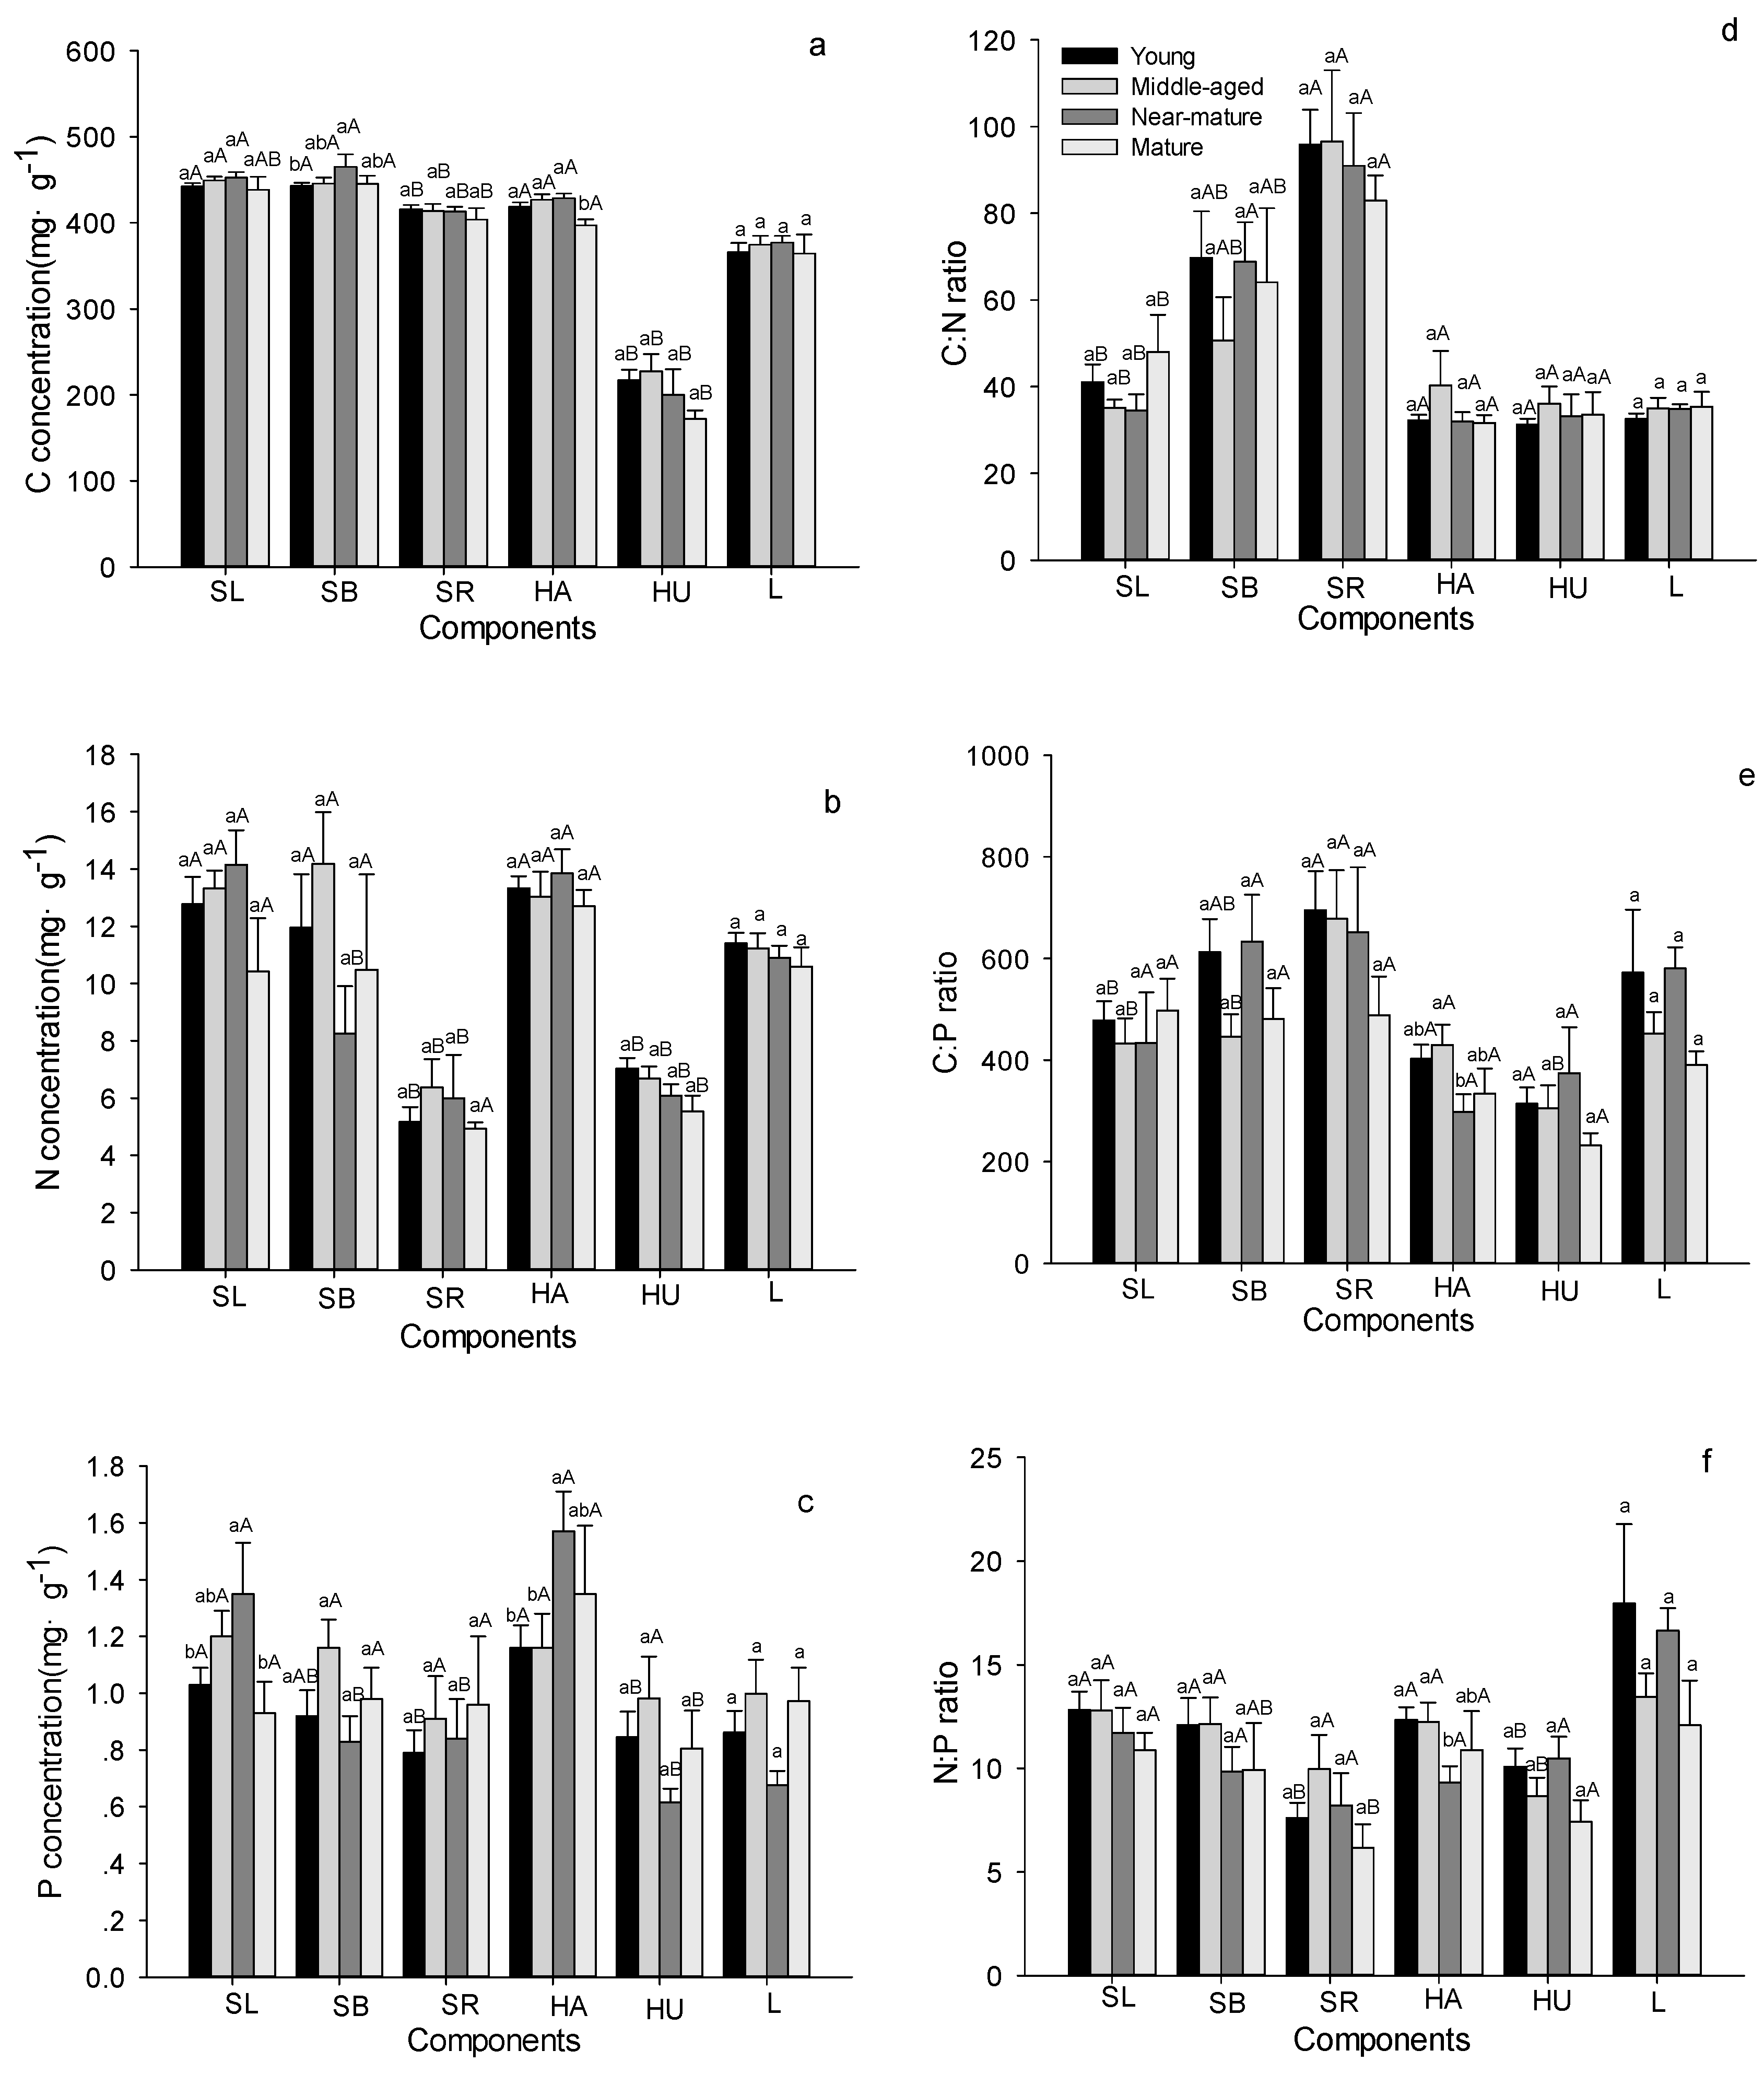
3.1. C, N, P Stoichiometric Characteristics in Quercus variabilis Natural Secondary Forest
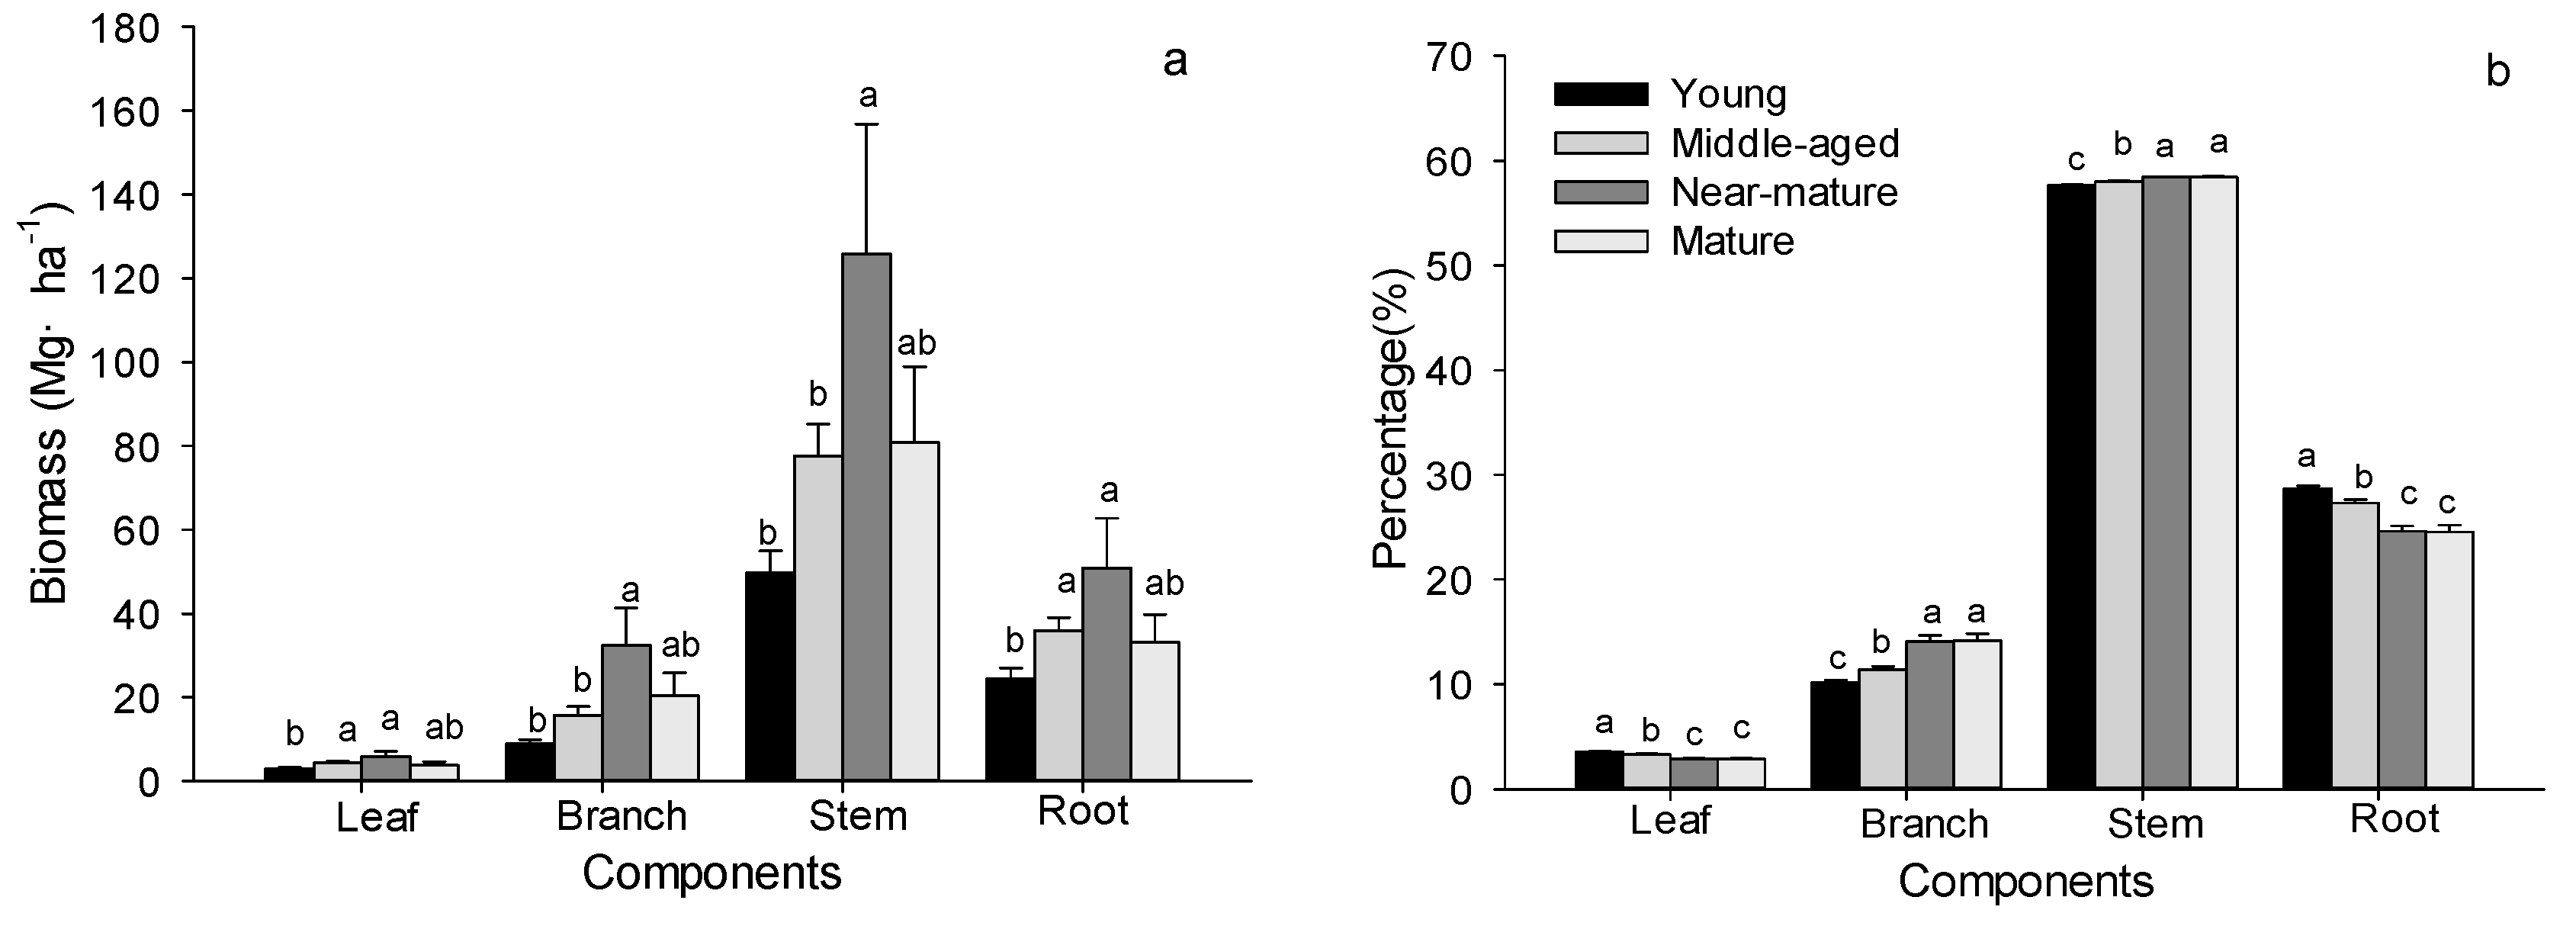
3.2. Biomass Allocation in Quercus variabilis Natural Secondary Forest
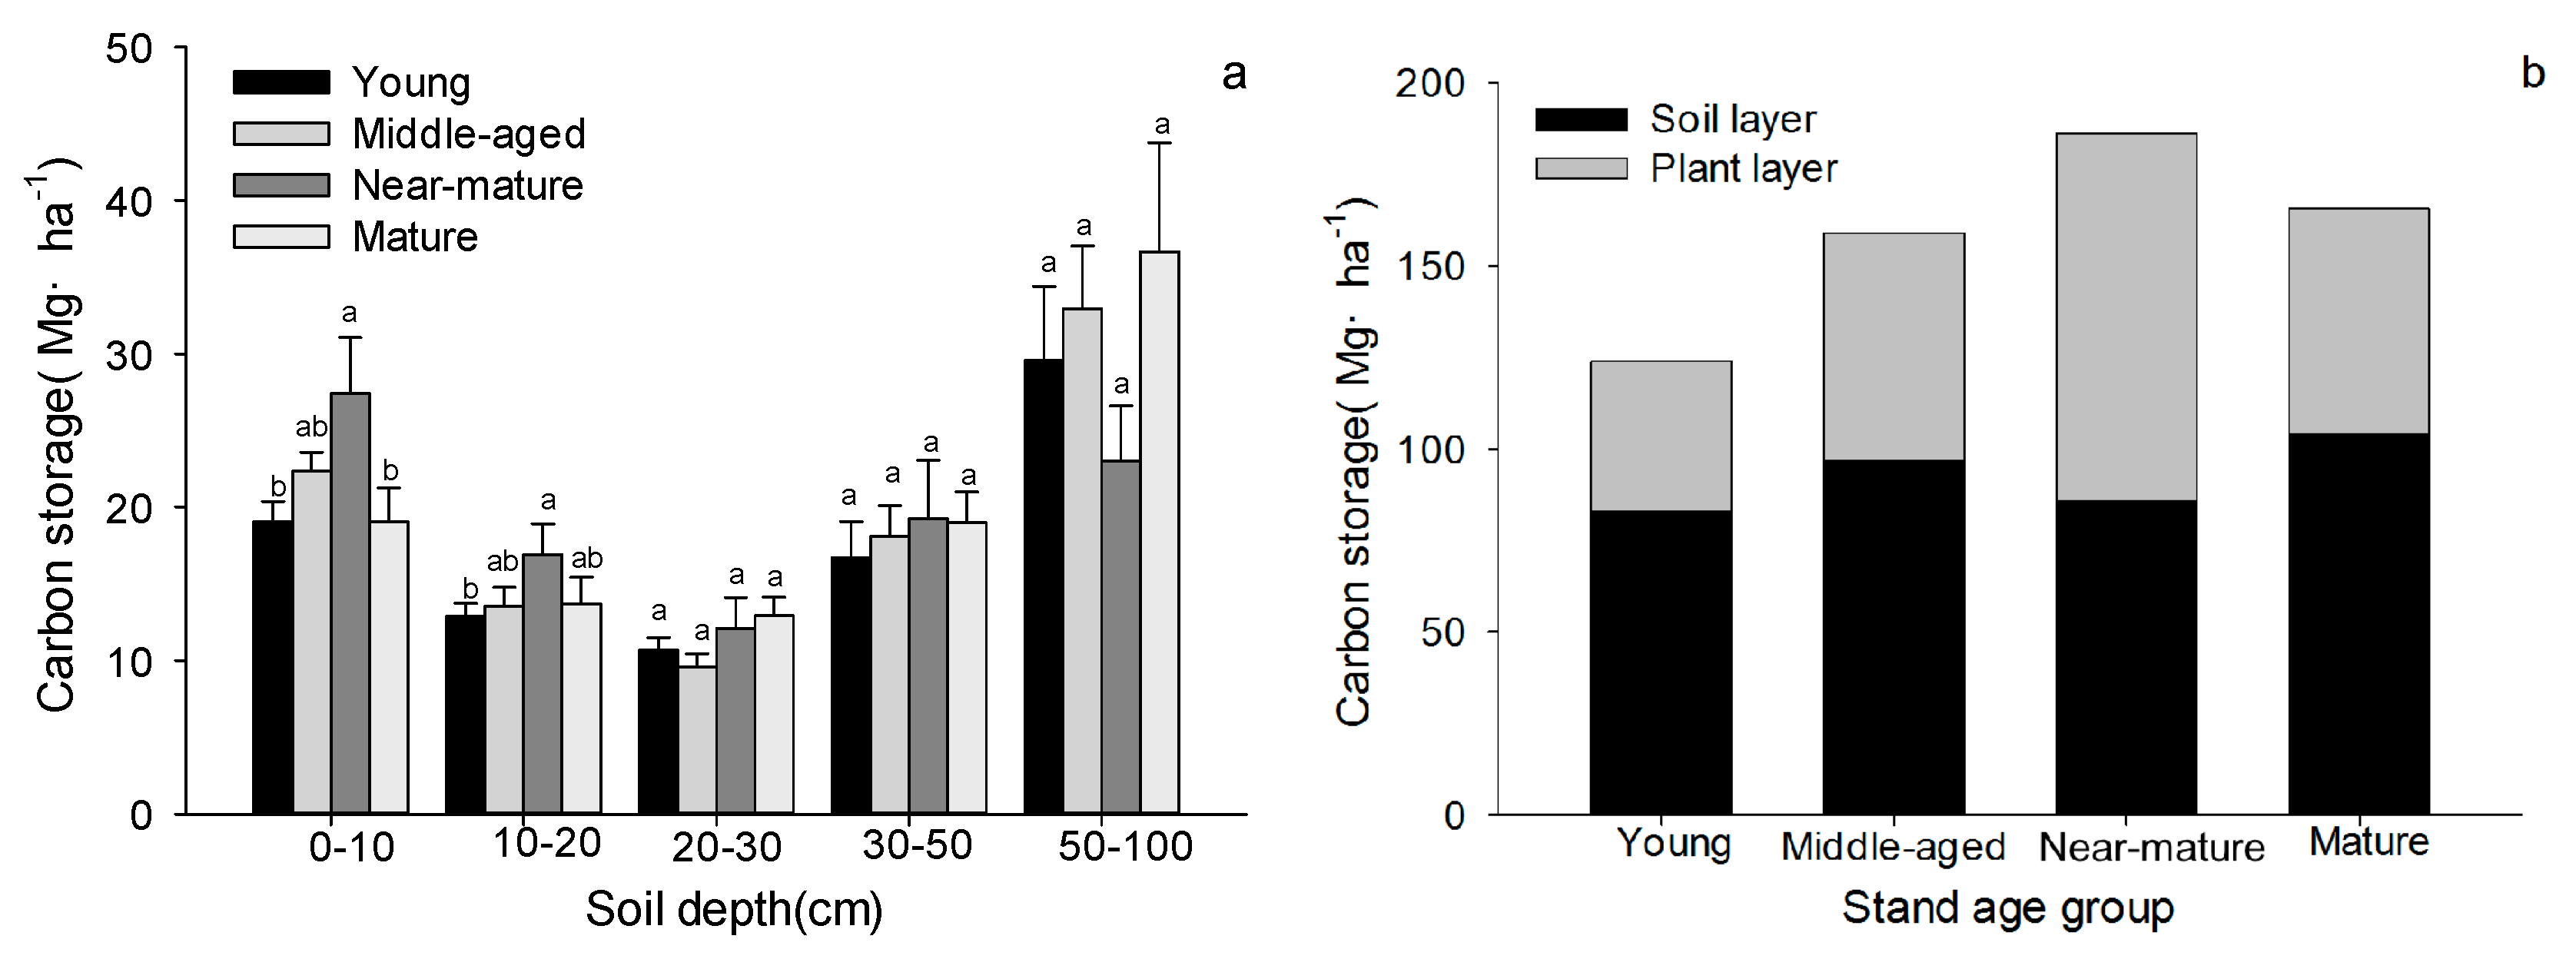
3.3. C Storage Allocation and the Relationships between Biomass and C, N, P Stoichiometry
4. Discussion
4.1. C, N, P Stoichiometric Characteristics in Quercus Variabilis Natural Secondary Forest
4.2. Biomass Allocation of Quercus Variabilis Natural Secondary Forest
4.3. Carbon Storage Allocation and Relationships between Biomass of Different Layers and C, N, and P Stoichiometry in Tree, Shrub, Herb and Litter Layer among Different Age Classes
5. Conclusions
Acknowledgments
Author Contributions
Conflicts of Interest
References
- Elser, J.J.; Dobberfuhl, D.R.; MacKay, N.A.; Schampel, J.H. Organism size, life history, and N:P stoichiometry. Bioscience 1996, 46, 674–684. [Google Scholar] [CrossRef]
- Elser, J.J.; Sterner, R.W.; Gorokhova, E.; Fagan, W.F.; Markow, T.A.; Cotner, J.B.; Harrison, J.F.; Hobbie, S.E.; Odell, G.M.; Weider, L.J. Biological stoichiometry from genes to ecosystems. Ecol. Lett. 2000, 3, 540–550. [Google Scholar] [CrossRef]
- Wang, Z.N.; Lu, J.Y.; Yang, M.; Yang, H.M.; Zhang, Q.P. Stoichiometric characteristics of carbon, nitrogen, and phosphorus in leaves of differently aged Lucerne (Medicago sativa) Stands. Front. Plant Sci. 2015, 6, 1–10. [Google Scholar] [CrossRef] [PubMed]
- Markovic, J.; Štrbanovi´c, R.; Cvetkovi´c, M.; An´ąelkovic, B.; Živkovi´c, B. Effects of growth stage on the mineral concentrations in alfalfa (Medicago sativa L.) leaf, stem and the whole plant. Biotechnol. Anim. Husb. 2009, 25, 1225–1231. [Google Scholar]
- Yang, Y.H.; Luo, Y.Q.; Meng, L.; Schädel, C.; Han, W.X. Terrestrial C:N stoichiometry in response to elevated CO2 and N addition: A synthesis of two meta-analyses. Plant Soil 2011, 343, 393–400. [Google Scholar] [CrossRef]
- Agren, G.I. The C:N:P stoichiometry of autotrophs-theory and observations. Ecol. Lett. 2004, 7, 185–191. [Google Scholar] [CrossRef]
- Aerts, R.; Chapin, F.S., III. The mineral nutrition of wild plants revisited: A re-evaluation of processes and patterns. Adv. Ecol. Res. 2000, 30, 1–67. [Google Scholar]
- Campo, J.; Gallardo, J.F.; Herna´ndez, G. Leaf and litter nitrogen and phosphorus in three forests with low P supply. Eur. J. For. Res. 2014, 133, 121–129. [Google Scholar] [CrossRef]
- Reich, P.B.; Oleksyn, J. Global patterns of plant leaf N and P in relation to temperature and latitude. Proc. Natl. Acad. Sci. USA 2004, 101, 11001–11006. [Google Scholar] [CrossRef] [PubMed]
- Dixon, R.K.; Trexler, M.C.; Wisniewski, J.; Brown, S.; Houghton, R.A.; Solomon, A.M. Carbon pools and flux of global forest ecosystems. Science 1994, 263, 185–190. [Google Scholar] [CrossRef] [PubMed]
- Mohanraj, R.; Saravanan, J.; Dhanakumar, S. Carbon stock in Kolli forests, Eastern Ghats (India) with emphasis on above ground biomass, litter, woody debris and soils. iForest 2011, 4, 61–65. [Google Scholar] [CrossRef]
- Xiang, W.H.; Zhou, J.; Ouyang, S.; Zhang, S.L.; Lei, P.F.; Li, J.X.; Deng, X.W.; Fang, X.; Forrester, D.I. Species-specific and general allometric equations for estimating tree biomass components of subtropical forests in southern China. Eur. J. For. Res. 2016, 135, 963–979. [Google Scholar] [CrossRef]
- Zheng, Y.; Zhao, Z.; Zhou, J.J.; Zhou, H.; Liang, Z.S.; Luo, Z.B. The importance of slope aspect and stand age on the photosynthetic carbon fixation capacity of forest: A case study with black locust (Robinia pseudoacacia) plantations on the Loess Plateau. Acta Physiol. Plant. 2011, 33, 419–429. [Google Scholar] [CrossRef]
- Bradford, J.B.; Birdsey, R.A.; Joyce, L.A.; Ryan, M.G. Tree age, disturbance history, and carbon stocks and fluxes in subalpine Rocky mountain forests. Glob. Chang. Biol. 2008, 14, 2882–2897. [Google Scholar] [CrossRef]
- Agren, G.I. Stoichiometry and nutrition of plant growth in natural communities. Annu. Rev. Ecol. Evol. Syst. 2008, 39, 153–170. [Google Scholar] [CrossRef]
- Binkley, D.; Stape, J.; Ryan, M.; Barnard, H.; Fownes, J. Agerelated decline in forest ecosystem growth: An individual-tree, stand-structure hypothesis. Ecosystems 2002, 5, 58–67. [Google Scholar] [CrossRef]
- Nilsson, M.C.; Wardle, D.A. Understory vegetation as a forest ecosystem driver: Evidence from the northern Swedish boreal forest. Front. Ecol. Environ. 2005, 3, 421–428. [Google Scholar] [CrossRef]
- Wu, J.; Liu, Z.; Wang, X.; Sun, Y.; Zhou, L.; Lin, Y.; Fu, S. Effects of understory removal and tree girdling on soil microbial community composition and litter decomposition in two eucalyptus plantations in South China. Funct. Ecol. 2011, 25, 921–931. [Google Scholar] [CrossRef]
- Gusewell, S. N:P ratios in terrestrial plants: Variation and functional significance. New Phytol. 2004, 164, 243–266. [Google Scholar] [CrossRef]
- Venterink, H.O.; van der Vliet, R.E.; Wassen, M.J. Nutrient limitation along a productivity gradient in wet meadows. Plant Soil 2001, 234, 171–179. [Google Scholar] [CrossRef]
- Venterink, H.O.; Wassen, M.; Verkroost, A.W.M.; de Ruiter, P.C. Species richness-productivity patterns differ between N-, P-, and K-limited wetlands. Ecology 2003, 84, 2191–2199. [Google Scholar] [CrossRef]
- Schaffers, A.P. Soil, biomass, and management of semi-natural vegetation. Part I. Interrelationships. Plant. Ecol. 2002, 158, 229–246. [Google Scholar] [CrossRef]
- Wu, T.G.; Dong, Y.; Yu, M.K.; Wang, G.G.; Zeng, D.H. Leaf nitrogen and phosphorus stoichiometry of Quercus species across China. Forest Ecol. Manag. 2012, 284, 116–123. [Google Scholar] [CrossRef]
- Guam, A.J.; Linera, G. Edge effect on acorn removal and oak seedling survival in Mexican lower montane forest fragments. New Forest 2006, 31, 487–495. [Google Scholar]
- Cao, Y.; Chen, Y.M. Biomass, Carbon and Nutrient Storage in a 30-Year-Old Chinese Cork Oak (Quercus Variabilis) Forest on the South Slope of the Qinling Mountains, China. Forests 2015, 6, 1239–1255. [Google Scholar] [CrossRef]
- Peichl, M.; Arain, M.A. Above-and belowground ecosystem biomass and carbon pools in an age-sequence of temperate pine plantation forests. Agric. Forest Meteorol. 2006, 140, 51–63. [Google Scholar] [CrossRef]
- Han, W.X.; Fang, J.Y.; Guo, D.; Zhang, Y. Leaf nitrogen and phosphorus stoichiometry across 753 terrestrial plant species in China. New Phytol. 2005, 168, 377–385. [Google Scholar] [CrossRef] [PubMed]
- Matzek, V.; Vitousek, M.P. N:P stoichiometry and protein: RNA ratios in vascular plants: An evaluation of the growth-rate hypothesis. Ecol. Lett. 2009, 12, 765–771. [Google Scholar] [CrossRef] [PubMed]
- Zeng, D.P.; Jiang, L.L.; Zeng, C.S.; Wang, W.Q.; Wang, C. Reviews on the ecological stoichiometry characteristics and its applications. Acta Ecol. Sin. 2013, 33, 5484–5492, (in Chinese with English abstract). [Google Scholar] [CrossRef]
- Zhang, H.Y.; Wu, H.H.; Yu, Q.; Wang, Z.W.; Wei, C.Z.; Long, M.; Kattge, J.; Smith, M.; Han, X.G. Sampling date, leaf age and roots size: Implications for the study of plant C:N:P stoichiometry. PLoS ONE 2013, 8, e60360. [Google Scholar] [CrossRef] [PubMed]
- Chapin, F.S., III. The mineral nutrition of wild plants. Annu. Rev. Ecol. Evol. Syst. 1980, 11, 233–260. [Google Scholar] [CrossRef]
- McJannet, C.; Keddy, P.; Pick, F. Nitrogen and phosphorus tissue concentrations in 41 wetland plants: A comparison across habitats and functional groups. Funct. Ecol. 1995, 9, 231–238. [Google Scholar] [CrossRef]
- Yang, Y.H.; Fang, J.Y.; Guo, D.L.; Ji, C.J.; Ma, W.H. Vertical patterns of soil carbon, nitrogen and carbon: Nitrogen stoichiometry in Tibetan grasslands. Biogeosci. Discuss. 2010, 7, 1–24. [Google Scholar] [CrossRef]
- Callesen, I.; Raulund-Rasmussen, K.; Westman, C.J.; Tau-Strand, L. Nitrogen pools and C:N ratios in well-drained Nordic forest soils related to climate and soil texture. Boreal. Environ. Res. 2007, 12, 681–692. [Google Scholar]
- Wang, S.Q.; Yu, G.R. Ecological stoichiometry characteristics of ecosystem carbon, nitrogen and phosporus elements. Acta Ecol. Sin. 2008, 28, 3937–3947, (in Chinese with English abstract). [Google Scholar]
- Ellison, A.M. Nutrient limitation and stoichiometry of carnivorous plants. Plant Biol. 2006, 8, 740–747. [Google Scholar] [CrossRef] [PubMed]
- Wu, T.G.; Yu, M.K.; Wang, G.G.; Dong, Y.; Cheng, X.R. Leaf nitrogen and phosphorus stoichiometry across forty-two woody species in Southeast China. Biochem. Syst. Ecol. 2012, 44, 255–263. [Google Scholar] [CrossRef]
- Peng, S.Z.; Zhao, C.Y.; Zheng, X.L.; Xu, Z.L.; He, L. Spatial distribution characteristics of the biomass and carbon storage of Qinghai spruce (Picea crassifolia) forests in Qilian Mountains. Chin. J. Appl. Ecol. 2011, 22, 1689–1694, (in Chinese with English abstract). [Google Scholar]
- Nock, C.A.; Caspersen, J.P.; Thomas, S.C. Large ontogenetic declines in intra-crown leaf area index in two temperate deciduous tree species. Ecology 2008, 89, 744–753. [Google Scholar] [CrossRef] [PubMed]
- Delzon, S.; Sartore, M.; Burlett, R.; Dewar, R.; Loustau, D. Hydraulic responses to height growth in maritime pine trees. Plant Cell Environ. 2004, 27, 1077–1087. [Google Scholar] [CrossRef]
- Simard, M.; Lecomte, N.; Bergeron, Y.; Bernier, P.Y.; Pare, D. Forest productivity decline caused by succession alpaludi-fication of boreal soils. Ecol. Appl. 2007, 17, 1619–1637. [Google Scholar] [CrossRef] [PubMed]
- Liu, Y.C.; Wu, M.Z.; Guo, Z.M.; Jiang, Y.X.; Wang, Z.Y.; Liu, B.D.; Zhu, X.L. Biomass and net productivity of Quercus variabilis forest in Baotianman Natural Reserve. Chin. J. Appl. Ecol. 1998, 9, 11–16, (in Chinese with English abstract). [Google Scholar]
- Wang, J.; Chen, Y.M.; Cao, Y.; Zhou, J.Y.; Hou, L. Carbon concentration and carbon storage in different components of natural Quercus wutaishanica forest in Ziwuling of Loess Plateau, Northwest China. Chin. J. Ecol. 2012, 31, 3058–3063, (in Chinese with English abstract). [Google Scholar]
- Cui, G.Y.; Chen, Y.M.; Cao, Y. Temporal-spatial pattern of carbon stocks in forest ecosystems in Shaanxi, northwest China. PLoS ONE 2015, 10, e0137452. [Google Scholar] [CrossRef] [PubMed]
- Cao, Y.; Chen, Y.M.; Jin, B.; Qu, M. Carbon storage and density of forest vegetation and its spatial distribution pattern in Shaanxi Province. J. Arid Land Resour. Environ. 2014, 28, 69–73, (in Chinese with English abstract). [Google Scholar]
- Zhou, Y.R.; Yu, Z.L.; Zhao, S.D. Carbon storage and budget of major Chinese forest types. Acta Phytoecol. Sin. 2000, 24, 518–522, (In Chinese with English Abstract). [Google Scholar]
- Nam, K.J.; Lee, W.K.; Kim, M.; Kwak, D.A.; Byun, W.H.; Yu, H.N.; Kwak, H.B.; Kwon, T.S.; Sung, J.H.; Chung, D.J.; Lee, S.H. Spatio-temporal change in forest cover and carbon storage considering actual and potential forest cover in South Korea. Sci. China Life Sci. 2015, 58, 713–723. [Google Scholar] [CrossRef] [PubMed]
- Boulmane, M.; Makhloufi, M.; Bouillet, J.P.; Saint-André, L.; Satrani, B.; Halim, M. Estimation du stock de carbone organique dans les Quercus ilex du Moyen Atlas Marocain. Acta Bot. Gallica 2010, 157, 451–467. [Google Scholar] [CrossRef]
- Bunker, D.E.; DeClerck, F.; Bradford, J.C.; Colwell, R.K.; Perfecto, L.; Phillips, O.L.; Sankaran, M.; Naeem, S. Species loss and aboveground carbon storage in atropical forest. Science 2005, 310, 1029–1031. [Google Scholar] [CrossRef] [PubMed]
- Li, T.; Liu, G. Age-related changes in carbon accumulation and allocation in plants and soil of a black locust forest on the loess plateau in Ansai County, Shaanxi Province of China. Chin. Geogr. Sci. 2014, 24, 414–422. [Google Scholar] [CrossRef]
- Zhang, H.; Song, T.Q.; Wang, K.L.; Du, H.; Yue, Y.M.; Wang, G.X.; Zeng, F.P. Biomass and carbon storage in an age-sequence of Cyclobalanopsis glauca plantations in southwest China. Ecol. Eng. 2014, 73, 184–191. [Google Scholar] [CrossRef]


| Components | Equation | R2 |
|---|---|---|
| Leaf | W = 0.012870 × D2.101 | 0.992 |
| Branch | W = 0.004734 × D2.984 | 0.983 |
| Stem | W = 0.055974 × D2.562 | 0.971 |
| Bark | W = 0.045820 × D2.104 | 0.984 |
| Roots | W = 0.083084 × D2.198 | 0.963 |
| Components | Factors | F (p) Value | |||||
|---|---|---|---|---|---|---|---|
| C | N | P | C:N | C:P | N:P | ||
| Tree layer | Stand age | 1.410 (0.241) | 4.993 (0.002) | 6.032 (0.001) | 4.548 (0.004) | 6.912 (0.000) | 1.651 (0.179) |
| Tree tissue | 46.139 (0.000) | 1003.615 (0.000) | 146.409 (0.000) | 159.632 (0.000) | 52.790 (0.000) | 55.657 (0.000) | |
| Stand age × Tree tissue | 6.518 (0.0000) | 2.420 (0.012) | 1.269 (0.256) | 2.635 (0.007) | 6.017 (0.000) | 4.872 (0.000) | |
| Shrub layer | Stand age | 0.497 (0.685) | 1.549 (0.204) | 1.911 (0.130) | 0.437 (0.727) | 0.774 (0.510) | 1.378 (0.251) |
| Shrub tissue | 30.194 (0.000) | 25.233 (0.000) | 5.135 (0.007) | 20.265 (0.000) | 5.148 (0.007) | 8.245 (0.000) | |
| Stand age × Shrub tissue | 1.096 (0.353) | 1.002 (0.394) | 0.672 (0.571) | 0.652 (0.583) | 0.868 (0.459) | 0.436 (0.728) | |
| Herb layer | Stand age | 1.946 (0.127) | 0.747 (0.526) | 0.261 (0.853) | 1.126 (0.342) | 0.891 (0.448) | 1.305 (0.277) |
| Herb tissue | 347.801 (0.000) | 200.72 (0.000) | 24.823 (0.000) | 0.021 (0.886) | 2.785 (0.098) | 6.583 (0.012) | |
| Stand age × Herb tissue | 0.457 (0.713) | 0.576 (0.632) | 3.092 (0.030) | 0.163 (0.921) | 1.592 (0.196) | 1.827 (0.147) | |
| Soil layer | Stand age | 1.028 (0.381) | 3.561 (0.015) | 27.906 (0.000) | 10.801 (0.000) | 9.846 (0.000) | 9.092 (0.000) |
| Soil depth | 76.843 (0.000) | 44.147 (0.000) | 3.559 (0.008) | 11.902 (0.000) | 28.427 (0.000) | 15.572 (0.000) | |
| Stand age × Soil depth | 1.038 (0.414) | 0.755 (0.696) | 0.382 (0.969) | 0.869 (0.579) | 0.836 (0.614) | 0.389 (0.967) | |
| Age class | Stand Density (tree·ha−1) | Single Tree Biomass (kg·tree−1) | Biomass Per Hectare (Mg·ha−1) |
|---|---|---|---|
| Young | 1807.89 ± 196.43 a | 53.22 ± 5.37 b | 86.03 ± 9.21 b |
| Middle-aged | 1717.35 ± 178.71 a | 93.36 ± 19.13 b | 133.7 ± 13.06 b |
| Near-mature | 808.16 ± 79.88 b | 243.89 ± 44.81 a | 215.01 ± 53.07 a |
| Mature | 574.98 ± 62.09 b | 248.66 ± 57.48 a | 138.35 ± 30.80 ab |
| Age Class | Tree | Shrub | Herb | Litter | Total | |||||
|---|---|---|---|---|---|---|---|---|---|---|
| Biomass (Mg·ha−1) | Percentage (%) | Biomass (Mg·ha−1) | Percentage (%) | Biomass (Mg·ha−1) | Percentage (%) | Biomass (Mg·ha−1) | Percentage (%) | Biomass (Mg·ha−1) | Percentage (%) | |
| Young | 86.03 ± 9.21 b | 88.53 b | 2.49 ± 0.33 bc | 3.59 a | 1.03 ± 0.13 ab | 1.33 a | 6.21 ± 0.79 a | 6.54 a | 95.77 ± 9.73 b | 100 |
| Middle-aged | 133.7 ± 13.06 b | 94.23 a | 1.39 ± 0.19 c | 1.22 b | 0.60 ± 0.09 c | 0.52 b | 5.42 ± 0.78 a | 4.02 b | 141.11 ± 13.19 b | 100 |
| Near-mature | 215.01 ± 53.07 a | 93.43 a | 6.87 ± 2.26 a | 3.41 ab | 0.67 ± 0.08 bc | 0.45 b | 3.64 ± 0.59 a | 2.71 b | 226.20 ± 52.36 a | 100 |
| Mature | 138.35 ± 30.80 ab | 91.94 ab | 3.80 ± 1.84 ab | 3.11 ab | 1.48 ± 0.30 a | 1.21 a | 4.98 ± 1.25 a | 3.73 b | 148.61 ± 31.25 ab | 100 |
| Age Class | Tree | Shrub | Herb | Litter | Plant | |||
|---|---|---|---|---|---|---|---|---|
| Leaf | Branch | Stem | Root | |||||
| Young | 1.39 ± 0.14 b | 3.95 ± 0.44 b | 21.82 ± 2.32 c | 10.55 ± 1.16 b | 1.07 ± 0.14 b | 0.28 ± 0.03 ab | 2.15 ± 0.24 a | 41.20 ± 4.19 b |
| Middle-aged | 2.04 ± 0.18 a | 7.17 ± 0.97 b | 34.80 ± 3.54 b | 15.40 ± 1.32 ab | 0.60 ± 0.08 b | 0.17 ± 0.02 c | 1.96 ± 0.26 a | 62.13 ± 6.00 b |
| Near-mature | 2.77 ± 0.64 a | 14.80 ± 4.12 a | 56.45 ± 14.14 a | 21.89 ± 5.15 a | 2.94 ± 1.00 a | 0.19 ± 0.02 bc | 1.36 ± 0.22 a | 100.40 ± 23.71 a |
| Mature | 1.78 ± 0.34 ab | 9.08 ± 2.34 ab | 31.99 ± 6.53 bc | 14.89 ± 3.01 ab | 1.56 ± 0.73 ab | 0.33 ± 0.05 a | 1.73 ± 0.40 a | 61.45 ± 12.28 b |
| Age Class | Biomass | C | N | P | C:N | C:P | N:P |
|---|---|---|---|---|---|---|---|
| Young | Tree | −0.507 * | 0.288 | 0.486 * | −0.349 | −0.496 * | −0.057 |
| Shrub | 0.594 ** | 0.542 ** | 0.466 ** | −0.486 * | −0.493 * | 0.059 | |
| Herb | −0.087 | −0.300 | −0.243 | 0.133 | 0.179 | 0.172 | |
| Litter | −0.652 ** | −0.215 | −0.289 | −0.410 * | −0.131 | −0.092 | |
| Middle-aged | Tree | 0.504 * | −0.355 | −0.251 | 0.39 | 0.351 | −0.173 |
| Shrub | −0.122 | −0.282 | 0.036 | 0.268 | −0.042 | −0.107 | |
| Herb | −0.074 | −0.321 | −0.582 * | 0.132 | 0.316 | 0.297 | |
| Litter | −0.487 * | −0.177 | 0.248 | −0.156 | −0.235 | −0.249 | |
| Near-mature | Tree | 0.523 | 0.608 | 0.446 | −0.608 | −0.464 | 0.386 |
| Shrub | 0.003 | −0.608 | −0.556 | 0.722 * | 0.770 * | 0.659 | |
| Herb | −0.047 | 0.115 | 0.113 | −0.063 | −0.213 | −0.093 | |
| Litter | −0.205 | −0.222 | −0.719 * | 0.074 | 0.743 * | 0.790 * | |
| Mature | Tree | −0.526 | 0.725 | −0.526 | −0.762 | −0.526 | 0.766 |
| Shrub | −0.049 | 0.601 | 0.559 | −0.52 | −0.465 | 0.506 | |
| Herb | −0.726 | 0.415 | −0.76 | −0.542 | 0.73 | 0.813 * | |
| Litter | −0.634 | 0.501 | −0.79 | −0.676 | 0.837 * | 0.663 |
© 2017 by the authors. Licensee MDPI, Basel, Switzerland. This article is an open access article distributed under the terms and conditions of the Creative Commons Attribution (CC BY) license (http://creativecommons.org/licenses/by/4.0/).
Share and Cite
Jiang, P.; Chen, Y.; Cao, Y. C:N:P Stoichiometry and Carbon Storage in a Naturally-Regenerated Secondary Quercus variabilis Forest Age Sequence in the Qinling Mountains, China. Forests 2017, 8, 281. https://doi.org/10.3390/f8080281
Jiang P, Chen Y, Cao Y. C:N:P Stoichiometry and Carbon Storage in a Naturally-Regenerated Secondary Quercus variabilis Forest Age Sequence in the Qinling Mountains, China. Forests. 2017; 8(8):281. https://doi.org/10.3390/f8080281
Chicago/Turabian StyleJiang, Peipei, Yunming Chen, and Yang Cao. 2017. "C:N:P Stoichiometry and Carbon Storage in a Naturally-Regenerated Secondary Quercus variabilis Forest Age Sequence in the Qinling Mountains, China" Forests 8, no. 8: 281. https://doi.org/10.3390/f8080281
APA StyleJiang, P., Chen, Y., & Cao, Y. (2017). C:N:P Stoichiometry and Carbon Storage in a Naturally-Regenerated Secondary Quercus variabilis Forest Age Sequence in the Qinling Mountains, China. Forests, 8(8), 281. https://doi.org/10.3390/f8080281