Abstract
The contribution of coarse woody debris (CWD) to forest carbon (C) and nitrogen (N) dynamics is poorly quantified. This study quantified total C and N content in CWD and estimated the decomposition rates of CWD at different decay stages in a 70-year-old naturally regenerated Korean red pine forest (Pinus densiflora S. et Z.). The N concentration in CWD varied among species and decay classes (from 0.15% to 0.82%), and exhibited a decreasing pattern in C:N ratios with increasing decay class. Total CWD amounts of 4.84 Mg C ha−1, dominated by pine logs (45.4%) and decay class III (40.0%), contained total N of 20.48 kg N ha−1, which was approximately nine times the N input from annual tree mortality. In addition, this study demonstrated that the decay constant rate k was 0.2497 for needle litter, whereas k values were 0.0438, 0.0693, 0.1054, and 0.1947 for red pine CWD of decay class I, II, III, and IV, respectively. The decay rates were significantly related to wood density, N concentration, and C:N ratio across the decay classes of CWD. The results suggest that the C:N ratio of CWD is a key factor affecting its decomposition.
1. Introduction
Coarse woody debris (CWD) and fine litter are critical components in forest carbon (C) and nitrogen (N) cycles [1,2]. CWD has been intensively examined because of its important role in forest C cycling [3,4,5]. However, CWD has been less studied in comparison to the contribution of fine litter to N and other nutrient cycles [6,7,8,9]. Global CWD contains approximately 36–72 Pg C, which may affect the total global forest C stock [10,11]. The CWD quantity and distribution is influenced by tree mortality and decomposition rate, which vary with climate, site characteristics, tree species, age, and disturbance dynamics [1,2,3,4,12,13,14,15].
Korean red pine (Pinus densiflora Sieb. et Zucc.) forests occupy the largest percentage of forested areas, 42.6% of the total forest stock, in South Korea [16]. The amount of CWD and its decomposition in pine forests are of interest because of the transient increase in CWD stock resulting from management practices such as thinning [17], from increased self-thinning and tree mortality in unmanaged mature forests [15], and from disease and infestation like severe pine wilt disease in the East Asian region [18,19,20,21]. In middle-aged or mature Korean red pine forests, intensive silvicultural practices might be required to enhance C sequestration and nutrient-use efficiency. Although previous studies in mature Korean red pine forests have quantified total ecosystem C and N pools, and they relate to CWD [22], variation in C and N concentration in CWD among different decay classes has not been addressed.
CWD generally contains a relatively low N concentration compared to that in fine leaf litter; however, CWD stores nutrients on a long-term basis owing to its slow decomposition [2]. Recent studies on the factors affecting C and N fluxes from CWD during the decomposition process have increased the accuracy in quantifying C and nutrient content of CWD [4,23,24]. Nonetheless, much uncertainty remains concerning the large variation in CWD in terms of C and N content across sizes, species, and decay classes during long-term decomposition processes. Among the factors affecting C and N content, decay class has been considered better measure to define the stages of decay of CWD. However, uncertainties in determining CWD decay class often occur because decay classes are assigned in the field based on tactile and visual criteria [4].
The physical and chemical properties of CWD, such as species-specific wood density and nutrient concentrations, according to decay classes might reflect the decay stage of CWD as it transitions between decay classes [4,25,26]. In addition, the C:N ratio might provide traceable information about decomposition rates of CWD at different decomposition stages because N concentration in CWD typically increases over time, in contrast to the little difference in C concentration [2,23,25,26,27]. In fact, the C:N ratio is one of the most important controlling factors that account for the variance in the decay rates of fine litter [8,9,28]. Further, it is an indicator of the elemental composition of organisms and ecosystems [29]. However, only a few studies have reported the C:N ratio of CWD in an effort to understand decomposition processes for CWD [25,26,30,31]. Moreover, to the best of our knowledge, no study on the comparison of decomposition rates of CWD at different decomposition stages has been reported.
The present study aimed to quantify the amount and distribution of C and N stocks in CWD accurately and to understand the CWD decay process better according to decay classes in a naturally regenerated Korean red pine forest. The objectives were (i) to investigate the variations in CWD properties, such as wood moisture content, wood density, and C and N concentrations according to decay classes and species; (ii) to estimate the decay rates of CWD at different decay classes for red pine and deciduous species; and (iii) to examine the relationships between the decay rates and the CWD properties to evaluate the hypothesis that the C:N ratio will be an indicator for the estimation of decomposition rates. In addition, decay rates and properties of red pine needle litter were investigated to clarify the contribution of CWD to ecosystem C and N processes in comparison with red pine needle litter.
2. Materials and Methods
2.1. Study Forest
This study was conducted in a 65- to 75-year-old Korean red pine forest located in the Gwangneung Experimental Forest (37°47′01″ N, 127°10′37″ E, 410–440 m above sea level) near Seoul, South Korea. This study site represented a mature Korean red pine forest that naturally regenerated following a clearcut in 1912. The pine forest understory consisted of broadleaved tree species dominated by oak (Quercus species). The forest soils consisted of silt-loams underlain by bedrock of granite gneiss. The forest floor consisted of approximately 5–10 cm of litter and mull humus layer, and all study plots had a southwestern aspect. Six 20 m × 20 m plots were established in September 2006. Stand density and basal area were 675 trees ha−1 and 40.3 m2 ha−1 for red pine, and 613 trees ha−1 and 4.4 m2 ha−1 for understory deciduous species (Table S1), respectively. Characteristic understory species were Q. mongolica (Fich.), Q. variabilis (Blum.), Carpinus laxiflora (Sieb. et Zucc.), C. cordata (Blum.), Styrax obassia (Sieb. et Zucc.), Acer pseudosieboldianum, and Fraxinus rhynchophylla (Hanc.). The mean annual air temperature and precipitation at the study site from 2006 to 2014 were 11.4 °C and 1504 mm, respectively (Korea Meteorological Administration). The majority of precipitation (70%) occurred between June and August. Further details about the site are provided in a previous study conducted at this study site [22].
2.2. Tree Morality, CWD Volume and Mass
The annual tree mortality was estimated by dead tree tallies via tree census in the six 20 m × 20 m permanent plots from 2006 to 2014 (Table S1) and biomass regression equations for red pine and oak species [22]. To estimate total CWD volume and mass within the six permanent plots, we used a fixed area plot sampling method [32] in January 2007, April 2008, and February 2009. All pieces of CWD with a base diameter greater than 5 cm at the break point were tagged and their species, type (stump, snag, and downed dead wood), diameters (base, middle, and top), and length were recorded in the field. The decay class was also classified into five different levels (I–V) according to a CWD decay classification system [33], which was modified from the original criteria [34,35]. The classification system classifies CWD by the presence or physical condition of the bark, as well as by the degree of twig retention, structural integrity, and root penetration. The initial total volume of logs and stumps, estimated in 2007, was calculated using Newton’s formula [32], which required length and diameter measurements at the base, middle, and top positions of the CWD:
where V is volume, L is length, and Ab, Am, and At are the areas of the base, middle, and top of the logs and stumps, respectively. The initial volume of snags was calculated using the following formula [36]:
where V is volume, BA is the basal area, and H is the height of snags. To determine the wood density of CWD, cross-sections (for those greater than 10-cm thickness) from one side at the end of each CWD were sampled from the same tagged CWD in every year. In the laboratory, the diameter of each sample was measured at three points (maximum and minimum diameter at the two ends and that in the middle) using digital calipers in order to determine the volume of each sample. The wood density of CWD was calculated by dividing the oven-dry weight by the volume of the sample before oven-drying. In addition, the moisture content of CWD was calculated from the weight measured right after sampling the cross-section from fields and that after oven-drying. The wood density of CWD was used to convert CWD volume into total CWD mass.
V = L × (Ab + 4Am + At)/6
V = BA × H × 0.5
2.3. Decomposition of CWD and Needle Litter
To determine mass loss rates of CWD of decay class I–IV over 2 years from January 2007 to February 2009, all CWD logs for pine and deciduous species in the six plots were used. In addition, to determine the mass loss rates of needle litter using a litter bag incubation method, fresh pine needle litter was collected at each site in October 2006. The litter decay rates determined by the litterbag method could be affected by hindering the activities of soil fauna on litter decay [37]. We assumed that a mesh size of 1 mm2 would be optimal for taking faunal activity into account and reducing loss of fragmented particles from the bags. A total of 180 litterbags (6 plots × 5 replicates × 6 retrieval times) made of 30 cm × 30 cm polypropylene fabric containing 10 g of litter were placed on the forest floor and collected every 3 or 6 months over 2 years [38]. The decay constant rate (k) values of the CWD and needle litter were calculated using a single exponential decay model:
where M0 is the initial mass of CWD or needle litter, Mt is the mass of CWD or needle litter in year, and t is the year. The M0 and Mt of CWD were calculated by multiplying the initial volume of CWD logs measured in 2007 by the wood density of the cross-sections sampled from the same CWD logs at 2007, 2008, and 2009, respectively.
k = −ln (Mt/M0)/t
2.4. Carbon and N Concentrations
We measured C and N concentrations in CWD logs in different decay classes for pine and deciduous (oak) species as a representative dominant canopy and understory tree species, respectively. For the determination of CWD, we used log samples of approximately 10 cm in diameter for each decay class of red pine and oak (n = 6), except for two snag samples of decay class I of red pine, owing to the lack of log samples. The C and N concentrations in oak species were used for a few unclassified deciduous CWD samples because oak species comprised most of the deciduous CWD. The samples were carefully brushed to remove soil before oven-drying at 65 °C. The dried samples were ground by mills, and the C and N concentrations were determined using a macro elemental analyzer (vario MACRO, CN elementar Analysensysteme GmbH, Langenselbold, Germany). The total C and N contents in the CWD were estimated by multiplying the C and N concentrations for a given decay class by the respective CWD mass. In addition, we used the fine litter production data measured from 2007 to 2009 at this same study site to compare the measurements of CWD to those of fine litter. Fine litter consisted of needles, broadleaves, branches (and twigs) with a base diameter smaller than 5 cm, barks, and miscellaneous parts (e.g., cones and very fine fragments) (Tables S2 and S3, See notes in Figure S1 for methodological details).
2.5. Statistical Analysis
The spatial variability in the fine litter components and CWD examined during the study was assessed using the coefficient of variation (CV), which is calculated by dividing the standard deviation by the mean of the six plots. A one-way analysis of variance (ANOVA) was used to test for the effects of decay class on moisture, woody density, C and N concentrations, and the C:N ratio of CWD for red pine and deciduous species. Tukey’s honest significant different (HSD) tests were used to analyze significant differences in the variables among CWD decay classes and among fine litter components. We tested the relationships between the estimated k value and variables using Pearson’s correlation coefficient, and then linear regressions were used to describe the relationships between the k values and variables, including wood density, N concentration, and C:N ratio. The significance level was set at P = 0.05, and all statistical analyses were performed using version 12.2 of the JMP Pro software (SAS Institute Inc., Cary, NC, USA) [39].
3. Results
3.1. Tree Mortality and CWD Input
Annual tree mortality (Mg ha−1 year−1) ranged from 0 to 5.75 over the eight-year span, 2007–2014, with a mean mortality of 1.18 for red pine and 0.24 for deciduous species (Figure 1a). The mortalities accounted for 0.76% and 1.10% of aboveground biomass for red pine and deciduous species, respectively, with the highest tree mortality occurring in 2007. New standing dead trees were not observed in 2009 and 2010, but they were observed for both red pine and deciduous trees from 2012 to 2014. Annual tree mortality was not correlated with annual mean temperature or precipitation (Pearson’s correlations, P > 0.05). There were no significant relationships among the inter-annual variation of other biotic factors (e.g., basal area, biomass, and biomass increment).
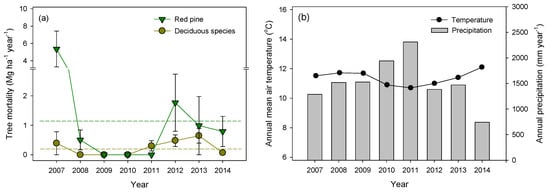
Figure 1.
Inter-annual variation in (a) tree mortality for red pine and deciduous trees and (b) annual mean air temperature and precipitation from 2007 to 2014 in a naturally regenerated Korean red pine forest. The dotted lines in (a) denote the mean of the annual inputs. The values represent mean ± one standard error (n = 6).
3.2. Carbon and N Concentrations
There were significant differences in moisture content and wood density of CWD for pine species among decay classes (ANOVA, P < 0.001, Figure 2a,c). A significant difference was not observed in moisture content of deciduous CWD (Figure 2b), but there was a significant difference in wood density among decay classes (Figure 2d, Table S4). The CWD moisture content had a positive relationship with decay class (Figure 2a,b), whereas wood density had a negative relationship with decay class (Figure 2c,d). The moisture content of CWD was correlated with wood density across all data (R = −0.39, P < 0.001). There was no significant effect of species or size on either moisture content or wood density.
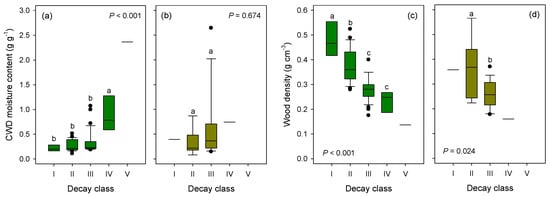
Figure 2.
Moisture content and wood density of coarse woody debris (CWD) logs according to decay class for (a,c) red pine and (b,d) deciduous species in a naturally regenerated Korean red pine forest in 2007. The box plots present the median, 95% confidence interval, and minimum and maximum values. A different letter indicates significant differences among decay classes within species (Tukey’s HSD, P < 0.05). (See supplementary Table S4 for the number of samples and values).
C concentration of CWD statistically differed (ANOVA, P < 0.0001) among decay classes of CWD for pine species. Specifically, C concentration in decay class I was higher than those in other decay classes for pines, whereas it did not differ among decay classes for deciduous species (Figure 3a). The C concentration in CWD for pine and deciduous (oak) species ranged from 48.8 to 51.3% and 48.5 to 50.9%, respectively (Table S4). Concomitantly, the N concentration in red pine CWD was associated with decay class (ANOVA, P < 0.001, Figure 3b). The N concentration increased with increasing decay classes for the red pine CWD. Specifically, N concentration for decay class III and IV (0.68% and 0.82%, respectively) were much higher in deciduous species than in red pine (0.24% and 0.42%, respectively) (Table S4).
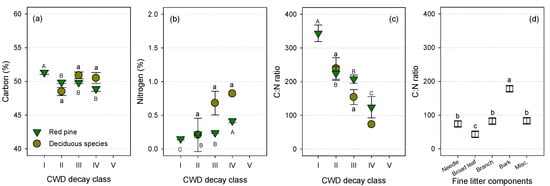
Figure 3.
Variations in (a) C and (b) N concentrations, (c) C:N ratio of coarse woody debris (CWD) logs according to decay classes I–IV for red pine (green triangles) and deciduous (yellow circles) species, and (d) C:N ratio of fine litter components (open squares) in a naturally regenerated Korean red pine forest in 2007. The values represent the mean ± one standard error (n = 6 for CWD, n = 18 for fine litter). Different capital or small letters indicate significant differences (a–c) among decay classes within a species and (d) among the fine litter components (Tukey’s HSD, P < 0.05). (See supplementary Tables S3 and S4 for the values).
The C:N ratios varied among CWDs of different decay classes for both species (ANOVA, P < 0.001, Figure 3c), and the C:N ratios varied among the fine litter components (ANOVA, P < 0.001, Figure 3d, Tables S2 and S3). The mean C:N ratio (195.3) was higher for CWD than for fine litter (92.1, Tukey’s HSD, P < 0.001). The C:N ratios ranged from 73.2 to 343.6 for CWD, whereas the ratios ranged from 43.2 to 178.2 for the fine litter. This clearly indicates a decreasing pattern of the C:N ratio with increases in decay class (Figure 3c). The C:N ratio for broadleaves (43.2 ± 0.9) was the lowest among all the fine litter components in fall, whereas that for deciduous CWD in decay class IV (73.2) was the lowest among the CWDs studied (Tukey’s HSD, P < 0.001, Tables S3 and S4). There was no significant difference in the C:N ratio between red pine and deciduous species within the same decay class (Figure 3c).
3.3. Distribution, C and N Contents of CWD
The total number of pieces of CWD was 546 pieces ha−1. The number, diameter, volume, and distributions of CWD according to the type (stump, snag, and log) and decay class (I–IV) for each species have been provided in Table 1 and Figure S2. The pine CWD of logs comprised the largest proportion (54.2%) of the total CWD volume, whereas the deciduous CWD of all types comprised only 5.2%, although they accounted for 29.8% of the total CWD pieces (Table 1). The pine CWD of decay class II and III comprised the proportion of 24.0% and 58.1% of the total CWD volume, respectively (Table 1). The coefficient of variation (CV) was 30.5% for CWD at the six plots and was much greater than those of fine litter, which were 4.1% for needles, 11.7% for broadleaves, 7.3% for branches, 5.1% for barks, and 4.8% for miscellaneous parts.

Table 1.
The number, mean diameter, volume, and percentile distributions of coarse woody debris (CWD) according to the species, type, and decay class in a naturally regenerated Korean red pine forest in 2007. The numbers represent the mean ± one standard error (n = 6).
The C and N content from annual tree mortality rate were 0.72 ± 0.21 Mg C ha−1 and 2.28 ± 0.01 kg N ha−1 (Table 2). Mean total CWD mass was 9.29 Mg ha−1 and 0.34 Mg ha−1 for red pine and deciduous species, respectively, in years 2007–2009 (Table 2). The total CWD mass accounted for 5.7% of live aboveground mass 167.5 Mg ha−1 in 2006 (Table S1). The total mass of CWD contained 4.84 Mg C ha−1 and 20.48 kg N ha−1 (Table 2). Red pine CWD of decay class I to III comprised the majority (93.8%) of total C content. The red pine CWD of decay class III contributed to 39.7% and 44.0% of total C and N content, respectively.
Table 2.
Mean biomass, and C and N content from fine litterfall and coarse woody debris (CWD) in a naturally regenerated Korean red pine forest in years 2007–2009. The numbers represent the mean ± one standard error (n = 6) and the numbers in parentheses are the percentage of the components relative to the total biomass, and C and N content.
3.4. Mass Loss Rates of CWD and Needle Litter
The decomposition processes were different between fresh needle litter and CWD of decay class I (Figure 4a,f). The mean mass loss rate (MLR) for 783 days was 43.3% for pine needle litter and 8.6%, 12.9%, 18.4%, and 32.1% for CWD of decay class I, II, III, and IV, respectively (Figure 4). There was no difference in MLR between red pine and deciduous species within the same decay classes (ANOVA, P = 0.324). The MLR for red pine CWD was significantly higher in decay class IV than in decay class I and II (Tukey’s HSD, P = 0.012), whereas there was no significant difference among decay classes for deciduous species. The k value (year−1) of needle litter during the decomposition period was 0.2497 ± 0.0141 (R2 = 0.93), whereas those for red pine CWD of decay class I were 0.0438 ± 0.0426 (R2 = 0.38, Figure 4a). The k values for all red pine and deciduous CWDs were 0.0968 ± 0.0140 and 0.1233 ± 0.0226 (Figure 4e,i), respectively.
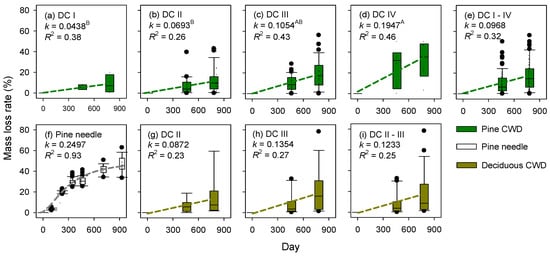
Figure 4.
Changes in mass loss rate of (a–e) coarse woody debris (CWD) of red pine; (f) fine needle litter; and (g–i) deciduous CWD according to decay class (DC) in a naturally regenerated Korean red pine forest. Box plots present the median, 95% confidence interval, and minimum and maximum values. The decay constant k values and R2 were reported for each decay class (see the “Methods” section for details). The k values with different superscripted letters in (a–d) differed significantly among decay classes for red pine CWD (Tukey’s HSD, P = 0.0117).
The relationship between the decay rate (k) and CWD wood density was significant (P = 0.006, R2 = 0.87, Figure 5a). In addition, the k value was significantly positively correlated with N concentration (Figure 5b). The N concentrations for red pine and for across both species accounted for 92% and 67%, respectively, of the variation in the decay rates (P < 0.05). However, the k value was not significantly correlated with the C concentration (P = 0.095, R2 = 0.81). On the other hand, the k value was negatively correlated with the C:N ratio (Figure 5c). The C:N ratios for red pine and for across both species accounted for 91% and 89%, respectively, of the variation in the decay rates (P < 0.05).
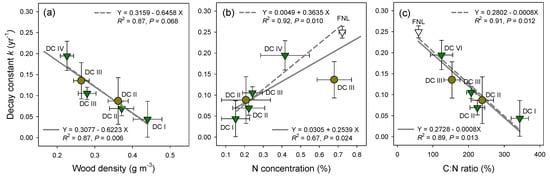
Figure 5.
The relationship between the decay constant k and (a) wood density; (b) N concentration; and (c) C:N ratio of fine needle litter (FNL, open triangle) and coarse woody debris of red pine (green triangles) and deciduous species (yellow circles) according to decay classes (DC) I–IV in a naturally regenerated Korean red pine forest. The values represent mean ± one standard error. The solid and dotted lines denote the linear regressions for across both species and for only red pine, respectively.
4. Discussion
4.1. Variations in N Concentration of CWD
In this Korean red pine forest, N concentrations in CWD differed depending on species and decay classes, in contrast to the little difference in C concentrations (Figure 3). N concentration of deciduous CWD of decay class III and IV contained much higher N concentrations than did those of red pine. Differences in nutrient concentrations in CWD among species have been reported for other forests [2,24,40]. However, no studies have examined N concentrations through decay classes of red pine CWD. Our results showed that the N concentration of CWD increases with increasing decay class, which is consistent with previous studies on decay class and time [13,25]. The increase in N concentration of CWD may not only be driven largely by C loss, but might also be influenced by microbial N fixation, nutrient immobilization, and input into decaying CWD via throughfall, including N deposition through the decay time [2,24]. Additionally, N concentration in fresh CWD of decay class I was lower than that of the fine woody litter (branch) (Figure 3, Table S3), which was consistent with the trends observed in previous studies [24,41]. Conversely, total CWD C inputs estimated using 50.0% C concentration might be slightly underestimated compared to the values based on variation (48.5% to 51.3%), but it did not differ from the actual value because of the non-significant differences within the narrow range of C concentrations. Consequently, the range in N concentrations of CWD among the decay classes and species (0.15% to 0.82%) should be taken into consideration with concurrent decrease in CWD density over time while calculating total N pools in CWD.
4.2. C and N Contents of CWD
In this 70-year-old natural red pine forest, the total amount of CWD of 4.84 Mg C ha−1, which was much greater than 0.5 Mg C ha−1 in a 55-year-old managed Korean red pine forest with basal area of 53.1 m2 ha−1 [17] and the average value of 1.76 Mg C ha−1 for dead wood, which was estimated based on the 5th National Forest Inventory in South Korea [42], and similar to the average value of 8.62 Mg ha−1 of downed CWD for all inventoried US states [3]. In our study sites, the mean annual tree mortality (0.72 Mg C ha−1) was in the range from 0.2 to 0.8 Mg C ha−1 of other temperate forests [43] and the annual C input from the tree mortality was ca. 19% of annual total fine litter input to the forest floor. This proportion fell within the wide range of 3–73% of various-aged northern coniferous forests [2]. When fine branch, bark, and cones are considered as woody debris, annual C input of 2.35 Mg C ha−1 from the fine and coarse woody debris to the forest floor is similar to 2.18 Mg C ha−1 from leaf litter (Table 2). In Korea, there were nationwide outbreaks of pine wood nematode in 2005 and 2013; however, occurrence of pine wilt disease was not explicitly identified in the study site. Therefore, they are assumed to be resulting from processes in forest maturation such as self-thinning and accidental mortality because the forest floor of natural middle-aged or mature stands, not subjected to forest management practices, would have more input from woody detritus owing to tree mortality or self-thinning in high-density stands than those in the other managed stands or plantations [15,44,45]. However, the amount of CWD was less than 12.56 Mg ha−1 in a 55–65-year-old secondary natural forest of Chinese red pine (P. tabulaeformis) [46]. In addition, the 5.7% of the CWD ratio (ratio of dead to live wood mass) was relatively small compared to the range from 2.8% to 126.6% in other pine ecosystems, including stands disturbed by fire or insect damage [12]. In regard to the contribution of CWD to N input in this study site, annual N input from CWD caused by annual tree mortality comprised approximately 11.1% of total N stock in CWD, and comprised less than 3.5% of 65.65 kg N ha−1 year−1 from total fine litterfall, indicating less contribution of CWD to N cycles than fine litter. However, the forests have a potential for the rapid increase in the amount of CWD following tree mortality, because the red pine forests have been widely threatened by severe pine wilt disease across the Eastern Asian countries [20,21].
4.3. Decomposition of Fine Litterfall and CWD
In this red pine forest, there are large differences in the decomposition process between needle litter and CWD. Decay rate k at the same study site was 0.2497 for needle litter and 0.0438 for red pine CWD at decay class I (Figure 4a,f), indicating the decomposition rate of fresh needle litter to be nearly six times higher than that of fresh CWD. In general, differences in k values among various litter types are mainly caused by the variance in litter quality, such as tannin, lignin, and nutrient concentrations [8,9]. In addition, we found the decay rate for red pine CWD was faster in decay class IV (k = 0.1947) than in decay class I (k = 0.0438), indicating that CWD with high-wood density and a high C:N ratio decomposed slowly.
In this red pine forest, the CWD k value of 0.0968 at the stand level was within the range of 0.0040–0.1570 from subtropical to boreal pine forests [25,26,47,48,49,50,51]. This relatively high value appears to be reasonable for our temperate pine forest, which had relatively higher mean annual temperature and mean annual precipitation under the Asian monsoon climate. Structural and chemical differences in the quality of CWD, such as wood density and the C:N ratio, could cause larger variations in decomposition rates across all species [4,8]. Therefore, the CWD quality related to plant species traits should be taken into consideration to understand the global patterns of decay rates [10,11]. In fact, we demonstrated that the C:N ratio could be one of the most important controlling factors explaining the decomposition rates across leafy litter and coarse woody litter within a small-scale study site (R2 = 0.89, Figure 5). This result is consistent with the patterns in the previous global-scales studies of fine litter decomposition [8,9]. In addition, our results showed the relationships between the k value and both wood density and C:N ratio are not species specific, while the relationships with N are species specific (Figure 5). Therefore, among species, further research is necessary to clarify the species-specific relationships between C or N concentrations and k value.
Our study also provided the decay class-specific wood density, which was negatively correlated with CWD moisture content because low wood density could enhance the infiltration of moisture into wood structures, and accelerate the decomposition processes [30,52]. Increased moisture content at high decay class can enhance the macrofauna or microbial activity within optimal moisture levels and may contribute to faster decomposition of litter [9], despite increases in chemically recalcitrant structure of tissues, such as lignins and polyphenols over time [25]. The CWD decomposition processes are affected by their position associated with moisture content and microbial factors, such as fungal species composition, biomass, and activity [27,53]. Therefore, further studies on decomposition rate should examine the effect of different types/positions of CWD, such as stumps and snags. Nevertheless, the parameterizations of k values and CWD quality depending on decay classes would be applicable to modeling their stand-level, and hence the complex ecosystem-level, decomposition rates at specific development stages with information on the distribution of CWD at distinct decay phases and various decay classes [54].
5. Conclusions
Our results indicated that the range in N concentration among the decay classes and species for CWD (0.15% to 0.82%) should be considered when total N inputs to the forest floor litter are calculated. In addition, the decay rates across CWD with different decay classes and needle litter were strongly related to their C:N ratio. The class-specific decay rates with parameterizing such factors as wood density and C:N ratio of CWD, will contribute to understanding the stand-level decomposition rates and improving C and N dynamic models of CWD. In this Korean red pine forest, the total CWD amount was 4.84 Mg C ha−1, with various decay classes, as long-term C and nutrient sinks, it contained a total N of 20.48 kg N ha−1, which was approximately nine times the annual tree mortality-induced N input to the forest floor. Despite lower N concentration and slower decay rates of CWD compared to fine litter, CWD contributed to C and N inputs as stabilized pools, especially if tree mortality increases throughout this forest. Because of the lack of data on CWD under temperate monsoon climates in Asian regions, this study will contribute to accurate quantification and modeling of C and N dynamics in pine forest ecosystems.
Supplementary Materials
The following are available online at www.mdpi.com/1999-4907/8/6/214/s1. Table S1: Characteristics of 70-year-old naturally regenerated Korean red pine stands at the Gwangneung Experimental Forest in central Korea in 2006 and 2014; Table S2: Statistical results of a two-way ANOVA for the effects of season, components, and their interactions on C and N concentrations, and C:N ratio in fine litter in 2008; Table S3: C and N concentrations of fine litter components depending on season in a naturally regenerated Korean red pine forest in 2008; Table S4: Wood density (WD), moisture content (CMC), C and N concentrations, and C:N ratio of coarse woody debris (CWD) logs according to decay classes in a naturally regenerated Korean red pine forest in 2007; Figure S1: Seasonal variation in fine litterfall components from 2007 to 2009 in a naturally regenerated Korean red pine forest; Figure S2: Distribution of coarse woody debris logs according to decay class and diameter size in a naturally regenerated Korean red pine forest.
Acknowledgments
This study was funded by the National Research Foundation of Korea (Grant No. R01-2006-000-10863-0, A3 Foresight Program: Grant No. A307-K001). We thank Heo S.J., Lee S.K., Lee A.R., Yi K., Yang A.R. and Han S.H. for their experimental support.
Author Contributions
Noh N.J. and Son Y. conceived and designed the experiments; Noh N.J. and Yoon T.K. performed the experiments; Noh N.J. analyzed the data; Son Y. contributed reagents/materials/analysis tools; Noh N.J., Yoon T.K., Kim R.-H., Bolton N.W., Kim C. and Son Y. wrote the paper.
Conflicts of Interest
The authors declare no conflict of interest.
References
- Harmon, M.E.; Franklin, J.F.; Swanson, F.J.; Sollins, P.; Gregory, S.V.; Lattin, J.D.; Anderson, N.H.; Cline, S.P.; Aumen, N.G.; Sedell, J.R.; et al. Ecology of coarse woody debris in temperate ecosystems. Adv. Ecol. Res. 1986, 15, 133–302. [Google Scholar]
- Laiho, R.; Prescott, C.E. Decay and nutrient dynamics of coarse woody debris in northern coniferous forests: A synthesis. Can. J. For. Res. 2004, 34, 763–777. [Google Scholar] [CrossRef]
- Woodall, C.W.; Walters, B.F.; Oswalt, S.N.; Domke, G.M.; Toney, C.; Gray, A.N. Biomass and carbon attributes of downed woody materials in forests of the United States. For. Ecol. Manag. 2013, 305, 48–59. [Google Scholar] [CrossRef]
- Russell, M.B.; Fraver, S.; Aakala, T.; Gove, J.H.; Woodall, C.W.; D’Amato, A.W.; Ducey, M.J. Quantifying carbon stores and decomposition in dead wood: A review. For. Ecol. Manag. 2015, 350, 107–128. [Google Scholar] [CrossRef]
- Magnússon, R.Í.; Tietema, A.; Cornelissen, J.H.C.; Hefting, M.M.; Kalbitz, K. Sequestration of carbon from coarse woody debris in forest soils. For. Ecol. Manag. 2016, 377, 1–15. [Google Scholar] [CrossRef]
- Liski, J.; Nissinen, A.; Erhard, M.; Taskinen, O. Climatic effects on litter decomposition from arctic tundra to tropical rainforest. Glob. Chang. Biol. 2003, 9, 575–584. [Google Scholar] [CrossRef]
- Moore, T.R.; Trofymow, J.A.; Prescott, C.E.; Fyles, J.; Titus, B.D.; CIDET Working Group. Patterns of carbon, nitrogen and phosphorus dynamics in decomposing foliar litter in Canadian forests. Ecosystems 2006, 9, 46–62. [Google Scholar] [CrossRef]
- Zhang, D.; Hui, D.; Luo, Y.; Zhou, G. Rates of litter decomposition in terrestrial ecosystems: Global patterns and controlling factors. J. Plant Ecol. 2008, 1, 85–93. [Google Scholar] [CrossRef]
- Prescott, C.E. Litter decomposition: What controls it and how can we alter it to sequester more carbon in forest soils? Biogeochemistry 2010, 101, 133–149. [Google Scholar] [CrossRef]
- Cornwell, W.K.; Cornelissen, J.H.C.; Allison, S.D.; Bauhus, J.; Eggleton, P.; Preston, C.M.; Scarff, F.; Weedon, J.T.; Wirth, C.; Zanne, A.E. Plant traits and wood fates across the globe: Rotted, burned, or consumed? Glob. Chang. Biol. 2009, 15, 2431–2449. [Google Scholar] [CrossRef]
- Brovkin, V.; van Bodegom, P.M.; Kleinen, T.; Wirth, C.; Cornwell, W.K.; Cornelissen, J.H.C.; Kattge, J. Plant-driven variation in decomposition rates improves projections of global litter stock distribution. Biogeosciences 2012, 9, 565–576. [Google Scholar] [CrossRef]
- Herrero, C.; Krankina, O.; Monleon, V.J.; Bravo, F. Amount of distribution of coarse woody debris in pine ecosystems of north-western Spain, Russia and the United States. iForest 2014, 7, 53–60. [Google Scholar] [CrossRef]
- Holub, S.M.; Spears, D.H.; Lajtha, K. A reanalysis of nutrient dynamics in coniferous coarse woody debris. Can. J. For. Res. 2001, 31, 1894–1902. [Google Scholar] [CrossRef]
- Sturtevant, B.R.; Bissonette, J.A.; Long, J.N.; Roberts, D.W. Coarse woody debris as a function of age, stand structure, and disturbance in boreal Newfoundland. Ecol. Appl. 1997, 7, 702–712. [Google Scholar] [CrossRef]
- Siitonen, J. Forest management, coarse woody debris and saproxylic organisms: Fennoscandian boreal forests as an example. Ecol. Bull. 2001, 49, 11–41. [Google Scholar]
- Korea Forest Service. Statistical Yearbook of Forestry; Korea Forest Service: Daejeon, Korea, 2016.
- Yang, A.R.; Son, Y.; Noh, N.J.; Lee, S.K.; Jo, W.; Son, J.A.; Kim, C.; Bae, S.W.; Lee, S.T.; Kim, H.S.; et al. Effect of thinning on carbon storage in soil, forest floor and coarse woody debris of Pinus densiflora stands with different stand ages in Gangwon-do, central Korea. For. Sci. Technol. 2011, 7, 30–37. [Google Scholar]
- Shin, S.C. Pine wilt disease in Korea. In Pine Wilt Disease; Zhao, K., Futai, K., Sutherland, J.R., Takeuchi, Y., Eds.; Springer: Tokyo, Japan, 2008; pp. 26–32. [Google Scholar]
- Kwon, T.S.; Shin, J.H.; Lim, J.H.; Kim, Y.K.; Lee, E.J. Management of pine wilt disease in Korea through preventative silvicultural control. For. Ecol. Manag. 2011, 261, 562–569. [Google Scholar] [CrossRef]
- Fukasawa, Y. The geographical gradient of pine log decomposition in Japan. For. Ecol. Manag. 2015, 349, 29–35. [Google Scholar] [CrossRef]
- Kim, C.; Yoo, B.O.; Jung, S.Y.; Lee, K.S. Allometric equations to assess biomass, carbon and nitrogen content of black pine and red pine trees in southern Korea. iForest 2017, 10, 483–490. [Google Scholar] [CrossRef]
- Noh, N.J.; Kim, C.; Bae, S.W.; Lee, W.K.; Yoon, T.K.; Muraoka, H.; Son, Y. Carbon and nitrogen dynamics in a Pinus densiflora forest with low and high stand densities. J. Plant Ecol. 2013, 6, 368–379. [Google Scholar] [CrossRef]
- Harmon, M.E.; Fasth, B.; Woodall, C.W.; Sexton, J. Carbon concentration of standing and downed woody detritus: Effects of tree taxa, decay class, position, and tissue type. For. Ecol. Manag. 2013, 291, 259–267. [Google Scholar] [CrossRef]
- Klockow, P.A.; D’Amato, A.W.; Bradford, J.B.; Fraver, S. Nutrient concentrations in coarse and fine woody debris of Populus tremuloides Michx.-dominated forest, northern Minnesota, USA. Silva Fenn. 2014, 48, 962. [Google Scholar] [CrossRef]
- Ganjegunte, G.K.; Condron, L.M.; Clinton, P.W.; Davis, M.R.; Mahieu, N. Decomposition and nutrient release from radiate pine (Pinus radiate) coarse woody debris. For. Ecol. Manag. 2004, 187, 197–211. [Google Scholar] [CrossRef]
- Mobley, M.L.; de Richter, D.B.; Heine, P.R. Accumulation and decay of woody detritus in a humid subtropical secondary pine forest. Can. J. For. Res. 2013, 43, 109–118. [Google Scholar] [CrossRef]
- Jomura, M.; Akashi, Y.; Itoh, H.; Yuki, R.; Sakai, Y. Biotic and abiotic factors controlling respiration rates of above- and belowground woody debris of Fagus crenata and Quercus crispula in Japan. PLoS ONE 2015, 10, e0145113. [Google Scholar] [CrossRef] [PubMed]
- Yoon, T.K.; Noh, N.J.; Han, S.; Lee, J.; Son, Y. Soil moisture effects on leaf litter decomposition and soil carbon efflux in wetland and upland forests. Soil Sci. Soc. Am. J. 2014, 78, 1804–1816. [Google Scholar] [CrossRef]
- Yang, Y.; Luo, Y. Carbon: Nitrogen stoichiometry in forest ecosystems during stand development. Glob. Ecol. Biogeogr. 2011, 20, 354–361. [Google Scholar]
- Mackensen, J.; Bauhus, J. Density loss and respiration rates in coarse woody debris of Pinus radiate, Eucalyptus regnans and Eucalyptus maculate. Soil Biol. Biochem. 2003, 35, 177–186. [Google Scholar] [CrossRef]
- Yuan, J.; Hou, L.; Wei, X.; Shang, Z.; Cheng, F.; Zhang, S. Decay and nutrient dynamics of coarse woody debris in the Qinling Mountains, China. PLoS ONE 2017, 12, e0175203. [Google Scholar] [CrossRef] [PubMed]
- Harmon, M.E.; Sexton, J. Guidelines for Measurements of Woody Detritus in Forest Ecosystem; US Long-Term Ecological Research Network Office, University of Washington: Seattle, WA, USA, 1996. [Google Scholar]
- Kim, R.H.; Son, Y.; Lim, J.H.; Lee, I.K.; Seo, K.W.; Koo, J.W.; Noh, N.J.; Ryu, S.-R.; Hong, S.K.; Im, B.S. Coarse woody debris mass and nutrients in forest ecosystems of Korea. Ecol. Res. 2006, 21, 819–827. [Google Scholar] [CrossRef]
- Sollins, P. Input and decay of coarse woody debris in coniferous stands in western Oregon and Washington. Can. J. For. Res. 1982, 12, 18–28. [Google Scholar] [CrossRef]
- Sollins, P.; Cline, S.P.; Verhoeven, T.; Sachs, D.; Spycher, G. Patterns of log decay in old-growth Douglas-fir forests. Can. J. For. Res. 1987, 17, 1585–1595. [Google Scholar] [CrossRef]
- Whitmore, T.C. Tropical Rain Forests of the Far East; Oxford University Press: Oxford, UK, 1984. [Google Scholar]
- Bradford, M.A.; Tordoff, G.M.; Eggers, T.; Jones, T.H.; Newington, J.E. Microbiota, fauna, and mesh size interactions in litter decomposition. Oikos 2002, 99, 317–323. [Google Scholar] [CrossRef]
- Berg, B.; Laskowski, R. Litter decomposition: A guide to carbon and nutrient turnover. Adv. Ecol. Res. 2006, 38, 20–71. [Google Scholar]
- Hinrichs, C.; Boiler, C. JMP Essentials: An Illustrated Step-by-Step Guide for New Users, 2nd ed.; SAS Institute Inc.: Cary, NC, USA, 2014. [Google Scholar]
- Laiho, R; Prescott, C.E. The contribution of coarse woody debris to carbon, nitrogen, and phosphorus cycles in three Rocky Mountain coniferous forests. Can. J. For. Res. 1999, 29, 1592–1603. [Google Scholar] [CrossRef]
- Wei, X.; Kimmins, J.P.; Peel, K.; Steen, O. Mass nutrients in woody debris in harvested and wildfire-killed lodgepole pine forests in the central interior of British Columbia. Can. J. For. Res. 1997, 27, 148–155. [Google Scholar] [CrossRef]
- Yim, J.S.; Kim, R.H.; Lee, S.J.; Son, Y. Dead wood inventory and assessment in South Korea. In Pushing Boundaries: New Directions in Inventory Techniques and Applications; Forest Inventory and Analysis Symposium: Portland, OR, USA, 8–10 December 2015; PNW-GTR-931; US Department of Argiculture: Portland, OR, USA, 2015; pp. 134–138. [Google Scholar]
- Ohtsuka, T.; Negishi, M.; Sugita, K.; Iimura, Y.; Hirota, M. Carbon cycling and sequestration in a Japanese red pine (Pinus densiflora) forest on lava flow of Mt. Fuji. Ecol. Res. 2013, 28, 855–867. [Google Scholar] [CrossRef]
- Maguire, D.A. Branch mortality and potential litterfall from Douglas-fir trees in stands of varying density. For. Ecol. Manag. 1994, 70, 41–53. [Google Scholar] [CrossRef]
- Sippola, A.L.; Siitonen, J.; Kallio, R. Amount and quality of coarse woody debris in natural and managed coniferous forests near the timberline in Finnish Lapland. Scan. J. For. Res. 1998, 13, 204–214. [Google Scholar] [CrossRef]
- Yuan, J.; Cheng, F.; Zhao, P.; Qiu, R.; Wang, L.; Zhang, S. Characteristics in coarse woody debris mediated by forest developmental stage and latest disturbances in a natural secondary forest of Pinus tabulaeformis. Acta Ecol. Sin. 2014, 34, 232–238. [Google Scholar] [CrossRef]
- Johnson, E.A.; Greene, D.F. A method for studying dead bole dynamics in Pinus contorta var. latifolia—Picea engelmannii forests. J. Veg. Sci. 1991, 2, 523–530. [Google Scholar]
- Krankina, O.N.; Harmon, M.E.; Griazkin, A.V. Nutrient stores and dynamics of woody detritus in a boreal forest: Modeling potential implications at the stand level. Can. J. For. Res. 1999, 29, 20–32. [Google Scholar] [CrossRef]
- Guo, L.B.; Bek, E.; Gifford, R.M. Woody debris in a 16-year old Pinus radiata plantation in Australia: Mass, carbon and nitrogen stocks, and turnover. For. Ecol. Manag. 2006, 228, 145–151. [Google Scholar] [CrossRef]
- Herrmann, S.; Prescott, C.E. Mass loss and nutrient dynamics of coarse woody debris in three Rocky Mountain coniferous forests: 21 year results. Can. J. For. Res. 2008, 38, 125–132. [Google Scholar] [CrossRef]
- Shorohova, E.; Kapitsa, E. Mineralization and fragmentation rates of bark attached to logs in a northern boreal forest. For. Ecol. Manag. 2014, 315, 185–190. [Google Scholar] [CrossRef]
- Yoon, T.K.; Chung, H.; Kim, R.H.; Noh, N.J.; Seo, K.W.; Lee, S.K.; Jo, W.; Son, Y. Coarse woody debris mass dynamics in temperate natural forests of Mt. Jumbong, Korea. J. Ecol. Field Biol. 2011, 34, 115–125. [Google Scholar] [CrossRef]
- Liu, W.; Schaefer, D.; Qiao, L.; Liu, X. What controls the variability of wood-decay rates? For. Ecol. Manag. 2013, 310, 623–631. [Google Scholar]
- Harmon, M.E.; Krankina, O.N.; Sexton, J. Decomposition vectors: A new approach to estimating woody detritus decomposition dynamics. Can. J. For. Res. 2000, 30, 76–84. [Google Scholar] [CrossRef]
© 2017 by the authors. Licensee MDPI, Basel, Switzerland. This article is an open access article distributed under the terms and conditions of the Creative Commons Attribution (CC BY) license (http://creativecommons.org/licenses/by/4.0/).