Abstract
Date palm (Phoenix dactylifera L.) is a major fruit tree in the Middle East and it is a plant considered to be tolerant to a variety of abiotic stresses, including salinity. However, the physiological basis of its salinity tolerance is not fully known. The objective of this study was to screen Omani date palm cultivars for tolerance or susceptibility to salt stress. Seedlings from 10 commercially important date palm cultivars were subjected to 240 mM NaCl, and several physiological parameters related to salinity tolerance traits were evaluated upon treatment. The cultivars were divided into two groups based on the dry weight (DW) of their leaf and root tissues, a parameter which was used as an indication of healthy growth. The results revealed that photosynthesis, electrolyte leakage (EL), and the shoot K+/Na+ ratio were all significantly reduced in the susceptible cultivars. In addition, the relative water content was higher in the tolerant cultivars in comparison with the susceptible ones. These results suggest that although date palm is tolerant to high salinity, there is variation in tolerance among different cultivars. Shoot Na+ exclusion, photosynthesis, and membrane stability are apparently the main determinants of tolerance and can be used in salinity tolerance screening of date palm. The results have shown new very tolerant cultivars (Manoma and Umsila) that could serve as genetic resources for improved date palm tolerance to salinity.
Keywords:
date palm; salt stress; screening; tolerance; susceptible; photosynthesis; sodium; potassium 1. Introduction
Saline environments present a major worldwide threat to agriculture, resulting partly from the irrigation of arable lands with salt-containing water. Global annual losses in agricultural crops due to salinization add up to more than US $12 billion [1]. Salinity is a multifactorial trait, the first effects of which are osmotic, whereby the presence of high concentrations of NaCl inhibits water uptake, leading to slow growth or growth arrest and eventual death for sensitive plants [2]. This osmotic component is very severe because it induces stomatal closure via abscisic acid (ABA) signaling pathways, with a consequential reduction in gas exchange and hence the rate of photosynthesis [3]. In addition to osmotic stress, Na+ is known to affect chlorophyll [4], an essential pigment for photosynthetic machinery, leading to high biomass reduction [5].
Both excess Na+ accumulation and osmotic stress often induce secondary stresses, including oxidative stress and nutrient deficiency. Oxidative stress results from the production of reactive oxygen species (ROS) (mainly O2−) in the electron transport chains of photosynthesis (chloroplast), respiration (mitochondria), and photorespiration (peroxisomes). These ROS often degrade membrane lipids through peroxidation, leading to electrolyte leakage and, consequently, the obstruction of cellular functions and cell death [6]. Thus, tolerance to salt stress can be evaluated on the basis of a plant’s ability to prevent or reduce electrolyte leakage or to maintain membrane integrity under saline conditions. An important component of these leaked electrolytes is potassium ions (K+). K+ is essential for almost all stages of plant development, and it also intervenes in most physiological processes, including pH regulation, the maintenance of membrane potentials, nyctinastic leaf movements, stomatal aperture regulation, and protein trafficking [7]. Owing to these multiple functions of K+, K+ homeostasis under salt stress has become the focus of stress tolerance studies. Particularly, the cytosolic and, to a lesser extent, tissue K+/Na+ ratio is known to be a key salt stress tolerance trait and a strong determinant of salt stress tolerance [8]. Excess Na+ in the soil often inhibits the uptake of other elements, resulting in nutrient deficiency. This inhibition is more pronounced on K+ than it is on other elements, since both Na+ and K+ have similar physico-chemical characteristics, with Na+ often negatively interfering with K+-dependent processes, such as enzyme activation. This results in the interruption of metabolic processes such as photosynthesis, as K+ is involved in the activation of many photosynthetic pathway enzymes [9]. Therefore, Na+ exclusion, especially from the leaf, is often beneficial in protecting essential metabolic processes such as photosynthesis, which is crucial for biomass production. In this regard, many plants have developed efficient exclusion mechanisms, including extruding Na+ from the root cells into the soil, the retrieval of Na+ from the xylem vessels into the xylem parenchyma cells, and the recirculation of Na+ from shoot to root and eventually back to the soil via the phloem [10,11,12,13]. Furthermore, tissue tolerance, such as vacuolar Na+ sequestration in the leaf, is equally important as it offers cheap osmoticum for cell turgor, as opposed to organic solute synthesis, which is of high metabolic cost for plants [11].
Adaptation to salinity is highly variable among plant species, cultivars of the same species, and even among individuals of the same cultivar, making the stress very complex and exceedingly difficult to overcome even through genetic engineering, since it is multigenic in nature [14]. Therefore, establishing the differential salt stress tolerance among cultivars through screening would yield useful genetic resources for crop breeding. This has been very successful in many cereals, including rice [15] and wheat [16].
Date palm is a monocot and staple fruit in many arid and semi-arid regions of the Middle East and North Africa. It has over 100 cultivars and basically, little is known about the adaptation of these plants to salinity, and the few available studies employ only a very few cultivars (generally one to four) [17,18,19,20,21,22,23,24]. This is a serious deficit, because salinity is encroaching on vast swathes of arable land, including the areas where these date palms are grown. These regions are dry and the absence of fresh water forces growers to resort to salt-containing water for irrigation, which often results in the accumulation of salts in these soils. Some of these cultivars, especially those growing along coastal areas, are known to be tolerant and capable of growing in salinities of over 300 mM NaCl [25,26], while others show sensitivity at the same salinity level. However, the physiological basis of this tolerance or sensitivity is not fully known. Thus, screening these cultivars for salt stress tolerance can yield valuable information on the adaptive mechanisms of these plants and provide resources for improved date palm production in these marginal areas.
Therefore, the objective of this study was to screen cultivars of date palms growing in farms of different salinity levels in Oman and to establish the mechanisms of adaptation that they employ to tolerate salt stress. We thus sought to answer two fundamental questions: do these cultivars have similar adaptive mechanisms to salt stress? If different, what are the main defining tolerance or susceptibility traits endowed in each cultivar or group of cultivars?
2. Materials and Methods
2.1. Plants, Seed Germination, and Growth Conditions
Date palm is a dioecious plant. In order to reduce the paternal genetic background variation, a single pollen grain source was selected to produce seeds for 10 date palm (Phoenix dactylifera L.) cultivars (Zabad, Umsila, Nagal, Abunarenja, Fard, HilaliOmani, Nashukharma, Barni, Manoma, and Khalas). The pollination process was manually carried out at the Agricultural Experimental Station (AES) of Sultan Qaboos University. These 10 cultivars were chosen because they are known to grow in salted-affected areas.
After complete ripening, the fruits were collected and the seeds were extracted and used in the experiment. The seeds were germinated in sterilized moist vermiculite at 35 °C. Immediately after radicle emergence, seeds were transplanted into 2-L pots filled with peat moss and Perlite (2:1, v/v). The soil contained 0.5 g NPK (20:5:10, including micro-nutrients) fertilizer. Plants were kept in a glasshouse under natural sunlight conditions and at a constant temperature of 30 °C. Five weeks after germination, the seedlings were fertilized again using the same fertilizer dosage.
The electrical conductivity (EC), temperature, and moisture content of the soil in the pots were monitored using data loggers (DECAGON, Em50, 2012, Pullman, WA, USA). For establishment, the pots were irrigated with only tap water for two weeks. Then the pots were arranged in a completely randomized experimental design and subjected to 0 mM (control) and 240 mM NaCl (salt stress). Each treatment had four replicates and each replicate consisted of a pot containing a single plant. The plants were monitored under the treatments for 30 days. At the end, measurements were carried out and samples collected for various physiological analyses.
2.2. Plant Growth and Leaf Area Measurements
The plants were separated into shoots and roots and their fresh weights were recorded, then the samples were dried at 80 °C in an oven for 48 h and their dry weights were recorded. The leaf area of each plant was determined using a portable area meter (CI-202, Camas, WA, USA). Portions of these samples were frozen in liquid nitrogen stored at −80 °C.
2.3. Gas Exchange and Chlorophyll Fluorescence Measurements
Gas exchange measurements were taken between 9:00 am and 11:00 am on one leaf of each plant after four weeks of treatment, using a portable photosynthesis system (LCpro-SD, ADC BioScientific, Hoddesdon, UK). Each measurement was taken for 60 min after placing the leaf in the leaf cuvette. The parameters recorded include net photosynthetic rate (A), stomatal conductance (gs), transpiration rate (E), and intercellular CO2 concentration (Ci). The reference CO2 was maintained at a rate of 600 μmolCO2/mol and a photosynthetic flux density of 869 μmol m−2 s−1. Water use efficiency (WUE) was calculated as: WUE = A/E. The ratio of variable to maximum chlorophyll fluorescence (Fv/Fm) as a parameter for the maximum quantum yield efficiency of photosystem II was measured on dark-adapted leaves, using a rapid screening fluorometer (Pocket Pea, Hansatech Instruments, King’s Lynn, London, UK). The values obtained from the fluorometer were analyzed with the PEA software.
2.4. Measurement of Na+ and K+ Concentrations
The shoot and root samples were dried at 80 °C for 48 h and weighed. The dried samples were later digested with concentrated HNO3 acid and H2O2 (5:1 v:v), as previously described [27]. The Na+ and K+ concentrations in the digested samples were measured using a flame photometer (Microprocessor Flame Photometer, Electronics India, Model 1382, Parwanoo, Himachal Pradesh, India against known concentrations of Na+ and K+.
2.5. Chlorophyll Concentration
For the chlorophyll concentration of the leaves, chlorophyll was extracted from four leaf discs with 80% acetone, and the absorbance of the resulting extracts was measured by spectrophotometry (Thermo SPECTRONIC, Helios, Madison, WI, USA) at wavelengths of 646 nm and 663 nm. The chlorophyll concentration in (mg/g fw) was then calculated following the method of [28].
2.6. Relative Water Content
The relative water content was measured according to [29,30]. The fresh leaf tissues were weighed to get the fresh weight (FW) before being placed in Petri-dishes with water and incubated at room temperature for 24 h. The tissues were later taken out, blotted dry, and weighed to get the turgid weight (TW). Subsequently, the samples were dried at 80 °C for 24 h and weighed again to obtain the dry weight (DW). The relative water content (RWC) was then calculated according to the formula: RWC = (FW − DW/TW − DW) × 100.
2.7. Electrolyte Leakage
Electrolyte leakage was measured according to [31]. The fresh leaf samples were placed in vials with 10 ml of deionized water and shacked at 100 rpm for 24 h at room temperature. The first electrolyte leakage (EC1) was then recorded. Next, maximum conductivity (EC2) was obtained by placing the vials in the autoclave (Aster, Inc., Placentia, CA, USA) at 120 °C for 20 min. The result was then recorded. Electrolyte leakage was calculated as: electrolyte leakage = (EC1/EC2) × 100. The values were expressed as a percentage of maximum conductivity.
2.8. Statistical Analysis
All data were analyzed by using the one-way analysis of variance (ANOVA) using the SPSS statistical package version 21 (IBM Corp, Armonk, NY, USA). The means were separated using Duncan’s Multiple Range Test (DMRT) at p = 0.05. The data were checked for normality using exploratory data analysis in SPSS. Normal distributions were determined using the Shapiro-Wilk Test at p > 0.05, and skewness between −1.0 and +1.0. Correlation between measured parameters was carried out in SPSS using Pearson’s correlation analysis and data were displayed as the Pearson’s correlation coefficient (r) and p-values. Analysis of variance (two-way-ANOVA) was used to study the interaction effects between the cultivars and treatments for all measured parameters.
3. Results
3.1. Effects of Salinity on Growth
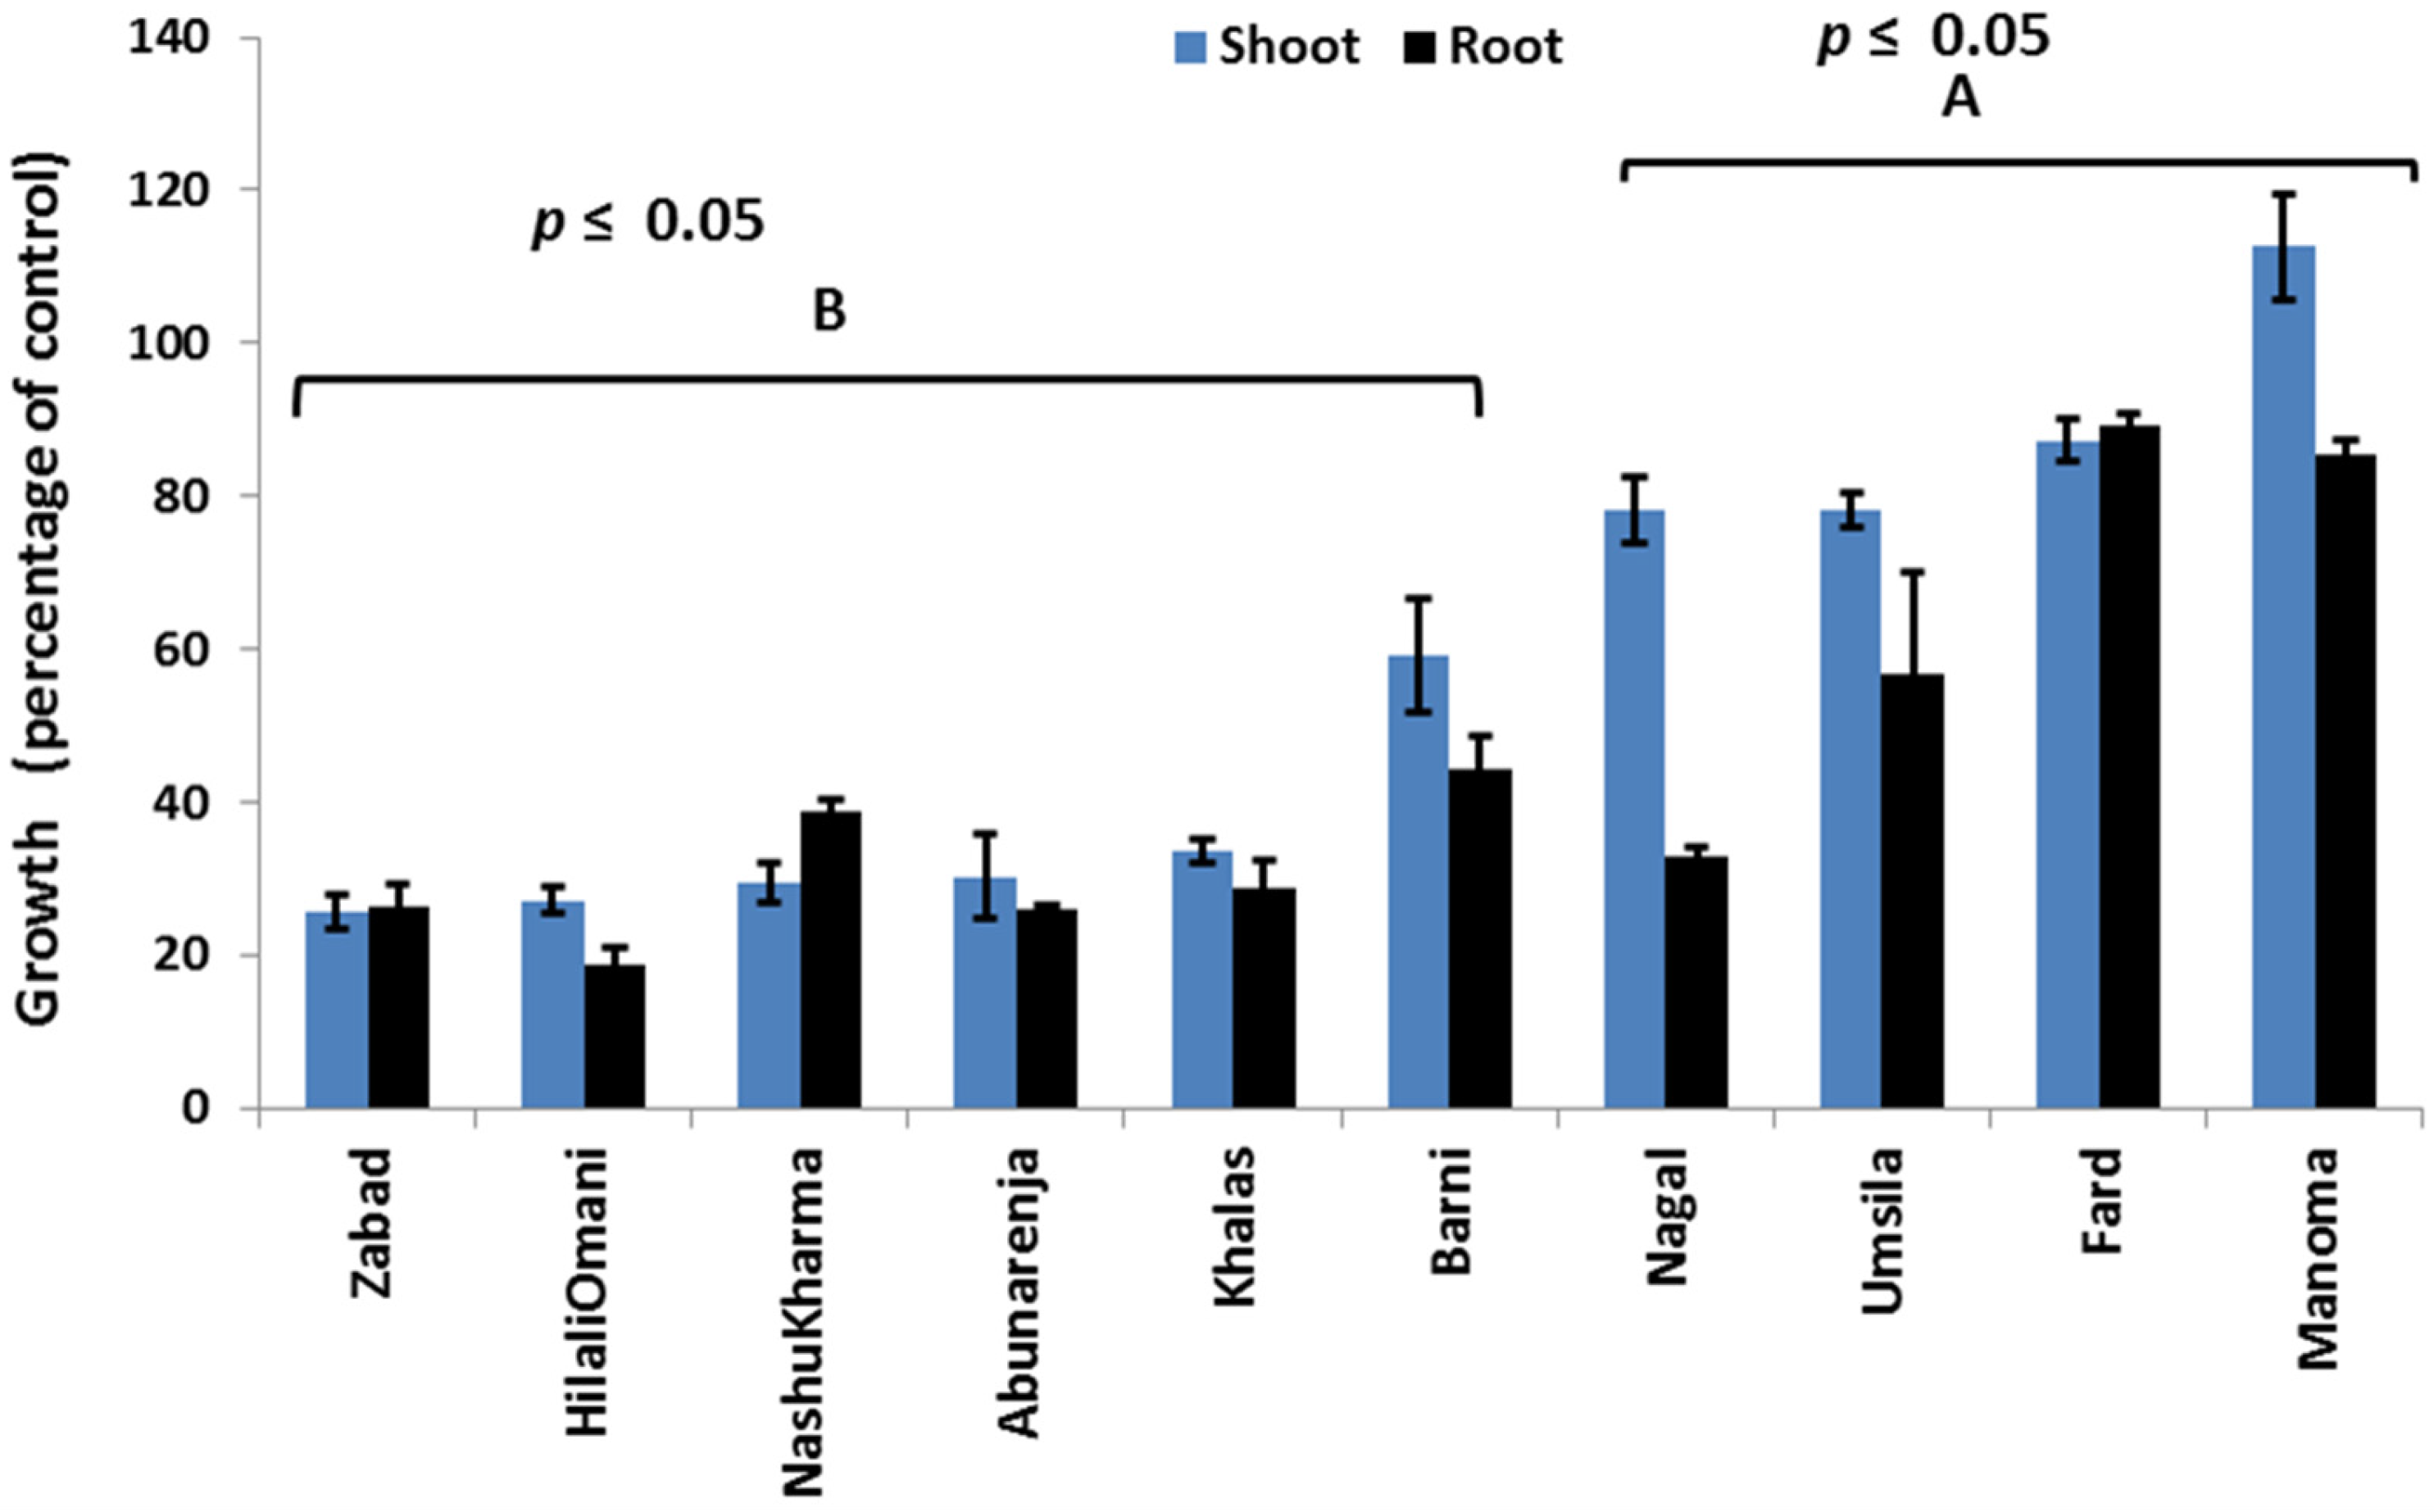
The effect of salinity was investigated on the seedlings of 10 date palm cultivars in a glasshouse under controlled conditions. Statistical analysis based on the growth data, expressed as the DW percentage of the control of all 10 cultivars, revealed two distinct growth patterns that can be used to separate the cultivars into two categories (Figure 1).

Figure 1.
Effect of salinity (240 mM NaCl) on the shoot and root growth of tolerant (A) and susceptible (B) date palms. Data were presented as a percentage of the control. Bars represent mean ± SE (n = 3).
The first category comprises Zabad, HilaliOmani, Nashukharma, Khalas, Barni, and Abunarenja, while the second category is composed of Manoma, Umsila, Fard, and Nagal cultivars. It was observed that under salt stress, the root and shoot DW of the cultivars in the first category was lower than in the cultivars of the second category. Among all 10 cultivars, Manoma had the highest shoot growth (113% of the control), whereas Zabad had the lowest (28% of the control). Under salt stress, visual symptoms such as leaf tip burn were only found in Zabad, which appeared to be the most sensitive to salinity among the cultivars in the first category.
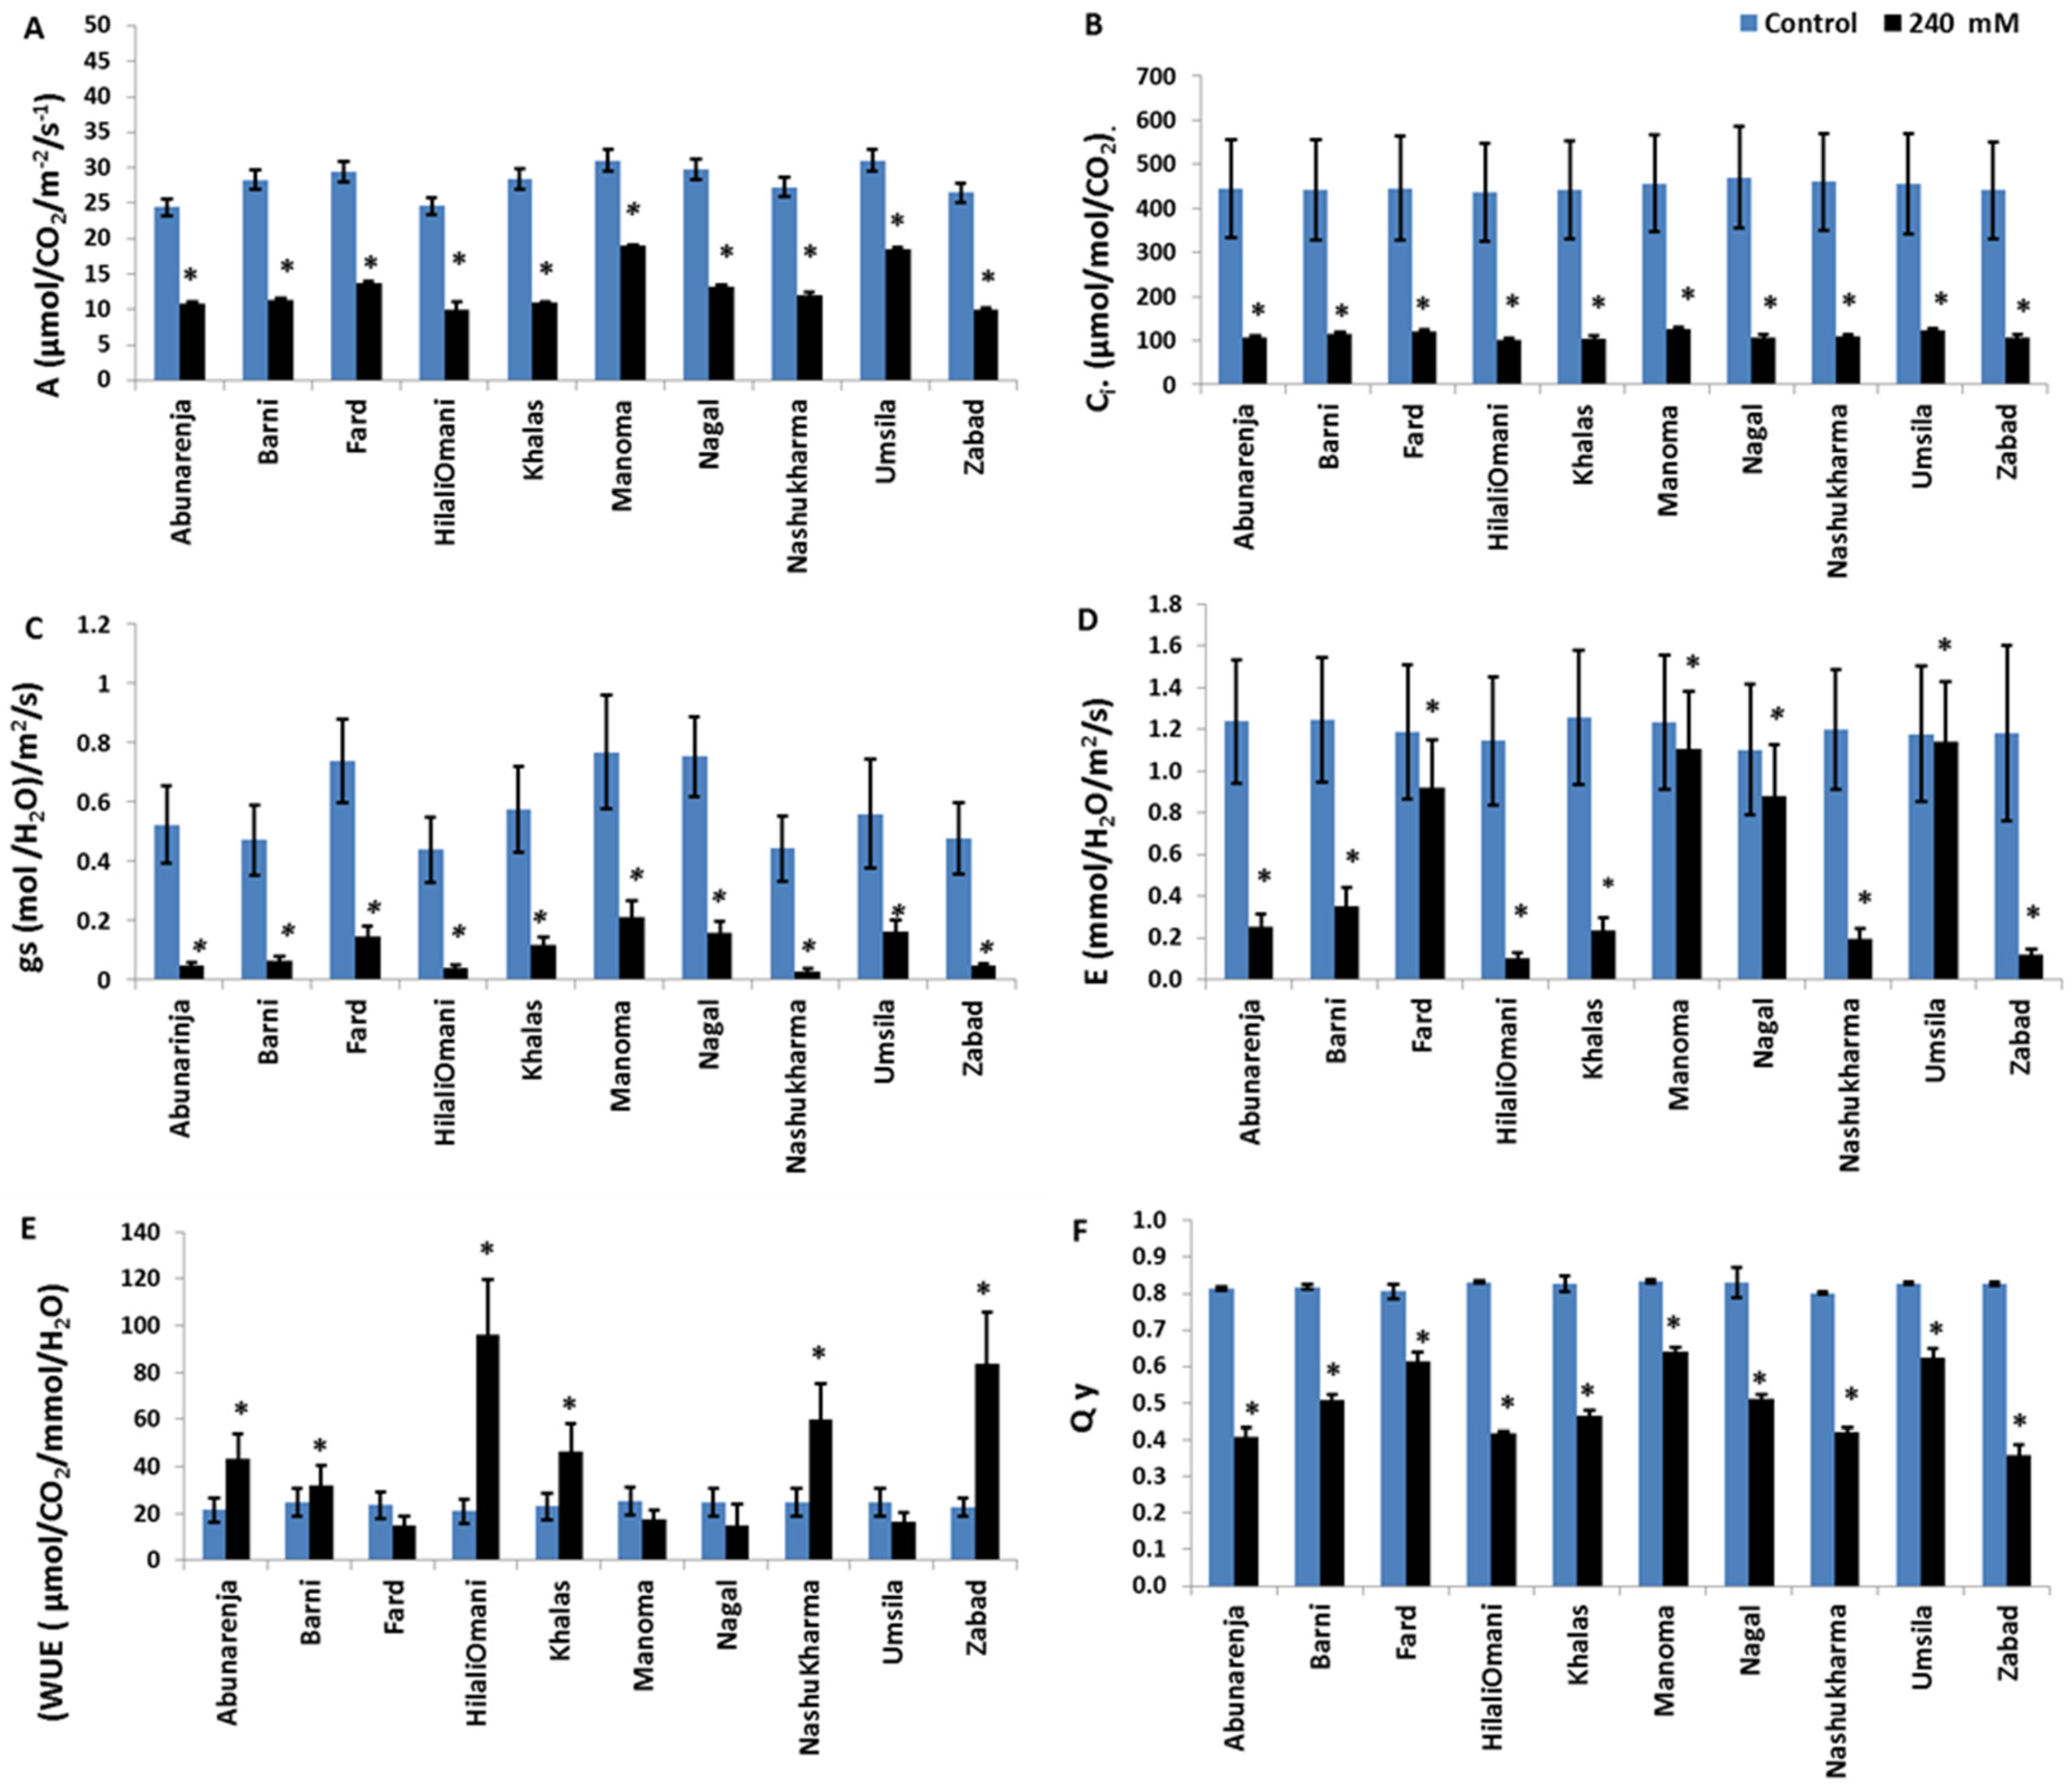
3.2. Photosynthesis and Quantum Yield Efficiency of PSII Activity
Since photosynthetic efficiency is directly related to biomass production in plants, the net photosynthetic rate (A), stomatal conductance (gs), transpiration (E), and internal CO2 concentration (Ci) in all the cultivars were measured under control and salt stress conditions. The data obtained showed a significant reduction (p ≤ 0.05) in all of the parameters and in each of the 10 cultivars in response to salinity treatment (Figure 2). However, the reduction in A was less in Manoma and Umsila (39% and 40%, respectively) than in the other cultivars compared to the control, while it was most significantly reduced (p ≤ 0.05) in Zabad (62%) (Figure 2A). All 10 cultivars had significantly reduced Ci compared to the control (p ≤ 0.05) (Figure 2B). The gs also declined significantly in all the cultivars (p ≤ 0.05), but the decrease was less in Umsila (70%) and Manoma (72%), and the highest was in Nashukharma (92%) compared to the control. The highest E was recorded in Umsila (12% reduction) and Manoma (13% reduction), while Zabad showed the lowest (97% reduction) (Figure 2C,D). The WUE of Fard, Umsila, and Manoma under stress was not significantly different from the control (p ≤ 0.05), but markedly increased in HilaliOmani and Zabad (95.9% and 89.2%, respectively) (Figure 2E). For the quantum yield of PSII activity, although there were no significant differences among the cultivars (p ≤ 0.05), lower reductions were observed in Manoma (23% reduction), Fard (24% reduction), and Umsila (24.4% reduction) compared to the control, whereas a marked reduction was observed in Zabad (57% reduction) (Figure 2F).

Figure 2.
Effect of salinity on (A) Photosynthesis rate (A); (B) Intercellular CO2 concentration (Ci); (C) Stomatal conductance (gs); (D) Transpiration rate (E); (E) Water use efficiency (WUE); and (F) Quantum yield (Qy) in date palm cultivars when exposed to 0 mM and 240 mM NaCl. Bars represent mean ± SE (n = 3). Significant (p ≤ 0.05) differences are marked with an asterisk.
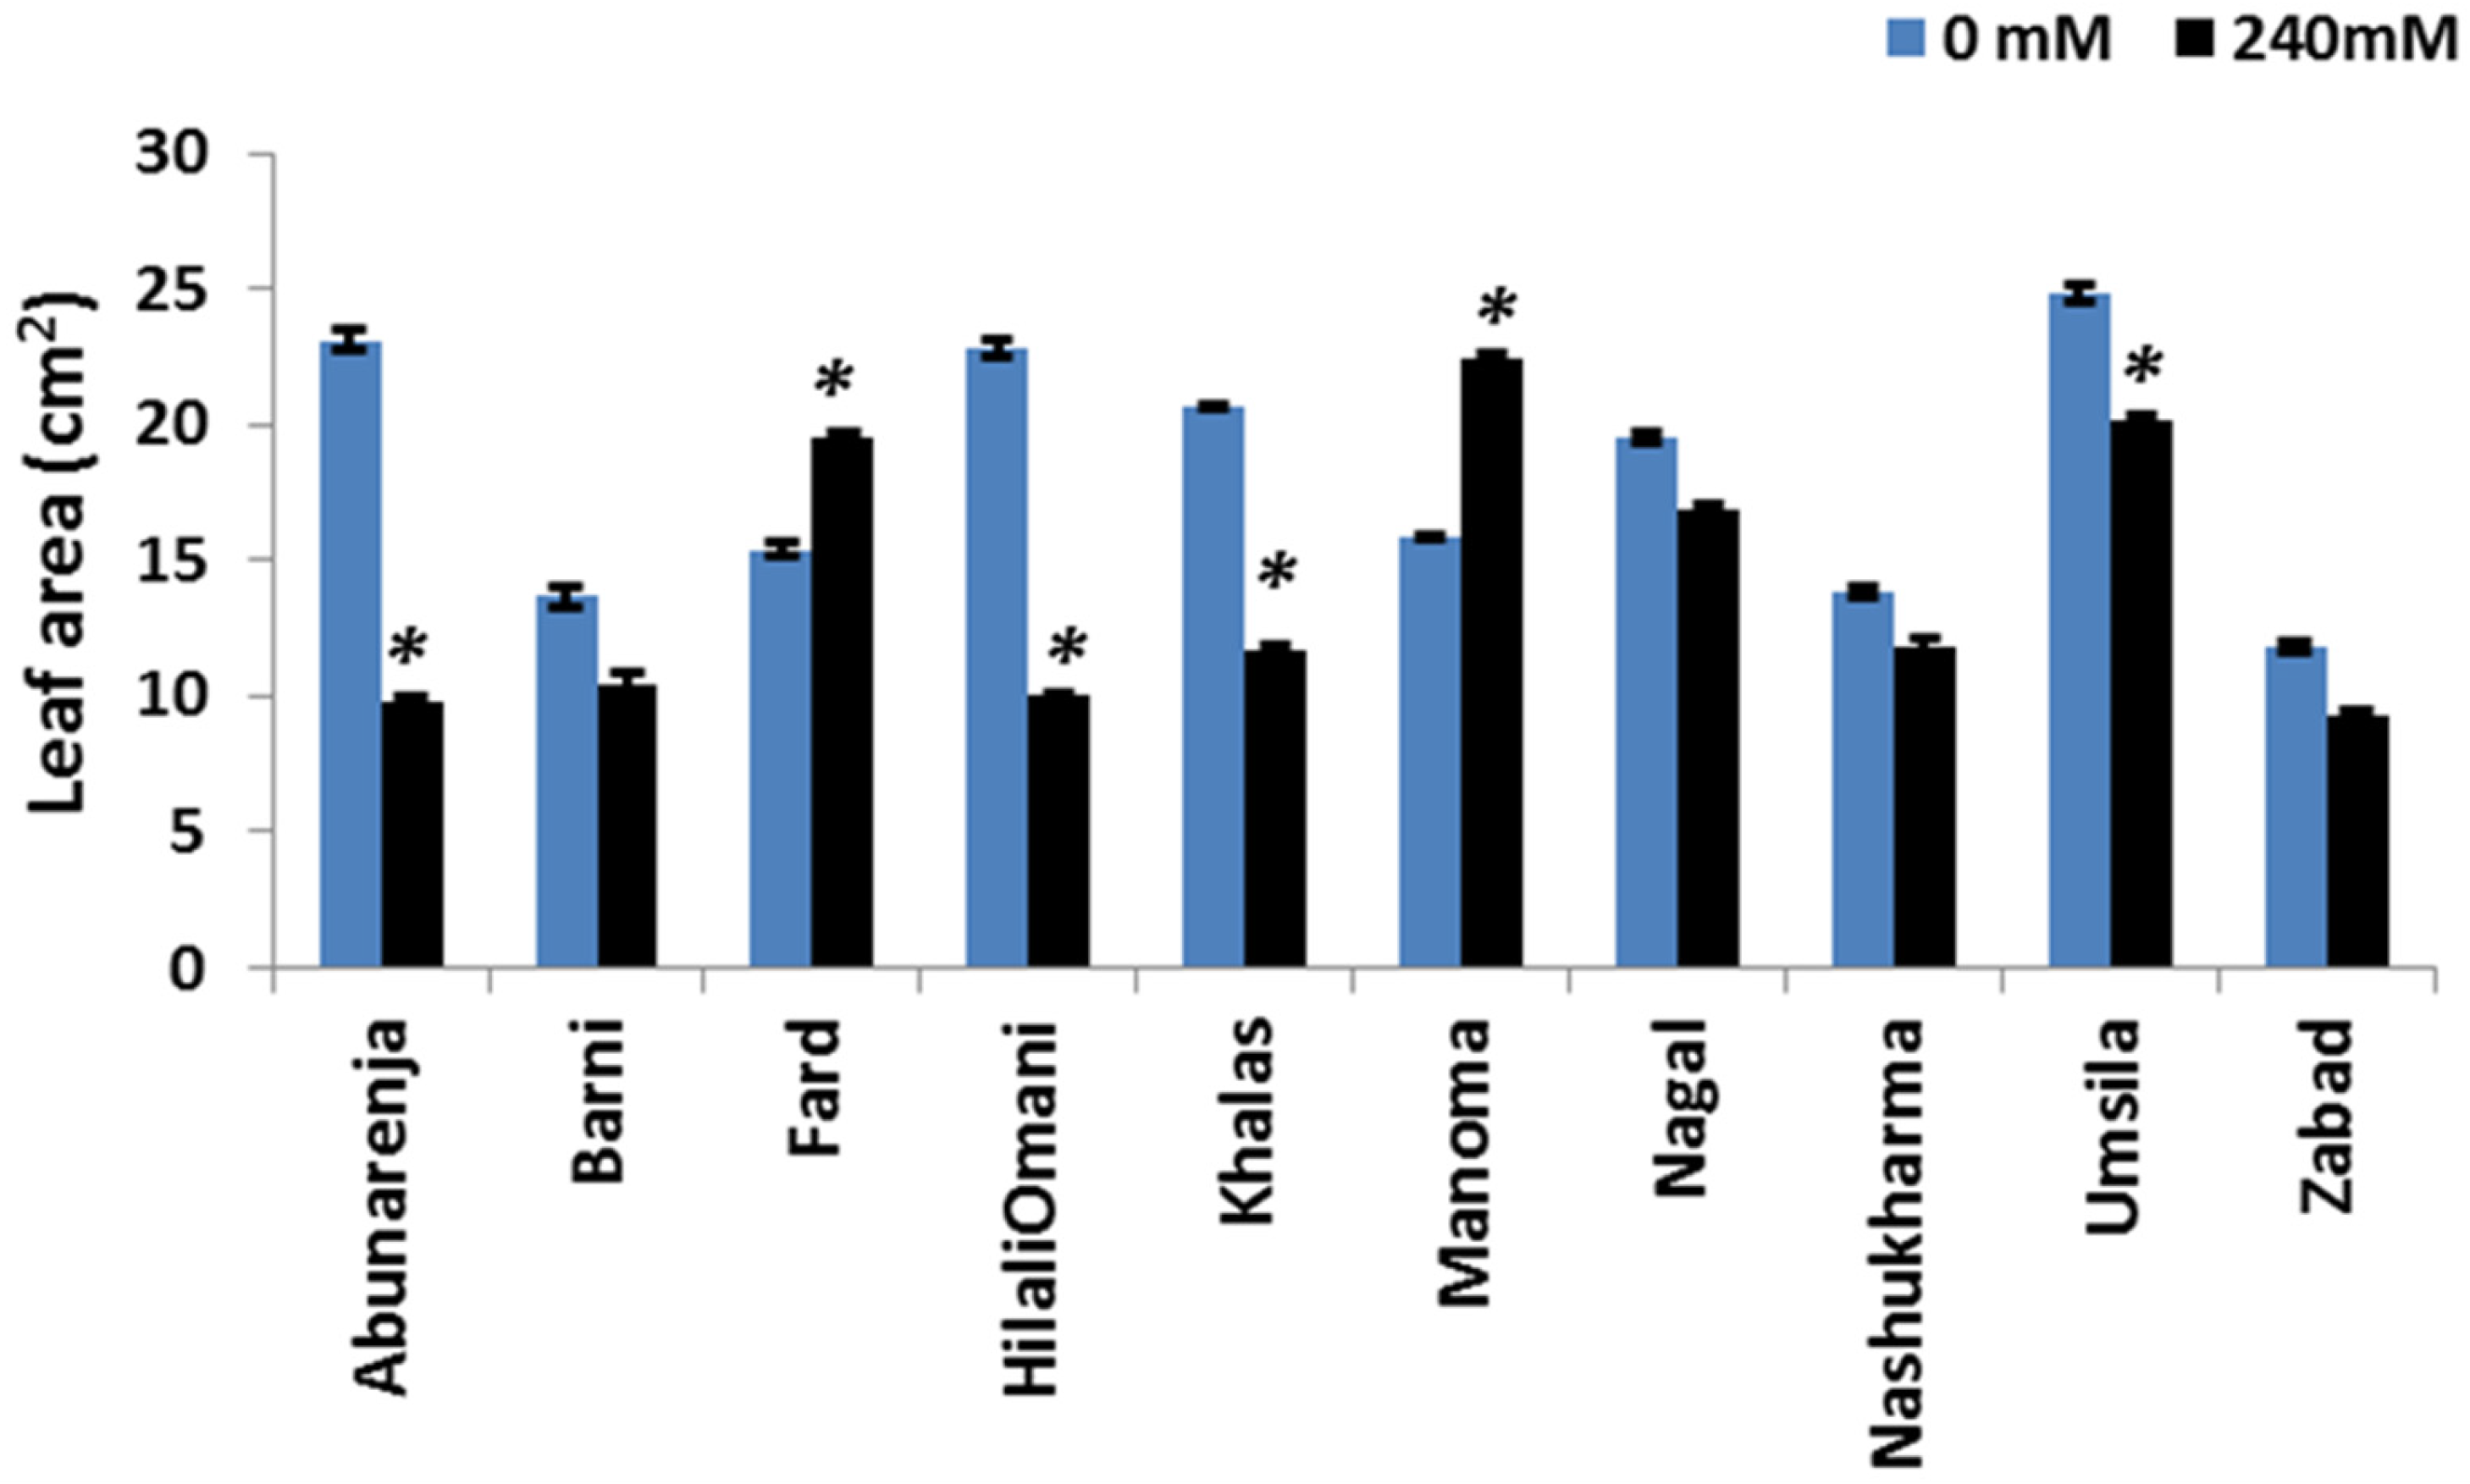
3.3. Effect of Salt Stress on Leaf Area
Since leaf area is directly correlated with the photosynthetic rate [32], the leaf area of the 10 cultivars was measured under control and salt stress conditions. Except for Fard (whose leaf area was unaltered), Manoma and Umsila had the lowest reduction in leaf area (10% and 12%, respectively) compared to the control, while the leaf area declined significantly under salt stress (p ≤ 0.05) in all of the other cultivars, with the highest decline observed in Nashukharma (39%) (Figure 3).
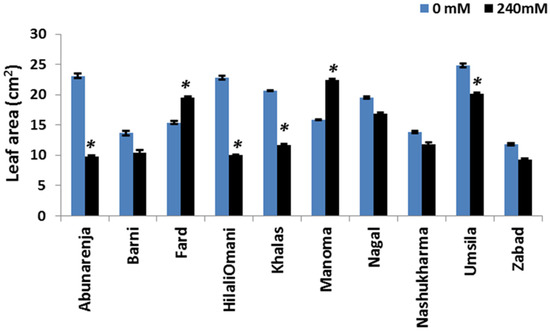
Figure 3.
Effect of salinity on the leaf area (LA) of date palm cultivars exposed to 0 and 240 mM NaCl. Bars represent mean ± SE (n = 3). Significant (p ≤ 0.05) differences are marked with an asterisk.
3.4. Effect of Salt Stress on Total Chlorophyll Concentration
Chlorophyll is an essential molecule for the capture and transfer of energy in the photosynthetic machinery [33]. To determine whether the difference in photosynthetic rate among the cultivars is related to differences in chlorophyll concentration under salt stress, the chlorophyll concentration of the leaves of the control and salt-treated plants was determined. The results showed a significant reduction in chlorophyll concentration for all 10 cultivars (p ≤ 0.05), with a more than 50% reduction compared to the controls (Figure 4).
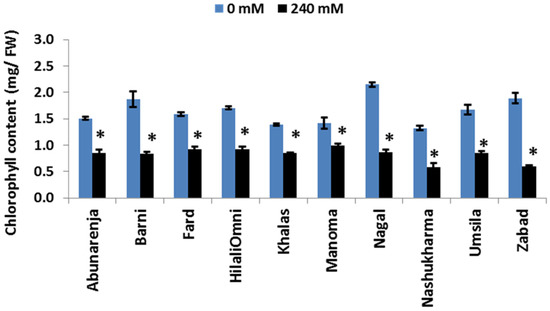
Figure 4.
Effect of salinity on chlorophyll concentrations of date palm cultivars exposed to 0 and 240 mM NaCl. Bars represent mean ± SE (n = 3). Significant (p ≤ 0.05) differences are marked with an asterisk.
3.5. Effect of Salt Stress on Relative Water Content (RWC)
It is known that the water status of a plant is important for maintaining cellular and metabolic functions under salt stress [34]. To assess whether reductions in the photosynthetic rate and growth were due to alterations in the water content of the plants, the RWC of the cultivars was measured under control and salt stress conditions. While most of the cultivars maintained relatively high RWCs (>60%), it was significantly reduced in Zabad (<60%) (p ≤ 0.05) under salt stress (Figure 5).
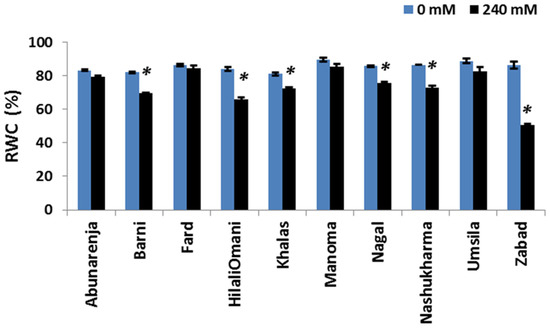
Figure 5.
Effect of salinity on the relative water content (RWC %) of date palm cultivars exposed to 0 and 240 mM NaCl. Bars represent mean ± SE (n = 3). The significant (p ≤ 0.05) differences are marked with an asterisk.
3.6. Effect of Salt Stress on Na+ and K+ Concentrations
To elucidate the patterns of Na+ and K+ accumulation in date palm tissues and to determine whether the growth of the cultivars under salt stress is related to the differential Na+ and K+ accumulation in the tissues, the Na+ and K+ concentrations in the cultivars were measured in both the root and leaf tissues. Manoma, Umsila, Nagal, and Fard (second category cultivars) showed a tendency to control Na+ accumulation in the leaves, while Zabad, in contrast, accumulated more Na+ in the leaf tissues. Under salt stress, Zabad had the highest concentration of Na+ in the leaves (25.5 mg/g), while Manoma had the lowest out of all the cultivars (9.23 mg/g), followed by Umsila (11.73 mg/g) (Figure 6A). Overall, Manoma, Umsila, Nagal, and Fard maintained the lowest concentrations of Na+ in the leaves. With regards to K+ concentration, under control conditions, Barni and Khalas had a significantly lower concentration of K+ (p ≤ 0.05) in the leaves than in the roots compared with other cultivars. Under salt stress, Nashukharma had the lowest concentration of K+ in the leaves (5.69 mg/g DW) compared to the control, followed by Zabad (5.78 mg/g DW), while Manoma had the highest concentration out of all the cultivars (11.15 mg/g DW) compared to the control (Figure 6B). The Na+/K+ ratio in the leaves was significantly reduced in Manoma, whereas it was the highest in Zabad (p ≤ 0.05) (Figure 6C).
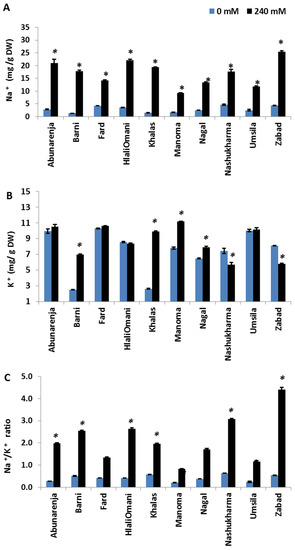
Figure 6.
Effect of salinity treatment on the amounts of Na+ (A), K+ (B), and Na+/K+ ratio (C) accumulated in the leaves of date palm cultivars grown under normal (0 mM NaCl)and salinity (240 mM NaCl) conditions. Bars represent mean ± SE (n = 3). Significant (p ≤ 0.05) differences are marked with an asterisk.
3.7. Effect of Salt Stress on Electrolyte Leakage (EL)
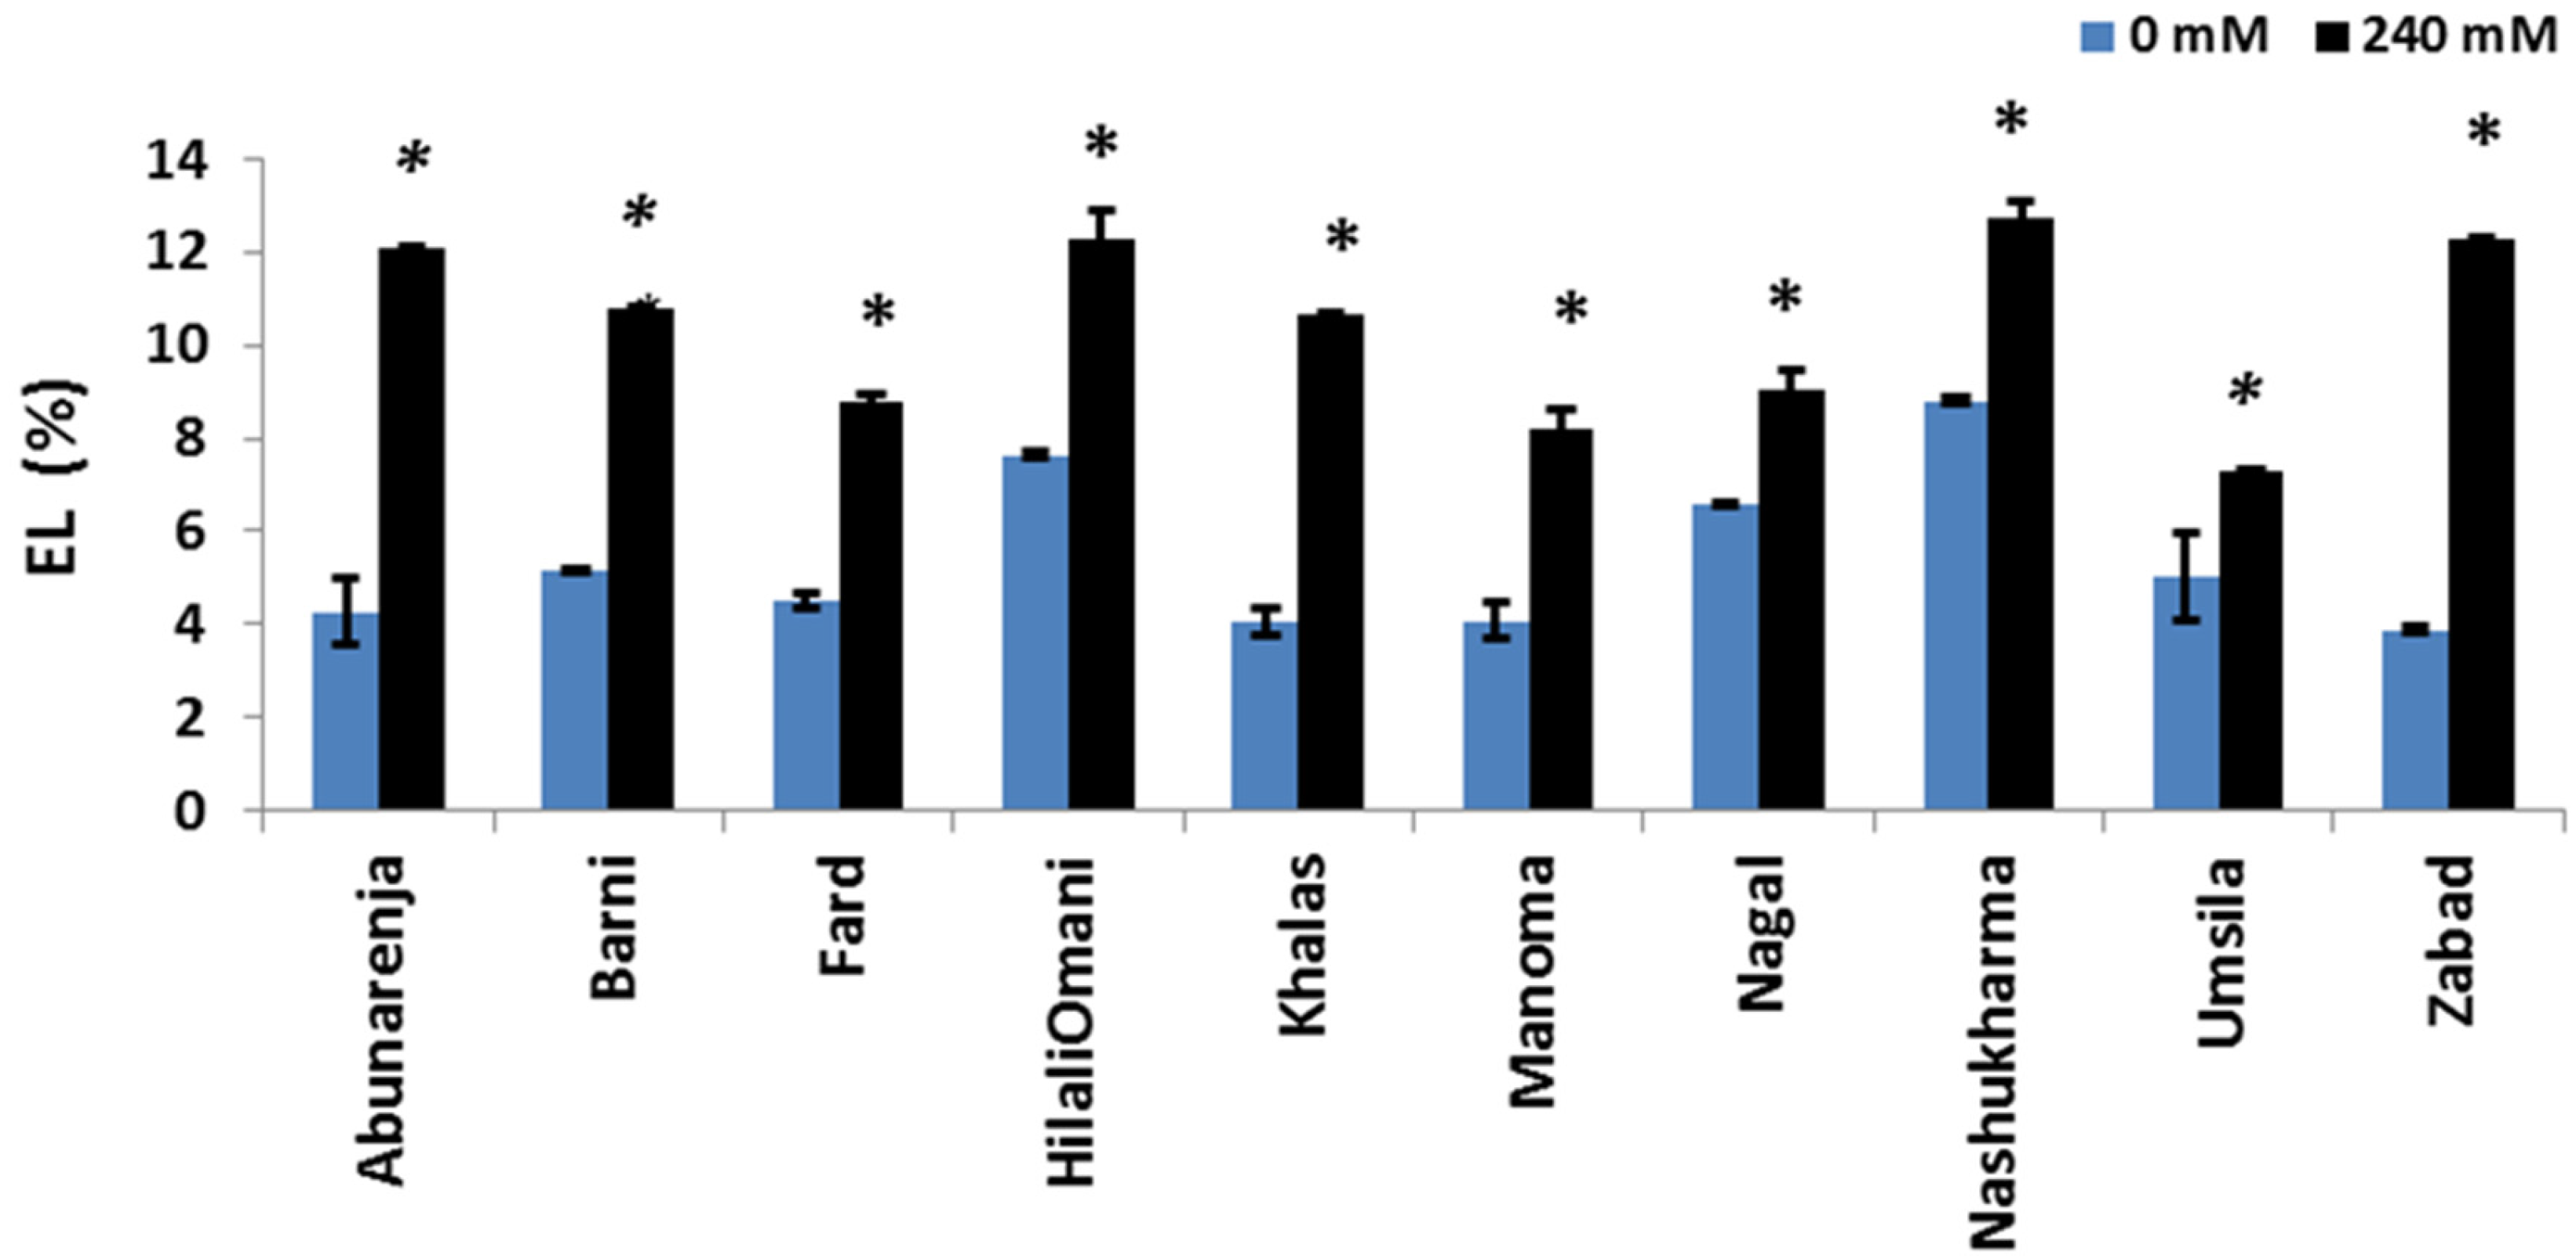
The maintenance of membrane integrity under salt stress in order to avoid electrolyte leakage is an important salt tolerance strategy. To determine whether or not NaCl induced membrane damage in the cultivars, the EL (%) of all the cultivars was measured. The results showed that Umsila and Manoma had significantly lower electrolyte leakage (7.3% and 8.2%, respectively) (p ≤ 0.05) compared to the control, while Nashukharma and Zabad had higher electrolyte leakage percentages (12.7% and 12.3%, respectively) compared to the control (Figure 7).
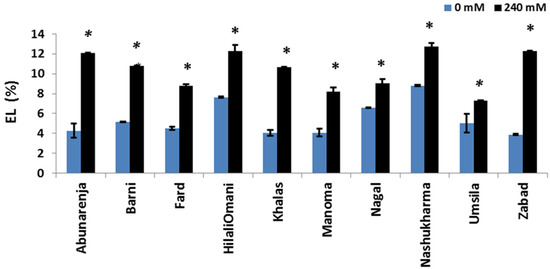
Figure 7.
Effect of salinity on electrolyte leakage (EL %) of date palm cultivars grown under 0 mM and 240 mM NaCl conditions. Significant (p ≤ 0.05) differences are marked with an asterisk.
3.8. Interaction Effects between Cultivars and Treatments
Correlations and interaction effects between the cultivars and treatments based on different measured parameters were carried out using analysis of variance (two-way-ANOVA) and Pearson’s correlation coefficient (r). The results showed that significant (p ≤ 0.05) interaction effects between cultivars and treatments were found in all measured parameters except for the intercellular CO2 concentration (Ci) (p = 0.444) and the chlorophyll content (p = 0.555). Data are shown in Supplementary Material (Table S1). A negative significant (p = 0.0) correlation was found between sodium (Na+) and dry weight of the roots (DWR) and shoot tissues (DWS), and also between electrolyte leakage (EL) and water use efficiency (WUE). However, a positive correlation was observed between sodium concentration (Na+) and electrolyte leakage (EL), between photosynthetic rate (A) and the dry weight of shoot (DWS), the stomatal conductance (g), the leaf area (LA), and the chlorophyll a and b contents (Chla+b). Data are presented in Supplementary Material (Table S2).
4. Discussion
The present study sought to screen 10 date palm cultivars for salt stress tolerance and to determine the mechanisms underlying their tolerance or susceptibility. Similar approaches were previously used to screen salinity tolerance in cultivars of other plant species such as rice [35] and wheat [36]. However, before examining this issue, it is worth noting that date palm is a salt stress-tolerant plant that is able to withstand salinities of up to 24 dS/m [26]. In a preliminary screening under different NaCl concentrations (160, 240, and 320 mM), we observed that there were no significant differences in growth among the cultivars under conditions of moderate salinity (160 mM) due to insufficient salt stress. Likewise, no significant differences were noticed when the cultivars were subjected to higher levels salinity (320 mM NaCl), which was probably due to the severe stress decreasing their growth to similar levels Only the 240 mM stress condition produced significant differences among the cultivars, and was therefore chosen for this study.
The results under this stress condition (240 mM NaCl) revealed two distinct plant groups based on growth (Figure 1). The first group, deemed to be salt-sensitive, had a higher percentage of shoot growth reduction (>60%) when compared to the controls and include Abunarenja, Nashukharma, Barni, HilaliOmani, Zabad, and Khalas, while in the second group (salt-tolerant), the reduction in shoot growth was ≤40% and included Manoma, Umsila, Fard, and Nagal. Statistical analysis showed a significant interaction effect between cultivars and treatments on both shoot and root dry weight. Information is presented in Supplementary Material (Table S1). This finding supports the grouping method used in this study.
A high net photosynthetic rate under salt stress will normally lead to increased biomass production and hence plant growth, implying that the photosynthetic rate will be directly proportional to salt stress tolerance. However, salt stress negatively affects various components of the photosynthetic process, including stomatal closure and the inhibition of mesophyll conductance to CO2 diffusion, which limit CO2 availability for carboxylation, as well as chlorophyll content and damage to the photosynthetic machinery, with reduced or arrested electron transport for the production of reductants (NADPH) and ATP for the Calvin cycle [21]. Interestingly, a clear interaction effect between the cultivars and the treatments in terms of most photosynthesis parameters was found in this study, therefore, this notion is consistent with the previously published works [21].
Damage to the photosynthetic machinery is often ascertained by measuring the quantum yield efficiency of PSII (Qy) [37]. A reduction in this parameter is an indication of a compromised photosynthetic system. In the present study, the tolerant cultivars (Umsila, Manoma, Fard, and Nagal) had a relatively higher A than the rest of the cultivars under salt stress (Figure 2A), with concomitantly higher levels of gs and E (Figure 2C,D), clearly indicating that photosynthesis constitutes an important stress tolerance mechanism in these cultivars. This higher A is due to a higher gs and E, and limited CO2 diffusion may be the cause of A reduction in the other cultivars. In the present study, the reduction of Ci in all 10 cultivars under stress may be due to the direct effect of the reduction in stomatal conductance (stomatal limitation) [38]. The reduction in photosynthesis can be direct, such as a decrease in CO2 concentration caused by stomatal closure or mesophyll conductance [38,39].
This CO2 limitation of A has previously been reported for other date palm cultivars, including Khalas, which is used in the present study [21,23]. Similarly, these same tolerant cultivars maintained relatively higher Qy levels compared to all of the other cultivars (Figure 1F), as well as a high leaf area (Figure 3), which indicates that stomatal limitation and damage to photosynthetic machinery are major contributing factors in photosynthetic reduction and, consequently, growth reduction in the sensitive cultivars. Chlorophyll concentration, on the contrary, was not consistent with photosynthetic patterns (r = 0.336, p = 0.034), indicating that it may only play a minor role in the photosynthetic activity of these cultivars and is thus not a reliable stress tolerance trait. Based on these results and the strong correlation between A and growth (r = 0.879, p < 0.000), it can be concluded that photosynthesis is an important stress tolerance trait in date palms.
Decreased RWC can potentially retard plant growth under salt stress [40]. In the present study, the RWC declined for all the cultivars, but the decline was more pronounced in the susceptible plants (e.g., Zabad: <60%) (Figure 5). This result indicates that RWC is a contributing factor in stress sensitivity for some of the sensitive cultivars.
In addition to Cl−, Na+ ions are the most destructive element when plants are exposed to salinity [41]. Aside from inducing osmotic stress at the onset of salt stress, its accumulation, especially in photosynthetic tissues, is highly deleterious as it mainly interferes with K+ functions, including deactivating enzymes [42,43]. K+ fulfils multiple functions in plants, including turgor maintenance, stomatal regulation, and intracellular pH regulation [44]. Thus, the inhibition of K+ uptake by Na+ induces K+ deficiency, and consequently, the obstruction of K-dependent processes. It is for this reason that Na+ exclusion and the resultant maintenance of high cytosolic K+/Na+ ratios is a key salt tolerance trait [8,11]. In the present study, while the sensitive cultivars (Zabad, Nashukharma, Abunarenja, HilaliOmani, Barni, and Khalas) maintained higher Na+ concentrations in the roots under salt stress, the tolerant ones (Umsila, Nagal, Fard, and Manoma) maintained lower concentrations. All of the cultivars, with the exception of Zabad, had elevated K+ concentrations in the shoots under salt stress. However, given the higher Na+ concentrations in the shoots of the sensitive cultivars, their shoot Na+/K+ ratios were much higher than those of the tolerant ones (Figure 6C). This was especially true of Zabad, which showed a shoot Na+/K+ ratio of >4, attributable to a decreased K+ concentration in the shoots under salt stress. Most significantly, the reduction in K+ concentrations in Zabad roots increased the possibility of Na+-induced K+ leakage. K+ leakage is one of the main traits that indicates sensitivity to salt stress, and a plant’s ability to prevent it under salt stress constitutes a key tolerance mechanism [45,46]. This result shows that Na+ exclusion in the shoots, with the concomitant enhanced accumulation of K+, is very important in salt stress adaptation in date palms, especially given the strong negative relationship between Na+ and growth (r = −0.866, p < 0.000). Indeed, this trait was earlier shown to account for the tolerance of another date palm cultivar, Medjool, to salt stress [21].
5. Conclusions
The adaptation of date palms to salinity involves mechanisms for Na+ exclusion in the leaf, and the regulation of oxidative damage and photosynthesis. The screening has revealed two groups: tolerant and sensitive cultivars. Within the group of tolerant cultivars, Manoma and Umsila had more tolerance potential, with high Na+ exclusion from the leaves, low electrolyte leakage, and a high dry shoot and root weight. These traits accounted for their superior tolerance to conditions of high salinity. On the other hand, among the sensitive cultivars, Zabad showed more sensitivity with low Na+ exclusion from the leaves, a high electrolyte leakage, and a low dry shoot and root weight, and these parameters potentially contributed to its susceptibility to high salinity.
Supplementary Materials
The following are available online at www.mdpi.com/1999-4907/8/4/136/s1, Table S1. Analysis of variance (Two-Way-ANOVA) showing the interaction between cultivars (F1) and treatments (F2). DWS stands for shoot dry weight, DWR stands for root dry weight, EL% stands for electrolyte leakage, Na+S stands for sodium in the shoot, K+S stands for potassium in the shoot, Na+/K+shoot Ratio stands for shoot sodium potassium ratio, Na+R stands for sodium in the root, K+R stands for potassium in the root, Na+/K+root Ratio stands for root sodium potassium ratio, Ci stands for intercellular CO2 concentration, E stands for transpiration rate, gs stands for stomatal conductance, A stands for photosynthetic rate, WUE stands for water use efficiency, Qy stands for quantum yield, LA stands for leaf area, and RWC % stands for relative water content; Table S2. The Pearson’s correlation coefficient (r) and p-values measured for different parameters. Na+ stands for sodium ions, DWS stands for shoot dry weight, DWR stands for root dry weight, EL stands for electrolyte leakage, A stands for photosynthetic rate, gs stands for stomatal conductance, RWC % stands for relative water content, Chla+b stands for chlorophyll a and b, LA stands for leaf area, WUE stands for water use efficiency, and Ci stands for intercellular CO2 concentration.
Acknowledgments
This project was supported by the generous grant number 151 from the research council (TRC), Oman.
Author Contributions
L.A.K. and D.M.A. conceived, designed, and performed the experiments, analyzed data, and wrote the manuscript, R.A.Y. designed the experiment and M.W.Y. designed the experiment, wrote the manuscript, and contributed reagents/materials/analysis tools.
Conflicts of Interest
The authors declare no conflict of interest.
References
- Shabala, S. Learning from halophytes: Physiological basis and strategies to improve abiotic stress tolerance in crops. Ann. Bot. 2013, 112, 1209–1221. [Google Scholar] [CrossRef] [PubMed]
- Munns, R. Comparative physiology of salt and water stress. Plant Cell Environ. 2002, 25, 239–250. [Google Scholar] [CrossRef] [PubMed]
- Tattini, M.; Melgar, J.; Traversi, M. Responses of olea europaea to high salinity: A brief-ecophysiological-review. Adv. Hortic. Sci. 2008, 22, 159–173. [Google Scholar]
- Garcı́a-Sánchez, F.; Jifon, J.L.; Carvajal, M.; Syvertsen, J.P. Gas exchange, chlorophyll and nutrient contents in relation to NA+ and Cl− accumulation in ‘sunburst’ mandarin grafted on different rootstocks. Plant Sci. 2002, 162, 705–712. [Google Scholar] [CrossRef]
- Santos, C.V. Regulation of chlorophyll biosynthesis and degradation by salt stress in sunflower leaves. Sci. Hort. 2004, 103, 93–99. [Google Scholar] [CrossRef]
- Gill, S.S.; Tuteja, N. Reactive oxygen species and antioxidant machinery in abiotic stress tolerance in crop plants. Plant Physiol. Biochem. 2010, 48, 909–930. [Google Scholar] [CrossRef] [PubMed]
- Anschütz, U.; Becker, D.; Shabala, S. Going beyond nutrition: Regulation of potassium homoeostasis as a common denominator of plant adaptive responses to environment. J. Plant Physiol. 2014, 171, 670–687. [Google Scholar] [CrossRef] [PubMed]
- Plett, D.C.; Møller, I. Na+ transport in glycophytic plants: What we know and would like to know. Plant Cell Environ. 2010, 33, 612–626. [Google Scholar] [CrossRef] [PubMed]
- Wang, M.; Zheng, Q.; Shen, Q.; Guo, S. The critical role of potassium in plant stress response. Int. J. Mol. Sci. 2013, 14, 7370–7390. [Google Scholar] [CrossRef] [PubMed]
- Assaha, D.V.; Mekawy, A.M.M.; Ueda, A.; Saneoka, H. Salinity-induced expression of hkt may be crucial for Na+ exclusion in the leaf blade of huckleberry (solanum scabrum mill.), but not of eggplant (Solanum melongena L.). Biochem. Biophys. Res. Commun. 2015, 460, 416–421. [Google Scholar] [CrossRef] [PubMed]
- Munns, R.; Tester, M. Mechanisms of salinity tolerance. Annu. Rev. Plant Biol. 2008, 59, 651–681. [Google Scholar] [CrossRef] [PubMed]
- Cotsaftis, O.; Plett, D.; Shirley, N.; Tester, M.; Hrmova, M. A two-staged model of Na+ exclusion in rice explained by 3d modeling of hkt transporters and alternative splicing. PLoS ONE 2012, 7, e39865. [Google Scholar] [CrossRef] [PubMed]
- Fujimaki, S.; Maruyama, T.; Suzui, N.; Kawachi, N.; Miwa, E.; Higuchi, K. Base to tip and long-distance transport of sodium in the root of common reed (phragmites australis (cav.) trin. Ex steud.) at steady state under constant high-salt conditions. Plant Cell Physiol. 2015, 56, 943–950. [Google Scholar] [PubMed]
- Vinocur, B.; Altman, A. Recent advances in engineering plant tolerance to abiotic stress: Achievements and limitations. Curr. Opin. Biotechnol. 2005, 16, 123–132. [Google Scholar] [CrossRef] [PubMed]
- Mekawy, A.M.M.; Assaha, D.V.; Yahagi, H.; Tada, Y.; Ueda, A.; Saneoka, H. Growth, physiological adaptation, and gene expression analysis of two egyptian rice cultivars under salt stress. Plant Physiol. Biochem. 2015, 87, 17–25. [Google Scholar] [CrossRef] [PubMed]
- Munns, R.; James, R.A.; Xu, B.; Athman, A.; Conn, S.J.; Jordans, C.; Byrt, C.S.; Hare, R.A.; Tyerman, S.D.; Tester, M. Wheat grain yield on saline soils is improved by an ancestral Na+ transporter gene. Nat. Biotechnol. 2012, 30, 360–364. [Google Scholar] [CrossRef] [PubMed]
- Al-Kateeb, S.; Al-Kateeb, A.; Ali-Dinar, H. Photosynthesis Efficiency of Date Palm Varieties Grown in Saudi Arabia; The Final Technical Report of the Research Project Submitted by the Date Palm Research Centre to the Deanship of Scientific Research; King Faisal University: Hofuf, Saudi Arabia, 2002. [Google Scholar]
- Alhammadi, M.S.; Kurup, S.S. Impact of Salinity Stress on Date Palm (Phoenix Dactylifera L.)—A Review; INTECH Open Access Publisher: Vienna, Austria, 2012. [Google Scholar]
- Aljuburi, H.J.; Maroff, A. The growth and mineral composition of hatamy date palm seedlings as affected by sea water and growth regulators. In Proceedings of the III International Date Palm Conference, Abu Dhabi, UAE, 19–21 February 2006; pp. 161–164. [Google Scholar]
- Alrasbi, S.A.R.; Hussain, N.; Schmeisky, H. Evaluation of the growth of date palm seedlings irrigated with saline water in the sultanate of Oman. In Proceedings of the IV International Date Palm Conference, Abu Dhabi, UAE, 15–17 March 2010; pp. 233–246. [Google Scholar]
- Sperling, O.; Lazarovitch, N.; Schwartz, A.; Shapira, O. Effects of high salinity irrigation on growth, gas-exchange, and photoprotection in date palms (Phoenix dactylifera L., cv. Medjool). Environ. Exp. Bot. 2014, 99, 100–109. [Google Scholar] [CrossRef]
- Yaish, M.W.; Kumar, P.P. Salt tolerance research in date palm tree (Phoenix dactylifera L.), past, present, and future perspectives. Front. Plant Sci. 2015, 6, 348. [Google Scholar] [CrossRef] [PubMed]
- Youssef, T.; Awad, M.A. Mechanisms of enhancing photosynthetic gas exchange in date palm seedlings (Phoenix dactylifera L.) under salinity stress by a 5-aminolevulinic acid-based fertilizer. J. Plant Growth Regul. 2008, 27, 1–9. [Google Scholar] [CrossRef]
- Al-Yahyai, R.; Al-Kharusi, L. Physical and chemical quality attributes of freeze-stored dates. Int. J. Agric. Biol. 2012, 14, 97–100. [Google Scholar]
- Aljuburi, H.V. Effect of sodium chloride on seedling growth of four date palm varieties. Ann. Arid Zone 1993, 31, 259–262. [Google Scholar]
- Yaish, M. Proline accumulation is a general response to abiotic stress in the date palm tree (Phoenix dactylifera L.). Genet. Mol. Res. 2015, 14, 9943–9950. [Google Scholar] [CrossRef] [PubMed]
- Assaha, D.V.; Ueda, A.; Saneoka, H. Comparison of growth and mineral accumulation of two solanaceous species, Solanum scabrum mill.(huckleberry) and S. Melongena l.(eggplant), under salinity stress. Soil Sci. Plant Nutr. 2013, 59, 912–920. [Google Scholar]
- Porra, R.; Thompson, W.; Kriedemann, P. Determination of accurate extinction coefficients and simultaneous equations for assaying chlorophylls a and b extracted with four different solvents: Verification of the concentration of chlorophyll standards by atomic absorption spectroscopy. Biochim. Biophys. Acta Bioenerg. 1989, 975, 384–394. [Google Scholar] [CrossRef]
- Barr, H.; Weatherley, P. A re-examination of the relative turgidity technique for estimating water deficit in leaves. Aust. J. Biol. Sci. 1962, 15, 28. [Google Scholar] [CrossRef]
- Reddy, A.R.; Chaitanya, K.V.; Vivekanandan, M. Drought-induced responses of photosynthesis and antioxidant metabolism in higher plants. J. Plant Physiol. 2004, 161, 1189–1202. [Google Scholar] [CrossRef]
- Assaha, D.V.M.; Liu, L.; Ueda, A.; Nagaoka, T.; Saneoka, H. Effects of drought stress on growth, solute accumulation and membrane stability of leafy vegetable, huckleberry (Solanum scabrum mill.). J. Environ. Biol. 2016, 37, 107. [Google Scholar] [PubMed]
- Meziane, D.; Shipley, B. Direct and indirect relationships between specific leaf area, leaf nitrogen and leaf gas exchange. Effects of irradiance and nutrient supply. Ann. Bot. 2001, 88, 915–927. [Google Scholar] [CrossRef]
- Blankenship, R.E. Molecular Mechanisms of Photosynthesis; John Wiley & Sons: Abingdon, Oxon, UK, 2013. [Google Scholar]
- Zhu, J.-K. Regulation of ion homeostasis under salt stress. Curr. Opin. Plant Biol. 2003, 6, 441–445. [Google Scholar] [CrossRef]
- Yeo, A.; Yeo, M.; Flowers, S.; Flowers, T. Screening of rice (Oryza sativa L.) genotypes for physiological characters contributing to salinity resistance, and their relationship to overall performance. TAG Theor. Appl. Genet. 1990, 79, 377–384. [Google Scholar] [CrossRef] [PubMed]
- Colmer, T.; Munns, R.; Flowers, T. Improving salt tolerance of wheat and barley: Future prospects. Anim. Prod. Sci. 2006, 45, 1425–1443. [Google Scholar] [CrossRef]
- Maxwell, K.; Johnson, G.N. Chlorophyll fluorescence—A practical guide. J. Exp. Bot. 2000, 51, 659–668. [Google Scholar] [PubMed]
- Flexas, J.; Bota, J.; Loreto, F.; Cornic, G.; Sharkey, T. Diffusive and metabolic limitations to photosynthesis under drought and salinity in C3 plants. Plant Biol. 2004, 6, 269–279. [Google Scholar] [CrossRef] [PubMed]
- Flexas, J.; DIAZ-ESPEJO, A.; GalmES, J.; Kaldenhoff, R.; Medrano, H.; RIBAS-CARBO, M. Rapid variations of mesophyll conductance in response to changes in Co2 concentration around leaves. Plant Cell Environ. 2007, 30, 1284–1298. [Google Scholar] [CrossRef] [PubMed]
- Ghoulam, C.; Foursy, A.; Fares, K. Effects of salt stress on growth, inorganic ions and proline accumulation in relation to osmotic adjustment in five sugar beet cultivars. Environ. Exper. Bot. 2002, 47, 39–50. [Google Scholar] [CrossRef]
- Flowers, T.J.; Munns, R.; Colmer, T.D. Sodium chloride toxicity and the cellular basis of salt tolerance in halophytes. Ann. Bot. 2015, 115, 419–431. [Google Scholar] [CrossRef] [PubMed]
- Cramer, G.R.; Lynch, J.; Läuchli, A.; Epstein, E. Influx of Na+, K+, and Ca2+ into roots of salt-stressed cotton seedlings effects of supplemental Ca2+. Plant Physiol. 1987, 83, 510–516. [Google Scholar] [CrossRef] [PubMed]
- Maathuis, F.J.; Amtmann, A. K+ nutrition and Na+ toxicity: The basis of cellular K+/Na+ ratios. Ann. Bot. 1999, 84, 123–133. [Google Scholar] [CrossRef]
- Shabala, S. Regulation of potassium transport in leaves: From molecular to tissue level. Ann. Bot. 2003, 92, 627–634. [Google Scholar] [CrossRef] [PubMed]
- Demidchik, V.; Cuin, T.A.; Svistunenko, D.; Smith, S.J.; Miller, A.J.; Shabala, S.; Sokolik, A.; Yurin, V. Arabidopsis root K+-efflux conductance activated by hydroxyl radicals: Single-channel properties, genetic basis and involvement in stress-induced cell death. J. Cell Sci. 2010, 123, 1468–1479. [Google Scholar] [CrossRef] [PubMed]
- Yaish, M.W.; Patankar, H.V.; Assaha, D.V.; Zheng, Y.; Al-Yahyai, R.; Sunkar, R. Genome-wide expression profiling in leaves and roots of date palm (Phoenix dactylifera L.) exposed to salinity. BMC Genom. 2017, 18, 246. [Google Scholar] [CrossRef] [PubMed]


© 2017 by the authors. Licensee MDPI, Basel, Switzerland. This article is an open access article distributed under the terms and conditions of the Creative Commons Attribution (CC BY) license (http://creativecommons.org/licenses/by/4.0/).