Article

Acute Oak Decline and Agrilus biguttatus: The Co-Occurrence of Stem Bleeding and D-Shaped Emergence Holes in Great Britain

1
Department of Life Sciences, Imperial College London, Silwood Park campus, Ascot SL5 7PY, UK
2
Centre for Ecosystems, Society and Biosecurity, Forest Research, Alice Holt Lodge, Farnham GU 4LH, UK
3
Department of Computational and Systems Biology, Rothamsted Research, Harpenden AL5 2JQ, UK
4
Centre for Environmental Policy, Imperial College London, Silwood Park campus, Ascot SL5 7PY, UK
5
NIAB East Malling Research (EMR), New Road, East Malling ME19 6BJ, UK
6
Animal and Plant Health Unit, European Food Safety Authority (EFSA), 43126 Parma, Italy
*
Author to whom correspondence should be addressed.
Forests 2017, 8(3), 87; https://doi.org/10.3390/f8030087
Submission received: 10 January 2017 / Revised: 2 March 2017 / Accepted: 14 March 2017 / Published: 17 March 2017

Abstract

:
Acute Oak Decline (AOD) is a new condition affecting both species of native oak, Quercus robur and Quercus petraea, in Great Britain. The decline is characterised by a distinctive set of externally visible stem symptoms; bark cracks that “weep” dark exudate are found above necrotic lesions in the inner bark. Emergence holes of the buprestid beetle, Agrilus biguttatus are often also seen on the stems of oak within affected woodlands. This investigation assesses the extent to which the external symptoms of these two agents co-occur and reveals the spatial and temporal patterns present in affected woodland. Annual monitoring in eight affected woodlands showed that stem bleeding and emergence holes frequently occur on the same trees, with new emergence holes significantly more likely to occur when trees already have stem bleeds. Trials with coloured prism traps confirm A. biguttatus was present at all experimental sites. Beetle emergence is linked primarily to a few heavily declining trees, indicating that susceptibility may vary between hosts and that those with reduced health may be predisposed to AOD. Stem bleeds occur on trees in close proximity to the locations of trees with exit holes.

1. Introduction

Acute Oak Decline (AOD) is a distinctive condition, within the wider decline complex affecting Britain’s native oaks, Quercus robur (Matt.) Leibl. and Quercus petraea L. [1]. Landowner reports collected between 2006 and 2016 suggest that the condition is widespread across southern and central England, with isolated occurrences in south Wales and along the Welsh borders [2,3]. In these regions AOD affects the health of oak species [1,3] that form the largest component of native woodland [4].
A broad definition of tree decline describes a syndrome involving multiple agents, which may act sequentially or in parallel, and will have a cumulative effect on the health of the host [5]. Declines often involve hosts and agents that have co-evolved and, as such, host trees are resilient with defences against insect and microbial incursions; however, environmental change can affect this balance [6,7]. For example, periods of drought are often linked to pest outbreaks [8,9,10,11], and are also thought to aid the development of necrogenic organisms [12]. In this manner, abiotic factors can act as predisposing factors that begin the decline process [5]. Declining forest health will have long term impacts, altering tree species composition, ecosystem dynamics and carbon balance of the affected woodland [13].
Frequently cited agents of oak decline include root and foliar pathogens, along with stem boring insects and defoliators [14,15]. AOD can readily be distinguished within this complex by a set of externally-visible symptoms on the main stem; bark cracks that “weep” dark exudate are caused by necrotic patches in the inner bark [1]. Stem bleeding on native oak is a defining feature of AOD, but may also occur around branch wounds or Armillaria infections although these result in very different patterns of symptom expression [1,16]. Two bacterial species, Gibbsiella quercinecans and Brenneria goodwinii are known to play important roles in AOD tissue necrosis [17,18,19]. Isolations have shown that a distinctive bacterial component is associated only with the lesions and decayed tissues of affected trees [3]. In addition, D-shaped emergence holes are often visible in the bark plates of affected oak, indicating the presence of Agrilus biguttatus Fab., a buprestid beetle whose larvae develop in oak phloem chewing sinuous galleries [2,20].
A wide range of insects have been found to inhabit the stems of Q. robur and Q. petraea at different successional stages of decline, including Scolytus intricatus (Ratzeburg), Xyleborus spp., Platypus cylindrus Fab. and various species of longhorn (cerambycid) beetles [21,22]; however, A. biguttatus is most frequently associated with AOD [2]. When AOD symptomatic trees were destructively sampled, 36 of 38 showed insect galleries clearly visible in close association with areas of necrosis [1] (Denman, personal communication). The network of galleries within the phloem disrupts its function, limiting the transport of carbohydrates and nutrients around the host. Oak infested by A. biguttatus have been described in Europe throughout the twentieth century, with affected trees documented as also exhibiting stem bleeding symptoms [21,23,24,25]. Historically, attempts to isolate pathogenic agents have focused on fungi and have not yielded consistent results [26,27,28]. Despite many anecdotal descriptions of a co-occurrence between A. biguttatus and stem bleeding the nature of the association requires further study.
Both bacterial necrosis and A. biguttatus have been implicated in the final stages of decline [1,2,21]. Certainly A. biguttatus has been described as a secondary pest [29] and an attraction to weakened trees has been documented for other Agrilus species [30] which respond to volatiles released by the host [31,32,33]. The degree of weakening required for successful colonisation by A. biguttutus is unclear. AOD stem bleeding has been observed on oak in all canopy condition categories; however, its severity is greatest on oaks with weakened crowns [20]. When other Agrilus species are found on naïve hosts they have been shown to colonise relatively healthy hosts [34,35]; although even in such favourable conditions weakened hosts improve larval development [36] and crown condition has been shown to predict the longevity of a tree´s survival [37]. It is likely that similar processes affect A. biguttatus, which may have a limited window of opportunity to infest predisposed, but live, hosts.
An important first step towards understanding the relationship between A. biguttatus and AOD lesions is to establish whether they co-occur. However, this first step does not describe the type of interaction [38,39]. If both agents are simply taking advantage of hosts at the same stage of decline, then any association would be purely coincidental. Further, a direct association with necrotic agents could occur without A. biguttatus having a role as a vector, as damage caused by larval feeding may simply create an area of disrupted tissue where the bacteria can establish [2,21]. Insects may also have a role in the transmission of pathogens between hosts, however an association in itself is not sufficient to suggest a role as a vector. Leach’s principles have been recently summarised as a four-step procedure required to confirm an insect’s role in the transmission of disease [39]. The principles culminate with experimental reproduction of disease by insect visitation under controlled conditions. Such experiments are beyond the scope of the present study; rather, the current study simply aims to assess the extent to which an association occurs between the AOD stem symptoms.
The objectives of this study are to:
  • Test the null hypothesis that the presence of stem bleeds and emergence holes on individual trees are independent.
  • Examine whether stem bleeds are more likely to occur on hosts before or after exit holes appear.
  • Assess the spatial relationship between symptom types (trees with emergence holes in relation to those with stem bleeds.
  • Determine the within year variation in symptom expression, whether the number of stem bleeds correlates with the number of new emergence holes.
  • Quantify the number of Agrilus species present within AOD affected woodland.
This set of analyses should establish not only whether a co-occurrence can be found, but also begin to define the relationship and causal sequence of symptom development.

2. Materials and Methods

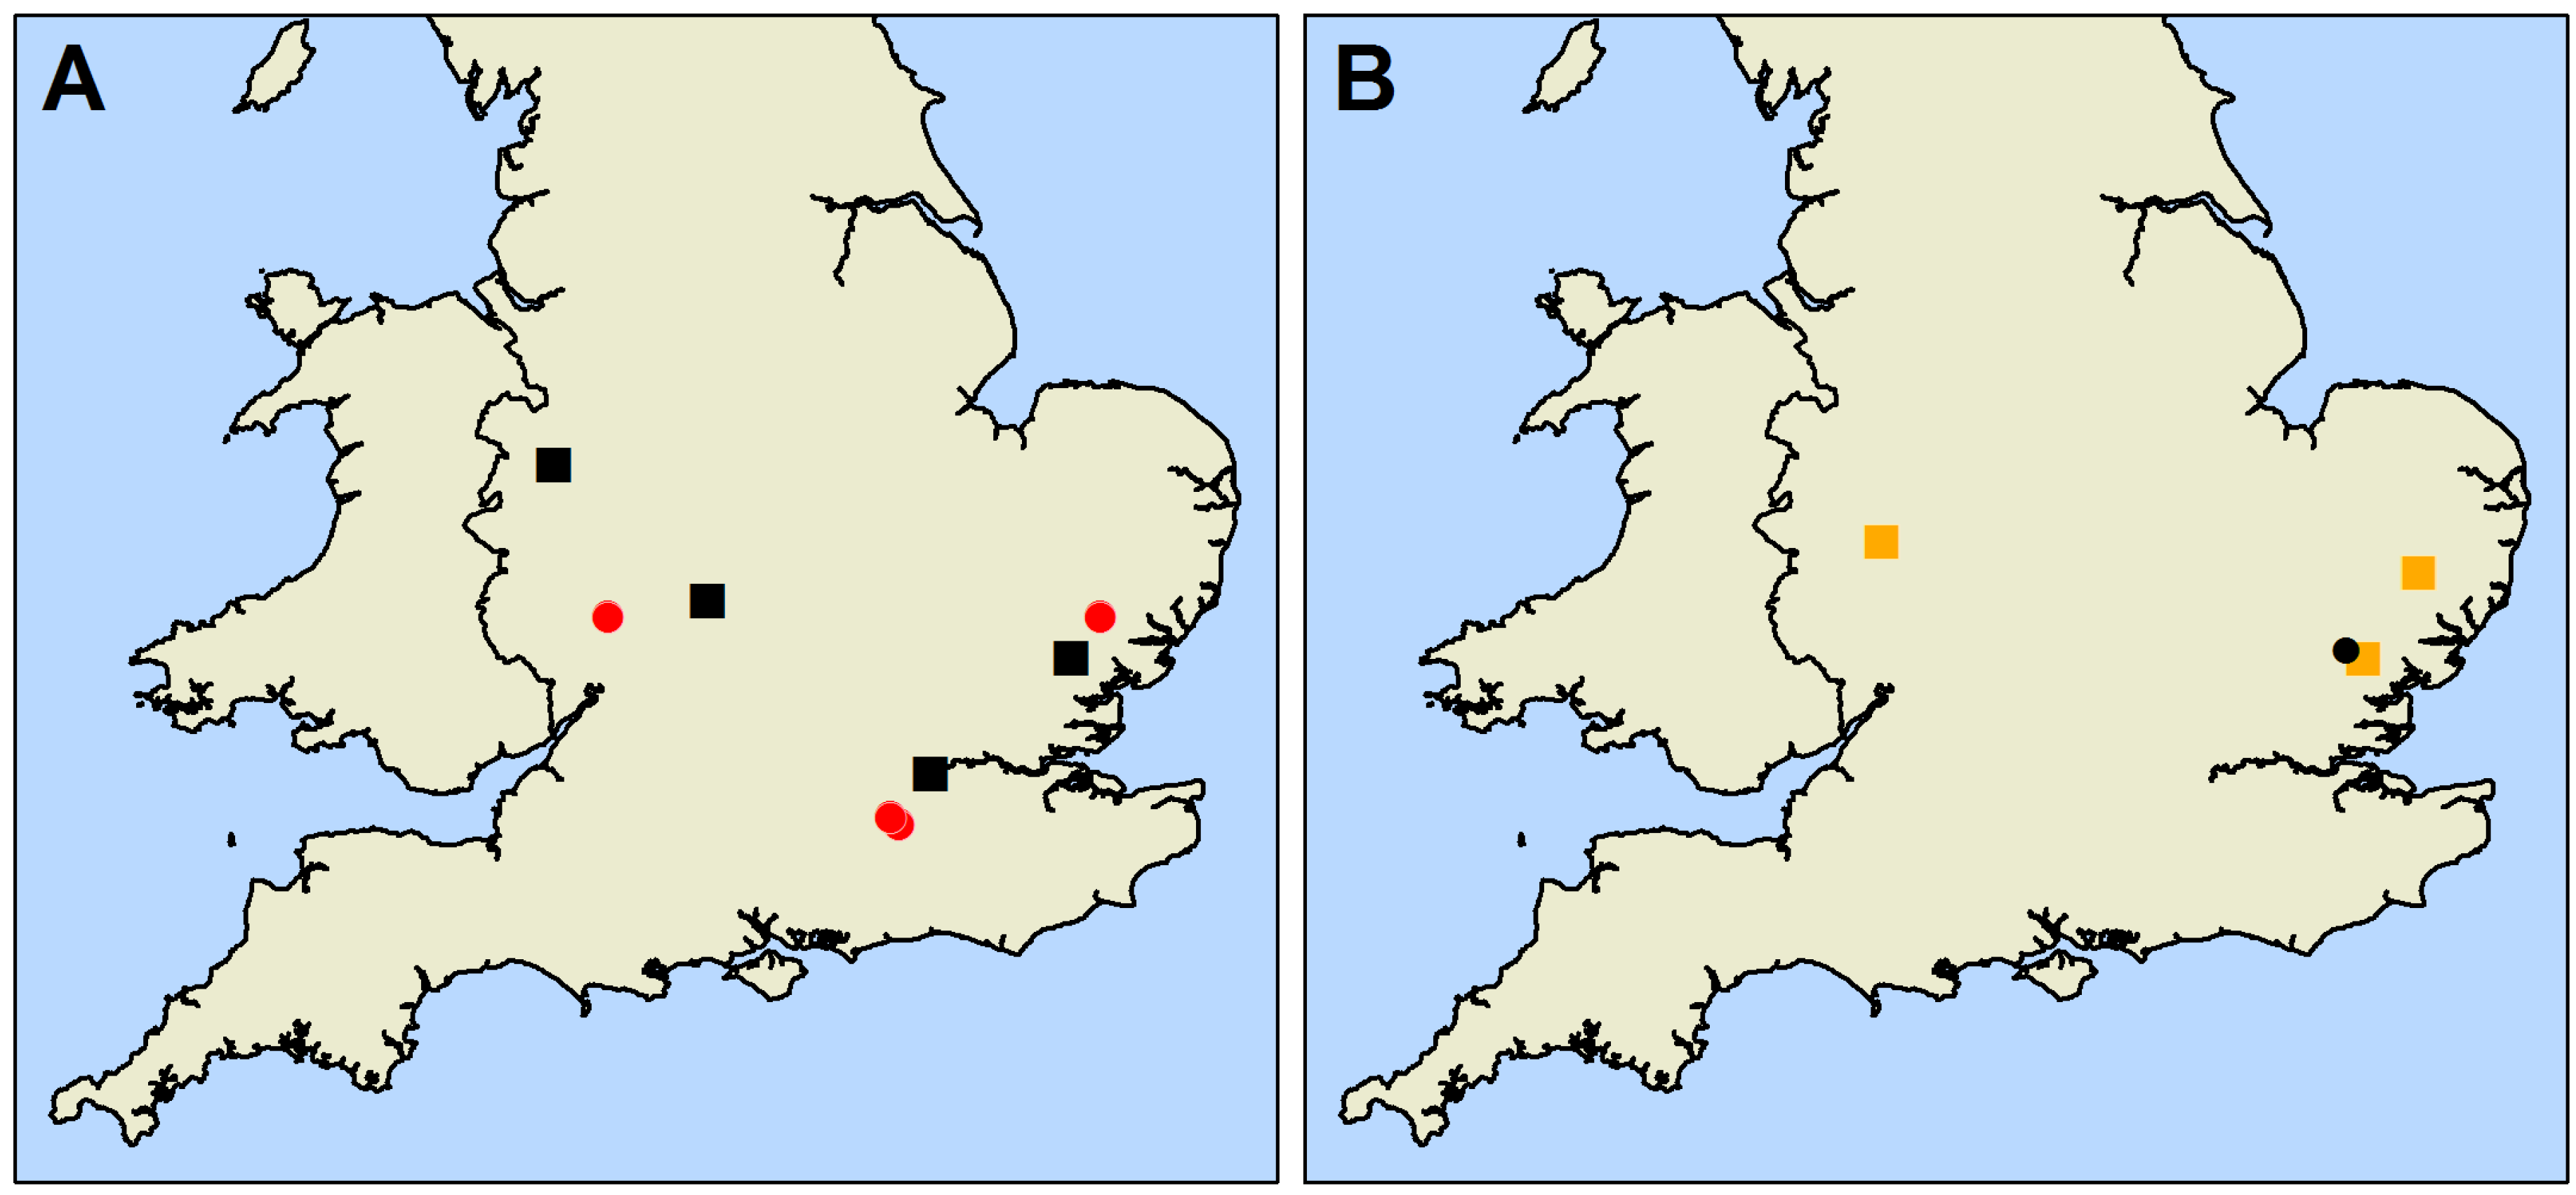
2.1. Mapping and Data Collection

Site selection: The analyses presented in this paper are based upon three data sources. Firstly, eight annually monitored woodland plots in Great Britain (Figure 1), where a complete census of all trees (greater than 15 cm in diameter at 1.3 m) was conducted. These provide the data for the majority of analyses. Secondly, a sub-sample of 40 trees was selected for intensive monitoring (2 sites, each with 20 trees); these were monitored every four weeks to investigate the within season dynamics at AOD sites (full details are presented below). Finally, trapping studies were conducted in woodlands affected by AOD (Figure 1).
The eight annual monitoring sites (Figure 1) were selected from oak decline enquiries received by Forest Research from 2006 to 2008; as such, they were not a random sample of all potential sites. The essential factors that influenced site choice were the presence of AOD symptoms on site, and the willingness of landowners to allow access. The first four sites were established in 2009 for monitoring with an additional four in 2010. The area to be monitored was selected so that its boundaries followed natural landscape divisions; therefore, monitoring sites included either entire small woodlands, or a distinct block of a forest. The number of individual oak varied between sites from 115 to 260. All monitoring sites contained predominantly Q. robur, although the density of trees and understorey varied, along with management regimes (a more complete description of the sites and their characteristics is provided by Brown et al., 2016 and summarised in Table 1).
Mapping: At each site the location of all trees was recorded in order to examine the spatial relationship between symptom types (trees with emergence holes and/or stem bleeds). Locations were measured by using a Global Positioning System (GPS) receiver: Pathfinder ProXT (Trimble, Sunnyvale, CA, USA). An external antenna and geo-beacon were used to maximise accuracy in forest environments where clear signal reception is hampered by canopy cover. The GPS unit used in this study is accurate to less than 1 m.
Data Collection: Annual monitoring took place between May and August over the years 2009–2012. Sites were visited in the same sequence each year; although the survey weeks varied dependent on when leaves became fully flushed.
All tree species present (with diameters greater than 15 cm at a height of 1.3 m) were recorded and mapped. For native oaks, additional data were collected documenting the presence or absence of bleeding symptoms and the presence of D-shaped A. biguttatus emergence holes, as both were assessed from the ground, emergence holes were only visible on the lower portion of the stem.

2.2. Co-Occurrence of Stem Symptoms and Emergence Holes

Annual trends were calculated by combining data from all monitoring sites, due to small counts of trees with emergence holes but without bleeds at the individual sites. The combined data were sorted into one of four categories depending on the symptoms expressed, where the trees were: (a) asymptomatic; (b) had stem bleeds only; (c) had emergence holes only; or (d) had both stem bleeds and exit holes. A χ2 test was used to test the null hypothesis that the presence of stem bleeds and emergence holes on individual trees were independent.

2.3. Sequential Development of External Symptoms and Signs

Assessment of the order of symptom development began by estimating two conditional probabilities: the probability of emergence holes occurring on trees with stem bleeds (number of new trees with emergence holes that previously had stem bleeds/number of trees with stem bleeds only in the previous year); and the probability of emergence holes appearing on asymptomatic trees (number of new trees with exit holes on trees without exit holes/number of asymptomatic trees in the previous year). This latter probability included trees where both sets of symptoms occurred for the first time in the same year. Relative risk (RR) was calculated based on two conditional probabilities, by simply dividing the former by the latter. RR is a ratio which indicates whether a tree having stem bleeds in the previous year makes the occurrence of emergence holes more likely; values above one indicate that this is the case. Significance was tested by calculating 95% confidence intervals (CI) based on log (RR), if these do not overlap 1 the relationship is significant at the 5% level [40].

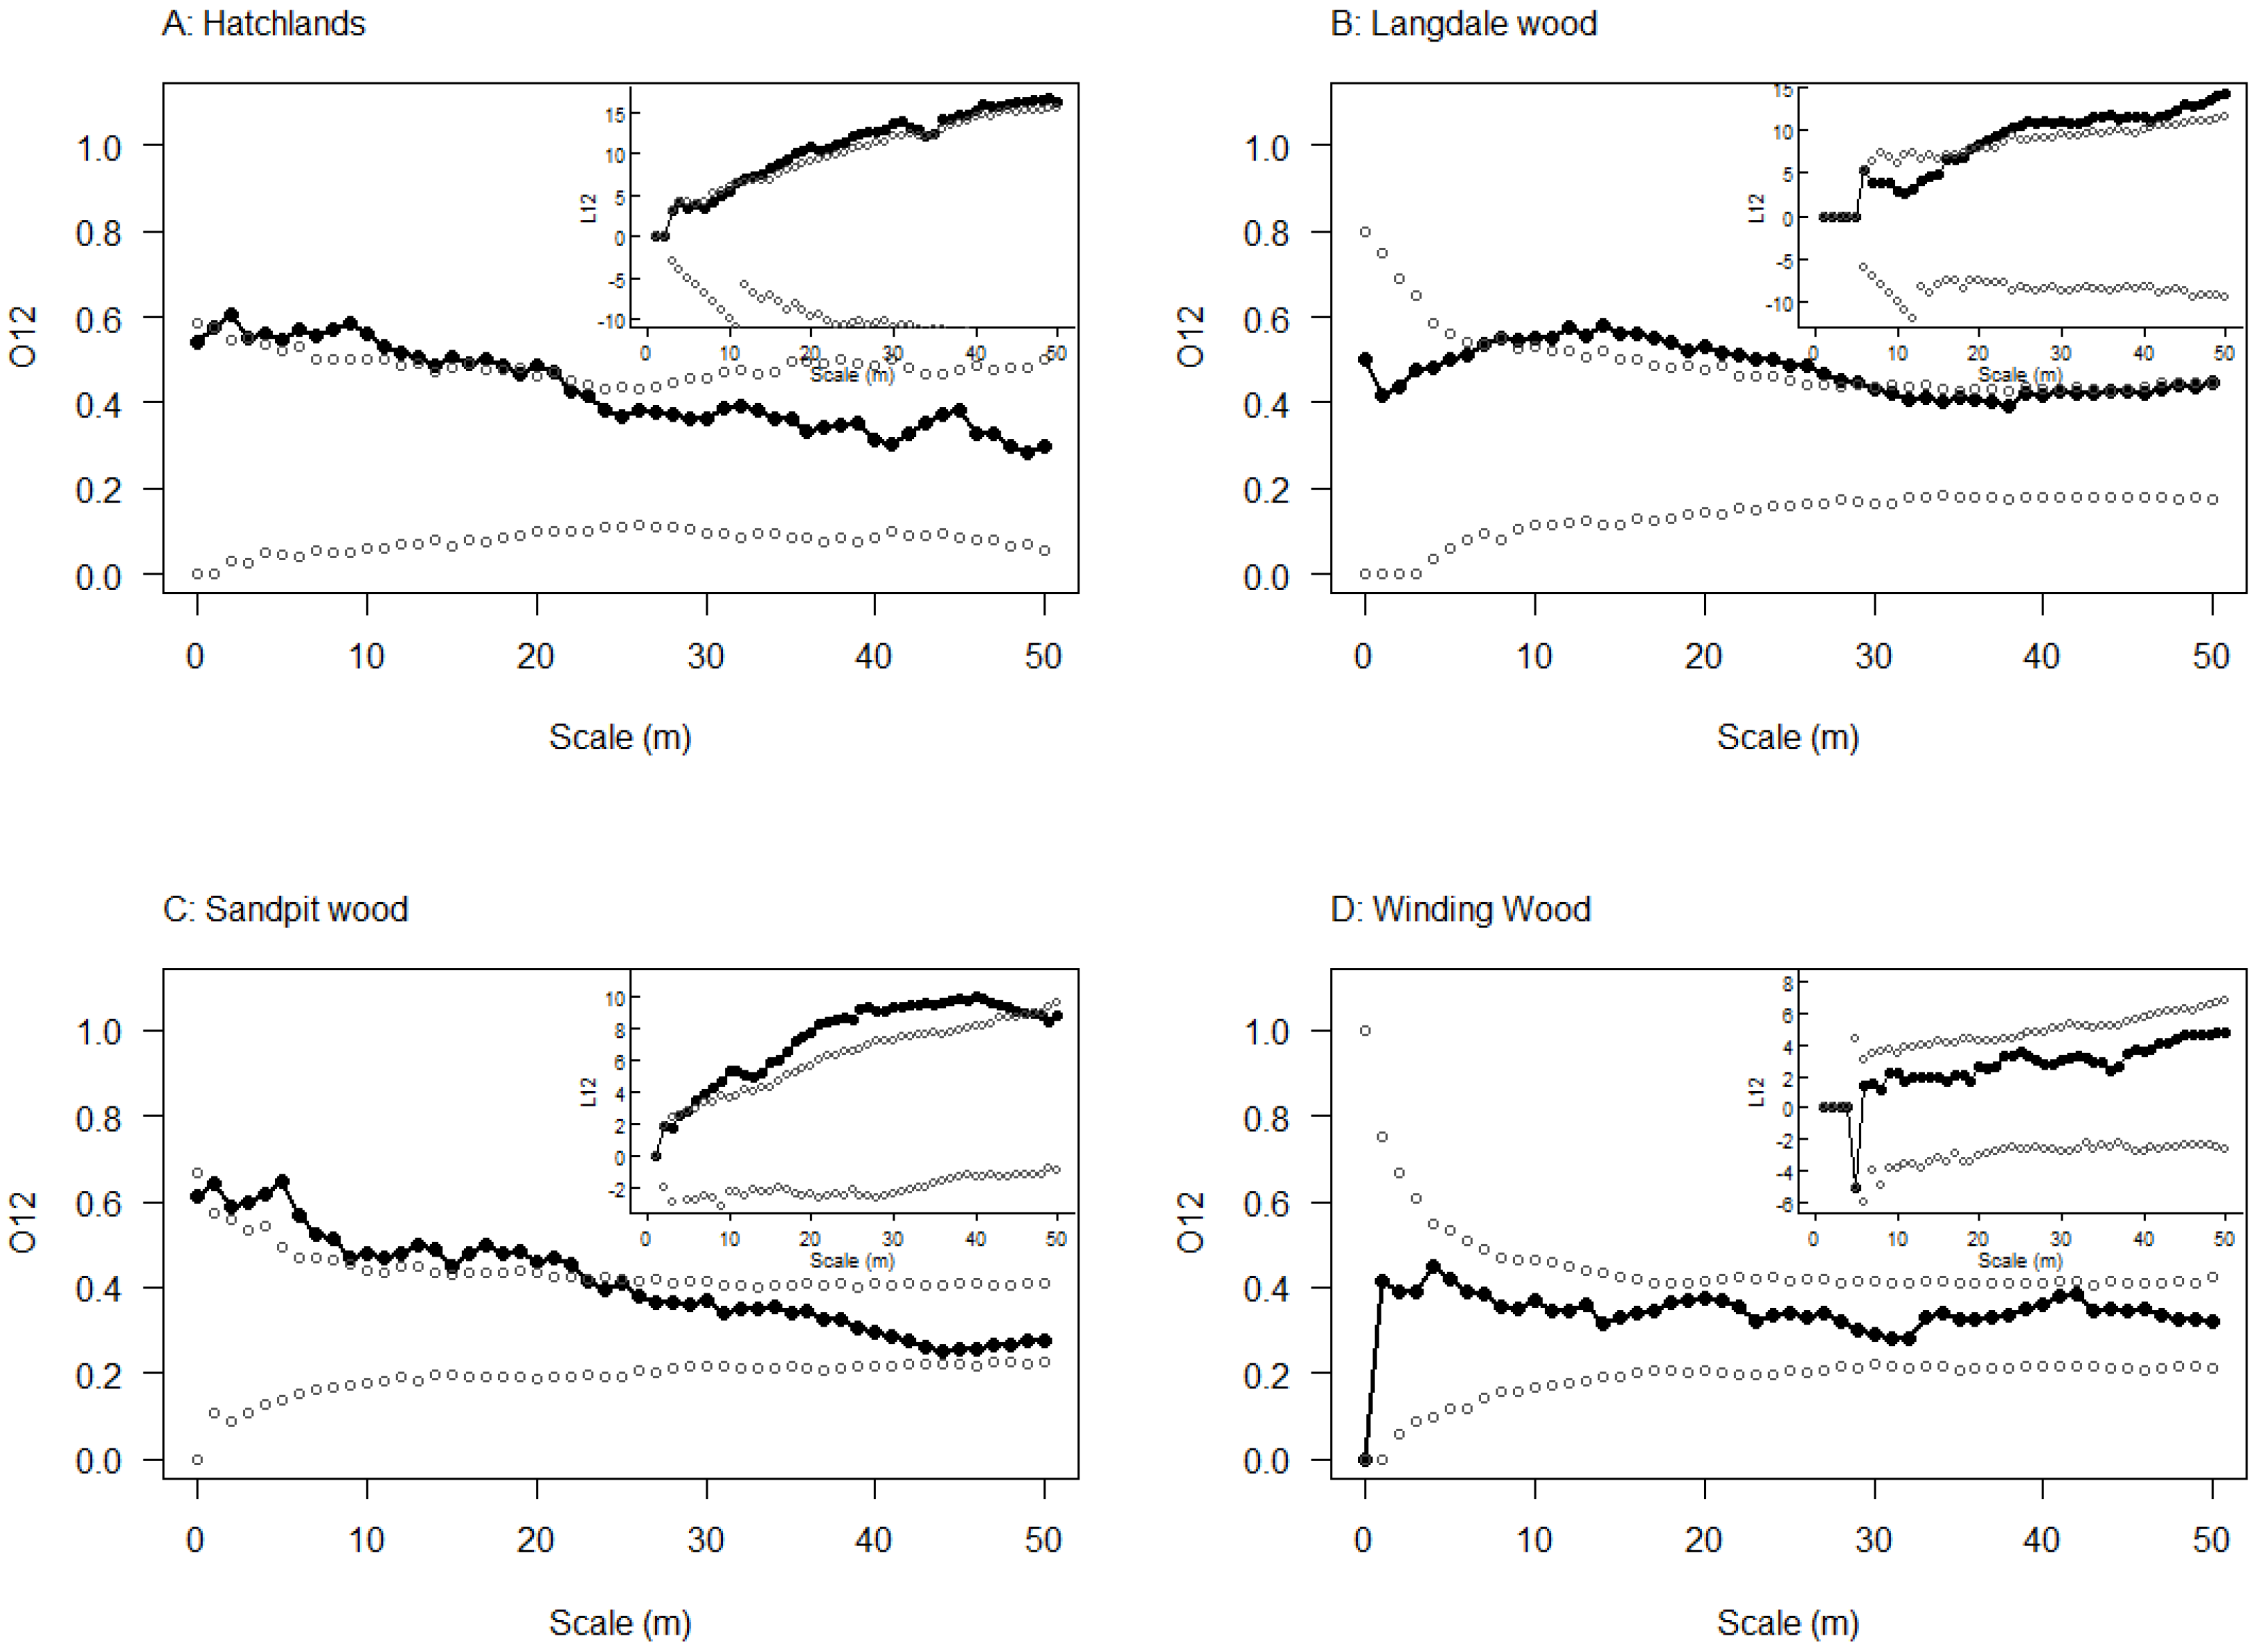
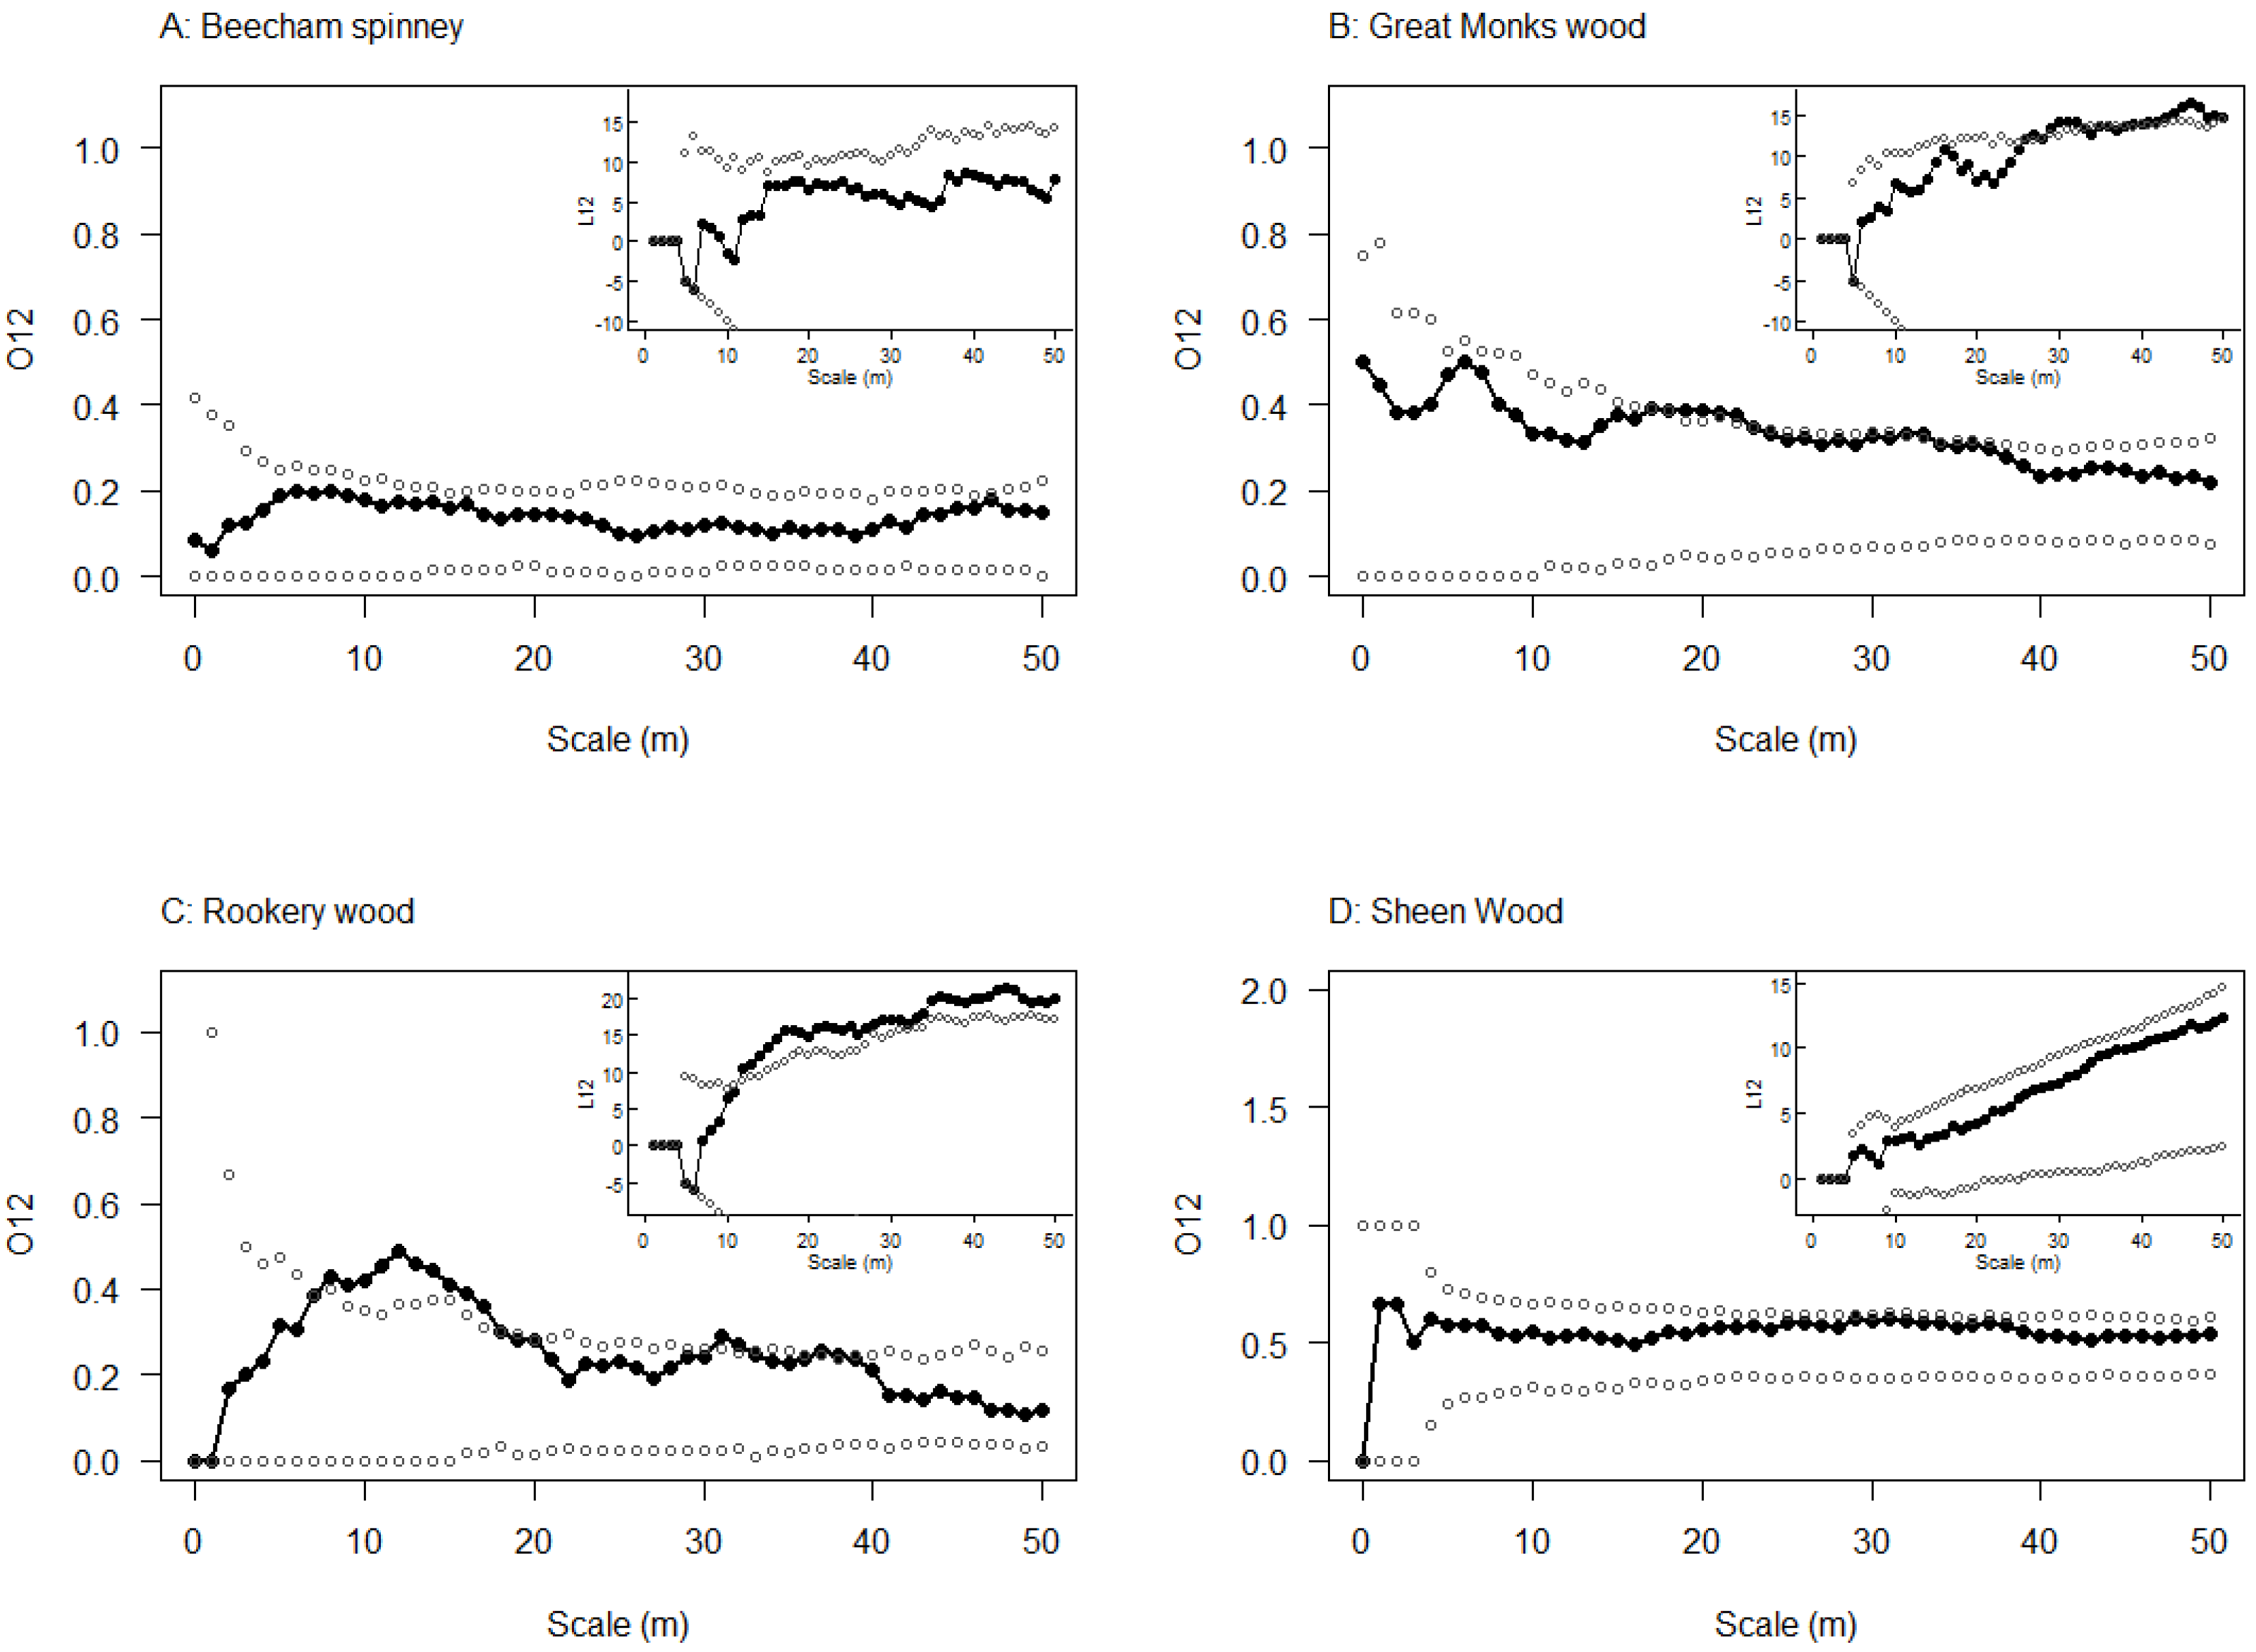
2.4. Spatial Relationship between Emergence Holes and Stem Bleeds

Ripley’s k, the L function and the O-ring statistic: Spatial analyses were conducted to investigate the relationship between trees with emergence holes and trees with stem bleeds. Each of the spatial analyses in this paper used two variants of the Ripley’s K function (K(t)). The first, a cumulative test, assesses local clustering using circular areas centred on trees that were observed with emergence holes; whereas a second was used to detect clustering at specific distances using an area defined by a hollow ring [41,42]. The first, known as the L function (L(t)), is the square root transformation of Ripley’s K, function and was used to show the cumulative effect of clustering as distance increased. Ripley’s K function uses the local density of a pattern and compares it to the overall density across a study area [43]. To do this each tree with emergence holes has a circle with radius t centred on it. At each tree the local density was assessed by counting the number of trees with stem bleeds (irrespective of presence of emergence holes on these trees) that fall inside the area. Local density is then compared to the overall density of stem bleeds (λ). As the statistic K(t) is a function of t, it assesses clustering at multiple distances (at different values of t).
Kij(t) = λ−1 Expected (number of trees with stem bleeds j within distance t of a randomly chosen tree with emergence holes i)
The L function, a square root transformation of K(t) which expresses clustering due to radial distance rather than area [41] was used in all analyses.
L i j = k i j π t
The second assessment used the O-ring function (O(t)) which assessed clustering at specific distances, Kij(t) is the accumulative version of the pair correlation function gij(t); as such gij(t) describes the rate of change in Kij(t) [44]:
g i j ( t ) = d k i j ( t ) d t / 2 π t
when replacing circles of radius t with rings of radius t.
Oij is related to the bivariate pair correlation function gij, giving the expected number of points of pattern j at distance t [41]:
O i j ( t ) = λ j g i j ( t )
when replacing circles of radius t with rings of radius t.
Analyses were conducted using programmita [45], where the numerical implementations of the above statistics allowed for a choice of ring widths. If the ring is narrow, gij(t) will be close to its theoretical value, but may also vary erratically with distance (especially when the number of samples is small and they are sparsely distributed). The width should be large enough to find another point of the pattern within the area, but if the width is too large then resolution is lost [41].
Edge effects, where part of a circle or ring falls outside the study site, are corrected by simply adjusting the local density to include only the area that falls inside the study site.
Assessing significance: Significance was tested by Monte Carlo simulation. Random patterns of disease were generated across the fixed locations of oak trees and values of Lij(t) and Oij(t) were generated for the simulated data. The extreme values generated from the randomised patterns were used as simulation envelopes. When the observed pattern exceeded the simulation envelopes, clustering was deemed significant [42].
Analysis: All trees with emergence holes were classed as pattern i and those with stem bleeds only as pattern j. In these analyses the pattern of AOD stem bleeds could show no association or be locally clustered around emergence hole trees. An irregularly shaped study area was defined to include only the coordinates of living oak, enabling simulations to randomly assign disease symptoms (stem bleeding) across the locations of available hosts.
Analysis was conducted for all eight study sites independently, and considered the positions of all live host oak. Patterns of stem bleeds and emergence holes were considered across all time points during the monitoring to give the cumulative effect of the relationship. For all sites cell size was fixed to 1 m2. At each site both L and O functions were used in the analysis. O-rings width was influenced by the distance of biological interactions [46], which was restricted by tree spacing. Rings were 10 m in width at densely-planted sites (Rookery wood, Sandpit wood, Sheen wood, Winding wood) and 20 m at the remaining, more open, sites. The analysis used the fifth most extreme value from 4999 simulations, to give envelopes that give global significance of approximately 5% and account for repeated inference across distance scales [47].

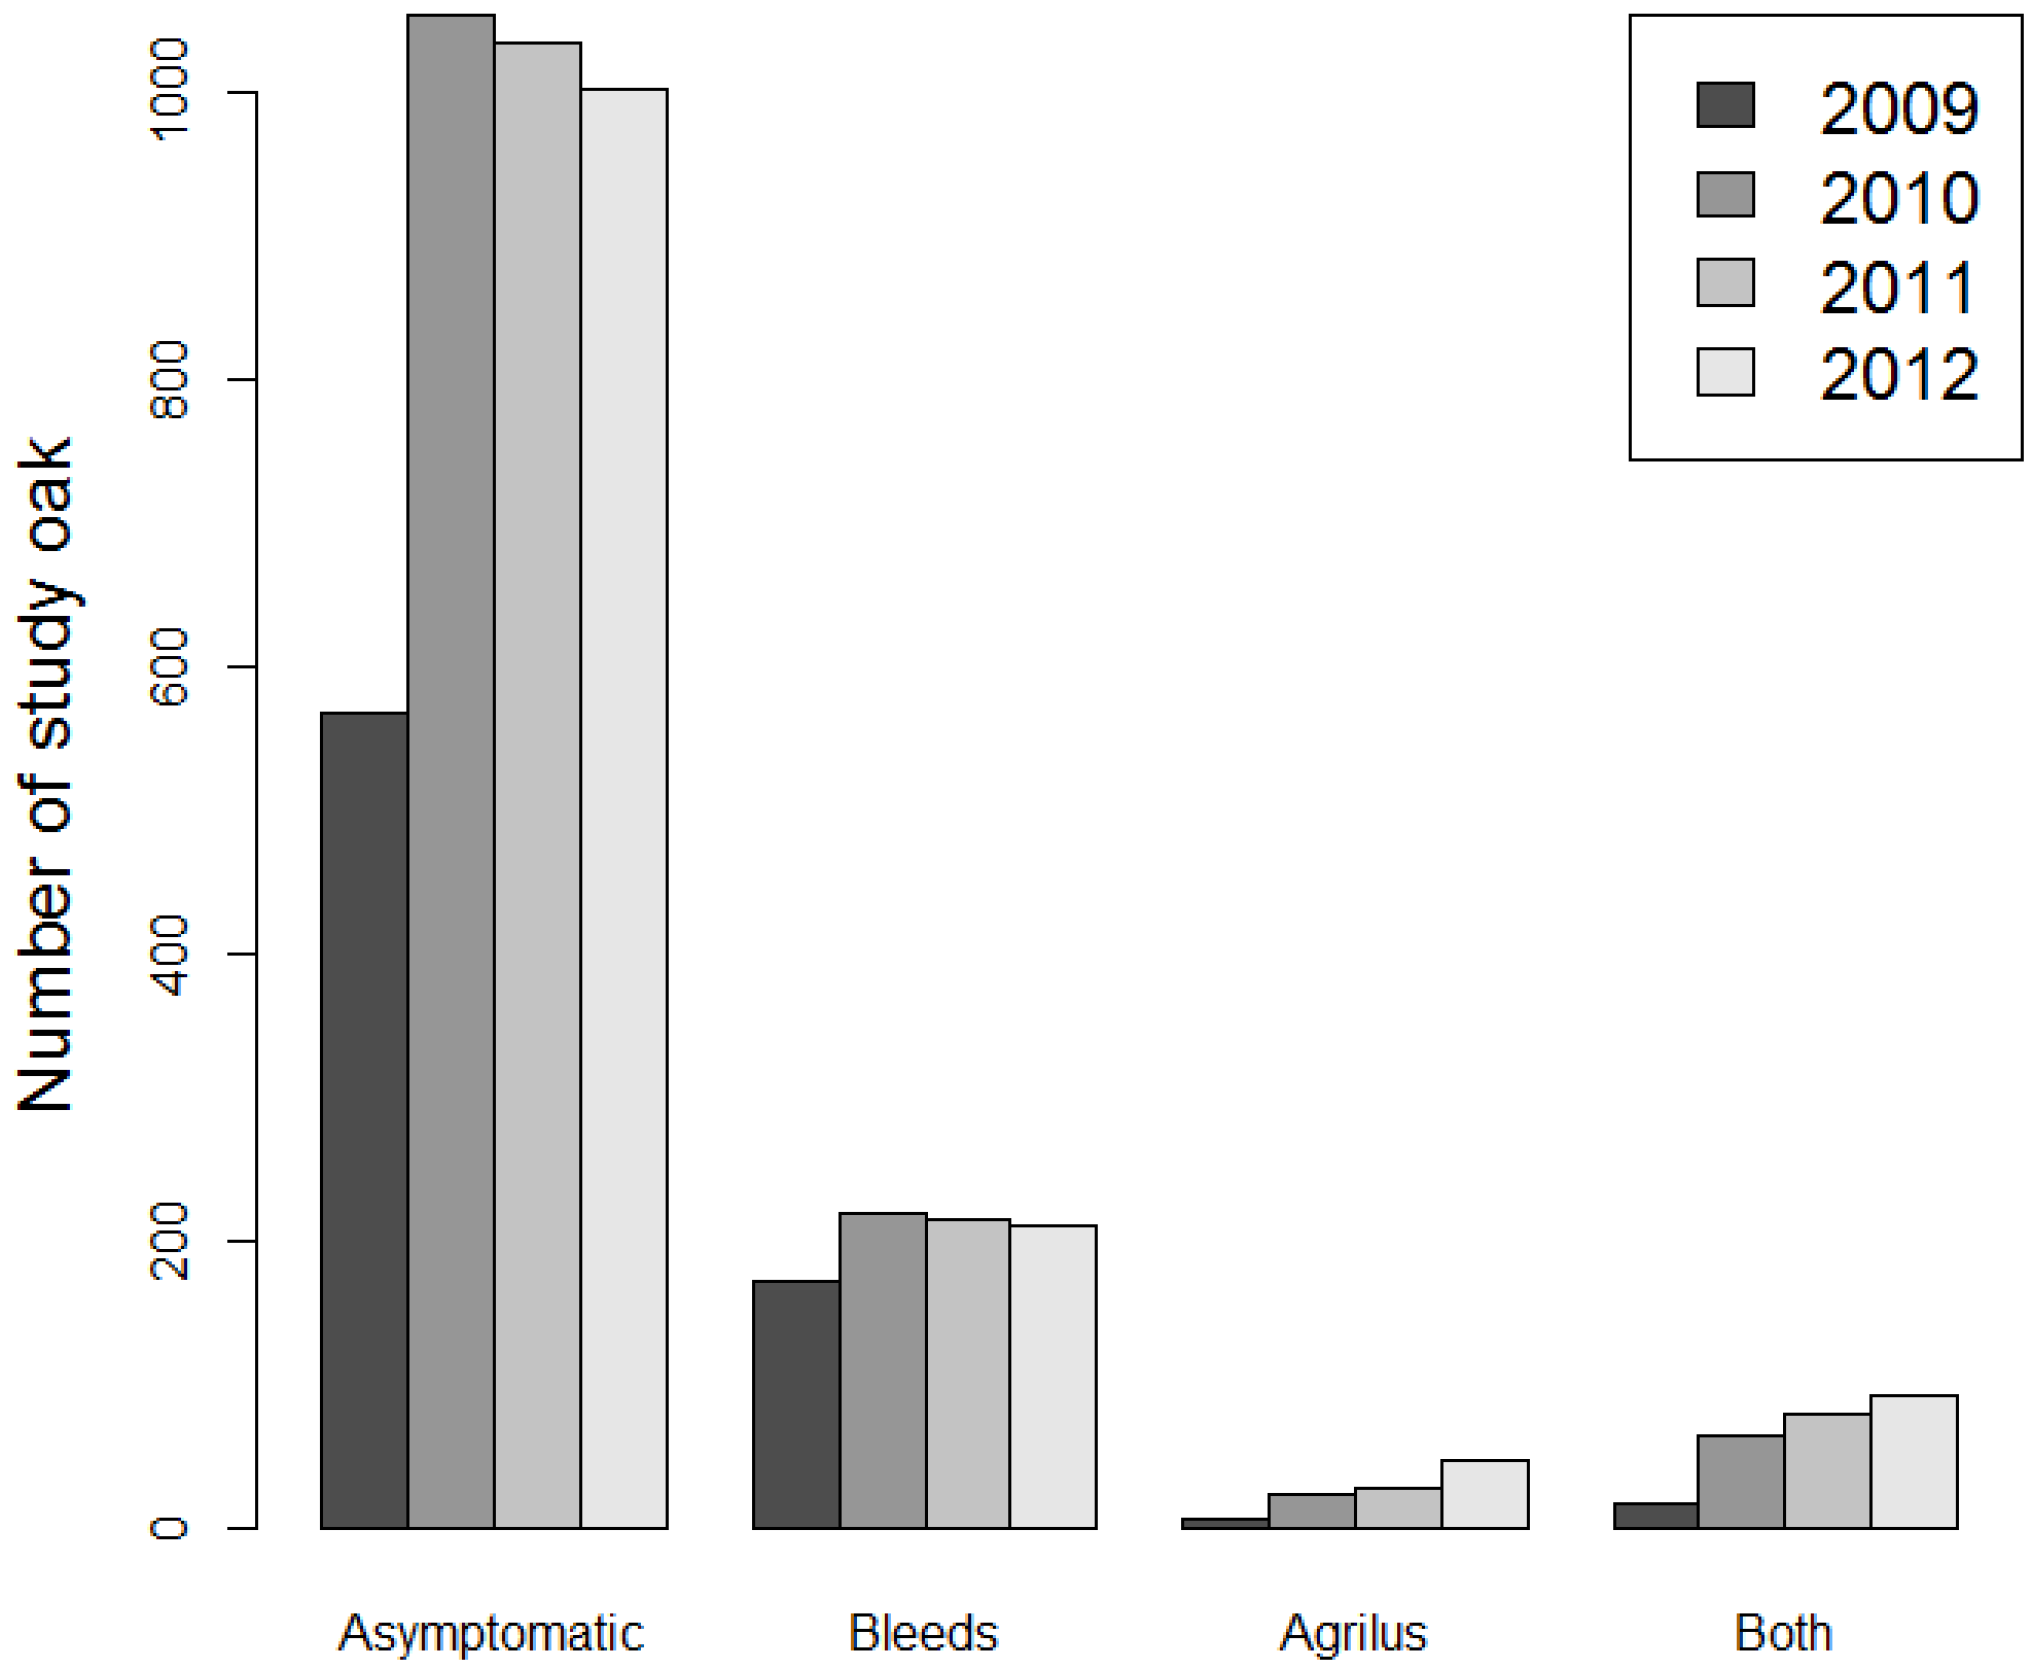
2.5. Within-Year Symptom Development

A stratified random sample of 20 trees was selected at each of two sites: Sandpit Wood and Winding Wood. Trees were placed into four stratification categories based on 2010 survey data: (a) no stem bleeds; (b) callused (2009 bleeds had healed); (c) low severity of bleeds (five or fewer); and (d) high severity of bleeds (more than five). At each site, five trees were selected from each category. A proportion of the trees in each category were selected to also have Agrilus emergence holes, so one of the no-stem-bleed oak, one callused oak, two low-bleed severity oak, and two high-bleed severity oak also had emergence holes.
The selected trees were monitored every four weeks between 5 April 2011 and 9 January 2013. In this way, monitoring points were distributed evenly with 13 falling in a calendar year. Each tree was assessed for visible symptoms, with counts of the number of active (with liquid produced from a split in the bark) and inactive (no active bleeding but signs of staining) bleeds conducted on the lower 3 m of the trunk. Emergence holes were counted on the lower 2 m of trunk, as only below this height could they be accurately identified from the ground.
One study tree at Winding Wood was felled during the summer of 2011, during forest management. Data from this tree were excluded from the analysis leaving Winding Wood with 19 study trees. The tree was from the category of high bleed severity without emergence holes. A further tree failed to flush in the spring of 2012; monitoring of this dead (low-bleed severity with emergence holes) tree continued throughout the study period. At Sandpit Wood, all trees were alive throughout the study although one tree had a major crown reduction to meet health and safety requirements.
The total number of newly formed emergence holes was calculated for each monitoring period at each site. This was then used as a co-variate to explain the occurrence of stem bleeds. A generalised linear mixed model was used to assess the effects of several factors on the count of stem bleeds using the glmer function, from package lme4 for R 3.1.2 (R Development Core Team, 2015, R Foundation for Statistical Computing, Vienna, Austria). In this analysis sites and years as well as monitoring period within year were treated as random effects; there were two fixed-effect factors: (a) the stratification categories (no-stem-bleeds, callused, low-bleed severity, or high-bleed severity); and (b) the number of new emergence holes present across the respective site. A Poisson error distribution was assumed as data involved counts.

2.6. Trapping Experiments

Specific trapping methods for Agrilus beetles are used extensively in North America [48], where the introduction of Agrilus planipennis Fairmaire has caused widespread damage [49,50]. Due to the scale of this invasion, trapping methods have been developed for detection of the expanding population [31,51] and this study took the opportunity to test similar methods to monitor Agrilus populations in Britain.
Colour trial 2010: A preliminary trapping trial experiment to investigate the effectiveness of different coloured traps was conducted in Essex, within a privately-owned woodland (Figure 1). Four blocks were established within the wood, each in a localised area on the edge of open forest tracks. The four locations were chosen to ensure that there were enough accessible high branches (approximately 12–15 m high, with clear space below) to accommodate all traps. Each block contained 10 coloured, sticky prism traps in five colours (black, blue, green, purple, red) placed at each of two heights (10 m and 3 m). For each block, ropes were secured over five suitable branches, each rope had a trap hanger at both 10 m and 3 m. Trap colours were allocated following a randomised plan; upper and lower trap colours were randomised independently, meaning that the upper and lower trap colour need not match. The exterior surfaces of all prism traps were covered with Oecotac glue (Oecos, Hertfordshire, UK). Prism trap templates were cut from Correx board (Theplasticshop.com, Coventry, UK) by using the design as specified by Francese [48], with three surfaces of 300 × 600 mm. Red, blue and black plastic sheets were used direct from the manufacturer, whereas green and purple traps were sprayed with Plasticote (Wokingham, UK) colours Apple Green 2113 and Sumptuous Purple 2120. Traps were checked bi-weekly between June 1 and September 2, 2010, with two blocks assessed each week.
Trapping experiment 2011: The experiment used a randomised block design, with five blocks set up across four woodland sites (Figure 1): two blocks were located on adjacent tracks in a large Shropshire forest; three further blocks were located in East Anglia, in two adjacent woods in Suffolk and one wood in Essex. The trapping locations were chosen because they were open areas with accessible high branches for traps (where traps hung away from branches and understorey).
For each block, eight trees were selected (a minimum of 25 m apart) with four on the track edge and four 30 m into the forest. Ropes were suspended from tree branches (>6 m high) and a purple prism trap was attached to each rope. To ensure all traps hung at the correct heights pre-measured lengths of rope were used to fix their distance to the ground and secured to a weight on the ground.
Each block contained eight purple sticky traps: four were placed on the track edge, two at 6 m and two at 3 m. A Manuka oil lure (Synergy Semiochemicals Corp., Burnaby, BC, Canada) was placed in one trap at each height. The remaining four traps were placed 30 m back into the forest, with the same set of height and lure combinations. Treatments were randomised within each block independently.
Traps were checked fortnightly between 16 May and the 2 September 2011, with sites in East Anglia alternating with those in the West Midlands. Traps and lures were replaced twice during the monitoring period to ensure maximum efficacy. Monitoring of the two blocks in the West Midlands finished early on the 1 of August as the track edge traps were vandalised.
Identification of all species in the genus Agrilus [52] were conducted using the key by Bily (1981). Analysis was conducted separately for each experiment and considered the total trap catch at the end of the season. Generalised linear models (GLM) were used with residuals assumed to follow Poisson distributions, using R 3.1.2 (R Development Core Team, 2015). Factors were added sequentially to a minimal model including only block effects and retained when they explained significant amounts of deviance. The contrasts presented are taken from the final “minimum adequate” model, including only significant factors. Contrasts are presented using t tests to compare individual factor levels when the overall effect of the factor is significant. The lure experiment with A. biguttatus required quasi-Poisson errors (where significance is assessed using F-tests) due to over-dispersion of the data.

3. Results

3.1. Co-Occurrence of Stem Symptoms and Emergence Holes

A consistent trend was seen in all four years, for emergence holes and stem bleeds to occur on the same trees at a frequency greater than expected than if they were independently distributed (Figure 2). Chi squared analysis shows a significant co-occurrence is present in each year: 2009 χ2 = 28.27, degrees of freedom (d.f.) = 1, p < 0.001, n = 762; 2010 χ2 = 157.29, d.f. = 1, p < 0.001, n = 1360; 2011 χ2 = 183.10, d.f. = 1, p < 0.001, n = 1356; 2012 χ2 = 166.42, d.f. = 1, p < 0.001, n = 1351). Within this pattern, more trees had stem bleeds than emergence holes, but emergence holes were observed more often on trees with stem bleeds than on those without them.

3.2. Sequential Development

Given that stem bleeds and emergence holes occur on the same host trees, sequential observations were assessed to see if there is an order to development of stem bleeds relative to the appearance of beetle emergence holes (Table 2). In all three years of observation, emergence holes were significantly more likely to occur on trees that had stem bleeds in the previous year. This finding is emphasised by the fact that when emergence holes appeared on asymptomatic trees stem bleeds were often also observed for the first time (both were present in 12 of 38 observations).

3.3. Spatial Relationship between Emergence Holes and Stem Bleeds

Across the eight sites there was a general trend for trees with stem bleeds to be clustered around trees with Agrilus emergence holes. Figure 3 shows the results for the four 2009 monitoring sites. At Hatchlands, the L function detected significant clustering at radial distances above 12 m from trees with emergence holes, while the O-ring showed the pattern to be most clustered between 4 and 20 m (number of trees with emergence holes, n(emergence) = 15, number of trees with stem bleeds, n(bleeds) = 33). The L function at Langdale wood showed significant clustering at 20 m and above, while the O-ring analysis showed it was most clustered between 9 and 29 m (n(emergence) = 18, n(bleeds) = 72). Clustering was detected from 6 m with the L function at Sandpit wood, while the O-ring shows it was most clustered below distances of 22 m (n(emergence) = 25, n(bleeds) = 42). Winding wood was an exception to the general trend with the pattern not showing clustering (n(emergence) = 17, n(bleeds) = 57).
Figure 4 shows the results for the four 2010 sites. Beecham spinney was similar to Winding wood in that it showed no significant clustering (n(emergence) = 4, n(bleeds) = 18). However, a clustered pattern was seen at Great Monks wood where the L function detected clustering intermittently at distances of 27 m and greater, with the O-ring analysis showing this was most prominent between 19 to 22 m and at 32 to 33 m (n(emergence) = 9, n(bleeds) = 26). Rookery wood showed significant clustering at distances greater than 12 m with the L function analysis and was most clustered between 8 and 17 m (also at 31, 32, 37 and 38 m) with the O-ring analysis (n(emergence) = 11, n(bleeds) = 14). At Sheen wood, clustering was not significant (n(emergence) = 41, n(bleeds) = 54), despite this site having by a high prevalence of AOD and, in turn, by far the greatest co-occurrence of symptoms on the same trees (33 trees).

3.4. Within-Year Symptom Development

The total counts of all stem bleeds remained largest for the high-bleed severity trees, which also showed pronounced seasonality (with stem bleeding most abundant in the summer months). The number of active bleeds peaked at different points in each year: in 2011 the peak occurred in the second monitoring period (May), whereas in 2012 the peak occurred much later in period 6 (August). The observations of new emergence holes followed a similar trend (see Supplementary Materials A).
Newly-formed emergence holes were observed in the same six monitoring periods (periods 2–7, May–September) in both years. Across the sampled trees, the number of beetles emerging in each four-week period was generally low (seven or less); however, in eight weeks during the second year of monitoring (2012), 102 emergence holes appeared on a single heavily declined tree in Winding Wood. This indicates that beetle populations may be influenced by the condition of individual hosts.
The number of active stem bleeds showed significant differences between the stratification categories (χ2 = 262.61, d.f. = 3, p < 0.001). The AOD selected classes were therefore correctly identified at the outset with high-bleed severity continuing to show most stem bleeds followed by low-bleed severity; however, some bleeds were recorded on both callused and no-stem-bleed trees during the study. A significant positive trend was also seen with the number of new emergence holes across each site (χ2 = 26.81, d.f. =1, p < 0.001). The same trend can be seen for the total number of stem bleeds, stratification category (χ2 = 1981.74, d.f. = 3, p < 0.001), and the relationship with new emergence holes (χ2 = 4.64, d.f. =1, p = 0.03).

3.5. Trapping Experiments

Species composition: Agrilus biguttatus was caught at all trapping sites (Table 3), although numbers varied greatly between sites and it was never the only Agrilus species present at a site. It is of note that Agrilus sulcicollis Lacordaire, a non-native species, was also widely present; it was found at all sites in East Anglia, sometimes in large numbers. Of the two smaller crown dwelling species Agrilus laticornis (Illiger) was the most common, with numbers much greater in 2010 due to its colour preferences (see Supplementary Materials B).
Flight period for A. biguttatus: In 2010, A. biguttatus adults were collected from traps between 7 June and 9 August, with the peak catch (six individuals) occurring in both the 28 June and 12 July collections. A similar flight period was seen in 2011, beetles were collected between 30 May and 22 August and the peak catch (21 individuals) on 4 July. The flight period compared well with the within season observations that recorded that appearance of new emergence holes in the summer (periods 2–7, May to September).
Colour trial 2010: Low numbers of A. biguttatus (n = 26) were caught. Trap colour significantly affected total catch (Table 4: χ2 = 19.31, d.f. = 4, p < 0.001). Purple was the only colour to catch significantly more than black controls (z = 2.35, p = 0.02). The model was not significantly improved by including height (no difference between 3 m and 10 m) (χ2 = 0.67, d.f. = 1, p = 0.41), or the interaction between colour and height (χ2 = 2.84, d.f. = 4, p = 0.59). These results are consistent with analysis using permutation tests (see Supplementary Materials B).
Trapping experiment 2011: Despite a general improvement in the numbers of A. biguttatus caught (n = 91), there was significant variation in between blocks (Table 3), Shropshire 1 caught significantly less than Shropshire 2 (t = 2.39, p = 0.02) and Suffolk 2 (t = 2.23, p = 0.03). Trap location significantly affected trap catch (Table 4; F1,34 = 17.68, p < 0.001), with traps on the track edges catching significantly more than those within the wood. Trap height (F1,33 = 1.68, p = 0.21) and Manuka lures (F1,32 = 0.004, p = 0.95) had no effect on catch. None of the interactions were statistically significant.

4. Discussion

Data from the monitoring sites show external symptoms (stem bleeds and D-shaped emergence holes) co-occur on the same host trees. These results match with observations below the bark, where larval galleries are found. While both external and internal symptoms show a co-occurrence, the degree of association varies. Beneath the bark, galleries and necrotic lesions are almost always found together, whereas external stem bleeding is more commonly observed than emergence holes. For example, in 2012 about 30 % of trees with stem bleeds also had emergence holes. One explanation for this pattern is that stem bleeding, which can be seen high into the canopy, is more noticeable than emergence holes, which are only visible on the lower parts of the stem from the ground. These data suggest that some emergence holes may not be visible to ground based surveys, especially on lightly affected trees. However, when beetle emergence has been monitored along the length of felled trees, the majority of emergence holes (approximately 85%) were below 7 m [53], reducing the chances of missing them in ground-based observations. Further examination of felled trees with bark cracks and stem bleeds confirms that symptomatic trees always have insect galleries, but do not always have emergence holes [21]. In addition, the sampling for bacterial isolations was conducted from the ground on standing trees, so galleries were present at a height where emergence holes would be clearly visible. This suggests that while there may have been a degree of sampling error, causing some trees with emergence holes to be missed; the signs of beetle are more common beneath the bark than externally. This implies that not all larvae successfully complete their development.
The effect of host defences reducing larval survival have been documented in a number of systems, including with A. planipennis, where the proportion of larvae that survive to adulthood is lower in hosts showing good crown condition [54]. The health of host trees affects their ability to defend themselves against insect invaders with carbon reserves, limiting the extent of callusing responses, which would otherwise reduce larval survival [30,55]. The processes of callusing and, in addition, flooding of galleries have been described as defence mechanisms against A. biguttatus attack [21,23,24,25], although they have been little studied in this system. Host resistance has been more thoroughly investigated for A. planipennis [56] where bark phenolic composition affects resistance [57]. More generally, the impact of drought on host trees is thought to be a major driver of pest outbreaks, tipping the balance in favour of the colonisers [6,8,9].
If colonisation success was related to host defence, A. biguttatus would be more likely to complete its life cycle on more weakened hosts. The observed patterns support the theory that emergence holes appear at a later decline stage, after stem bleeds and sometimes in the final years before the death of the host [20]. Over time, galleries and the areas of necrosis in the inner bark [1] are likely to weaken the tree and increase the likelihood of a larvae successfully completing its life cycle. Certainly, the degree of success A. biguttatus can have in the final stages of decline can be dramatic, as highlighted by the emergence of 102 beetles in an eight-week period from a heavily declined tree (that died in the following year). A similar pattern can be seen with Agrilus auroguttatus Schaeffer, where a small number of symptomatic trees produce the majority of emerging adults [58].
In this study, observations show that both the numbers of new emergence holes and active stem bleeds increase through the summer. This is the period of time when adult beetles were caught on the prism traps, and would have been feeding in the canopies and laying eggs on oak stems. The within season change in active stem bleeding could be attributable to newly formed larval galleries. It is also possible that stem bleeding and A. biguttatus emergences are independent and simply influenced by the same climatic factors, such as temperature, either directly or in response to changes in the efficacy of host defences.
Trapping experiments showed A. biguttatus to be the only Agrilus species to be present at all AOD sites, although species may be under represented in the catch given the low trapping efficiency and variety of colour preferences. This makes it the likely cause of the D-shaped holes on affected trees. However, questions still remain regarding the role of other insect species in relation to AOD. Agrilus sulcicollis (a recent arrival in Great Britain [59]) was also found at multiple sites and additional consideration should be given to insects that form maternal galleries, such as Scolytus spp. and P. cylindrus, as this life style trait would create damage where bacterial agents could enter the host and become established, and adult beetles entering the tree would increase the potential for transmission.
Agrilus biguttatus was caught most often on purple traps. This trend has also been documented for A. planipennis [48] and A. auroguttatus [60], although both of these species also show a preference for green traps [61,62]. In this study A. biguttatus was not caught on any green traps, however, recent studies showed green canopy-based traps did catch A. biguttatus, albeit in very low numbers [63]. Given the low catch in both studies there is much room for further experimentation and improvement of techniques. No preference was detected between traps at different heights, which match with observations that found A. biguttatus larvae along the full length of the main stem [53]. Canopy-based traps were not tested in this study, although traps at 10 m fell just below the foliage. Agrilus biguttatus showed preferences for track edges. Similar behaviour has been shown for other buprestids [48,64] and A. biguttatus has been sighted most often in open/ sunnier locations [53,65,66]. The effect of aspect was not investigated experimentally but may be important for a thermophilic species like A. biguttautus. Within the Shropshire site experimental blocks recorded both the highest and lowest trap catches. These occurred on adjacent tracks with high numbers caught on a south-facing track edge, whereas the adjacent block with low numbers was east-facing.
Analysis of the spatial distribution of trees with stem bleeding found them to occur around those with emergence holes, often at distances less than 20 m. This pattern matches with a process where beetles emerge from more heavily affected trees in the centres of groups of oak with stem bleeding. This could be due to the involvement of the beetle at a later stage of decline, or due to it only overcoming host defences on more heavily affected hosts. There were three sites that did not show this trend. Firstly, at Beecham Spinney, and Winding Wood, both of these sites had areas of dense understory which may have disrupted processes that govern AOD development. The understory would shade the lower stem keeping beetle activity higher above its canopy. Finally, Sheen wood had the highest proportion of AOD-affected trees and the highest co-occurrence on individual trees, but no clustering could be detected. This site is a long-affected site, with symptoms first documented in 1991 [67], therefore AOD is more established and widespread. This can be seen in the simulation envelopes for the O-ring function which centre around 0.5 and reflect the fact that a high degree of clustering is expected under randomly generated patterns.

5. Conclusions

In summary, a co-occurrence between A. biguttatus and trees with stem necrosis has been demonstrated. However, further steps are necessary to establish whether the co-occurrence involves a direct interaction, with the beetle aiding the spread of bacterial agents, or whether both agents are simply acting in an opportunist role, exploiting the same weakened hosts. Certainly beetle emergence seems to be linked to a few heavily-declined trees, with further stem bleeds occurring on trees in close proximity. Varying levels of predisposition may explain this pattern, successful emergence occurs most frequently on hosts in the final stages of decline. This raises interesting questions regarding the health status of host trees and indicates that the stage at which host trees become attractive for egg laying may arise before hosts are sufficiently weakened to enable larvae to complete their life cycles. Adult beetles are present in AOD-affected woodland landing on un-baited prism traps. This occurred at all heights where stem bleeds are found, and at the same time of year that new stem bleeds were noted. An indication that A. biguttatus visits healthy trees can be seen in the monitoring data, where, despite the strong co-occurrence with stem bleeds, emergence holes were observed on a small number of oak without AOD symptoms. Given the findings of the current study it is clear that A. biguttatus is associated with AOD-affected trees, further investigation of its role in the syndrome is justified and it should be considered when developing management recommendations.

Supplementary Materials

The following are available online at www.mdpi.com/1999-4907/8/3/87/s1, Supplementary materials A: Within-season symptom development. Supplementary materials B: Full Agrilus spp. trapping results.

Acknowledgments

The monitoring work presented in this paper was conducted in eight privately owned woodlands with a further five used for insect trapping. The authors are extremely grateful for the goodwill and support of the landowners and managers, as well as the National Trust and Royal Parks (at Richmond Park) who granted access to their land. The planning of the project involved many useful discussions with Jon Knight and Simon Archer. In addition, we would like to thank Daegan Inward, Katy Reed and the anonymous reviewers, whose thoughtful comments have improved this manuscript. This work was supported by the Forestry Commission (UK), Defra grant TH0108 and donations from Woodland Heritage. The positions and opinions presented in this article are those of the authors alone and are not intended to represent the views or scientific works of EFSA.

Author Contributions

N.B., S.D., M.J., S.K. and D.W. conceived and designed the experiments; N.B. performed the experiments; N.B. and X.X. analyzed the data; D.W. contributed reagents/materials/analysis tools; N.B., M.J., S.D. and M.P. wrote the paper.

Conflicts of Interest

The authors declare no conflict of interest.

References

  1. Denman, S.; Brown, N.; Kirk, S.; Jeger, M.; Webber, J. A description of the symptoms of Acute Oak Decline in Britain and a comparative review on causes of similar disorders on oak in Europe. Forestry 2014, 87, 535–551. [Google Scholar] [CrossRef]
  2. Brown, N.; Inward, D.J.G.; Jeger, M.; Denman, S. A review of Agrilus biguttatus in UK forests and its relationship with acute oak decline. Forestry 2015, 88, 53–63. [Google Scholar] [CrossRef]
  3. Denman, S.; Plummer, S.; Kirk, S.; Peace, A.; McDonald, J.E. Isolation studies reveal a shift in the cultivable microbiome of oak affected with Acute Oak Decline. Syst. Appl. Microbiol. 2016, 39, 484–490. [Google Scholar] [CrossRef] [PubMed]
  4. Brewer, A.; Ditchburn, B. NFI Statistical Analysis Report: 50-Year Forecast of Hardwood Timber Availability; Forestry Commission: Edinburgh, UK, 2014. [Google Scholar]
  5. Manion, P. Tree Disease Concepts; Prentice-Hall: Englewood Cliffs, NJ, USA, 1991. [Google Scholar]
  6. Anderegg, W.R.L.; Hicke, J.A.; Fisher, R.A.; Allen, C.D.; Aukema, J.; Bentz, B.; Hood, S.; Lichstein, J.W.; Macalady, A.K.; McDowell, N.; et al. Tree mortality from drought, insects, and their interactions in a changing climate. New Phytol. 2015, 208, 674–683. [Google Scholar] [CrossRef] [PubMed]
  7. Millar, C.I.; Stephenson, N.L. Temperate forest health in an era of emerging megadisturbance. Science 2015, 349, 823–826. [Google Scholar] [CrossRef] [PubMed]
  8. McDowell, N.; Pockman, W.T.; Allen, C.D.; Breshears, D.D.; Cobb, N.; Kolb, T.; Plaut, J.; Sperry, J.; West, A.; Williams, D.G.; et al. Mechanisms of plant survival and mortality during drought: Why do some plants survive while others succumb to drought? New Phytol. 2008, 178, 719–739. [Google Scholar] [CrossRef] [PubMed]
  9. Jactel, H.; Petit, J.; Desprez-Loustau, M.-L.; Delzon, S.; Piou, D.; Battisti, A.; Koricheva, J. Drought effects on damage by forest insects and pathogens: A meta-analysis. Glob. Chang. Biol. 2012, 18, 267–276. [Google Scholar] [CrossRef]
  10. Allen, C.D.; Breshears, D.D.; McDowell, N.G. On underestimation of global vulnerability to tree mortality and forest die-off from hotter drought in the Anthropocene. Ecosphere 2015, 6, 1–55. [Google Scholar] [CrossRef]
  11. Desprez-Loustau, M.-L.; Marçais, B.; Nageleisen, L.-M.; Piou, D.; Vannini, A. Interactive effects of drought and pathogens in forest trees. Ann. For. Sci. 2006, 63, 597–612. [Google Scholar] [CrossRef]
  12. Oliva, J.; Stenlid, J.; Martínez-Vilalta, J. The effect of fungal pathogens on the water and carbon economy of trees: Implications for drought-induced mortality. New Phytol. 2014, 203, 1028–1035. [Google Scholar] [CrossRef] [PubMed]
  13. Flower, C.E.; Gonzalez-Meler, M.A. Responses of Temperate Forest Productivity to Insect and Pathogen Disturbances. Ann. Rev. Plant Biol. 2015, 66, 547–569. [Google Scholar] [CrossRef] [PubMed]
  14. Thomas, F.M. Recent advances in cause-effect research on oak decline in Europe. CAB Rev. 2008, 3, 1–22. [Google Scholar] [CrossRef]
  15. Thomas, F.M.; Blank, R.; Hartmann, G. Abiotic and biotic factors and their interactions as causes of oak decline in Central Europe. For. Pathol. 2002, 32, 277–307. [Google Scholar] [CrossRef]
  16. Denman, S.; Barrett, G.; Kirk, S.A.; McDonald, J.E.; Coetzee, M.P.A. Identification of Armillaria species on declined oak in Britain: Implications for oak health. Forestry 2017, 90, 148–161. [Google Scholar] [CrossRef]
  17. Denman, S.; Brady, C.; Kirk, S.; Cleenwerck, I.; Venter, S.; Coutinho, T.; De Vos, P. Brenneria goodwinii sp. nov., associated with acute oak decline in the UK. Int. J. Syst. Evol. Microbiol. 2012, 62, 2451–2456. [Google Scholar] [CrossRef] [PubMed]
  18. Brady, C.; Denman, S.; Kirk, S.; Venter, S.; Rodriguez-Palenzuela, P.; Coutinho, T. Description of Gibbsiella quercinecans gen. nov., sp. nov., associated with Acute Oak Decline. Syst. Appl. Microbiol. 2010, 33, 444–450. [Google Scholar] [CrossRef] [PubMed]
  19. Brady, C.L.; Cleenwerck, I.; Denman, S.; Venter, S.N.; Rodríguez-Palenzuela, P.; Coutinho, T.A.; De Vos, P. Proposal to reclassify Brenneria quercina (Hildebrand and Schroth 1967) Hauben et al. 1999 into a new genus, Lonsdalea gen. nov., as Lonsdalea quercina comb. nov., descriptions of Lonsdalea quercina subsp. quercina comb. nov., Lonsdalea quercina subsp. ib. Int. J. Syst. Evol. Microbiol. 2012, 62, 1592–1602. [Google Scholar] [CrossRef] [PubMed]
  20. Brown, N.; Jeger, M.; Kirk, S.; Xu, X.; Denman, S. Spatial and temporal patterns in symptom expression within eight woodlands affected by Acute Oak Decline. For. Ecol. Manag. 2016, 360, 97–109. [Google Scholar] [CrossRef]
  21. Vansteenkiste, D.; Tirry, L.; Van Acker, J.; Stevens, M. Predispositions and symptoms of Agrilus borer attack in declining oak trees. Ann. For. Sci. 2004, 61, 815–823. [Google Scholar] [CrossRef]
  22. Salle, A.; Nageleisen, L.M.; Lieutier, F. Bark and wood boring insects involved in oak declines in Europe: Current knowledge and future prospects in a context of climate change. For. Ecol. Manag. 2014, 328, 79–93. [Google Scholar] [CrossRef]
  23. Falck, R. Oak Decline in Lödderitz Forest District and in Westphalia. Z. Forst Jagdwes 1918, 50, 123–132. [Google Scholar]
  24. Jacquiot, C. Relationships between attacks by Agrilus biguttatus Fab. and some cases of decline in oak. Rev. Pathol. Veg. d’Entomol. Agric. Fr. 1949, 39, 172–182. [Google Scholar]
  25. Hartmann, G.; Blank, R. Winter frost, insect defoliation and Agrilus biguttatus Fabr. as causal factors of oak decline in northern Germany. Forst Holtz 1992, 47, 443–452. [Google Scholar]
  26. Kowalski, T. Oak decline: I. Fungi associated with various disease symptoms on overground portions of middle-aged and old oak (Quercus robur L.). Eur. J. For. Pathol. 1991, 21, 136–151. [Google Scholar] [CrossRef]
  27. Kehr, R.D.; Wulf, A. Fungi associated with above-ground portions of declining oaks (Quercus robur) in Germany. Eur. J. For. Pathol. 1993, 23, 18–27. [Google Scholar] [CrossRef]
  28. Kaus, A.; Schmitt, V.; Simon, A.; Wild, A. Microscopical and mycological investigations on wood of pendunculate oak (Quercus robur L.) relative to the occurrence of oak decline. J. Plant Physiol. 1996, 148, 302–308. [Google Scholar] [CrossRef]
  29. Moraal, L.; Hilszczanski, J. The oak buprestid beetle (Agrilus biguttatus) (F.) (Col., buprestidae), a recent factor in oak decline in Europe. J. Pest Sci. 2000, 73, 134–138. [Google Scholar]
  30. Dunn, J.P.; Potter, D.A.; Kimmerer, T.W. Carbohydrate reserves, radial growth, and mechanisms of resistance of oak trees to phloem-boring insects. Oecologia 1990, 83, 458–468. [Google Scholar] [CrossRef]
  31. Crook, D.J.; Khrimian, A.; Francese, J.A.; Fraser, I.; Poland, T.M.; Sawyer, A.J.; Mastro, V.C. Development of a host-based semiochemical lure for trapping emerald ash borer Agrilus planipennis (Coleoptera: Buprestidae). Environ. Entomol. 2008, 37, 356–365. [Google Scholar] [CrossRef] [PubMed]
  32. Crook, D.J.; Mastro, V.C. Chemical ecology of the emerald ash borer Agrilus planipennis. J. Chem. Ecol. 2010, 36, 101–112. [Google Scholar] [CrossRef] [PubMed]
  33. Vuts, J.; Woodcock, C.M.; Sumner, M.E.; Caulfield, J.C.; Reed, K.; Inward, D.J.G.; Leather, S.R.; Pickett, J.A.; Birkett, M.A.; Denman, S. Responses of the two-spotted oak buprestid, Agrilus biguttatus (Coleoptera: Buprestidae), to host tree volatiles. Pest Manag. Sci. 2016, 72, 845–851. [Google Scholar] [CrossRef] [PubMed] [Green Version]
  34. Haack, R.A.; Jendak, E.; Houping, L.; Marchant, K.R.; Petrice, T.R.; Poland, T.M.; Ye, H. The emerald ash borer: A new exotic pest in North America. Newsl. Mich. Entomol. Soc. 2002, 47, 1–5. [Google Scholar]
  35. Coleman, T.W.; Seybold, S.J. Previously unrecorded damage to oak, Quercus spp., in southern California by the goldspotted oak borer, Agrilus coxalis Waterhouse (Coleoptera: Buprestidae). Pan-Pac. Entomol. 2008, 84, 288–300. [Google Scholar] [CrossRef]
  36. Flower, C.E.; Knight, K.S.; Rebbeck, J.; Gonzalez-Meler, M.A. The relationship between the emerald ash borer (Agrilus planipennis) and ash (Fraxinus spp.) tree decline: Using visual canopy condition assessments and leaf isotope measurements to assess pest damage. For. Ecol. Manag. 2013, 303, 143–147. [Google Scholar] [CrossRef]
  37. Knight, K.S.; Brown, J.P.; Long, R.P. Factors affecting the survival of ash (Fraxinus spp.) trees infested by emerald ash borer (Agrilus planipennis). Biol. Invasions 2013, 15, 371–383. [Google Scholar] [CrossRef]
  38. Leach, J.G. Insect Transmission of Plant Diseases; McGraw-Hill: New York, NY, USA, 1940. [Google Scholar]
  39. Al Adawi, A.O.; Al Jabri, R.M.; Deadman, M.L.; Barnes, I.; Wingfield, B.; Wingfield, M.J. The mango sudden decline pathogen, Ceratocystis manginecans, is vectored by Hypocryphalus mangiferae (Coleoptera: Scolytinae) in Oman. Eur. J. Plant Pathol. 2013, 135, 243–251. [Google Scholar] [CrossRef]
  40. Jewell, N.P. Statistics for Epidemiology; Chapman & Hall: Boca Raton, FL, USA, 2004. [Google Scholar]
  41. Wiegand, T.; Moloney, K. Rings, circles, and null models for point pattern analysis in ecology. Oikos 2004, 104, 209–229. [Google Scholar] [CrossRef]
  42. Xu, X.; Hu, X. Distance-based statistics for analysing spatial point pattern data. In Exercises in Plant Disease Epidemiology; Stevenson, K.L., Jeger, M., Eds.; APS Press: St. Paul, MN, USA, 2015; pp. 59–64. [Google Scholar]
  43. Ripley, B. Spatial Statistics; John Wiley & Sons: New York, NY, USA, 1981. [Google Scholar]
  44. Xu, X.; Harwood, T.D.; Pautasso, M.; Jeger, M.J. Spatio-temporal analysis of an invasive plant pathogen (Phytophthora ramorum) in England and Wales. Ecography 2009, 32, 504–516. [Google Scholar] [CrossRef]
  45. Wiegand, T. User Manual for the Programita Software; Helmholtz Centre for Environmental Research—UFZ: Leipzig, Germany, 2014. [Google Scholar]
  46. Baddeley, A.B.; Diggle, P.J.; Hardegen, A.; Lawrence, T.; Milne, R.K. On tests of spatial pattern based on simulation envelopes. Ecol. Monogr. 2014, 84, 477–489. [Google Scholar] [CrossRef]
  47. Wiegand, T.; Grabarnik, P.; Stoyan, D. Envelope tests for spatial point patterns with and without simulation. Ecosphere 2016, 7, 1–18. [Google Scholar] [CrossRef]
  48. Francese, J.; Oliver, J.B.; Fraser, I.; Lance, D.R.; Youssef, N.; Sawyer, A.J.; Mastro, V.C. Influence of trap placement and design on capture of the emerald ash borer (Coleoptera: Buprestidae). J. Econ. Entomol. 2008, 101, 1831–1837. [Google Scholar] [CrossRef] [PubMed]
  49. Siegert, N.W.; Mercader, R.J.; McCullough, D.G. Spread and dispersal of emerald ash borer (Coleoptera: Buprestidae): Estimating the spatial dynamics of a difficult-to-detect invasive forest pest. Can. Entomol. 2015, 147, 338–348. [Google Scholar] [CrossRef]
  50. Kovacs, K.F.; Haight, R.G.; McCullough, D.G.; Mercader, R.J.; Siegert, N.W.; Liebhold, A.M. Cost of potential emerald ash borer damage in U.S. communities, 2009–2019. Ecol. Econ. 2010, 69, 569–578. [Google Scholar] [CrossRef]
  51. Francese, J.A.; Crook, D.J.; Lance, D.R.; Sawyer, A.J.; Mastro, V.C. Optimization of trap color for emerald ash borer (Coleoptera: Buprestidae). J. Econ. Entomol. 2010, 103, 1235–1241. [Google Scholar] [CrossRef] [PubMed]
  52. Bily, S. The Buprestidae (Coleoptera) of Fennoscandia and Denmark; Scandinavian Science Press: Klampenborg, Denmark, 1982. [Google Scholar]
  53. Habermann, M.; Preller, J. Studies on the biology and control of two-spotted lichen buprestid (Agrilus biguttatus Fabr.). Forst Holtz 2003, 58, 215–220. [Google Scholar]
  54. Jennings, D.E.; Duan, J.J.; Shrewsbury, P.M. Biotic mortality factors affecting emerald ash borer (Agrilus planipennis) are highly dependent on life stage and host tree crown condition. Bull. Entomol. Res. 2015, 598–606. [Google Scholar] [CrossRef] [PubMed]
  55. Haavik, L.J.; Billings, S.A.; Guldin, J.M.; Stephen, F.M. Emergent insects, pathogens and drought shape changing patterns in oak decline in North America and Europe. For. Ecol. Manag. 2015, 354, 190–205. [Google Scholar] [CrossRef]
  56. Villari, C.; Herms, D.A.; Whitehill, J.G.A.; Cipollini, D.; Bonello, P. Progress and gaps in understanding mechanisms of ash tree resistance to emerald ash borer, a model for wood-boring insects that kill angiosperms. New Phytol. 2016, 209, 63–79. [Google Scholar] [CrossRef] [PubMed]
  57. Chakraborty, S.; Whitehill, J.G.A.; Hill, A.L.; Opiyo, S.O.; Cipollini, D.; Herms, D.A.; Bonello, P. Effects of water availability on emerald ash borer larval performance and phloem phenolics of Manchurian and black ash. Plant Cell Environ. 2014, 37, 1009–1021. [Google Scholar] [CrossRef] [PubMed]
  58. Haavik, L.J.; Flint, M.L.; Coleman, T.W.; Venette, R.C.; Seybold, S.J. Goldspotted oak borer effects on tree health and colonization patterns at six newly-established sites. Agric. For. Entomol. 2015, 17, 147–157. [Google Scholar] [CrossRef]
  59. James, T. Agrilus sulcicollis Lacordaire (Buprestidae) a jewel beetle new to Britain. Coleopterist 1994, 3, 33–35. [Google Scholar]
  60. Coleman, T.W.; Chen, Y.; Graves, A.D.; Hishinuma, S.M.; Grulke, N.E.; Flint, M.L.; Seybold, S.J. Developing monitoring techniques for the invasive goldspotted oak borer (Coleoptera: Buprestidae) in California. Environ. Entomol. 2014, 43, 729–743. [Google Scholar] [CrossRef] [PubMed]
  61. Crook, D.J.; Francese, J.; Zylstra, K.E.; Fraser, I.; Sawyer, A.J.; Bartels, D.W.; Lance, D.R.; Mastro, V.C. Laboratory and field response of the emerald ash borer (Coleoptera: Buprestidae), to selected regions of the electromagnetic spectrum. J. Econ. Entomol. 2009, 102, 2160–2169. [Google Scholar] [CrossRef] [PubMed]
  62. Francese, J.; Fraser, I.; Rietz, M.L.; Crook, D.J.; Lance, D.R.; Mastro, V.C. Relation of color, size, and canopy placement of prism traps in determining capture of emerald ash borer (Coleoptera: Buprestidae). Can. Entomol. 2010, 142, 596–600. [Google Scholar] [CrossRef]
  63. Domingue, M.J.; Imrei, Z.; Lelito, J.P.; Muskovits, J.; Janik, G.; Csoka, G.; Mastro, V.C.; Baker, T.C. Trapping of European buprestid beetles in oak forests using visual and olfactory cues. Entomol. Exp. Appl. 2013, 148, 116–129. [Google Scholar] [CrossRef]
  64. Wermelinger, B.; Flueckiger, P.F.; Obrist, M.K.; Duelli, P. Horizontal and vertical distribution of saproxylic beetles (Col., Buprestidae, Cerambycidae, Scolytinae) across sections of forest edges. J. Appl. Entomol. 2007, 131, 104–114. [Google Scholar] [CrossRef]
  65. Allen, A.A. Notes on Agrilus pannonicus Pill. & Mitt. (Col.: Buprestidae) in 1985. Entomol. Rec. J. Var. 1988, 100, 25–28. [Google Scholar]
  66. Domingue, M.J.; Csoka, G.; Toth, M.; Vetek, G.; Penzes, B.; Mastro, V.; Baker, T.C. Field observations of visual attraction of three European oak buprestid beetles toward conspecific and heterospecific models. Entomol. Exp. Appl. 2011, 140, 112–121. [Google Scholar] [CrossRef]
  67. Gibbs, J.N.; Greig, B.J.W. Biotic and abiotic factors affecting the dying back of pedunculate oak Quercus robur L. Forestry 1997, 70, 399–406. [Google Scholar] [CrossRef]
Figure 1. Locations of the sites used in this study. (A) shows the locations of the eight monitoring sites, 2009 sites are red circles and 2010 sites are black squares. (B) shows the locations of the trapping experiments. The 2010 colour trial is shown as a black circle and the 2011 experimental sites are shown as orange squares. For the latter both the most westerly and most easterly squares represent two blocks with the remaining square indicating the location of a single block.
Forests 08 00087 g001
Figure 2. Co-occurrence of emergence holes and stem bleeds. For each year of monitoring total counts of all live oak are presented in four categories: asymptomatic trees (no bleeds and no emergence holes), trees with stem bleeds only, trees with Agrilus emergence holes only and trees with both stem bleeds and emergence holes.
Forests 08 00087 g002
Figure 3. Assessment of clustering of all oak symptomatic for stem bleeds around all oak with emergence holes at the four 2009 study sites: (A) Hatchlands; (B) Langdale wood; (C) Sandpit wood; and (D) Winding wood. For each plot the main axis shows outputs of the O-ring analysis and the inset graphs shows the L-function analysis. Test statistics are shown with black filled circles and lines and simulations envelopes are open grey circles. Significant clustering can be detected when the black line falls above the grey dots generated from simulations.
Forests 08 00087 g003
Figure 4. Assessment of clustering of all oak symptomatic for stem bleeds around all oak with emergence holes at the four 2010 study sites: (A) Beecham spinney; (B) Great monks wood; (C) Rookery wood; and (D) Sheen wood. For each plot the main axis shows outputs of the O-ring analysis and the inset graph shows L-function analysis. Test statistics are black filled circles and lines and simulations envelopes are open grey circles. Significant clustering can be detected when the black line falls above the grey dots generated from simulations.
Forests 08 00087 g004
Table 1. Summary of conditions at the eight monitoring sites. Basic summaries are presented for each monitoring plot. All oak species are listed, but only native species (Quercus robur and Quercus petraea) are included in the oak numbers in this table and analyses in this paper. No stem bleeds or exit holes were observed on Quercus cerris L. during monitoring. Mean diameters are shown with their Standard Deviation (SD).
Year Study BeganSiteOak SpeciesMean Oak Diameter at 1.3 m (±SD) (cm)Number of Live Study Oak Density of Oak (Stems/ha)Density of Tree Cover (All Stems/ha)
2009HatchlandsQ. robur
Q. petraea
Q. cerris
84.63 (±26.59)1406.148.02
Langdale WoodQ. robur
Q. cerris
66.00 (±10.58)26030.9531.79
Sandpit WoodQ. robur56.68 (±17.84)162114.39132.75
Winding woodQ. robur56.21 (±13.54)20187.12141.74
2010Beecham SpinneyQ. robur
Q. cerris
41.19 (±18.13)18684.48239.37
Great Monks WoodQ. robur
Q. cerris
60.91 (±16.08)14543.8558.98
Rookery WoodQ. robur 55.91 (±38.33)11578.50133.11
Sheen WoodQ. robur 76.96 (±19.26)15238.3240.84
Table 2. Summary of sequential development of symptoms. All oak that were observed to have exit holes for the first time were assessed to see whether previous exposure to stem bleeds was a risk factor. This is assessed by comparing the probability of new emergence holes (EH) occuring on trees with prior stem bleeds, with the probability they occur on previously asymptomatic trees. The table shows counts of new EH and susceptible trees for each year: for co-occurrence susceptible trees had stem bleeds only in the previous year; and for no symptoms they were trees asymptomatic in the previous year. The relative risk (RR) is shown along with its 95% confidence intervals (CIs) to assess significance.
YearPrior ConditionNew EHSusceptibleConditional ProbabilityRRCI− 95%CI+ 95%
2010With stem bleeds211710.12213.985.3436.56
No symptoms55690.009
2011With stem bleeds132160.0603.781.847.74
No symptoms1610040.016
2012With stem bleeds182130.0854.762.499.09
No symptoms179580.018
Table 3. Total trap catch at each site for all Agrilus species. In 2010 all prism trap data is combined at one location (n = 40) whereas in 2011 it is divided by site (n = 8).
SiteA. biguttatusA. sulcicollisA. laticornisA. angustulus
Essex (site 1), 2010 24511235
Essex (site 2), 20114710
Shropshire (site 1), 20111010
Shropshire (site 2), 201146011
Suffolk (site 1), 201142330
Suffolk (site 2), 201136600
Table 4. Prism trap results. Mean trap catch is shown for each main effect, along with the standard error. In each year a total of 40 traps were used. For each treatment means are shown with their respective standard error (SE). This table gives a summary of results for A. biguttatus—while information for all Agrilus species is included as Supplementary Materials B.
2010 Colour Trial2011 Experiment
FactorMeanSEFactorMeanSE
Black0.250.24Edge3.900.55
Red0.630.3Wood0.650.21
Blue0.630.3
Green003 m2.800.54
Purple1.50.46 m1.750.38
3 m0.920.21Lure2.250.51
10 m0.880.21No Lure2.300.45

