Characteristics of Logging Businesses across Virginia’s Diverse Physiographic Regions


Abstract
:1. Introduction
2. Methods
3. Results and Discussion
3.1. Response Rate and Owner Demographics
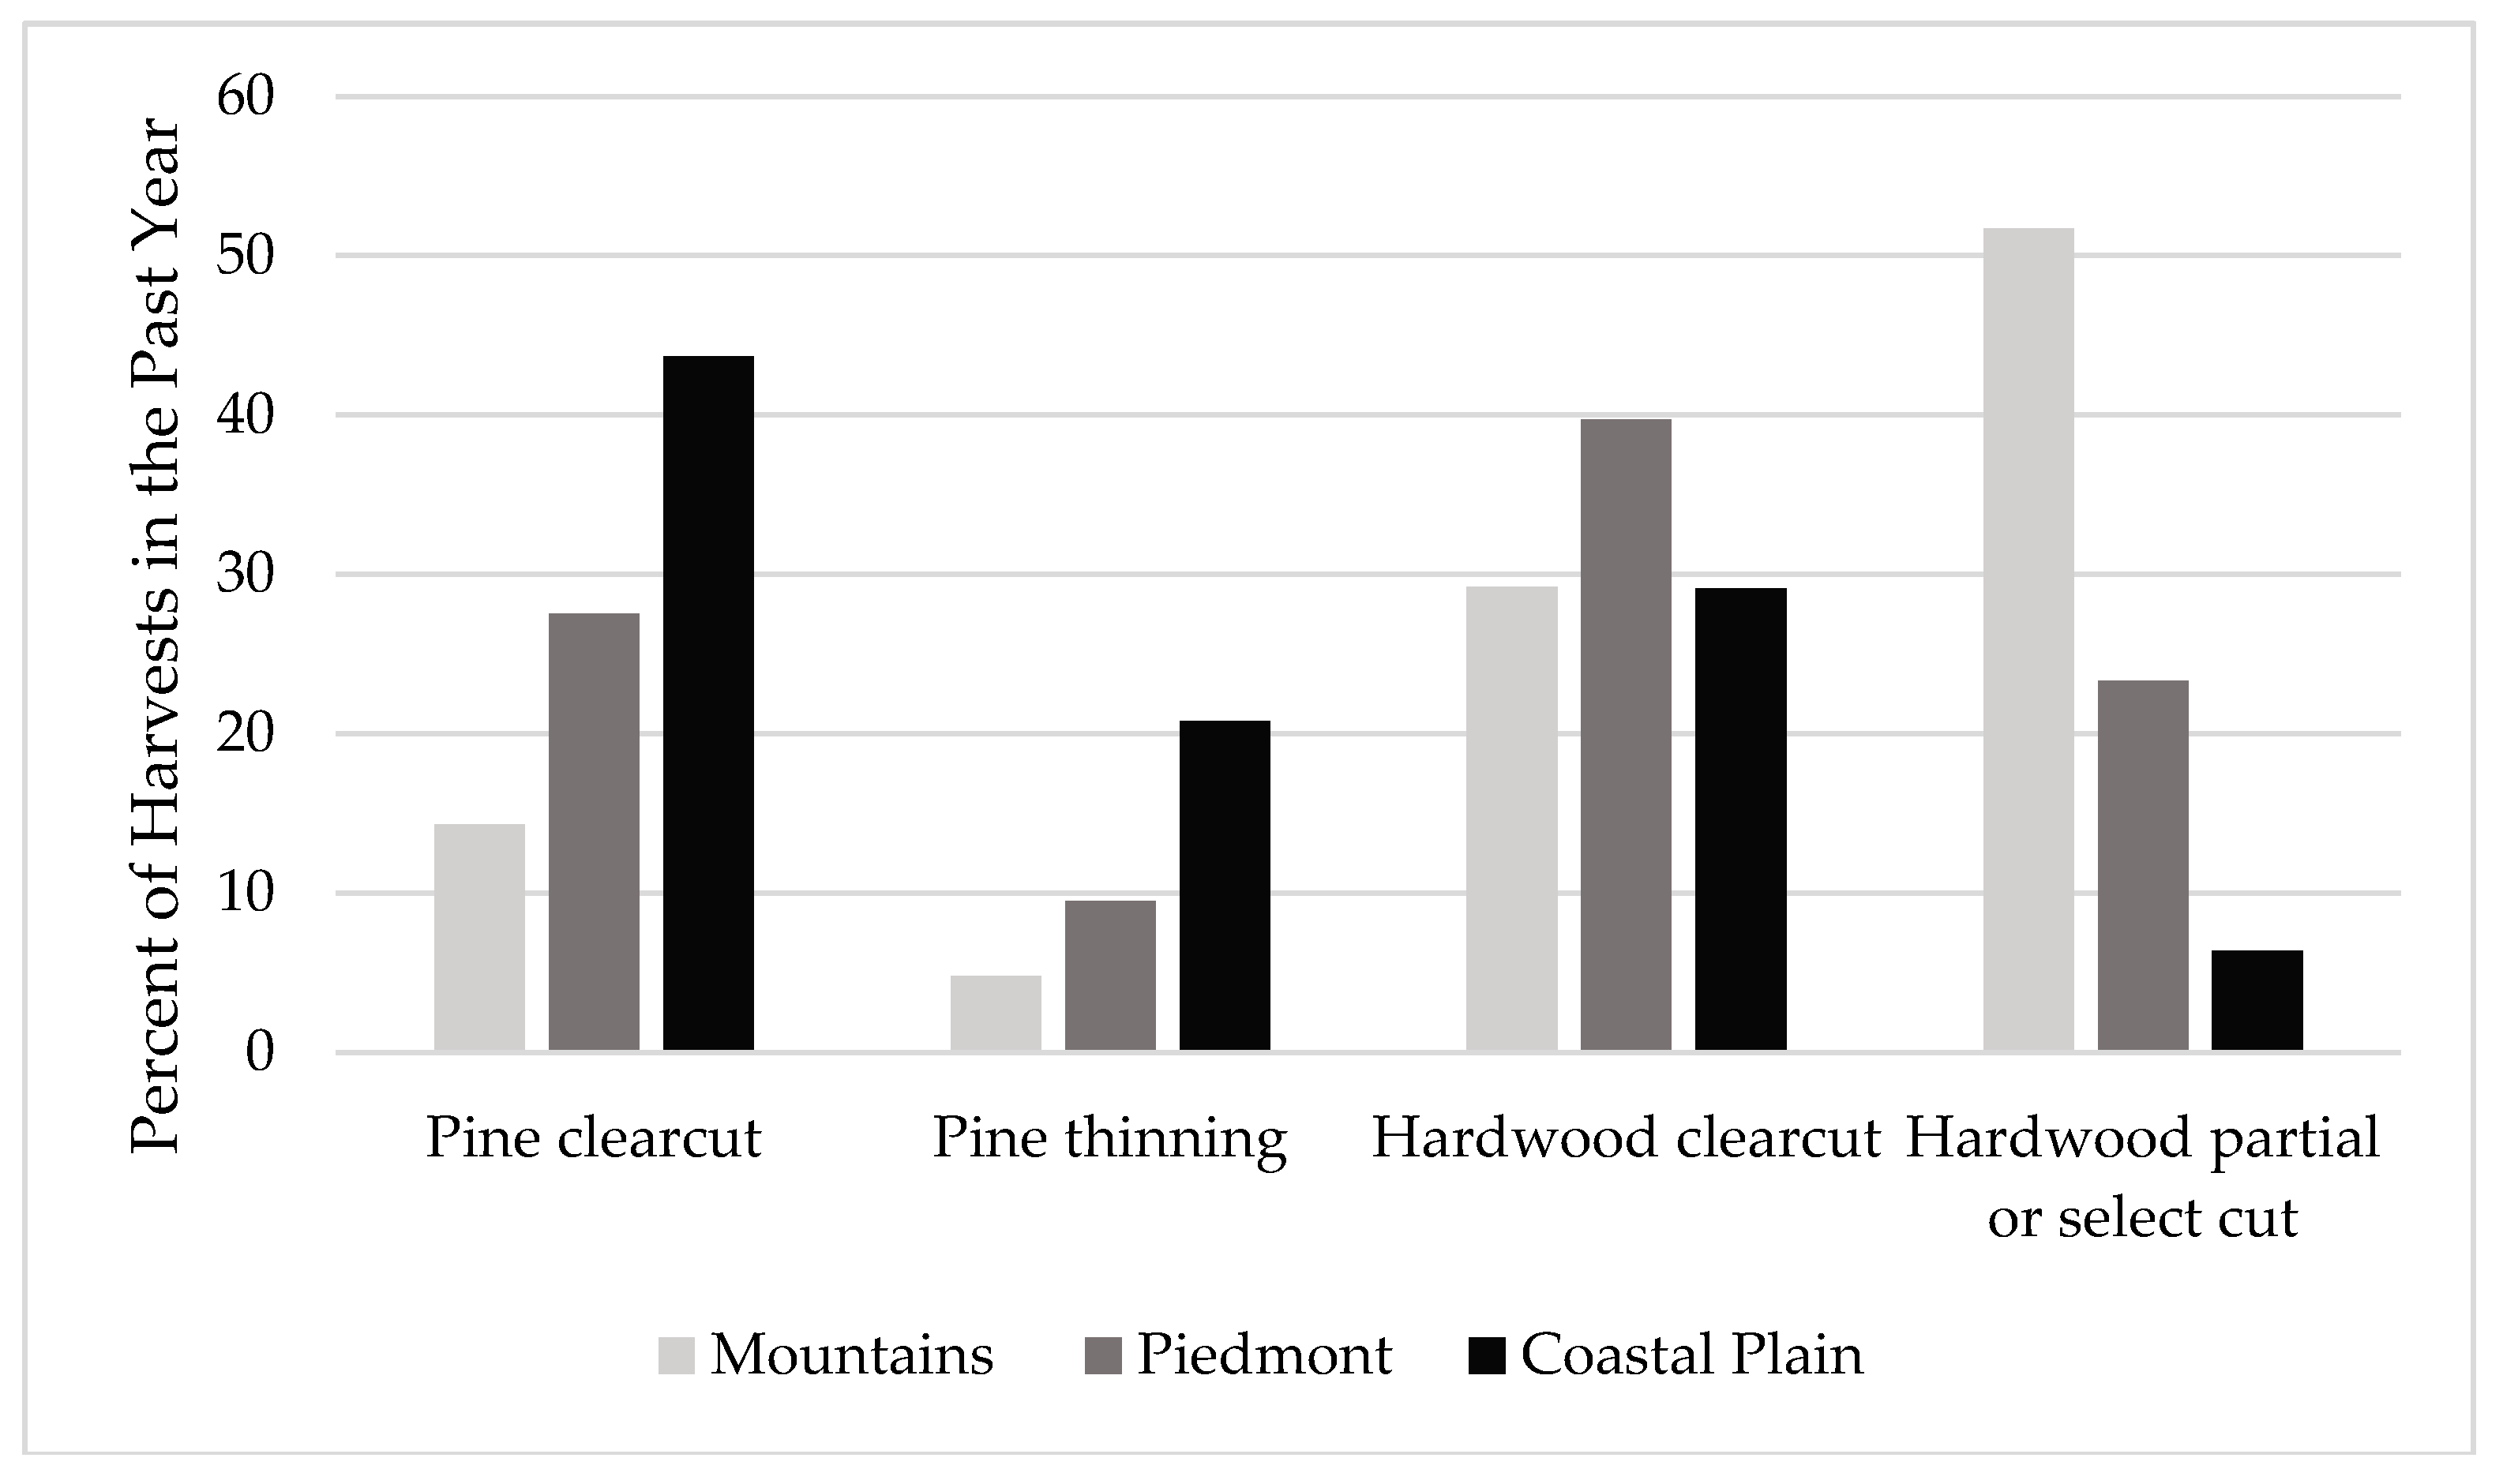
3.2. Harvest Types and Tract Characteristics
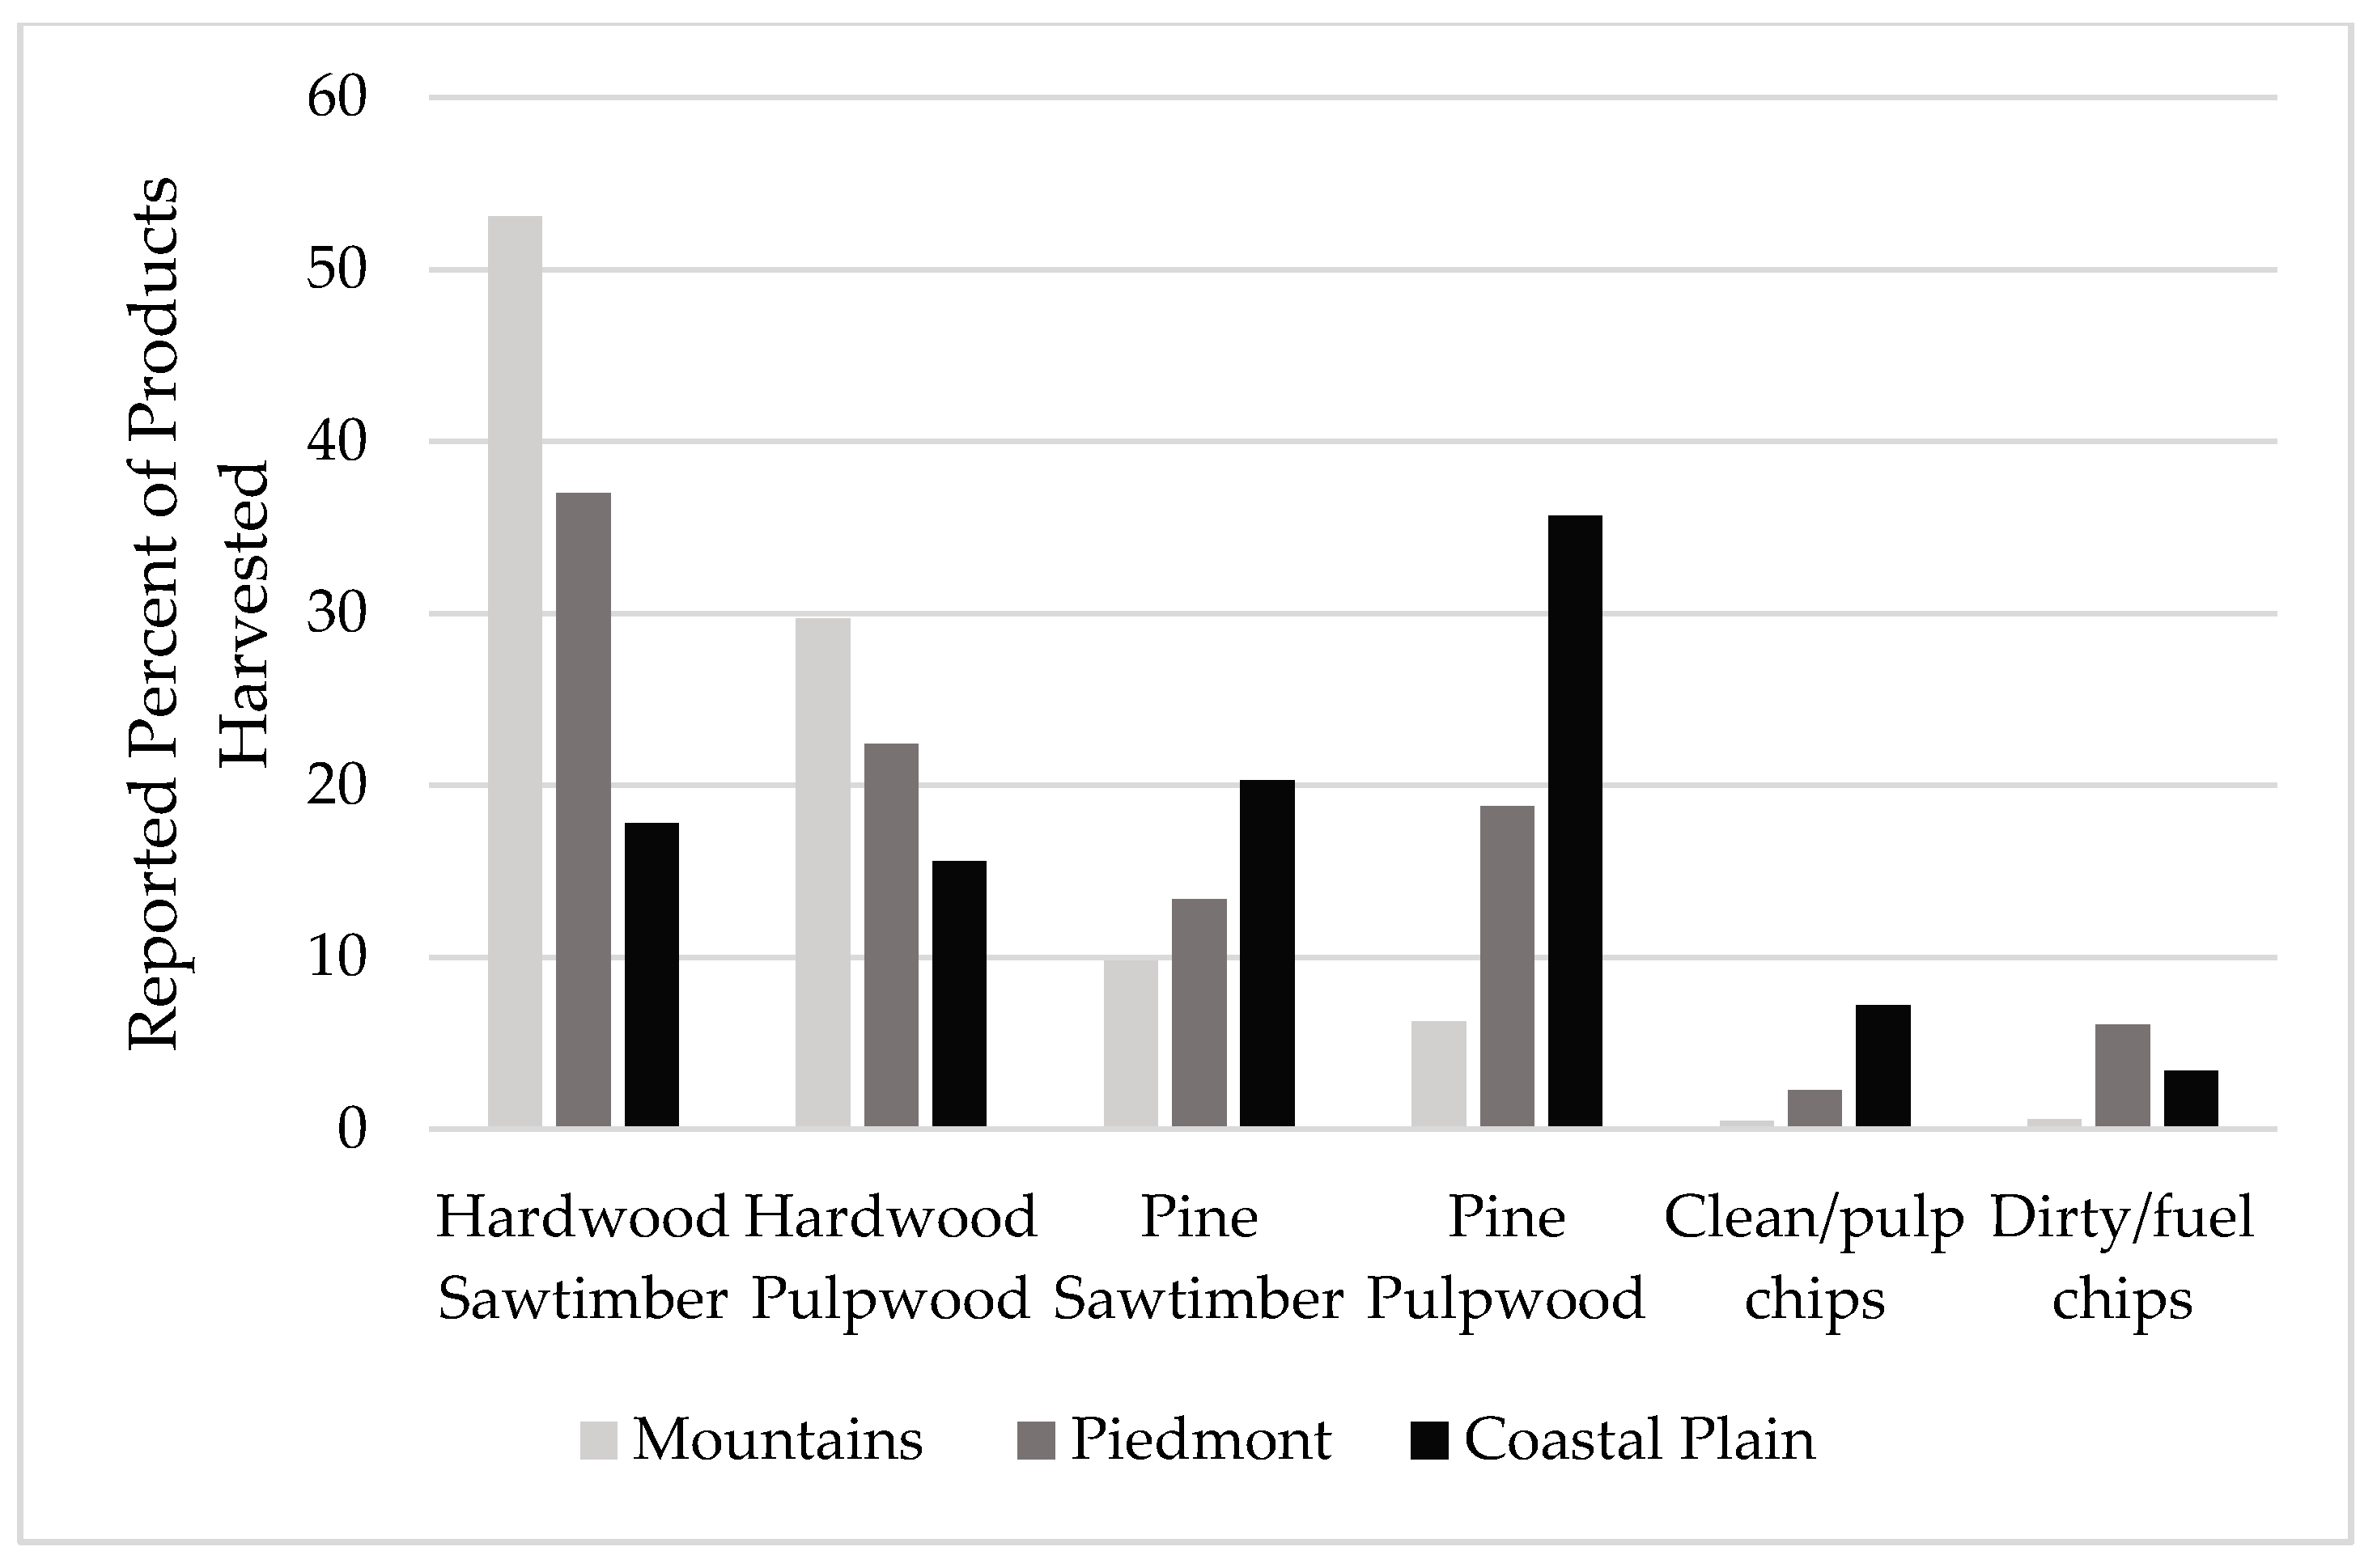
3.3. Harvesting System and Production Characteristics
3.4. Biomass Harvesting
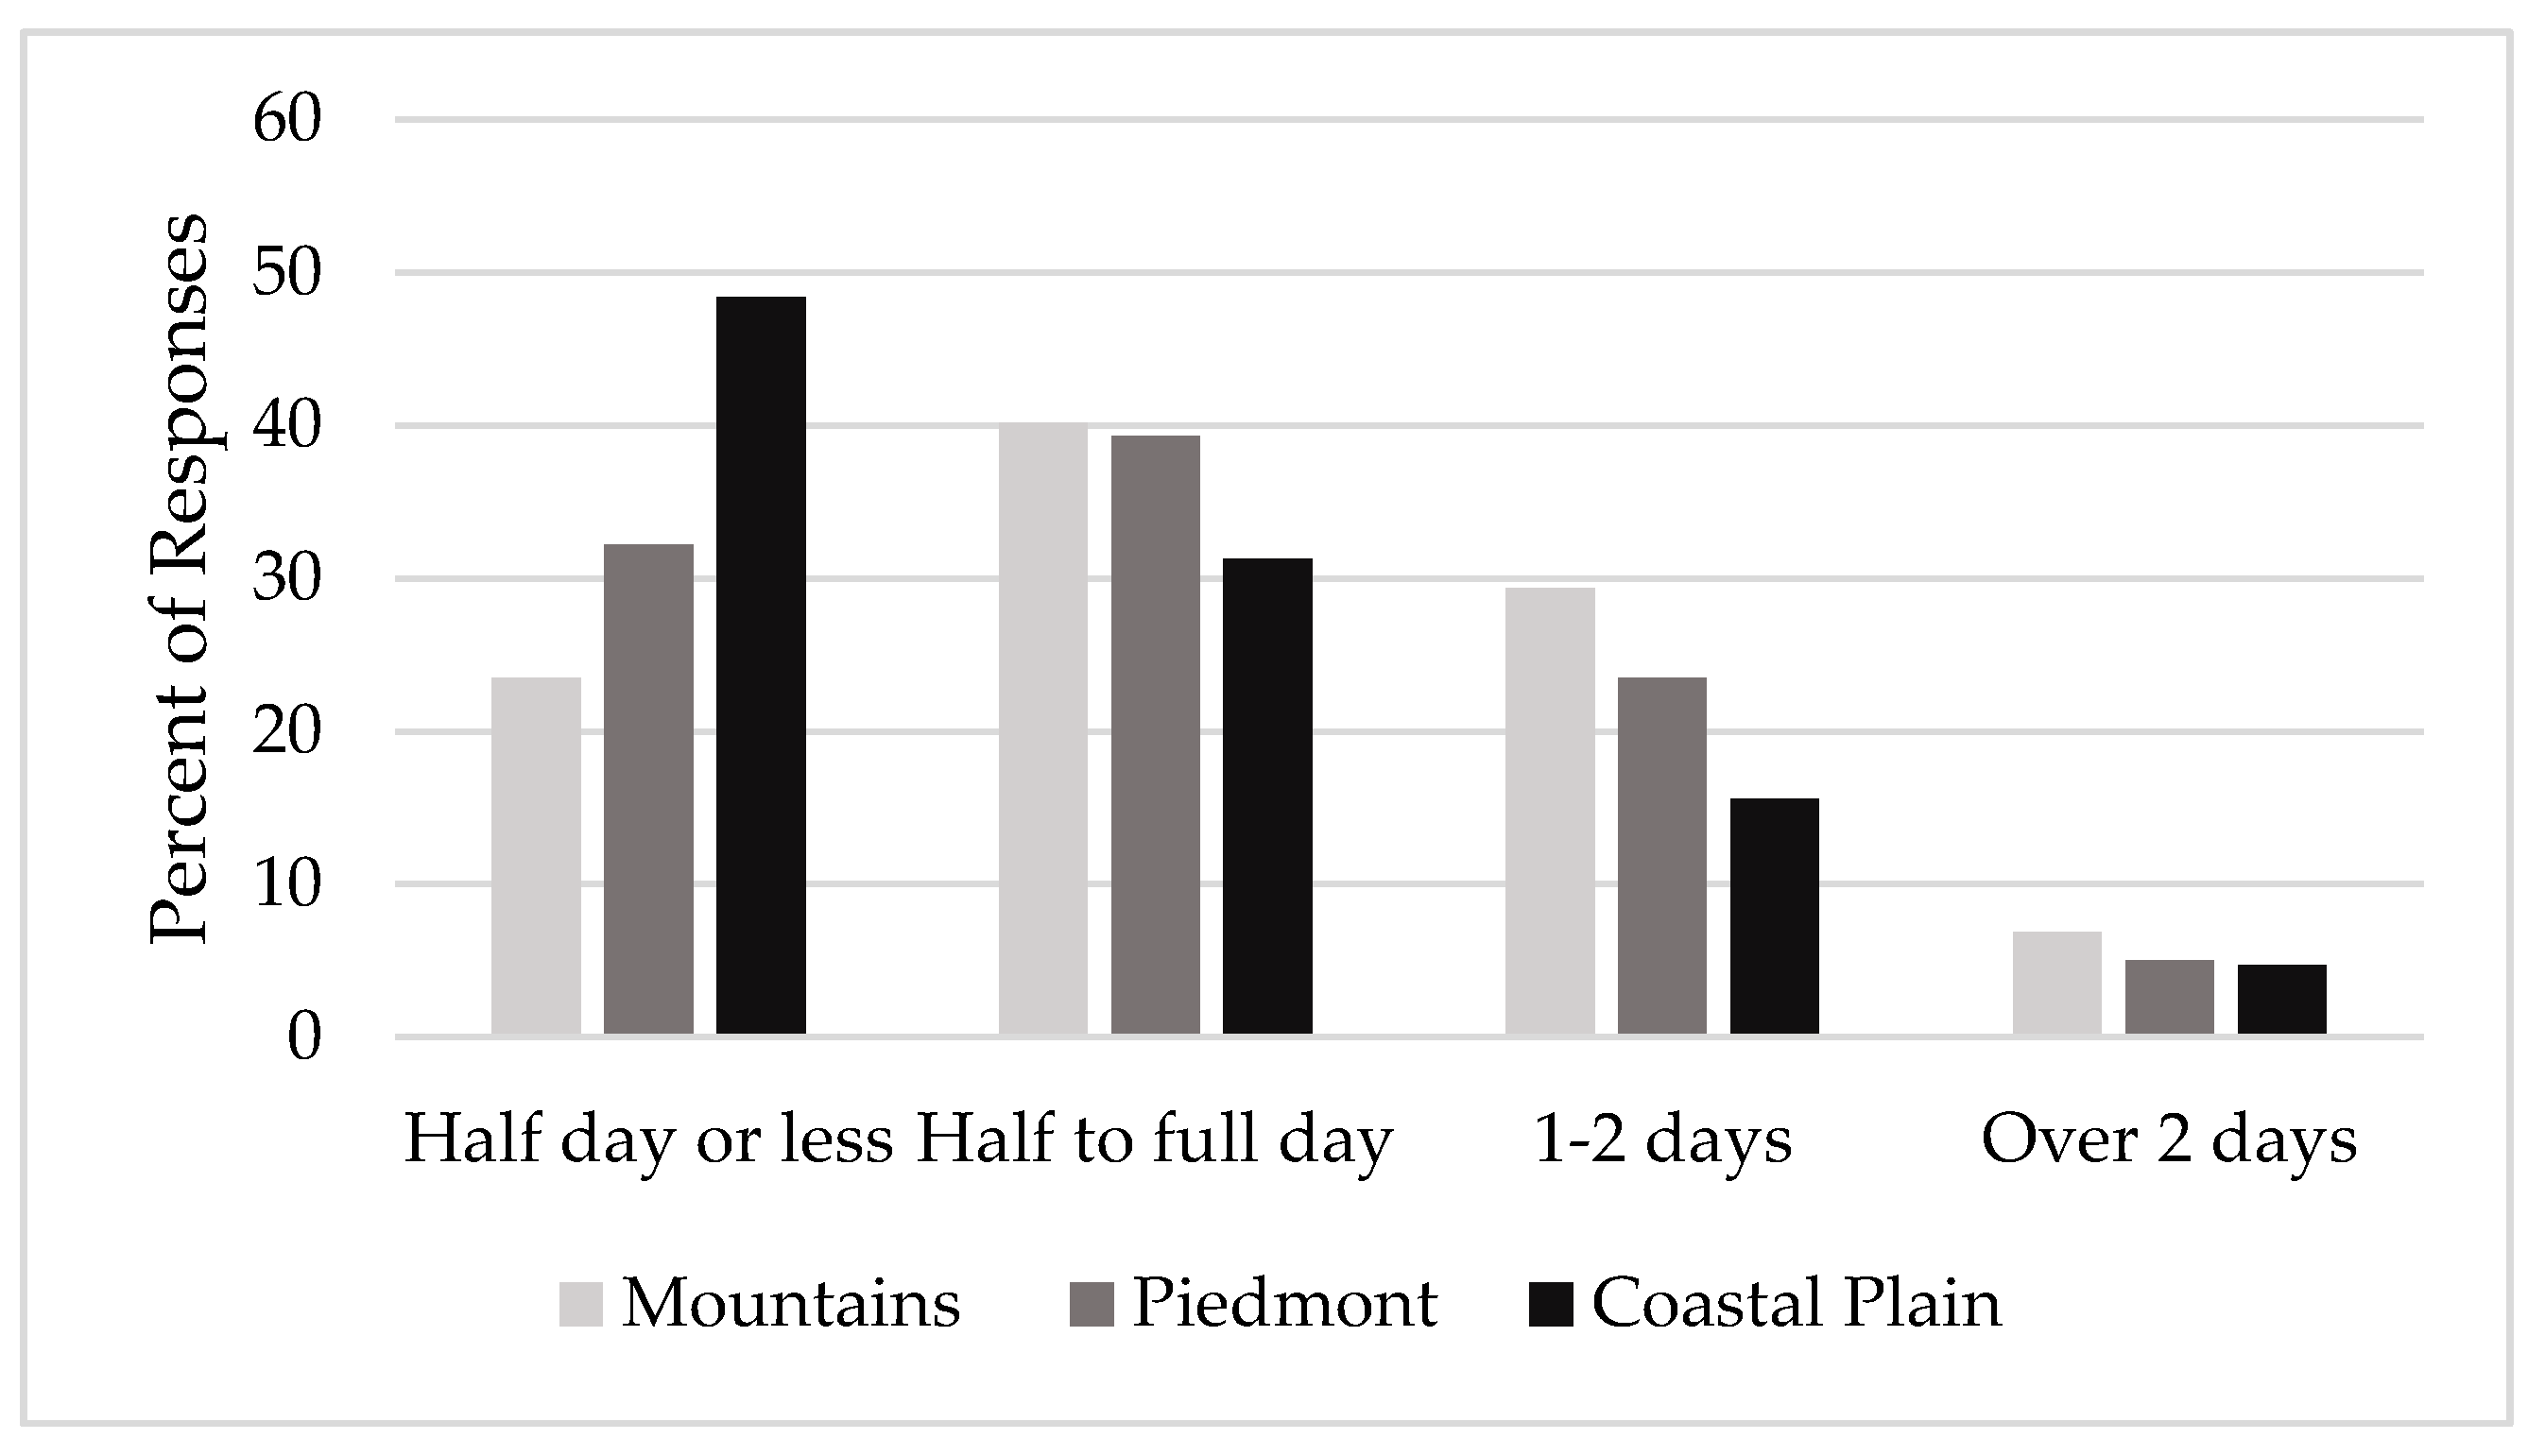
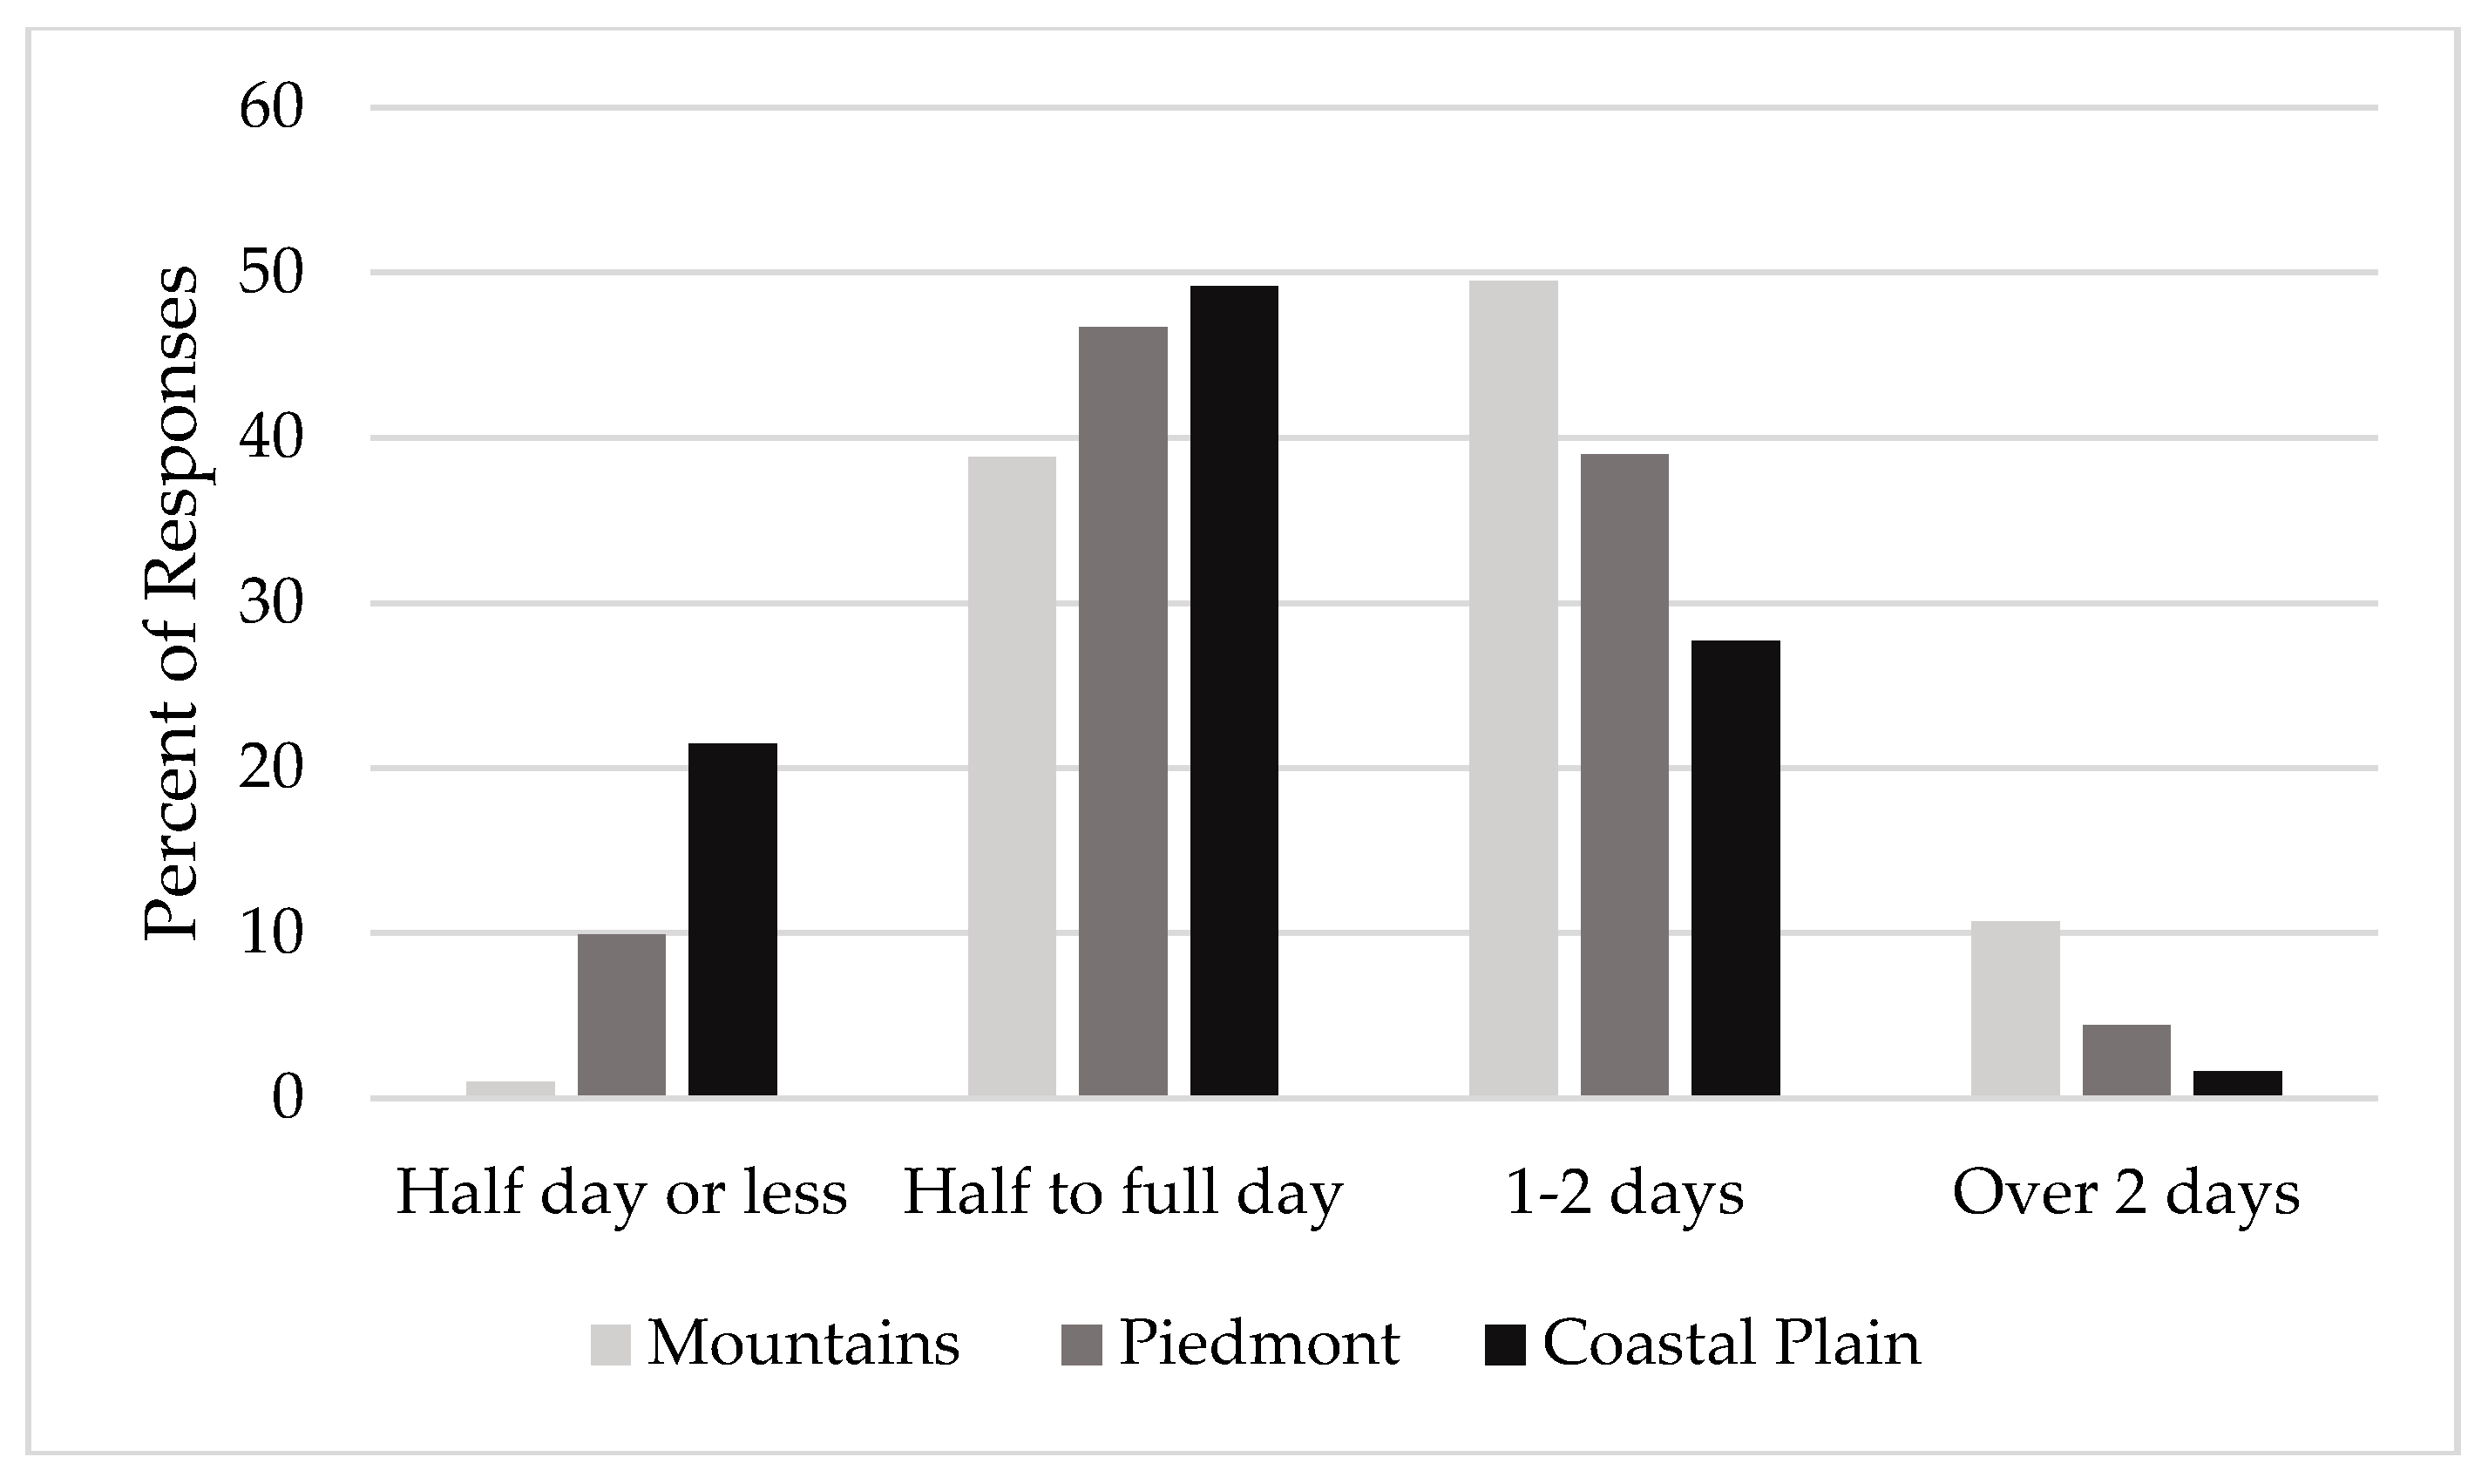
3.5. Harvest Planning and Implementation of BMPs
3.6. Use of Technology and Common Operational Challenges
4. Conclusions
Acknowledgments
Author Contributions
Conflicts of Interest
References
- Rephann, T.J. The Economic Impacts of Agriculture and Forest Industries in Virginia; Weldon Cooper Center for Public Service, University of Virginia: Charlottesville, VA, USA, 2013; pp. 31–37. [Google Scholar]
- Virginia Department of Forestry. 2016 State of the Forrest. Available online: http://dof.virginia.gov/infopubs/sof/SOF-2016pub.pdf (accessed on 12 September 2017).
- Milauskas, S.J.; Wang, J. West Virginia logger characteristics. For. Prod. J. 2006, 56, 19. [Google Scholar]
- Dirkswager, A.L.; Kilgore, M.A.; Becker, D.R.; Blinn, C.; Ek, A. Logging business practices and perspectives on harvesting forest residues for energy: A Minnesota case study. North. J. Appl. For. 2011, 28, 41–46. [Google Scholar]
- Egan, A.; Taggart, D.; Annis, I. Effects of population pressures on wood procurement and logging opportunities in northern New England. North. J. Appl. For. 2007, 24, 85–90. [Google Scholar]
- Munsell, J.F.; Barrett, S.M.; Bolding, M.C. An exploratory study of biomass harvesting among logging firms in Virginia and North Carolina. For. Sci. 2011, 57, 427–434. [Google Scholar]
- Allred, S.; Michler, C.; Mycroft, C. Midwest logging firm perspectives: Harvesting on increasingly parcelized forestlands. Int. J. For. Res. 2011, 2011. [Google Scholar] [CrossRef]
- Moldenhauer, M.C.; Bolding, M.C. Parcelization of South Carolina’s private forestland: Loggers’ reactions to a growing threat. For. Prod. J. 2009, 59, 37. [Google Scholar]
- Blinn, C.R.; O’Hara, T.J.; Chura, D.T.; Russell, M.B. Status of the Minnesota Logging Sector in 2011; Retrieved from the University of Minnesota Digital Conservancy; University of Minnesota: Saint Paul, MN, USA, 2014. [Google Scholar]
- Baker, S.A.; Greene, W.D. Changes in Georgia’s logging workforce, 1987–2007. South. J. Appl. For. 2008, 32, 60–68. [Google Scholar]
- Bolding, M.C.; Barrett, S.M.; Munsell, J.F.; Groover, M.C. Characteristics of Virginia’s logging businesses in a changing timber market. For. Prod. J. 2010, 60, 86–93. [Google Scholar] [CrossRef]
- Virginia SHARP Logger Program. 2017. Available online: http://sharplogger.vt.edu/ (accessed on 26 October 2017).
- Dangle, C.; Vinson, J.A.; Barrett, S.M. Regional Forest Harvest Characteristics across Virginia. Virginia Cooperative Extension Publication Number ANR-264NP. 2017. Available online: http://www.pubs.ext.vt.edu/ANR/ANR-264/ANR-264.html (accessed on 11 July 2017).
- Dillman, D.A. Mail and Internet Surveys: The Tailored Design Method; John Wiley & Sons: New York, NY, USA, 2000; p. 480. [Google Scholar]
- JMP, Version 13.0.0. Available online: https://www.jmp.com/en_us/home.html (accessed on 27 November 2017).
- Cooper, J.; Becker, C. Virginia’s Timber Industry—An Assessment of Timber Product Output and Use, 2007; Resour. Bull. SRS—155; Department of Agriculture Forest Service, Southern Research Station: Asheville, NC, USA, 2009; 33p. [Google Scholar]
- Barrett, S.M.; Bolding, M.C.; Aust, W.M.; Munsell, J.F. Characteristics of logging businesses that harvest biomass for energy production. For. Prod. J. 2014, 64, 265–272. [Google Scholar] [CrossRef]
- Cristan, R.; Aust, W.M.; Bolding, M.C.; Barrett, S.M.; Munsell, J.F.; Schilling, E. Effectiveness of forestry best management practices in the United States: Literature review. For. Ecol. Manag. 2016, 360, 133–151. [Google Scholar] [CrossRef]


| Percent of Responses for Level of Formal Education | ||||
|---|---|---|---|---|
| Some High School | High School Graduate | Some College | College Graduate | |
| Mountains | 29.5 | 55.3 | 7.6 | 7.6 |
| Piedmont | 24.2 | 54.2 | 13.7 | 7.9 |
| Coastal Plain | 13.0 | 47.9 | 13.0 | 26.1 |
| Overall | 24.3 | 53.5 | 11.1 | 11.1 |
| Mean Response Percentage | ||||
|---|---|---|---|---|
| Mountains | Piedmont | Coastal Plain | Overall | |
| Private individuals | 92.0 | 91.3 | 83.2 | 89.6 |
| Forest industry | 2.9 | 5.2 | 4.9 | 4.9 |
| US Forest Service | 4.4 | 0 | 0 | 1.3 |
| State Forests | 0 | 0.1 | 0.3 | 0.1 |
| TIMO/REIT1 | 0 | 3.3 | 9.6 | 3.3 |
| Other | 0.7 | 0.1 | 2.0 | 0.8 |
| n | Mean | MIN | MAX | SD | |
|---|---|---|---|---|---|
| Mountains | |||||
| Crews per business | 99 | 1.05 | 1 | 2 | 0.22 |
| Workers per crew | 98 | 2.80 | 1 | 12 | 1.50 |
| Tonnes per crew per week | 89 | 224.62 | 16 | 1247 | 201.35 |
| Tonnes per business per week | 87 | 245.42 | 16 | 1247 | 251.27 |
| Total current investment 1 (thousand USD) | 87 | 257.68 | 2 | 3000 | 514.39 |
| Annual tonnes per $1000 investment 2 | 73 | 99.18 | 10 | 499 | 92.02 |
| Piedmont | |||||
| Crews per business | 180 | 1.20 | 1 | 4 | 0.51 |
| Workers per crew | 178 | 3.31 | 1 | 15 | 1.85 |
| Tonnes per crew per week | 169 | 581.84 | 11 | 2948 | 509.77 |
| Tonnes per business per week | 169 | 824.69 | 11 | 6804 | 1125.81 |
| Total current investment 1 (thousand USD) | 158 | 491.81 | 5 | 6000 | 712.42 |
| Annual tonnes per $1000 investment 2 | 149 | 113.01 | 4 | 653 | 97.50 |
| Coastal Plain | |||||
| Crews per business | 64 | 1.48 | 1 | 5 | 0.91 |
| Workers per crew | 64 | 4.16 | 1 | 11 | 1.85 |
| Tonnes per crew per week | 57 | 864.01 | 23 | 2268 | 509.45 |
| Tonnes per business per week | 57 | 1403.55 | 23 | 6350 | 1396.08 |
| Total current investment 1 (thousand USD) | 56 | 794.73 | 10 | 5000 | 919.48 |
| Annual tonnes per $1000 investment 2 | 49 | 125.17 | 9 | 680 | 115.51 |
| Overall 3 | |||||
| Crews per business | 373 | 1.20 | 1 | 5 | 0.55 |
| Workers per crew | 369 | 3.29 | 1 | 15 | 1.77 |
| Tonnes per crew per week | 339 | 530.94 | 11 | 3062 | 505.56 |
| Tonnes per business per week | 336 | 761.37 | 11 | 6804 | 1105.24 |
| Total current investment 1 (thousand USD) | 328 | 462.07 | 2 | 6000 | 704.14 |
| Annual tonnes per $1000 investment 2 | 291 | 112.56 | 4 | 680 | 99.48 |
| % Responses (% of Overall Total Reported Production in Tonnes) | ||||||||
|---|---|---|---|---|---|---|---|---|
| Mountains | Piedmont | Coastal Plain | Overall | |||||
| Felling | ||||||||
| Chainsaw | 88.4 | (66.6) | 29.6 | (6.7) | 11.1 | (0.6) | 43.7 | (10.1) |
| Rubber-tired feller-buncher | 4.9 | (13.8) | 60.7 | (85.6) | 84.1 | (93.7) | 48.2 | (81.7) |
| Tracked feller-buncher | 3.9 | (15.4) | 1.1 | (0.8) | 1.6 | (1.3) | 1.8 | (2.1) |
| Cut-to-length harvester | 0 | (0) | 0.5 | (0.3) | 0 | (0) | 0.3 | (0.2) |
| Other/Multiple 1 | 2.9 | (4.1) | 8.1 | (6.6) | 3.2 | (4.4) | 6.0 | (5.9) |
| Skidding | ||||||||
| Cable skidder | 48.0 | (35.4) | 11.4 | (1.7) | 6.3 | (0.4) | 22.1 | (4.4) |
| Grapple skidder | 38.2 | (56.1) | 78.8 | (96.0) | 92.1 | (99.6) | 68.2 | (93.2) |
| Forwarder | 1.0 | (0.5) | 0.5 | (0) | 0 | (0) | 0.5 | (<0.1) |
| Bulldozer | 2.0 | (0.3) | 2.2 | (<0.1) | 0 | (0) | 1.6 | (<0.1) |
| Other/Multiple 1 | 10.8 | (7.7) | 7.1 | (2.3) | 1.6 | (<0.1) | 7.6 | (2.4) |
| Delimbing | ||||||||
| Chainsaw | 84.4 | (61.9) | 36.9 | (12.5) | 14.1 | (0.9) | 46.6 | (13.0) |
| Delimbing gate | 1.0 | (2.1) | 5.6 | (5.5) | 7.8 | (13.1) | 4.5 | (7.5) |
| Pull-through delimber | 8.7 | (18.0) | 46.9 | (63.1) | 70.3 | (76.3) | 40.2 | (64.6) |
| Chain-flail delimber | 0 | (0) | 1.1 | (0.9) | 4.7 | (5.4) | 1.3 | (2.2) |
| Stroke delimber | 1.0 | (4.2) | 2.8 | (10.1) | 0 | (0) | 1.6 | (5.6) |
| Other/Multiple 1 | 4.9 | (13.8) | 6.7 | (7.9) | 3.1 | (4.3) | 5.8 | (7.1) |
| Bucking | ||||||||
| Chainsaw | 40.2 | (21.0) | 18.1 | (3.2) | 13.6 | (5.2) | 23.7 | (5.5) |
| Buck/Slasher saw | 52.6 | (76.0) | 79.1 | (89.6) | 77.9 | (90.0) | 71.3 | (88.9) |
| Swing-boom processor | 0 | (0) | 0 | (0) | 1.7 | (<0.1) | 0.3 | (<0.1) |
| Tree length only (no bucking) | 0 | (0) | 1.7 | (4.1) | 3.4 | (2.5) | 1.4 | (3.0) |
| Other/Multiple 1 | 7.2 | (3.0) | 1.1 | (3.1) | 3.4 | (2.3) | 3.3 | (2.6) |
| Loading | ||||||||
| Trailer mounted knuckleboom | 50.5 | (56.6) | 78.4 | (90.3) | 88.7 | (97.1) | 73.0 | (90.0) |
| Mobile knuckleboom | 30.1 | (22.4) | 10.8 | (8.2) | 3.2 | (0.4) | 14.4 | (6.5) |
| Self-loading trucks | 6.8 | (4.9) | 0.5 | (0.4) | 0 | (0) | 2.1 | (0.6) |
| Front-end loader | 5.8 | (1.4) | 4.9 | (0.3) | 3.2 | (0.2) | 4.7 | (0.4) |
| Other/Multiple 1 | 6.8 | (14.7) | 5.4 | (0.8) | 4.9 | (2.3) | 5.8 | (2.5) |
| Trucking | ||||||||
| Tractor-trailer | 23.0 | (35.5) | 70.6 | (95.1) | 89.5 | (99.2) | 58.5 | (90.9) |
| Single axle | 7.0 | (1.8) | 8.3 | (0.7) | 3.5 | (0.1) | 7.4 | (0.7) |
| Tandem axle | 16.0 | (5.7) | 9.4 | (1.3) | 1.8 | (0.7) | 10.9 | (1.7) |
| Tandem with pup trailer | 8.0 | (11.3) | 2.8 | (1.1) | 0 | (0) | 4.4 | (1.9) |
| Tri-axle | 14 | (8.8) | 5.0 | (1.6) | 0 | (0) | 6.3 | (1.6) |
| Tri-axle with pup trailer | 15 | (20.6) | 1.1 | (.2) | 0 | (0) | 4.6 | (1.8) |
| Other/Multiple 1 | 17.0 | (16.3) | 2.8 | (0) | 5.2 | (<0.1) | 7.9 | (1.4) |
| Chipping (or biomass production) | ||||||||
| Whole tree (dirty chips) | 7.6 | (24.1) | 29.2 | (51.5) | 18.6 | (29.7) | 20 | (39.8) |
| Whole tree w/flail (clean chips) | 1.0 | (3.2) | 2.6 | (1.4) | 1.4 | (4.3) | 1.7 | (2.3) |
| Whole tree w/flail + grinder | 0 | (0) | 0.5 | (1.6) | 2.9 | (10.2) | 0.8 | (4.1) |
| Other/Multiple 1 | 1.0 | (0) | 1.6 | (3.9) | 4.3 | (5.7) | 2.0 | (4.2) |
| No chipper reported | 90.4 | (72.7) | 66.1 | (41.6) | 72.8 | (50.1) | 75.5 | (49.6) |
| Percent Harvesting Biomass | |||
|---|---|---|---|
| Production Category | Mountains | Piedmont | Coastal Plain |
| All respondents | 8.7 | 35.2 | 29.2 |
| High Production (Upper third) | 20.7 | 60.7 | 52.6 |
| Medium Production (Middle third) | 3.4 | 39.3 | 26.3 |
| Low Production (Lower third) | 0 | 11.1 | 15.8 |
| Percent Who Indicated Use of This Technology 1 | |||
|---|---|---|---|
| Technology | Mountains | Piedmont | Coastal Plain |
| GPS | 18.8 | 29.8 | 44.6 |
| Computer mapping | 13.7 | 27.0 | 27.7 |
| Internet | 43.1 | 51.1 | 75.4 |
| 39.6 | 53.9 | 80.0 | |
© 2017 by the authors. Licensee MDPI, Basel, Switzerland. This article is an open access article distributed under the terms and conditions of the Creative Commons Attribution (CC BY) license (http://creativecommons.org/licenses/by/4.0/).
Share and Cite
Barrett, S.M.; Bolding, M.C.; Munsell, J.F. Characteristics of Logging Businesses across Virginia’s Diverse Physiographic Regions. Forests 2017, 8, 468. https://doi.org/10.3390/f8120468
Barrett SM, Bolding MC, Munsell JF. Characteristics of Logging Businesses across Virginia’s Diverse Physiographic Regions. Forests. 2017; 8(12):468. https://doi.org/10.3390/f8120468
Chicago/Turabian StyleBarrett, Scott M., M. Chad Bolding, and John F. Munsell. 2017. "Characteristics of Logging Businesses across Virginia’s Diverse Physiographic Regions" Forests 8, no. 12: 468. https://doi.org/10.3390/f8120468
APA StyleBarrett, S. M., Bolding, M. C., & Munsell, J. F. (2017). Characteristics of Logging Businesses across Virginia’s Diverse Physiographic Regions. Forests, 8(12), 468. https://doi.org/10.3390/f8120468