The Effect of Logging and Strip Cutting on Forest Floor Light Condition and Following Change

Abstract
:1. Introduction
2. Materials and Methods
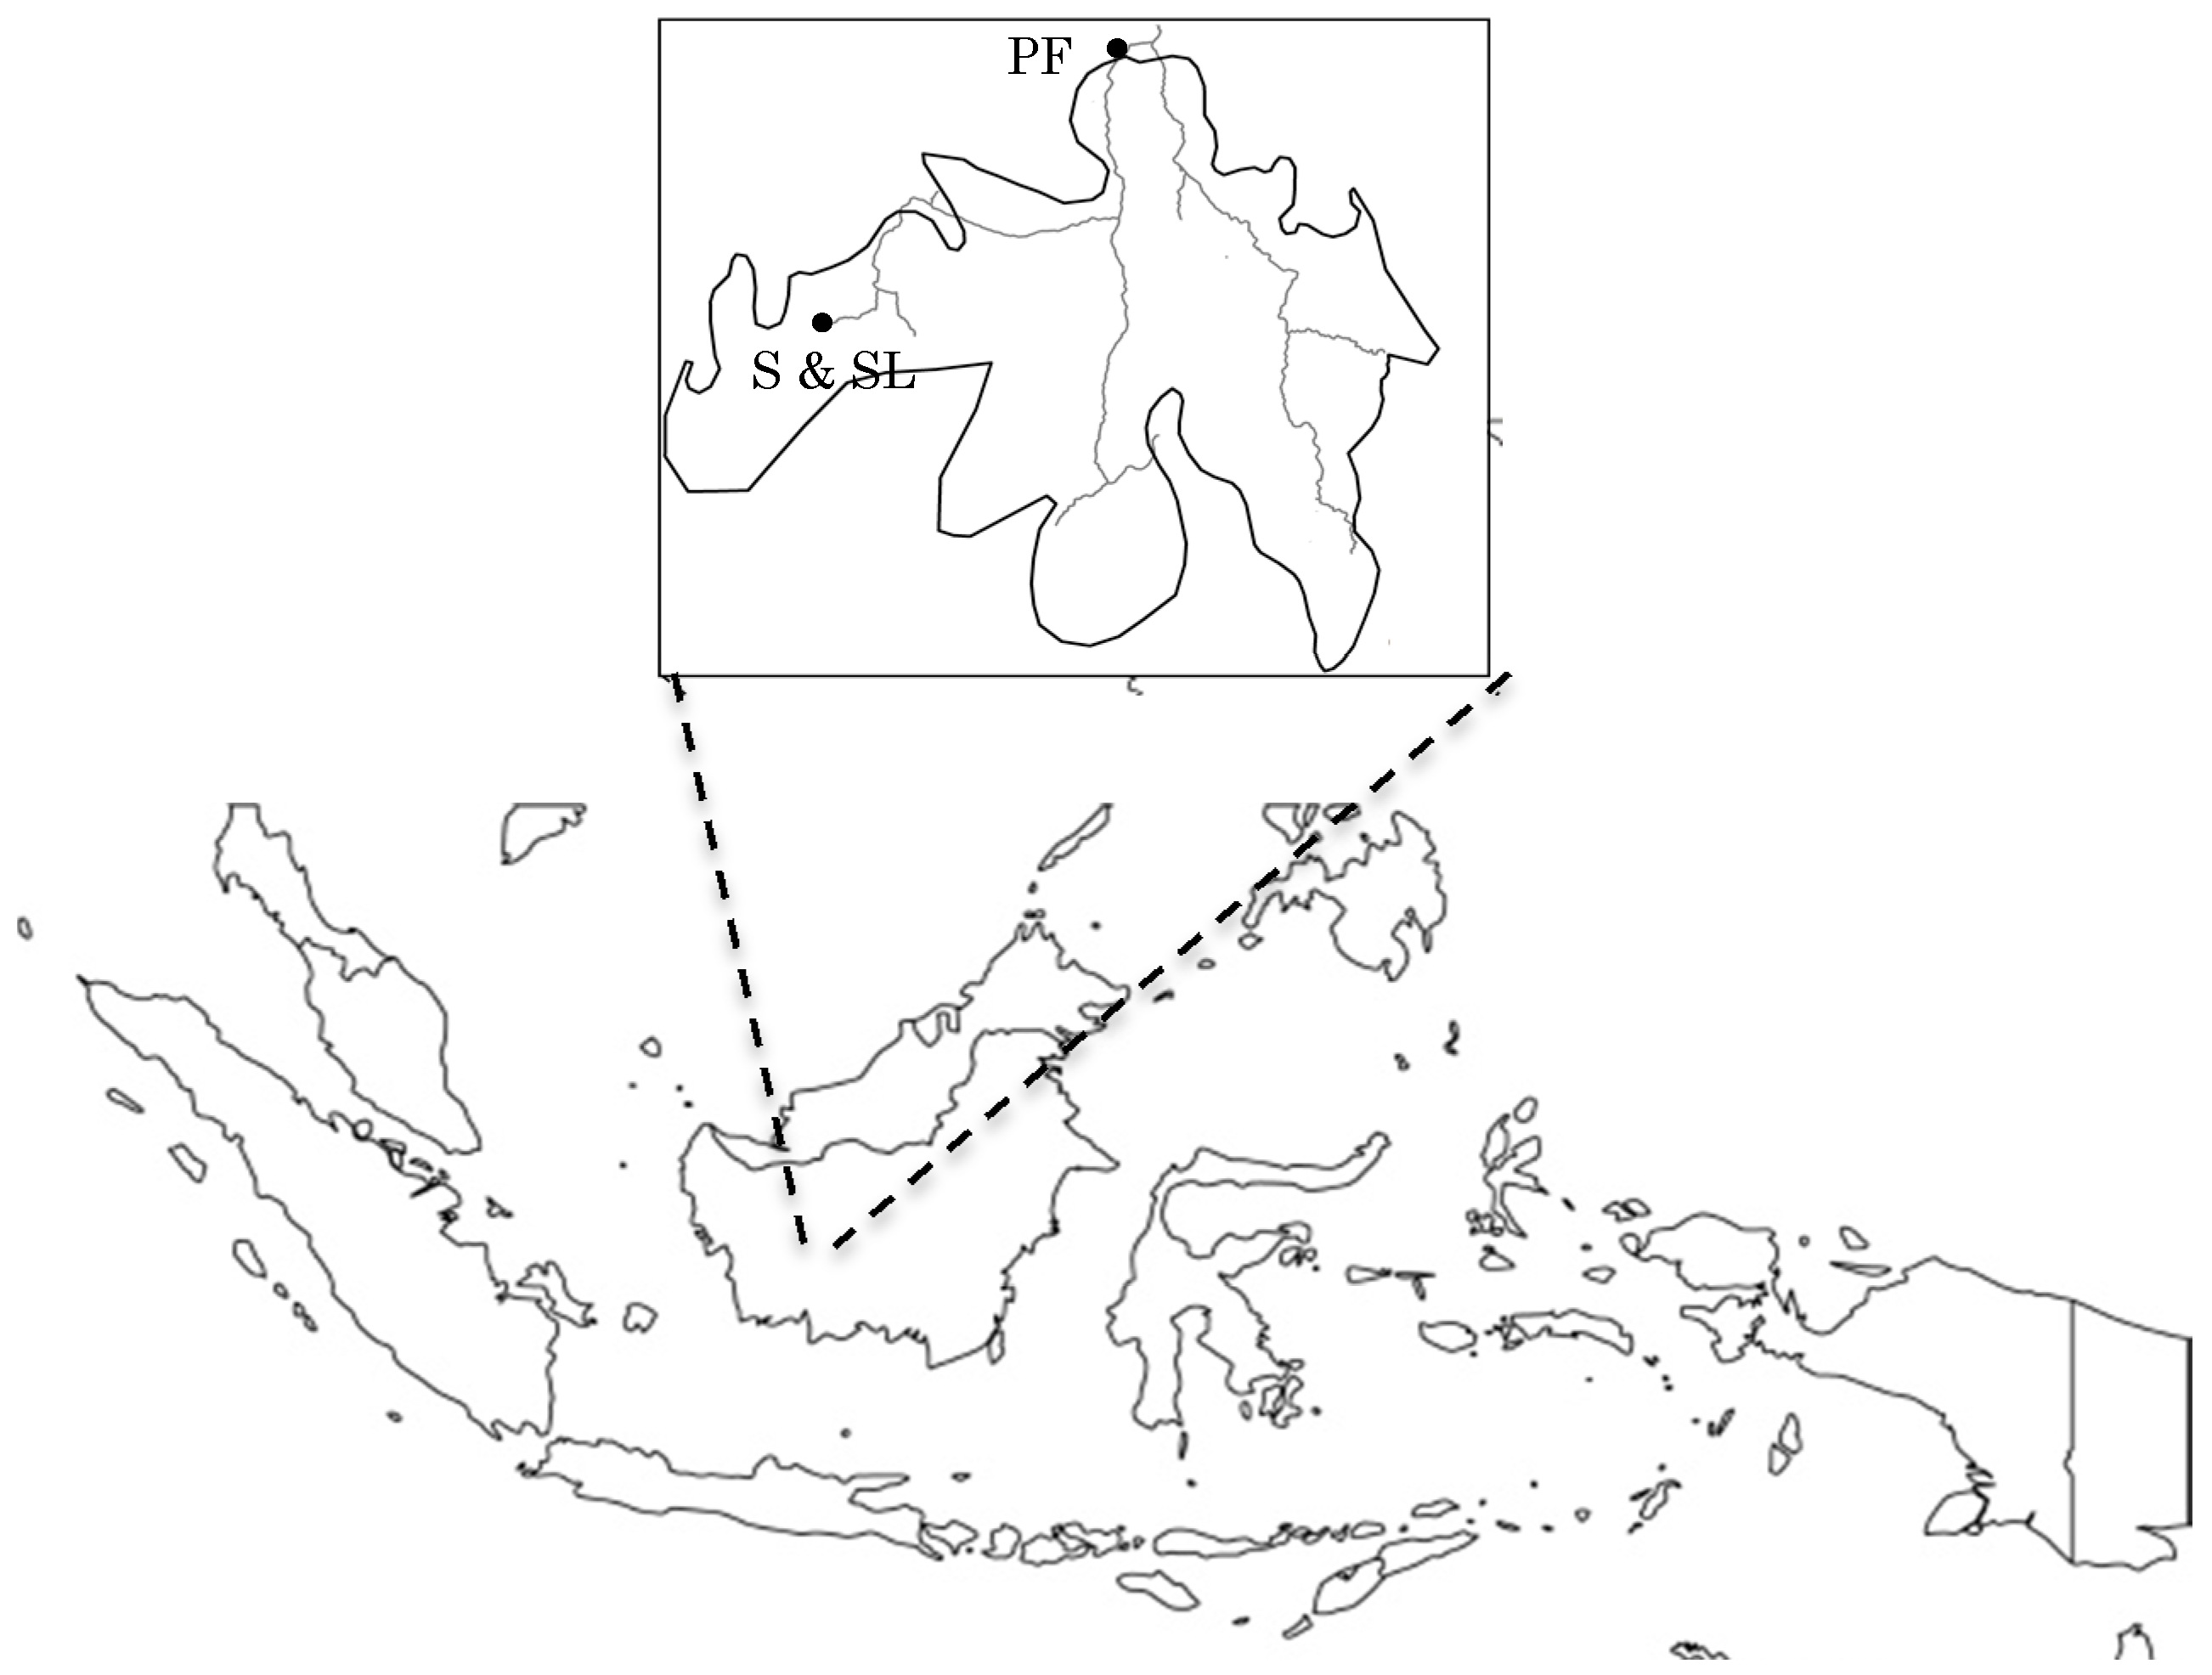
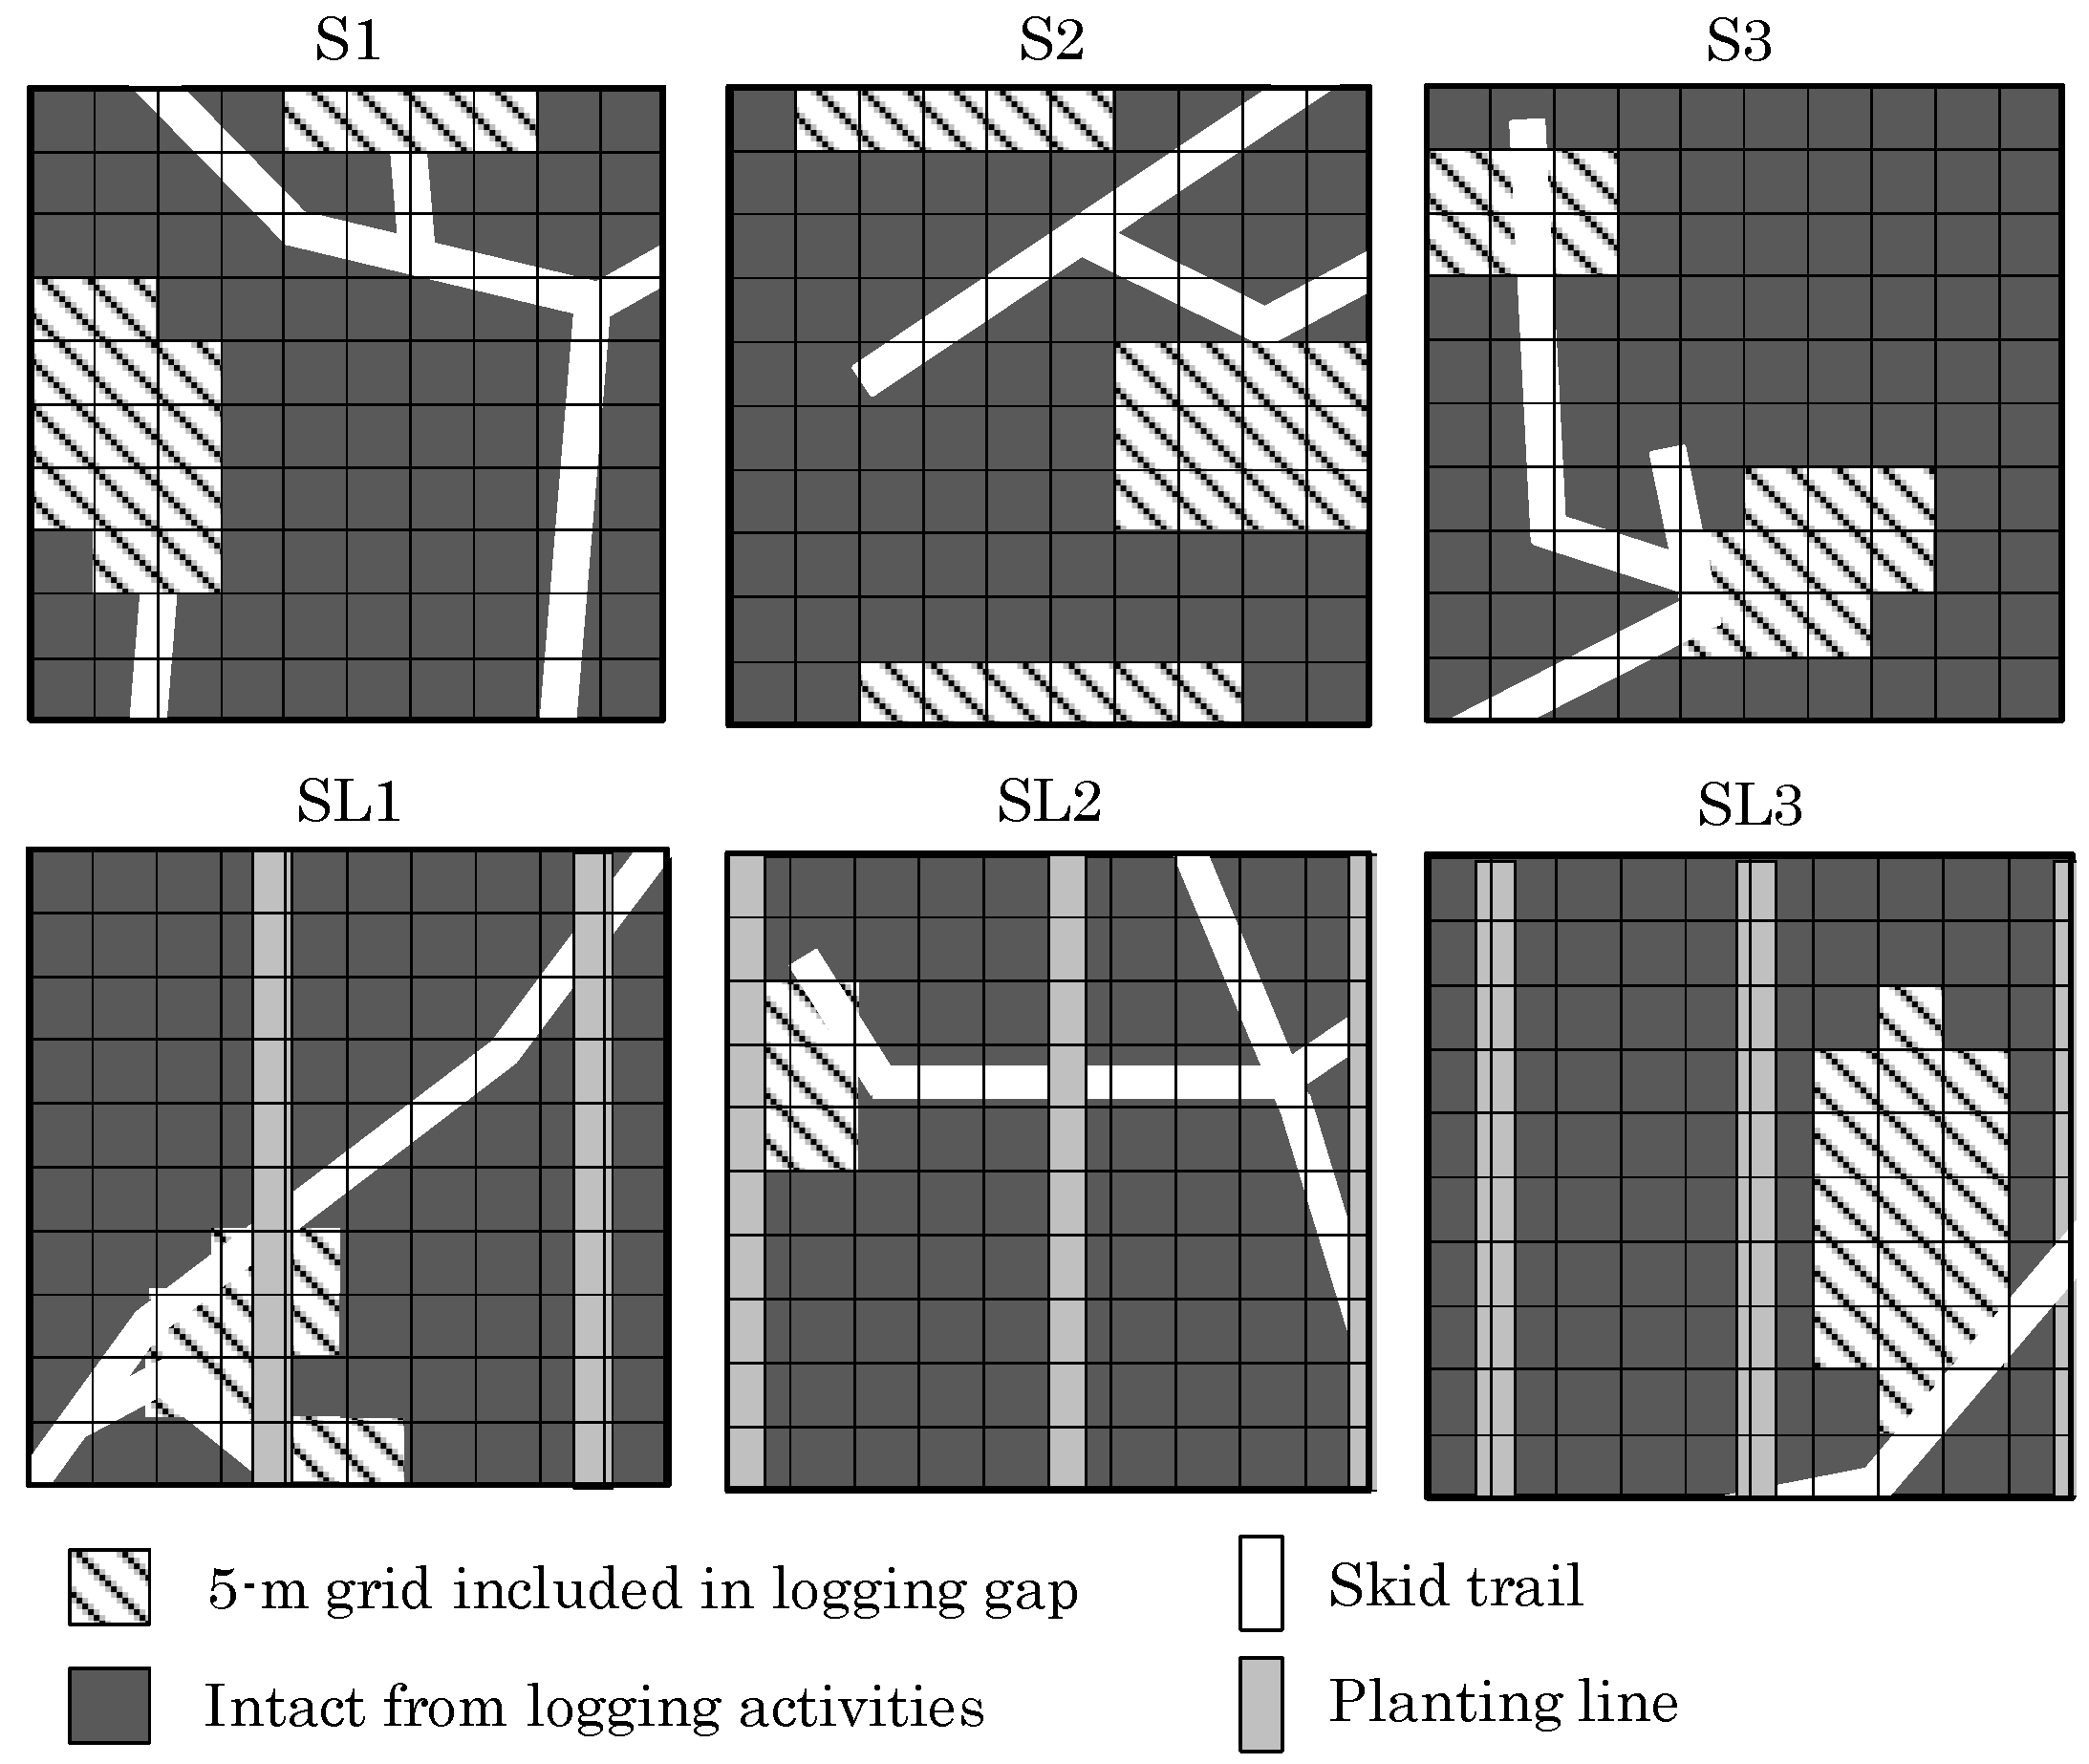
2.1. Study Site
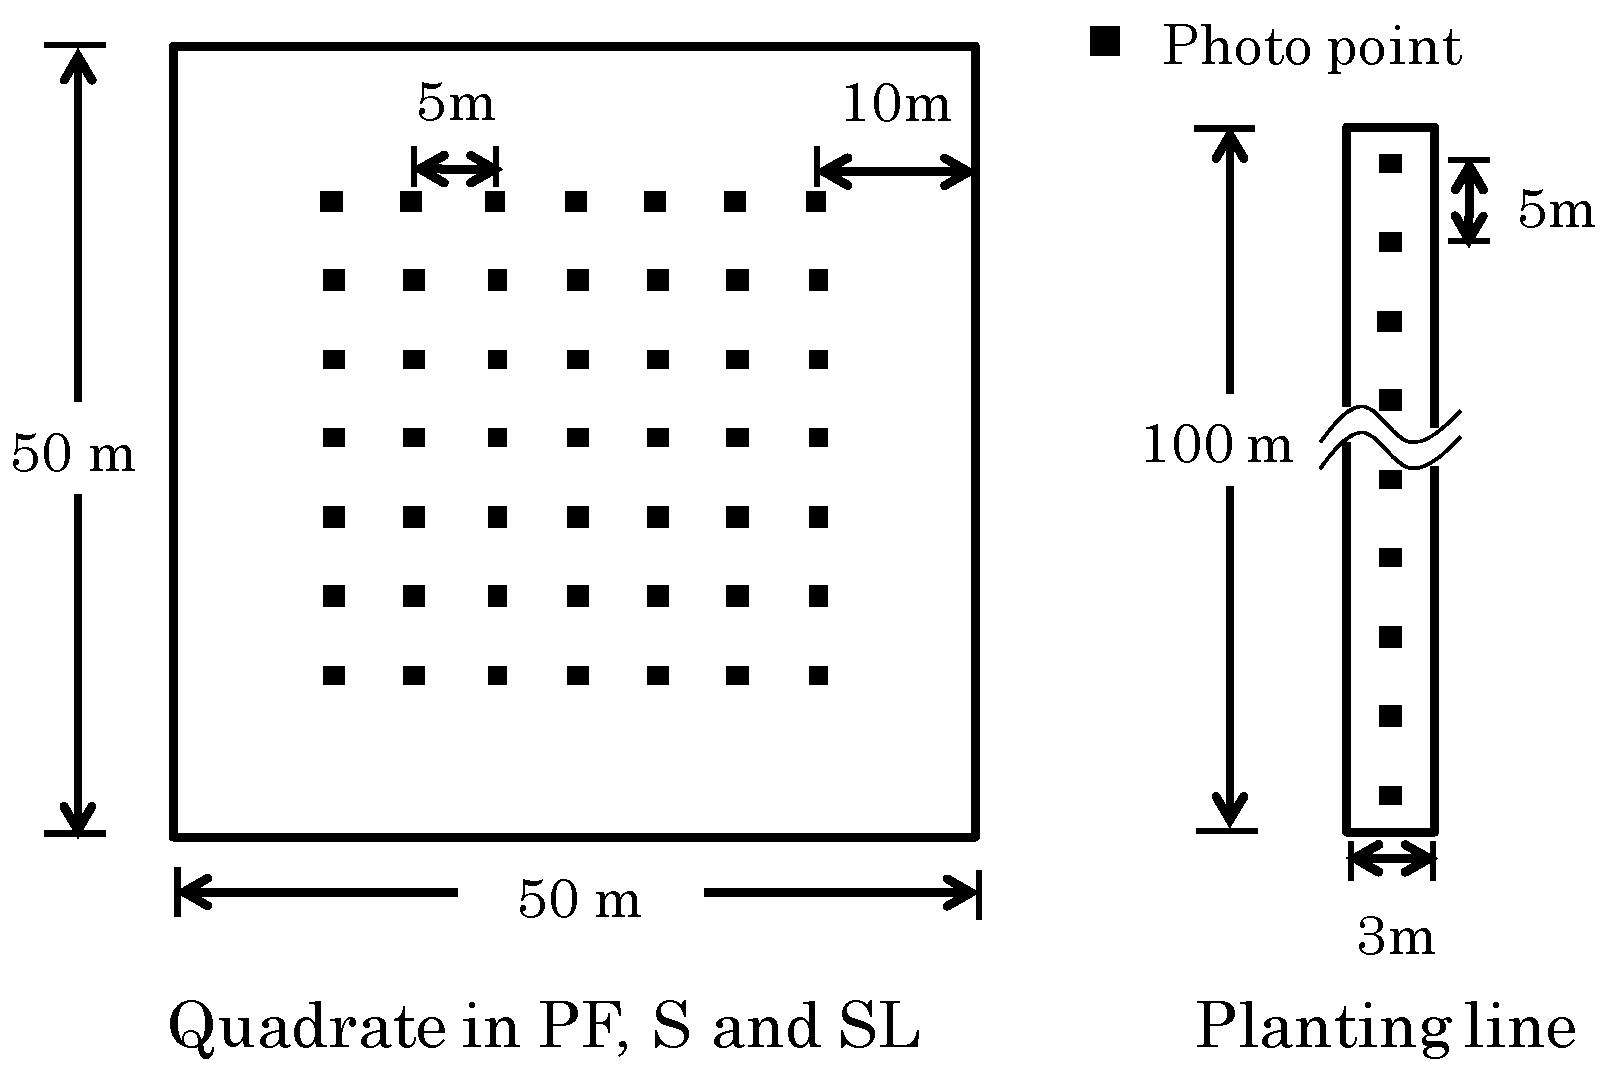
2.2. Plot Setting
2.3. Hemispherical Photography and Image Analysis
2.4. Monitoring Planted Seedlings in the Planting Lines
2.5. Statistical Analysis
3 Results
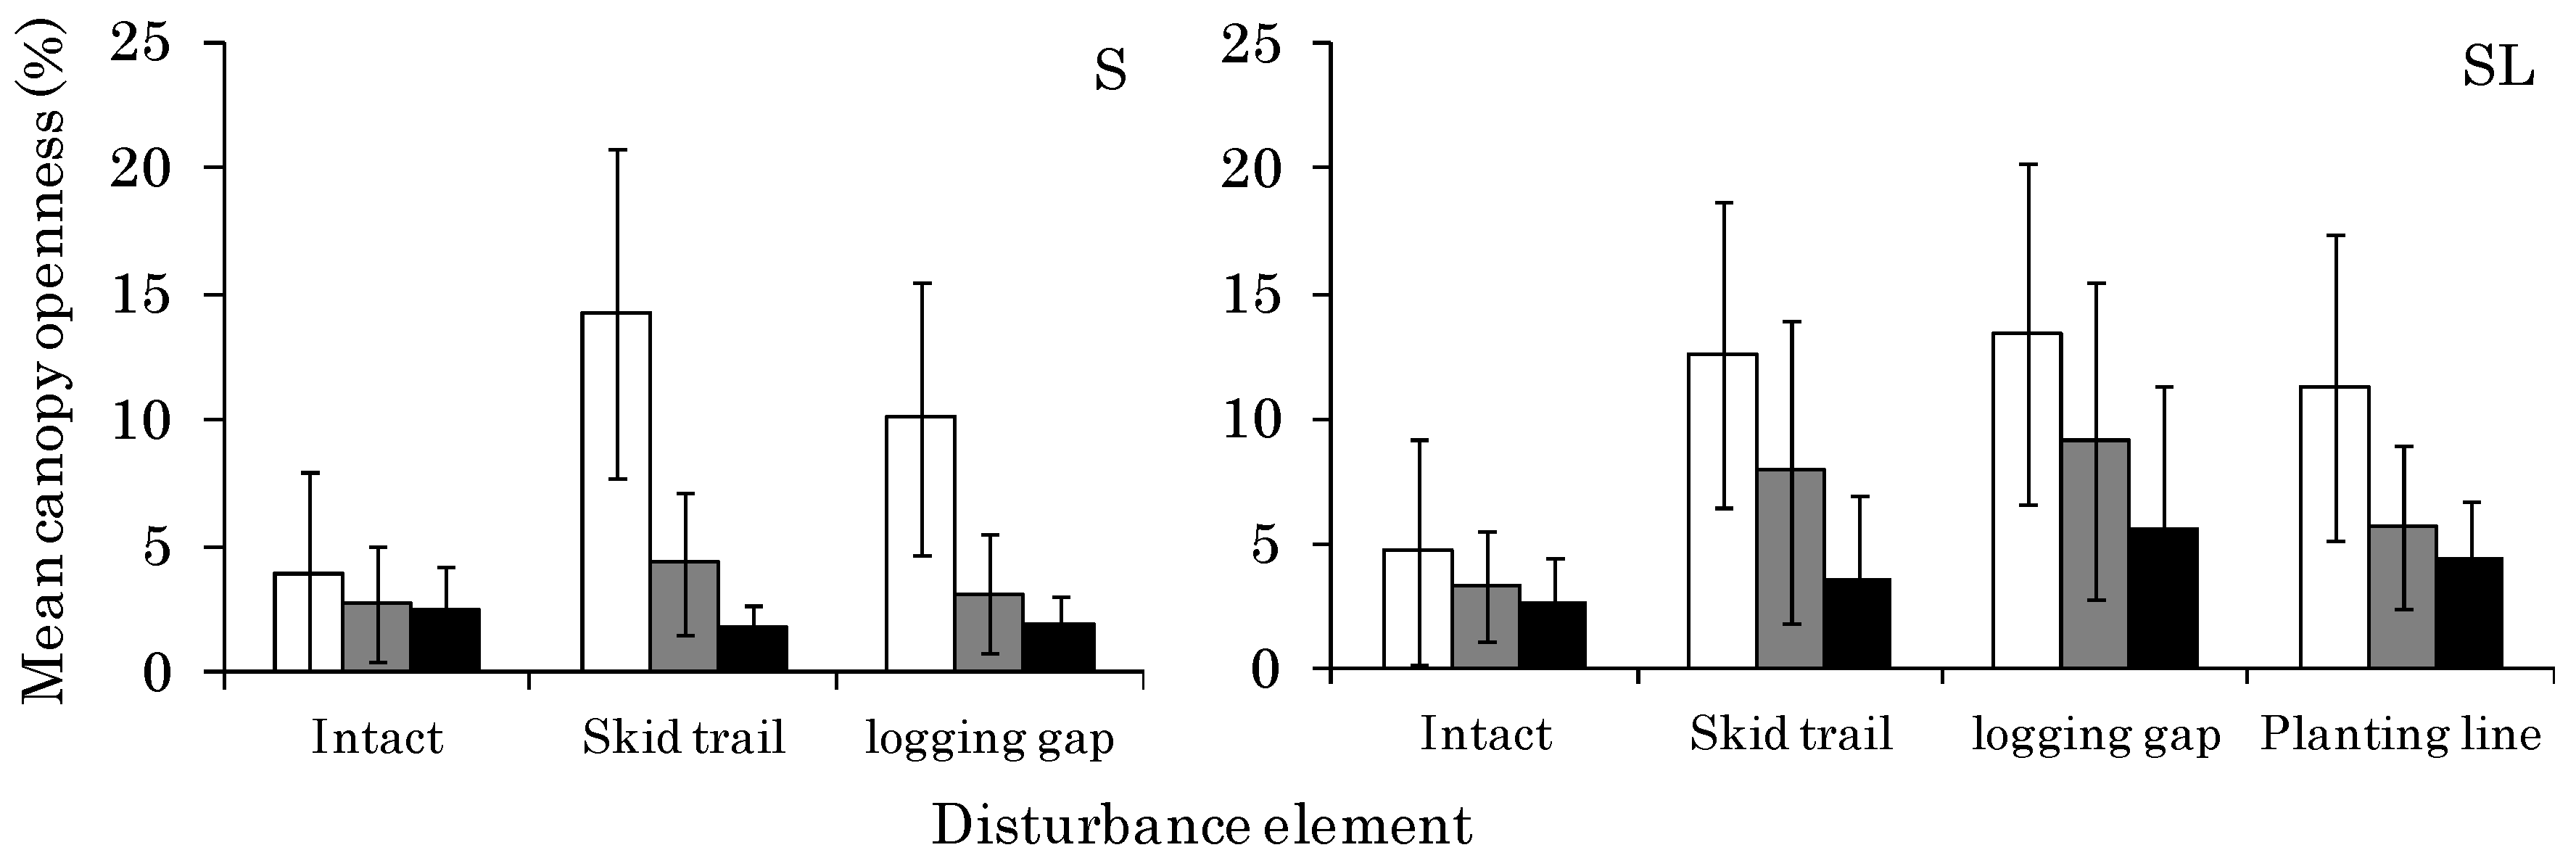
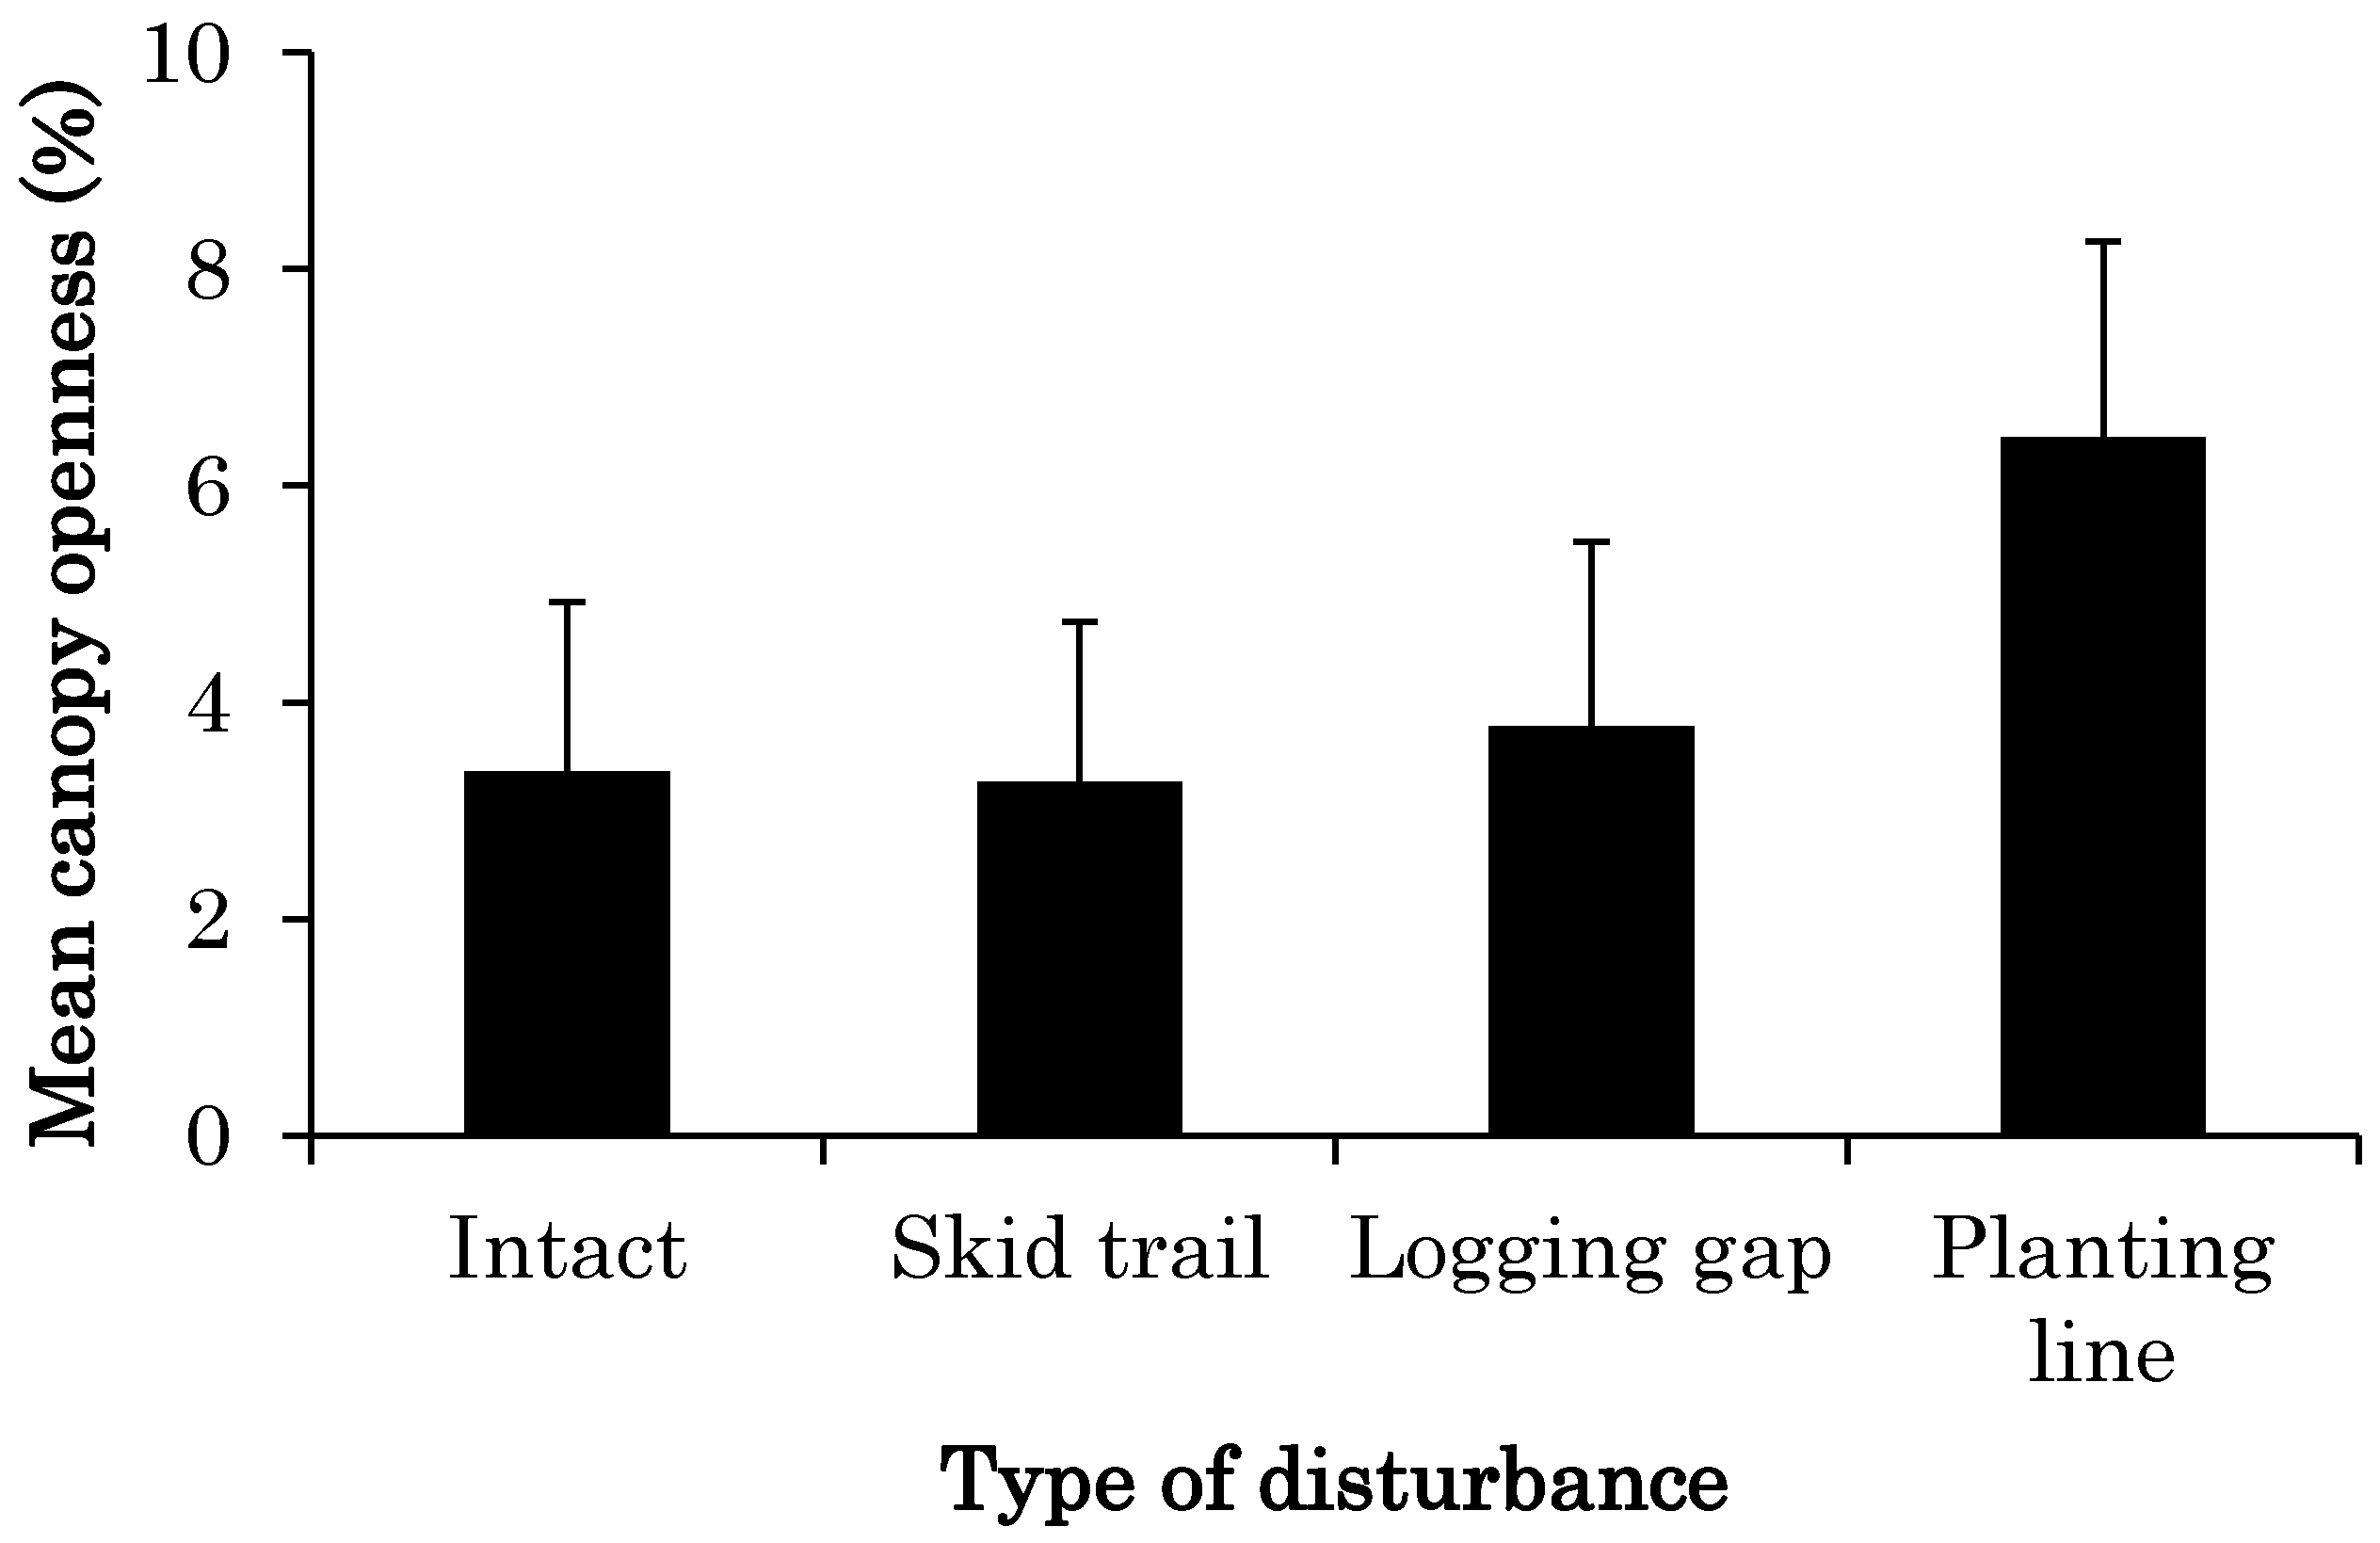
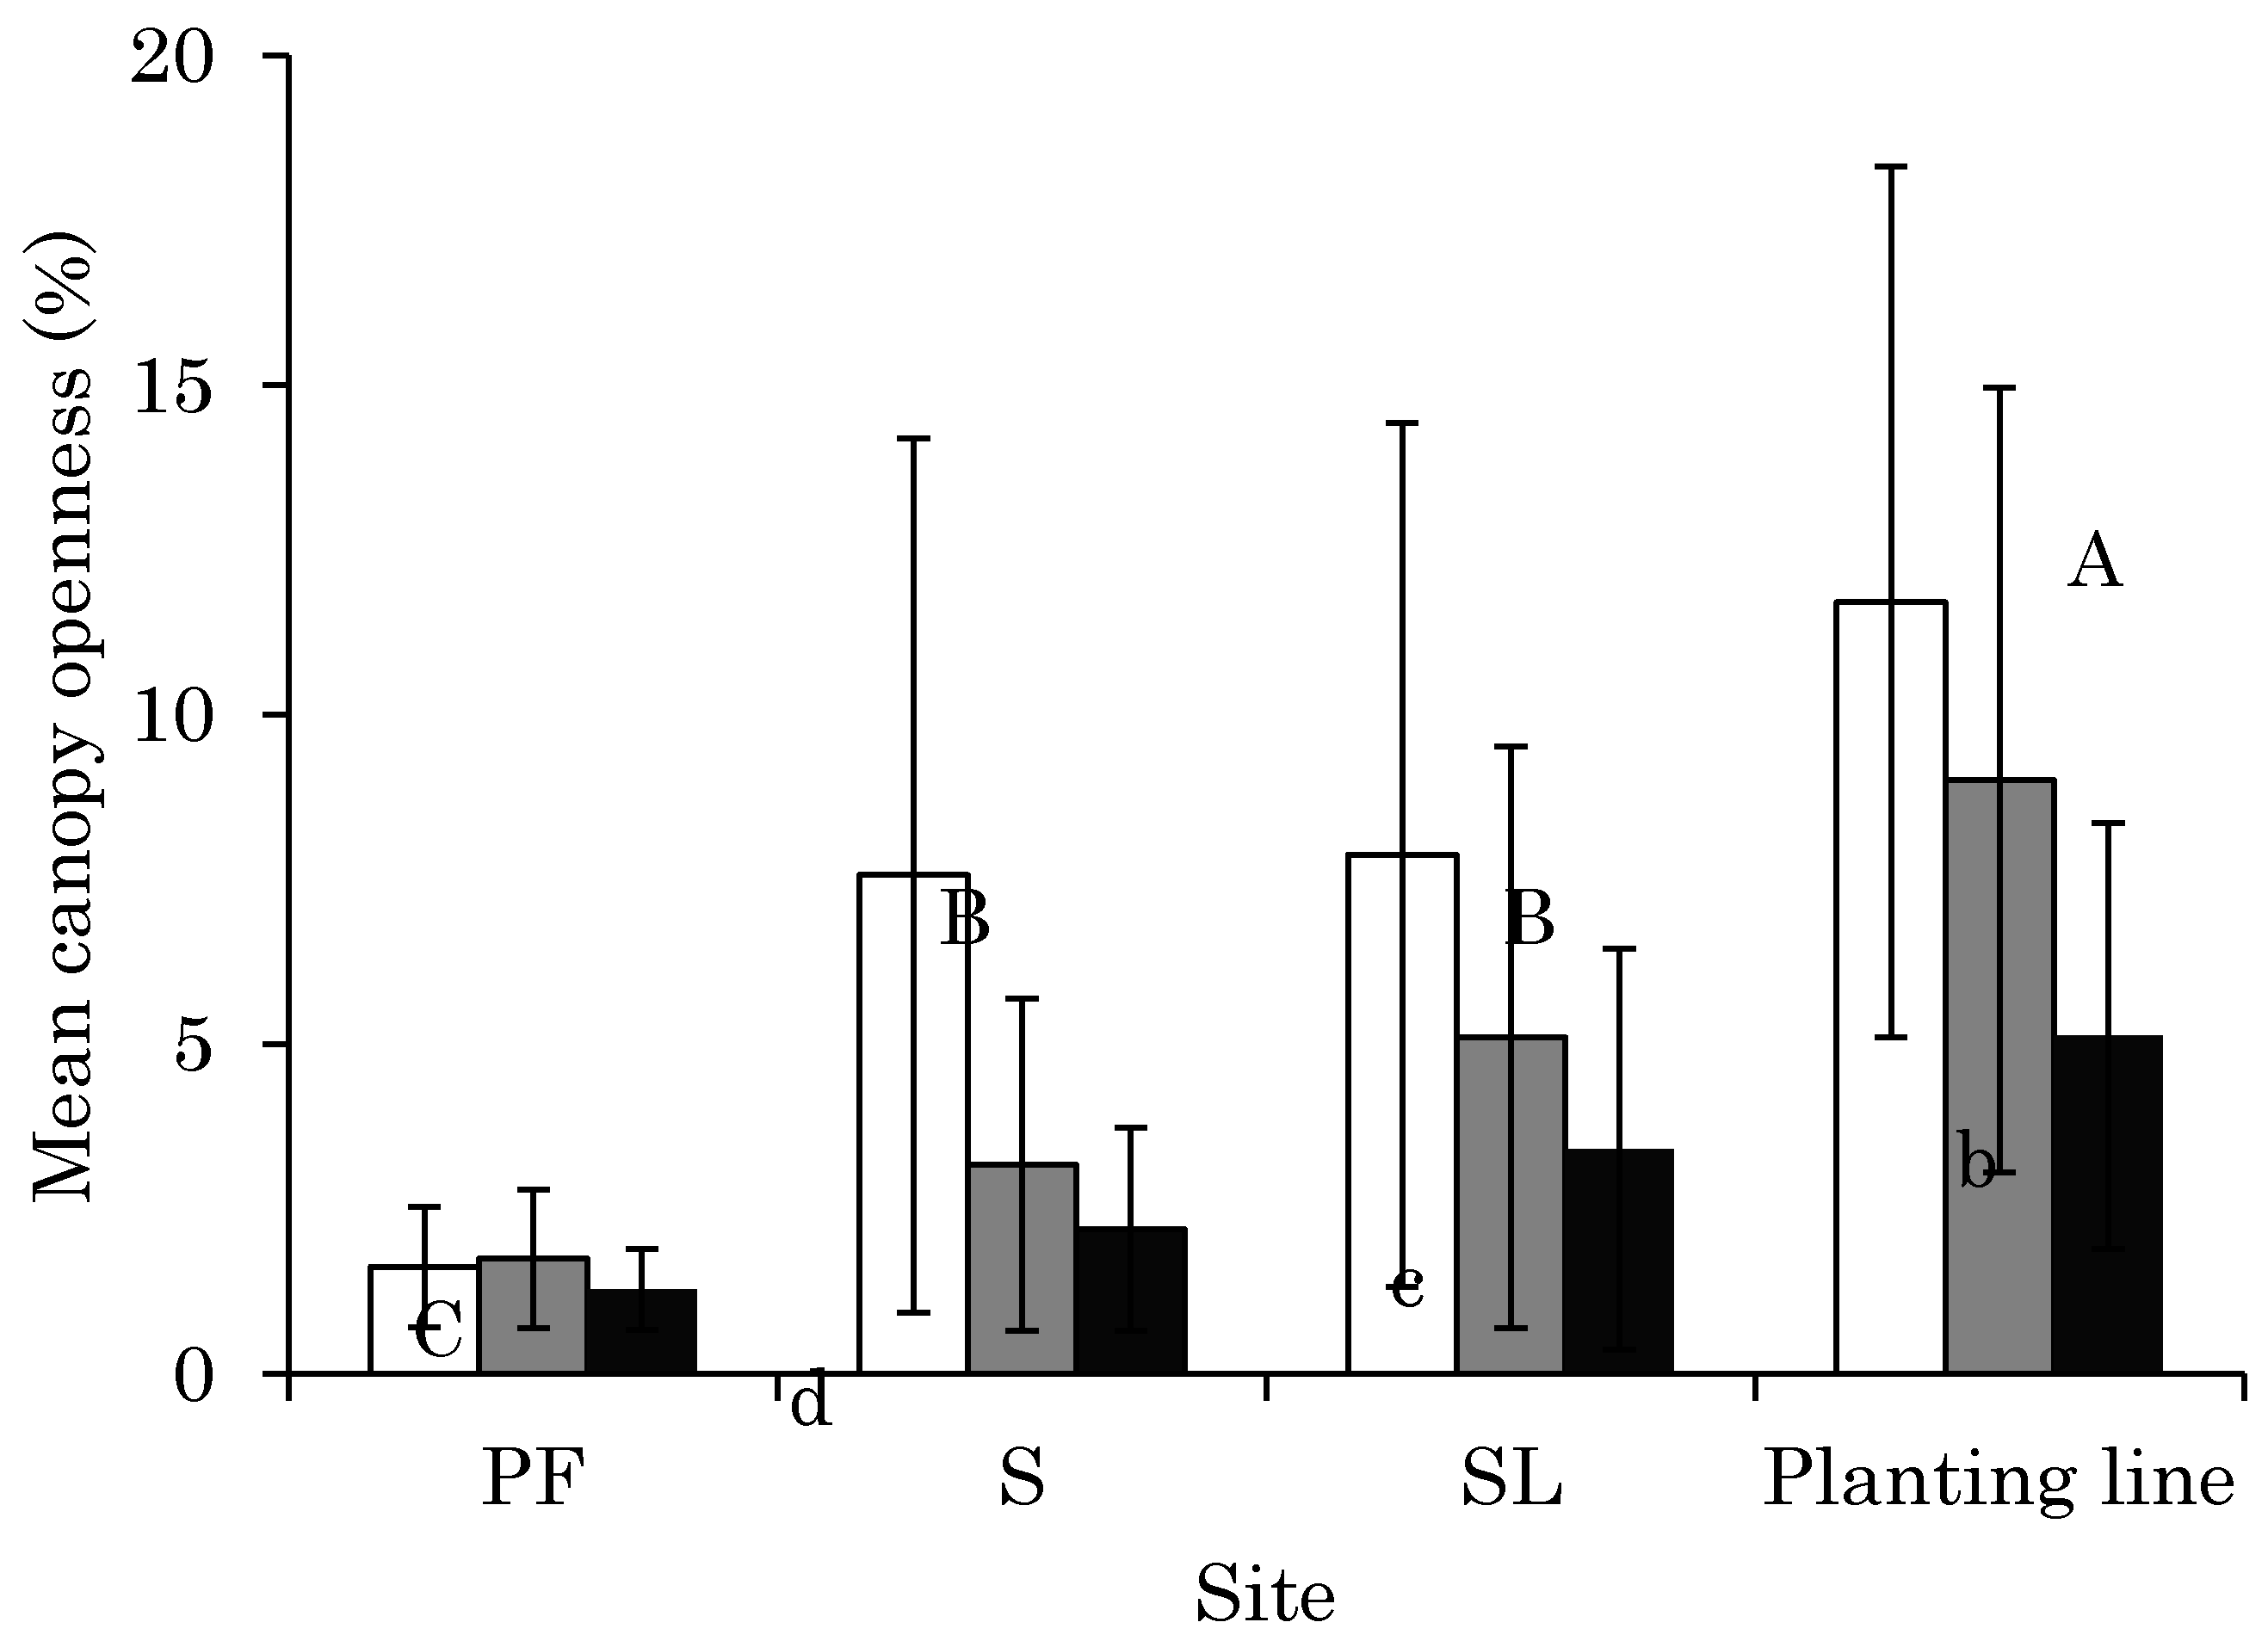
3.1. CO Change from 2011 to 2014 at Each Site
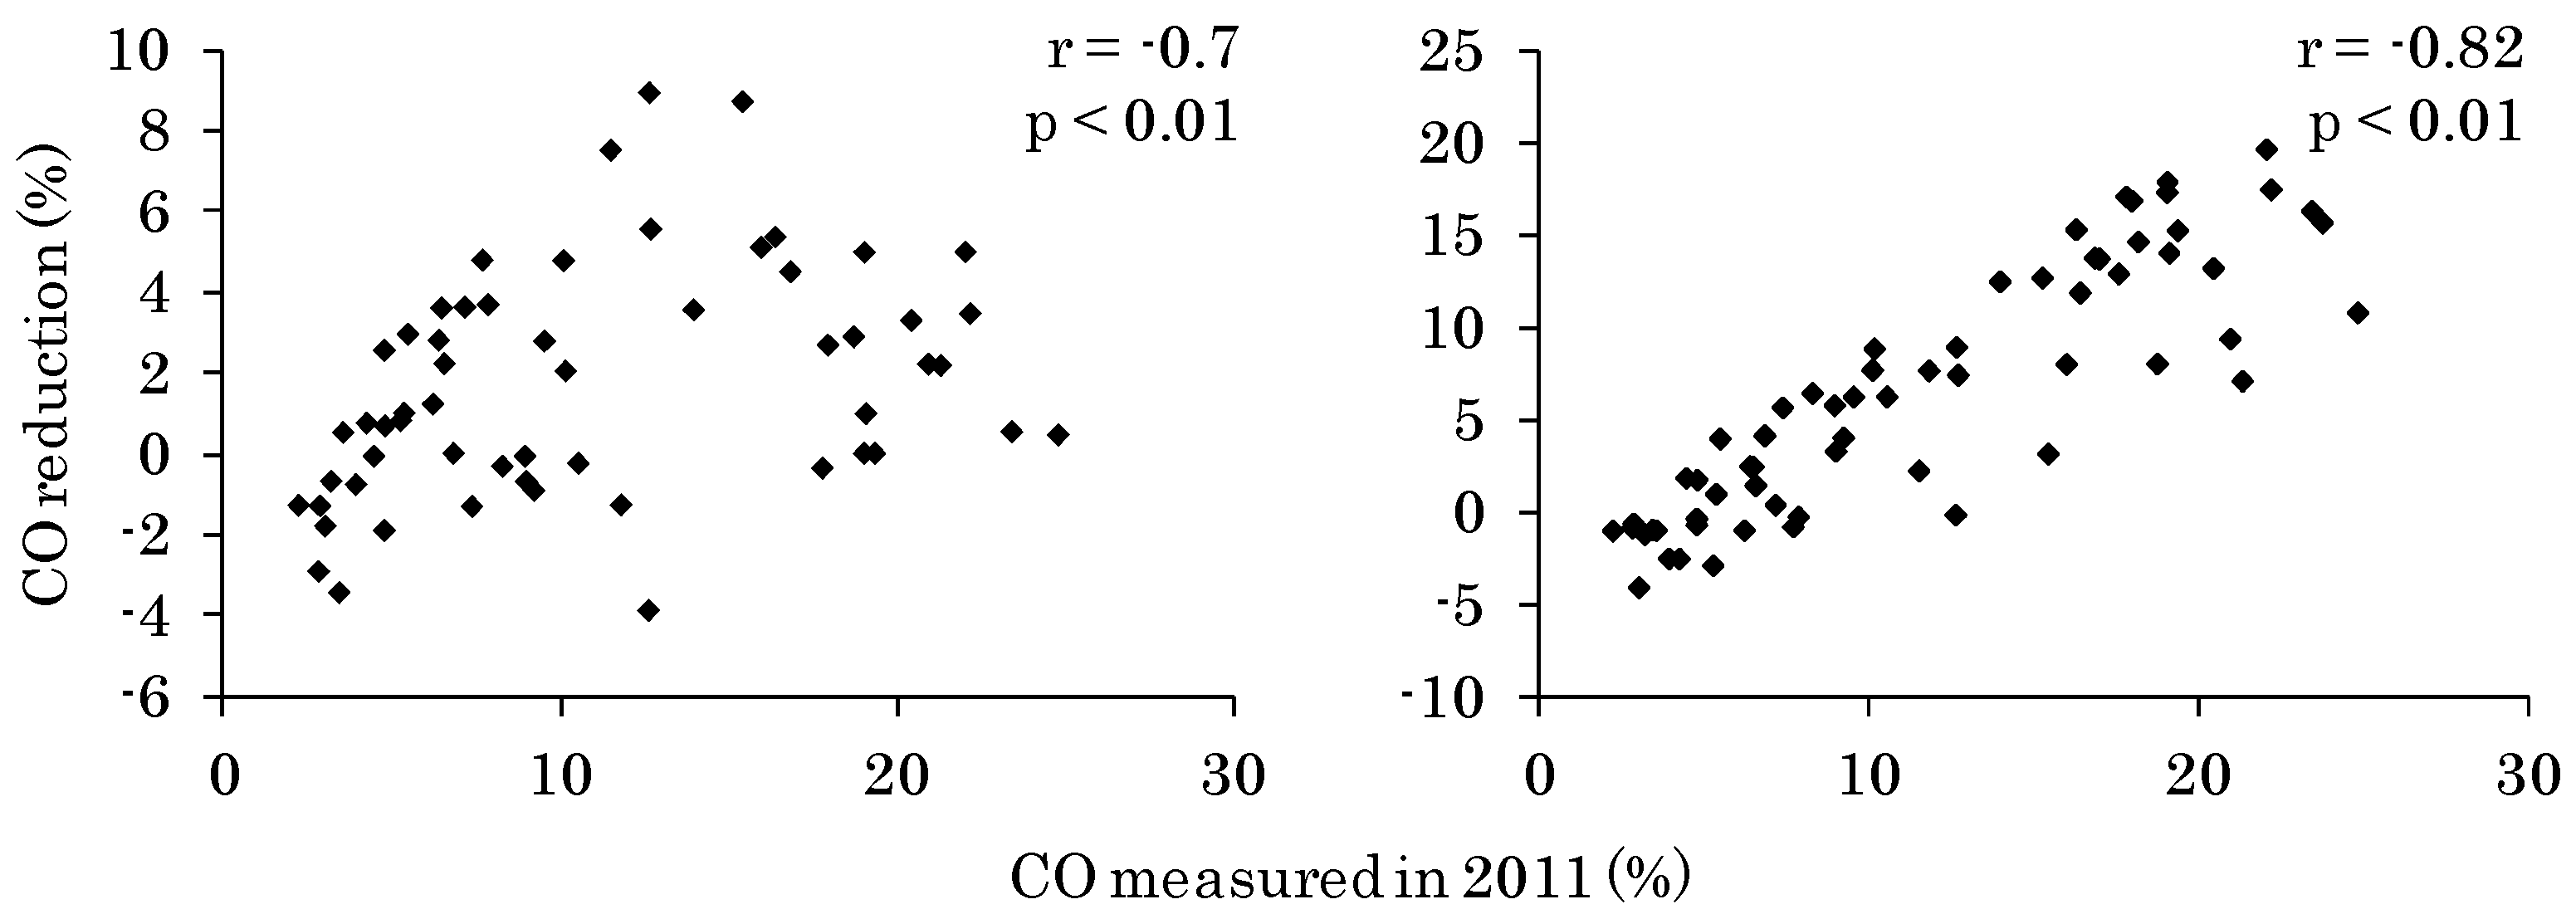
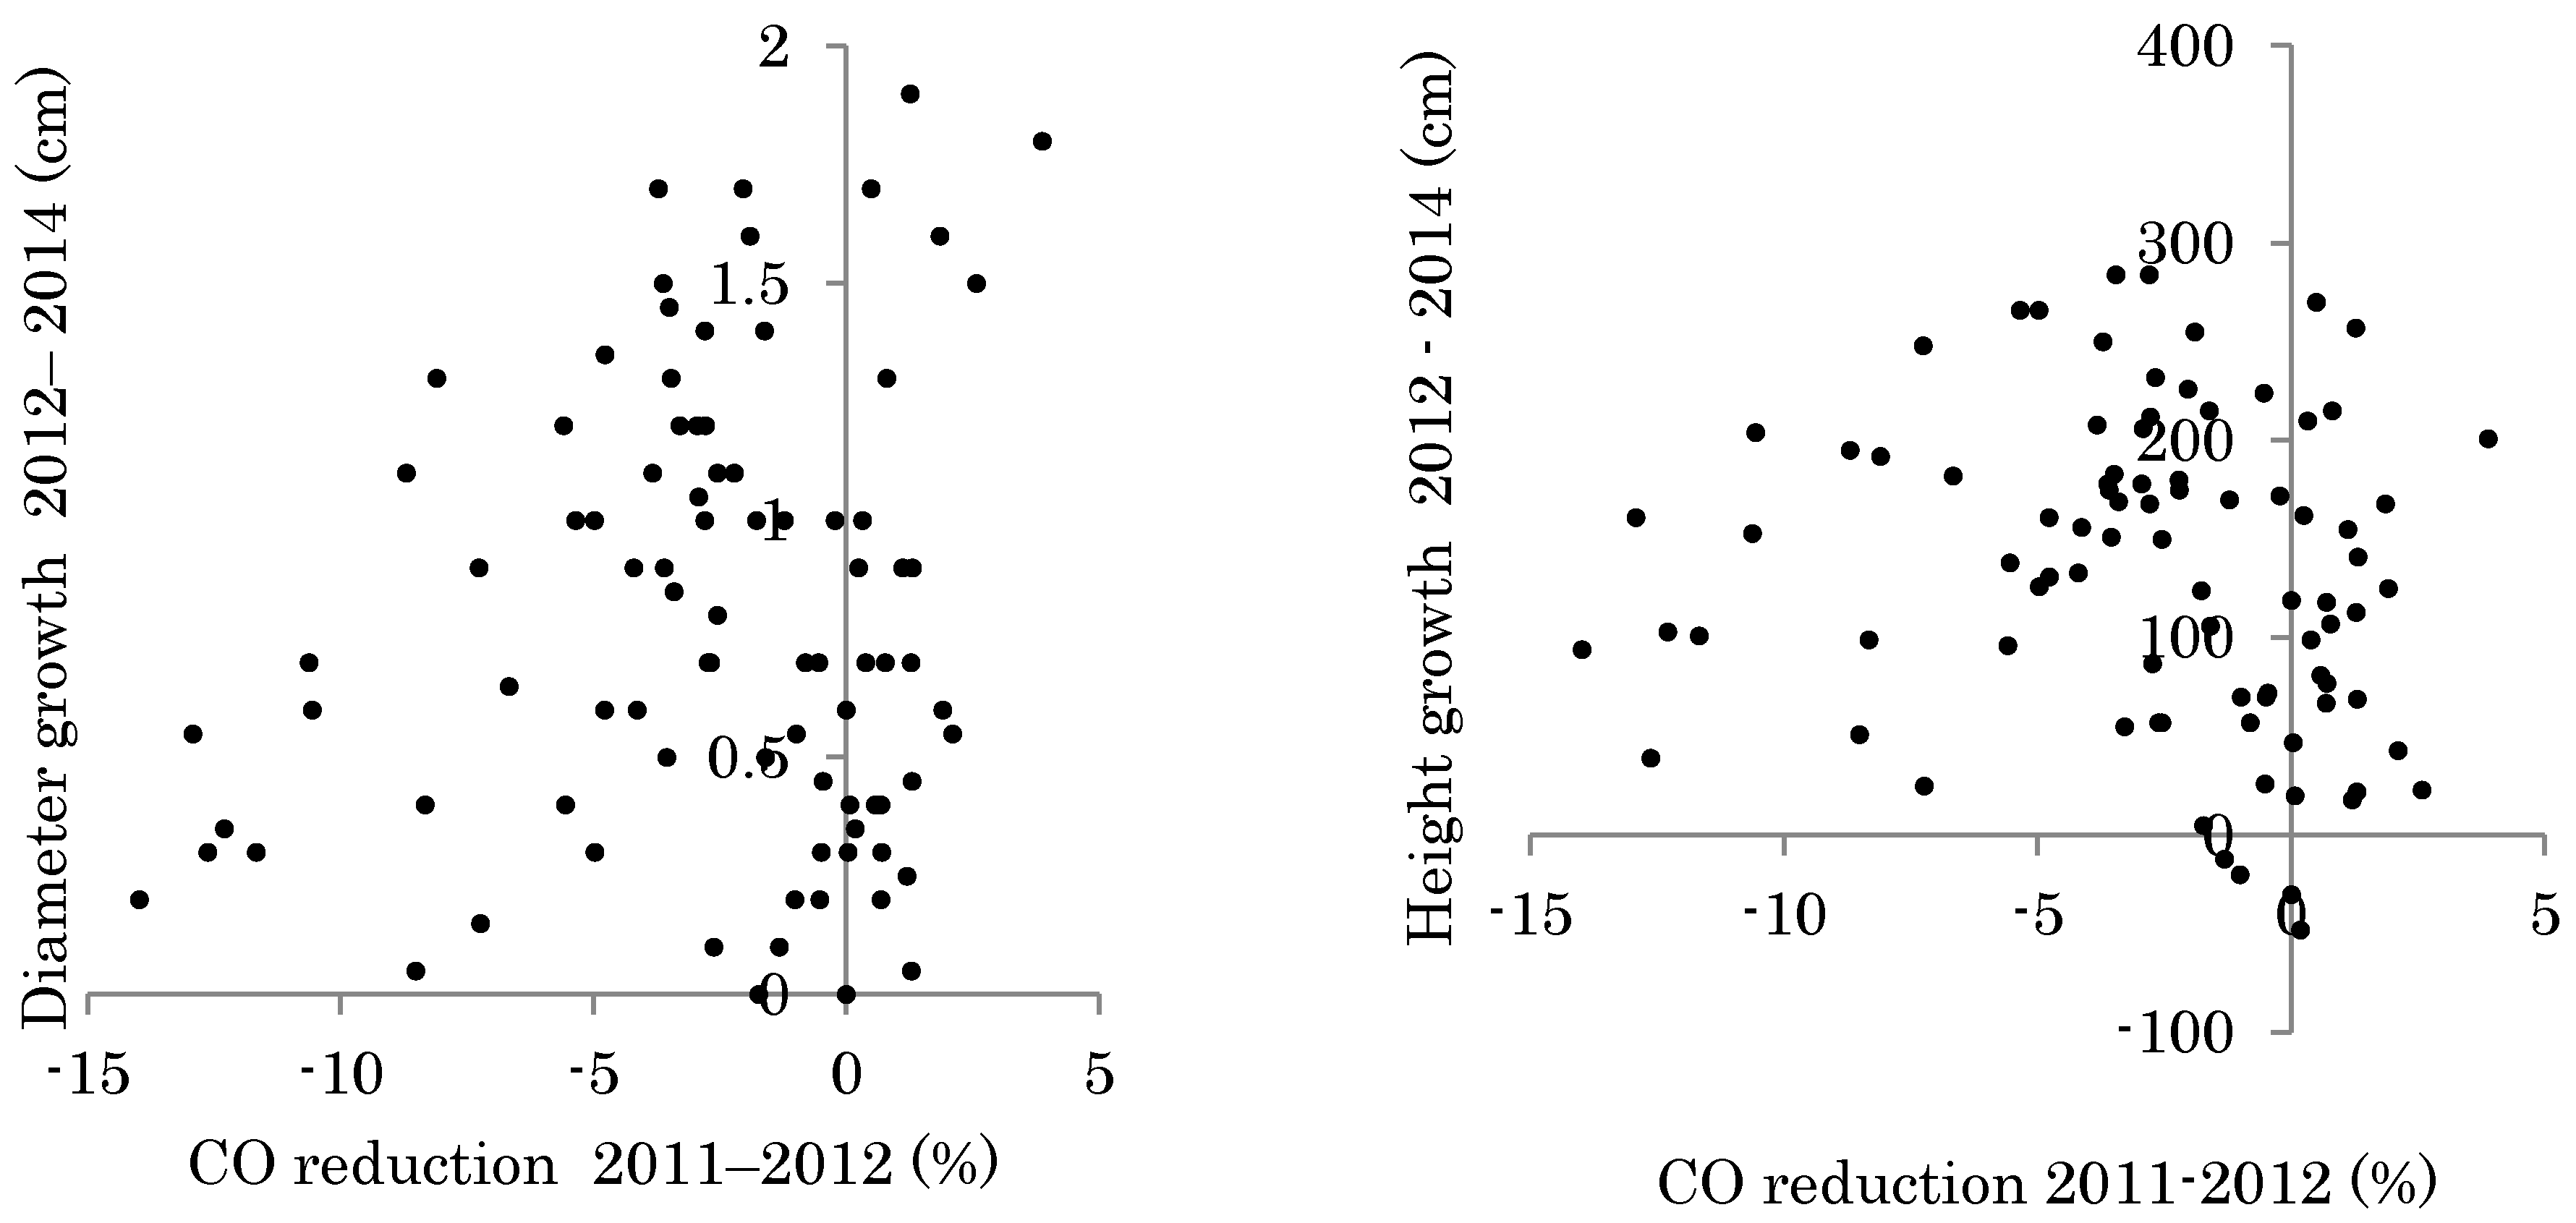
3.2. Planted Seedling Growth and Correlation to Changes in Light Conditions
4. Discussion
4.1. Changes in Light Conditions after Logging Management
4.2. Effect of Changes in Light Conditions on Planted Seedlings
5. Conclusions
Acknowledgments
Author Contributions
Conflicts of Interest
References
- Kuusipalo, J.; Jafarsidik, Y.; Ǻdjers, G.; Tuomela, K. Population dynamics of tree seedlings in a mixed dipterocarp rainforest before and after Logging and crown liberation. For. Ecol. Manag. 1996, 81, 85–94. [Google Scholar] [CrossRef]
- Denslow, J.S. Tropical rainforest gaps and tree species diversity. Annu. Rev. Ecol. Syst. 1987, 18, 431–451. [Google Scholar] [CrossRef]
- Nicotra, A.B.; Chazdon, R.L.; Iriarte, S.V.B. Spatial heterogeneity of light and woody seedling regeneration in tropical wet forests. Ecology 1999, 80, 1908–1926. [Google Scholar] [CrossRef]
- Slik, J.W.F.; Verburg, R.; Keßler, P.J.A. Effects of Fire and Selective Logging on the Tree Species Composition of Lowland Dipterocarp Forest in East Kalimantan, Indonesia. Biodivers. Conserv. 2002, 11, 85–98. [Google Scholar] [CrossRef]
- Howlett, B.E.; Davidson, D.W. Effects of seed availability, site conditions, and herbivory on pioneer recruitment after logging in Sabah, Malaysia. For. Ecol. Manag. 2003, 184, 369–383. [Google Scholar] [CrossRef]
- Romell, E.; Hallsby, G.; Karlsson, A. Forest floor light conditions in a secondary tropical rain forest after artificial gap creation in Northern Borneo. Agric. For. Meteorol. 2009, 149, 929–937. [Google Scholar] [CrossRef]
- Putz, F.E.; Sist, P.; Fredericksen, T.S.; Dykstra, D. Reduced-impact logging: Challenges and opportunities. For. Ecol. Manag. 2008, 256, 1427–1433. [Google Scholar] [CrossRef]
- Putz, F.E.; Zuidema, P.A.; Synnott, T.; Peña-Claros, M.; Pinard, M.A.; Sheil, D.; Vanclay, J.K.; Sist, P.; Gourlet-Fleury, S.; Griscom, B.; et al. Sustaining conservation values in selectively logged tropical forests: The attained and the attainable. Conserv. Lett. 2012, 5, 296–303. [Google Scholar] [CrossRef]
- Pamoengkas, P. Potentialities of line planting technique in rehabilitation of logged over area referred to species diversity, growth and soil quality. Biodiversitas 2010, 11, 34–39. [Google Scholar] [CrossRef]
- Inada, T.; Ano, W.; Hardiwinoto, S.; Sadono, R.; Setyanto, P.E.; Kanzaki, M. Effects of logging and line planting treatment on canopy openness in logged-over forests in Bornean lowland dipterocarp forest. Tropics 2013, 22, 89–98. [Google Scholar] [CrossRef]
- Yamada, T.; Yoshioka, A.; Hashim, M.; Liang, N.; Okuda, T. Spatial and temporal variations in the light environment in a primary and selectively logged forest long after logging in Peninsular Malaysia. Trees 2014, 28, 1355–1365. [Google Scholar] [CrossRef]
- Ådjers, G.; Hadengganan, S.; Kuusipalo, J.; Nuryanto, K.; Vesa, L. Enrichment planting of dipterocarps in logged-over secondary forests: Effect of width, direction and maintenance method of planting line on selected Shorea species. For. Ecol. Manag. 1995, 73, 259–270. [Google Scholar] [CrossRef]
- Matsune, K.; Soda, R.; Sunyoto; Tange, T.; Sasaki, S.; Suparno. Planting Techniques and Growth of Dipterocarps in an Abandoned Secondary Forest in East Kalimantan, Indonesia. In Plantation Technology in Tropical Forest Science; Susuki, K., Ishii, K., Sakurai, S., Sasaki, S., Eds.; Springer: Tokyo, Japan, 2006; pp. 221–229. [Google Scholar]
- Chazdon, R.L.; Field, C.B. Photographic estimation of photosynthetically active radiation: Evaluation of a computerized technique. Oecologia 1987, 73, 525–532. [Google Scholar] [CrossRef] [PubMed]
- Clark, D.B.; Clark, D.A.; Rich, P.M.; Weiss, S.; Oberbauer, S.F. Landscape-scale evaluation of understory light and canopy structure: Methods and application in a neotropical lowland rain forest. Can. J. For. Res. 1996, 26, 747–757. [Google Scholar] [CrossRef]
- Silbernagel, J.; Moeur, M. Modeling canopy openness and understory gap patterns based on image analysis and mapped tree data. For. Ecol. Manag. 2001, 149, 217–233. [Google Scholar] [CrossRef]
- Brokaw, N.V.L. Treefalls, regrowth, and community structure in tropical forests. In The Ecology of Natural Disturbance and Patch; Picket, A., White, P.S., Eds.; Academic Press: New York, NY, USA, 1985. [Google Scholar]
- Tani, A.; Ito, E.; Tsujino, M.; Araki, M.; Kanzaki, M. Threshold determination by reference to open sky overcomes photographic exposure error in indirect leaf area index estimation. Jpn. J. For. Environ. 2011, 53, 41–52. [Google Scholar]
- Jarčuška, B. Methodological overview to hemispherical photography, demonstrated on an example of the software GLA. Folia Oecol. 2008, 35, 66–69. [Google Scholar]
- Bischoff, W.; Newbery, D.M.; Lingenfelder, M.; Schnaeckel, R.; Petol, G.H.; Madani, L.; Ridsdale, C.E. Secondary succession and dipterocarp recruitment in Bornean rain forest after logging. For. Ecol. Manag. 2005, 218, 174–192. [Google Scholar] [CrossRef]
- Chai, D.N.P. Enrichment planting in Sabah. Malays. For. 1975, 38, 271–277. [Google Scholar]
- Jusoff, K. A survey of soil disturbance from tractor logging in a hill forest of Peninsular Malaysia. In Malaysian Forestry and Forest Products Research; Appanah, S., Ng, F.S., Ismail, R., Eds.; Forest Research Institute Malaysia: Kepong, Malaysia, 1991; pp. 16–21. [Google Scholar]
- International Timber Trade Organization (ITTO). Pre-Project Study Report: Enrichment Planting; International Timber Trade Organization: Yokohama, Japan, 1989. [Google Scholar]
- Sasaki, S.; Mori, T. Growth responses of dipterocarp seedlings to light. Malays. For. 1981, 44, 319–345. [Google Scholar]
- Van Oorschot, G.; Van Winkel, I.; Moura-Costa, P. The use of GIS to study the influence of site factors in enrichment planting with dipterocarps. In Proceedings of the 5th Round Table Conference on Dipterocarps, Chiang Mai, Thailand, 7–10 November 1994; Appanah, S., Khoo, K.C., Eds.; Forest Research Institute: Kuala Lumpur, Malaysia, 1996; pp. 267–278. [Google Scholar]


© 2017 by the authors. Licensee MDPI, Basel, Switzerland. This article is an open access article distributed under the terms and conditions of the Creative Commons Attribution (CC BY) license (http://creativecommons.org/licenses/by/4.0/).
Share and Cite
Inada, T.; Kitajima, K.; Hardiwinoto, S.; Kanzaki, M. The Effect of Logging and Strip Cutting on Forest Floor Light Condition and Following Change. Forests 2017, 8, 425. https://doi.org/10.3390/f8110425
Inada T, Kitajima K, Hardiwinoto S, Kanzaki M. The Effect of Logging and Strip Cutting on Forest Floor Light Condition and Following Change. Forests. 2017; 8(11):425. https://doi.org/10.3390/f8110425
Chicago/Turabian StyleInada, Tomoya, Kaoru Kitajima, Suryo Hardiwinoto, and Mamoru Kanzaki. 2017. "The Effect of Logging and Strip Cutting on Forest Floor Light Condition and Following Change" Forests 8, no. 11: 425. https://doi.org/10.3390/f8110425
APA StyleInada, T., Kitajima, K., Hardiwinoto, S., & Kanzaki, M. (2017). The Effect of Logging and Strip Cutting on Forest Floor Light Condition and Following Change. Forests, 8(11), 425. https://doi.org/10.3390/f8110425