Article

Ponderosa Pine Forest Restoration Treatment Longevity: Implications of Regeneration on Fire Hazard

1
Department of Forest and Rangeland Stewardship, Colorado State University, Fort Collins, CO 80524-1472, USA
2
Rocky Mountain Research Station, USDA Forest Service, Fort Collins, CO 80526, USA
3
Department of Forest Management, University of Montana, Missoula, MT 59812, USA
*
Author to whom correspondence should be addressed.
Forests 2016, 7(7), 137; https://doi.org/10.3390/f7070137
Submission received: 14 April 2016 / Revised: 25 June 2016 / Accepted: 2 July 2016 / Published: 7 July 2016

Abstract

:
Restoration of pine forests has become a priority for managers who are beginning to embrace ideas of highly heterogeneous forest structures that potentially encourages high levels of regeneration. This study utilizes stem-mapped stands to assess how simulated regeneration timing and magnitude influence longevity of reduced fire behavior by linking growth and yield model outputs to a crown fire prediction model. Treatment longevity was assessed as return time to within 10% of pre-treatment predicted wind speeds for the onset of passive (Torching) and active (Crowning) crown fire behavior. Treatment longevity in terms of Torching and Crowning was reduced 5 years for every 550 and 150 seedlings ha−1, respectively. Introducing regeneration as a single pulse further reduced Torching treatment longevity 10 years compared to other regeneration distributions. Crowning treatment longevity increased at higher site indices, where a 6 m increase in site index increased longevity 4.5 year. This result was contrary to expectations that canopy openings after treatments would close faster on higher productivity sites. Additionally, Torching longevity was influenced by the rate of crown recession, were reducing the recession rate decreased longevity in areas with higher site indices. These dependencies highlight a need for research exploring stand development in heterogeneous sites.

Graphical Abstract

1. Introduction

Dry forests of Western North America face increasingly extensive, frequent, and severe disturbances from insects, disease, and wildfire due to growing climatic and anthropogenic pressures [1,2,3]. These disturbances can have large social and financial implications for the communities that are reliant on the resources and ecological benefits provided by these systems [4]. The ecological consequences of wildfires within ponderosa pine (Pinus ponderosa P. and C. Lawson) and dry-mixed conifer forests of the Rocky Mountains have arguably been exacerbated by what is thought to be uncharacteristically high uniformity and continuity of forest vegetation [5]. The high continuity of forest vegetation currently seen across the landscape is attributed to a combination of early 1900s livestock grazing and timber management practices and a century of fire exclusion causing changes in forest structure from spatially heterogeneous pre-Euro-American settlement conditions [6,7,8].
In an effort to reduce the potential negative effects of altered fire regimes in dry forest types, the U.S. Federal government adopted several national policies including the Healthy Forest Restoration Act of 2003 and the Omnibus Public Land Management Act of 2009. These policies laid the groundwork for the Collaborative Forest Landscape Restoration Program (CFLRP), which resulted in the formation of several collaborative working groups consisting of private, state, federal, and non-profit entities with the goal of reestablishing a heterogeneous forest mosaic at stand and landscape scales [9,10]. Current restoration treatments within dry forest systems of the Rocky Mountains seek to create a highly heterogeneous uneven-aged forest structure that consists of a mixture of different aged tree groups, scattered individual trees, and openings [11,12,13]. This variability in desired forest structures is normally achieved by implementing what is known as variable density thinning, which commonly utilizes what are described as “skips and gaps” where patches are not thinned (“skips”) and heavily thinned areas (“gaps”) are created with a range of structures in between [14,15]. While the intentions of these restoration efforts are well defined [16], a complete understanding of how the fuels complex will be altered and how long these changes will last is missing.
Current treatment strategies are based on research that has demonstrated how fuel hazard can be decreased by reducing surface fuel loadings and canopy bulk densities, increasing canopy base heights, and retaining fire resistant dominant trees [17]. There is a growing body of literature that suggests treatments that follow these principles can reduce fire behavior [18,19,20,21]. However, there are relatively few studies that have investigated how the effects of fuel treatments on fire behavior change over time or the length of time that treatments maintain their effectiveness [22,23,24,25]. Stephens et al. [25] found that reductions in fire hazard from mechanical thinning followed by prescribed burning treatments in Sierra Nevada mixed conifer forests diminished 15–20 years after treatment. Working in ponderosa pine-Gambel oak (Quercus gambelii Nutt.) forests in Arizona, Fulé et al. [23] observed only minimal changes in forest structure five years following restoration treatments. A number of ecosystem and site specific variables influence the longevity of fire hazard reduction following treatment and ultimately determine when a stand will need to be retreated. These considerations include the interaction between rates of decomposition, fuel accumulation, and vegetative response in the post-treatment environment. Spatially and temporally variable ecosystem processes, such as the timing and magnitude of regeneration pulses following treatments, are believed to influence treatment longevity [26].
Reconstructions of historical forest regeneration in ponderosa pine forests of the Southwest USA have shown that the lower end of pre-settlement stand densities (<100 trees ha−1) could be maintained by successful establishment of only 3.6 trees ha−1 decade−1 [27]. However, the heterogeneous nature of stand structures following forest restoration in dry conifer systems has been hypothesized as creating micro-sites suitable for natural regeneration to successfully establish at much higher levels in the absence of a frequent fire regime (>1000 seedlings ha−1) [28,29]. Tree regeneration timing and successful establishment is regulated by a complex set of interactions among the seed producing adults, periodicity of cone/seed crops, seed viability and predation, seedbed conditions, climate, and other competitive stresses [30]. Restoration treatments may lead to abundant regeneration because they typically retain trees at varying densities throughout stands. This provides a well-distributed seed source as well as a variety of micro-climate and light environments conducive to establishment and survival of multiple tree species with differing regeneration requirements (e.g., ponderosa pine and Douglas-fir (Pseudotsuga menziesii (Mirb.) Franco)). Disturbance to the forest floor from harvesting equipment or prescribed fire may further promote regeneration by exposing mineral soil, thus improving seedbed conditions [31]. Increased regeneration density and successful establishment following restoration treatments would presumably reduce the longevity of any decrease in fire hazard that was achieved from treatments by accelerating ladder fuel development.
Seedling recruitment in ponderosa pine forests of the southern Rockies is often episodic, with good seed crops typically occurring every 4–6 years [31]. Cone production is influenced by overstory tree density, with lower densities, showing increased cone production [32]. Once seeds are disseminated, germination and establishment success is dependent on favorable precipitation and moisture availability [33]. The combination of favorable climatic conditions and low overstory tree densities in restoration treatments can lead to unusually high seedling establishment [32]. Before fire exclusion in these systems, favorable climatic conditions that maintained sufficient moisture availability for seedlings also reduced the occurrence of fire [34], allowing seedling recruitment to establish and for some to grow to sizes that would limit mortality in future fires [35]. Historically, this sequence of events occurred infrequently [27,34], resulting in pulsed recruitment episodes. In contrast, contemporary management practices have removed fire as a mechanism for mortality and natural regeneration patterns are now governed by climatic and site condition factors and can show a range of establishment patterns from pulses to low levels of constant recruitment.
Many studies assessing the effectiveness of alternative management actions at reducing fire hazard have utilized the Fire and Fuels Extension of the Forest Vegetation Simulator (FVS-FFE) to model Torching and Crowning Indices [22,36,37]. However, these studies were not designed to understand the impact of regeneration on treatment longevity, often modeling establishment of a single narrow seedling cohort at one density level. Commonly, Torching and Crowning Indices have been used to assess treatment resilience, were the indices are defined as the 10 m open wind speed required for the onset of passive and active crown fire activity, respectively [38]. Within the current framework of FVS-FFE the Torching Index is derived as a function of surface fire intensity and canopy base height, while the Crowning Index is a function of canopy bulk density and foliar moisture content [38]. These indices are calculated by linking Rothermel’s [39,40] surface fire and crown fire rate of spread models with Van Wagner’s [41] crown fire initiation model. Several studies have critiqued this modeling chain and outlined several incorrectly parameterized components that lead to a significant under prediction bias of these indices [26,42,43]. Alternative approaches to assessing crown fire hazard include a probabilistic model framework called Crown Fire Initiation and Spread model (CFIS) for the prediction of crown fire occurrence and the subsequent rate of spread [44]. CFIS is an empirically derived model that uses logistic regression to predict crown fire initiation using observations from experimental crown fire studies. This model has been evaluated against several independent observation datasets from crown fire experiments [44].
To understand the impacts of regeneration on the longevity of forest fuel hazard reduction in restoration treatments we simulated combinations of seedling establishment densities and timing in stem-mapped sites across a range of ponderosa pine site productivities. Specifically, we test the following hypotheses, that H1: Increasing seedling establishment density (seedlings ha−1) will shorten how long it takes for a stand to return to its pre-treatment fire hazard rating; H2: Varying the temporal distribution of how seedlings enter the simulation will lead to varying time lengths to return to a stand’s pre-treatment fire hazard rating; and H3: Increased site productivity (site index) will shorten how long it takes for a stand to return to its pre-treatment fire hazard rating. Furthermore, we test the importance of FVS’s modeling of crown recession on the interpretation of the simulation results. The results from this study should inform land managers on the influence of various regeneration scenarios on treatment longevity.

2. Materials and Methods
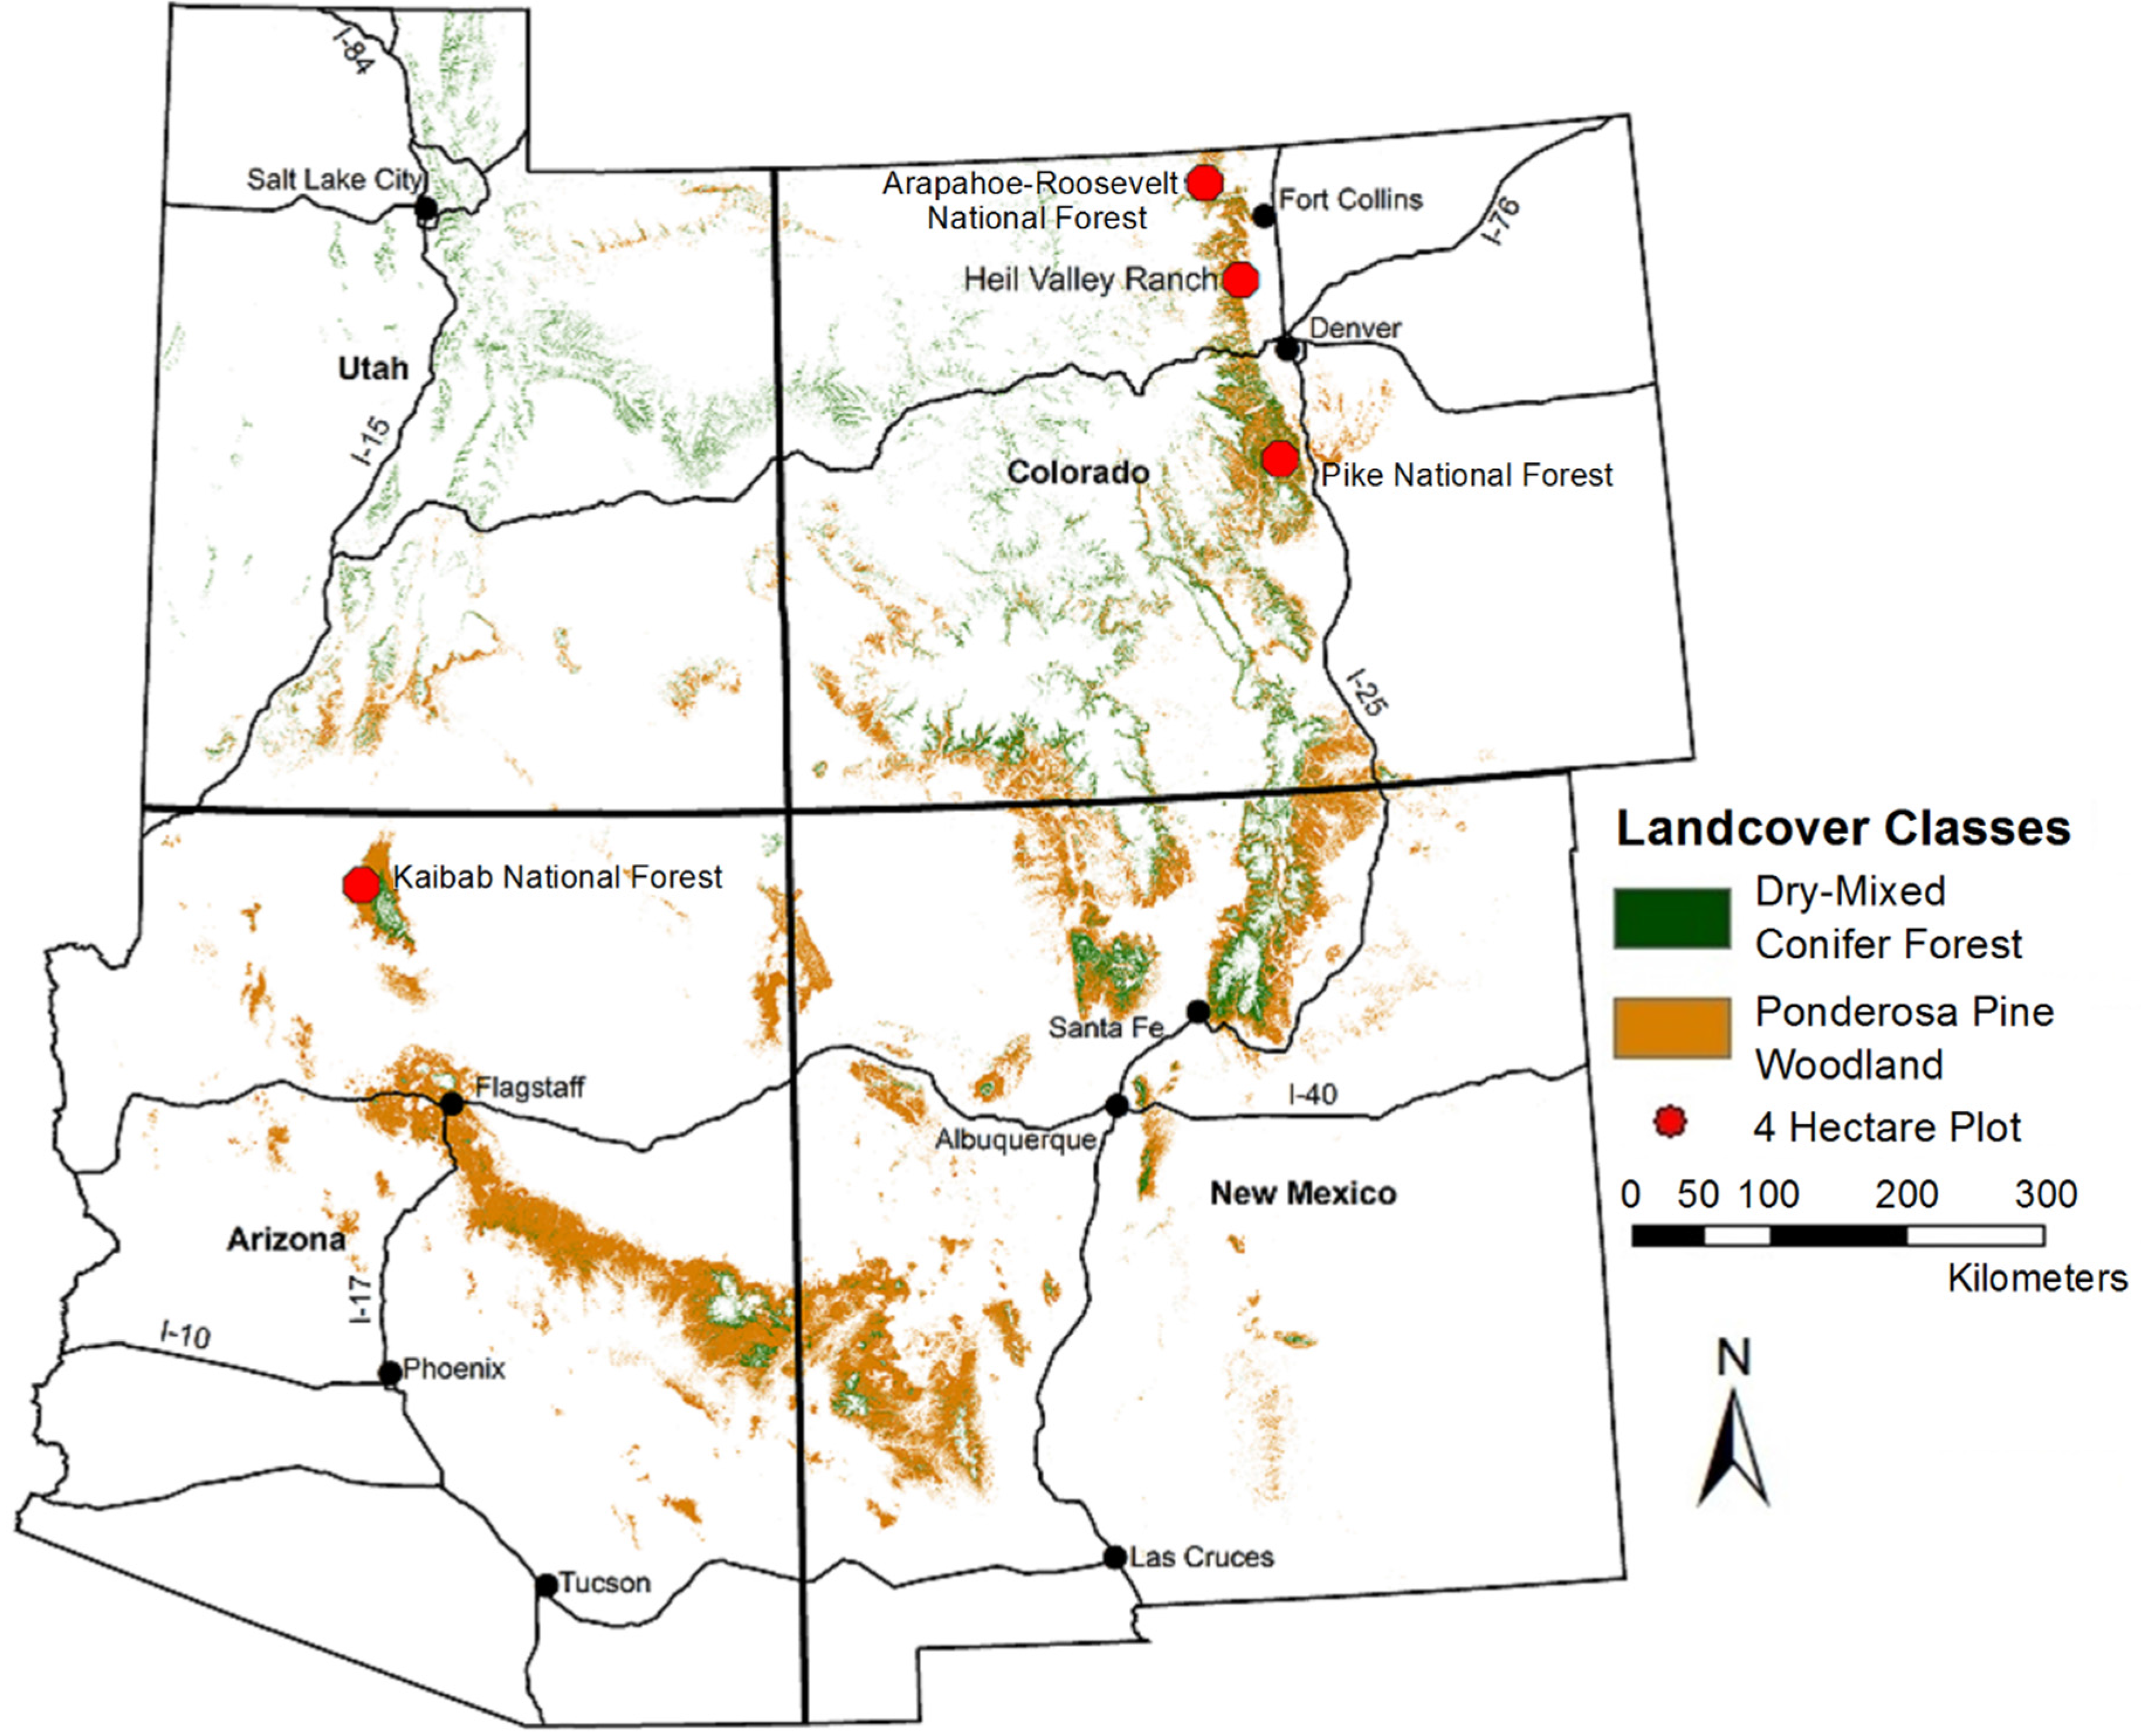
2.1. Study Region

Within the Central and Southern Rocky Mountains the ponderosa pine woodland ecosystem occupies the lower treeline ecotone between grassland or shrub steppe and the more productive montane dry-mixed conifer forest systems (Figure 1) [45]. Throughout the study region, understory vegetation within the ponderosa pine system is grass dominated with shrub importance fluctuating across successional stages [45]. Other tree species occur in the overstory depending on moisture availability and elevation, including Rocky Mountain juniper (Juniperus scopulorum Sarg.), two-needle pinyon (Pinus edulis Engelm.), and Douglas-fir. At higher elevations the forest composition transitions through a gradient where Douglas-fir and white fir (Abies concolor (Gord. and Glend.) Lindl. ex Hildebr) become major components of the overstory, but ponderosa pine still commonly occurs as a dominant/co-dominant species. Other tree species including limber pine (Pinus flexilis James), Engelmann spruce (Picea engelmannii Parry ex Engelm.), blue spruce (Picea pungens Engelm.), and quaking aspen (Populus tremuloides Michx.) can also occur in specific micro-climates, with a more persistent shrub component entering the understory [46].

2.2. Stand Inventory Design

We collected a census in four stands along a gradient of ponderosa pine site index heights from 11 to 29 m at a base age of 100 years [47] that had been identified for fuel hazard reduction and restoration treatments within the southern and central Rocky Mountains. (Figure 1, Table 1). Each site received a 4 hectare stem-map (200 m × 200 m) that was established between 1 and 3 years following a mechanical thinning of each stand. All trees at least 1.37 m tall (or reaching breast height) in the post-treatment stands had their location, species, diameter at breast height (DBH; cm), diameter at stump height (DSH (cm), assumed to be the bole diameter 20 cm above the ground), total height (m), and canopy base height (CBH; m) recorded [44]. Each stump attributed to the thinning, based on its level of decay, also had its location, species, and DSH recorded. To estimate the pre-thinning attributes of each stump, site-specific regressions were created for each species relating the DSH to DBH, total height, and CBH of the residual trees [48]. These regressions were used to reconstruct the attributes of all trees removed during the thinning process.

2.3. Model and Simulation Parameterization

Stand growth was simulated using the Central Rockies variant of the Forest Vegetation Simulator (FVS) [49], a distance-independent growth and yield model operating at the individual-tree level. FVS is commonly employed throughout the United States for forest planning and evaluating alternative treatment effects on forest stand development [50]. Model extensions have been developed for a variety of monitoring and planning scenarios, including the Fire and Fuels Extension (FVS-FFE) which has the capability to characterize and track the accumulation and decay of various surface and canopy fuel components [51]. We used FVS-FFE to determine the pre-treatment stand conditions and to simulate growth of the post-treatment stands for 100 years after treatment. Common forest structure metrics such as tree density, basal area, quadratic mean diameter (QMD), and CBH, along with fuel parameters including crown bulk density (CBD) and herbaceous, shrub, and fine woody debris (0.0–7.6 cm diameter) fuel loading were output by the model in five-year time steps throughout the simulations. We also calculated the mean height and foliar biomass of seedlings under 1.83 m (6 feet) for fire hazard analysis (see Section 2.4).
In order to mimic the range of potential regeneration pulses seen within ponderosa pine forest types [52], the post-treatment simulations had natural regeneration of ponderosa pine introduced through five different seedling densities (124, 371, 618, 1235, and 2470 seedling ha−1) and four temporal distributions starting in year 1 and varying in length to a maximum of 25 years (single long pulse, single narrow pulse, two narrow pulses, and constant regeneration; Figure 2). Seedlings were introduced using the default model assumptions of the NATURAL keyword of the FVS Partial Regeneration Establishment Model, which assumes all seedlings are 2 years old when introduced and that 100% of seedlings survive the first simulation time step [53]. The combination of five seedling densities and four temporal distributions resulted in 20 simulations for each stand or 80 total simulations across the four treated stands for assessing regeneration effects. For these purposes regeneration establishment is taken to mean the FVS partial establishment model definition of regeneration, were all trees are assumed to survive to a minimum age of 2 years and height of 0.33 m [53]. After this minimum establishment level, the growth and survivability of the individual seedlings are determined by the small tree height growth model and mortality functions build into FVS.
To evaluate the sensitivity of the study’s results to FVS’s modeling of crown recession we evaluated changes under two alternative crown recession scenarios beyond the default model settings. The FVS Central Rockies Variant models individual tree crown length changes as a function of the height and DBH of a tree and the stand’s basal area and site index [49]. The changes in crown length propagate through to update the crown ratio changes and ultimately CBH at the end of each cycle. Modifications to the rate of crown recession were made by adjusting the FVS Crown Change Multiplier (CRNMULT) Keyword from 1.0 (default) to 0.5 and 0.0 (Figure 3). The CRNMULT settings in FVS modify the predicted changes in crown ratio so that the default value (1.0) is accepted or the change is multiplied by the user defined values (0.5 and 0.0 in this study) [49]. This means that the change in crown base height (ΔCBH) at the end of each cycle is calculated by Equation (1):
∆CBH = ∆Height × (1 − (CR − ∆CR × CRNMULT))
where ΔHeight is the change in height between subsequent FVS time steps, CR is the input or FVS dubbed individual crown ratio, ΔCR is the change in crown ratio between subsequent FVS time steps, and CRNMULT is the user defined input value. This means that when CRNMULT is set to 0.0 that the ΔCBH is reduced to a function of ΔHeight and CR. The only difference in each of the three sets of simulations was the modification of the CRNMULT Keyword value.

2.4. Fire Hazard Modeling

Fire hazard was modeled as the 10 m open wind speed (km h−1) required to initiate crown fire (Torching) and to support crown fire spread (Crowning) by inputting the predicted stand structure and fuel loads from the FVS-FFE simulations into the Crown Fire Initiation and Spread model (CFIS) [40,50]. CFIS was setup to incorporate the canopy bulk density (CBD; kg m−3) and potential surface fuel consumption (SFC; kg m−2) estimates from the FVS-FFE simulations. FVS-FFE derives estimates of CBD by calculating a 4 m running mean of 0.3 m canopy biomass slices and reports the maximum as CBD [51]. This running mean average is a different approach from the original parameterization of CFIS which was developed using a total load over depth approach, were the total foliar and fine twig biomass is divided by the mean depth of the live crown [54]. The CBD values estimated by FVS-FFE for both the pre- and post-treatment stand conditions are in line with those commonly seen in ponderosa pine forest systems [55,56]. SFC was calculated by summing the FVS-FFE simulation estimates of herbaceous, shrub, litter, fine woody debris (0.0–7.6 cm) fuel loading, and the estimated foliar biomass of the seedling cohort less than 1.83 m tall. The seedling biomass was added to the SFC parameter as FFE-FVS assumes that all fuels below 1.83 m tall are part of the surface fuels complex [51].
The transition from surface fire to passive crown fire activity is controlled by the interaction of surface fire intensity and the distance that must be overcome to ignite canopy fuels [41]. The utilization of CFIS within this study was largely decided upon because of the documented under-prediction bias and erratic nature of crown fire behavior modeling in FVS-FFE [26,42,43]. However, this decision also served another purpose, using CFIS and more specifically the use of fuel stratum gap (FSG) allowed our modelling of crown fire behavior to more directly account for the distance that surface fire energy must overcome to ignite canopy fuels and initiate crown fire activity. FSG is defined as the vertical distance between elevated surface fuels and the continuous aerial fuel stratum, as opposed to canopy base height which assumes surface fuels have no depth. This means that the height of the dominant shrub layer or continuous regeneration is taken into account when calculating the distance between the surface fuels and aerial fuels. As this vertical separation in fuel strata is a controlling factor in the modeling of crown fires behavior, using FSG should capture the dynamics of seedling height growth and crown recession.
In order to parameterize the FSG input to CFIS, FSG was calculated as the difference between FVS-FFE estimated CBH and the average height of seedlings under 1.83 m tall (unless CBH was less than 1.83 m, then FSG was set equal to CBH). The FVS-FFE estimate of CBH is defined as the lowest point where canopy biomass exceeds 0.011 kg m−3. This approach to estimating CBH does differ from the stand level estimate of lowest live branch that CFIS was developed to utilize, but using this approach allows the study to dynamically account for how changes in CBH might impact crown fire hazard [54]. Furthermore, utilizing FVS-FFE’s approach to estimating CBH allowed the study to account for temporal changes that might not me accurately modeled through other techniques. Additionally, when these two approaches of estimating CBH are compared for the initial post-treatment conditions across the four study sites, the FVS-FFE approach only resulted in an 8.4% increase in CBH values. Finally, CFIS was parameterized with a 4% fine dead woody fuel moisture content, which is the default severe fire weather condition in the Central Rockies variant of FVS-FFE [57].

2.5. Analysis

The time required for a scenario to return to its pre-treatment fire hazard level was defined as the time when the Torching and Crowning Indices returned to within 10% of the pre-treatment indices. Tobit regression, or a censored regression model, was utilized for assessing the influence of regeneration pulse magnitude (seedlings ha−1), temporal distribution, and site index on the timing of when the stands returned to within 10% of their pre-treatment indices. The Tobit analysis is designed to estimate linear relationships between variables when the dependent variable is censored or has an artificial limitation imposed [58,59], which made it well suited for this study as some of the modelled scenarios failed to return to within 10% of the pre-treatment indices by the end of the 100 year simulations. For these cases the time to return was recorded as 100 years, with 100 years being set as the upper bound for the dependent variables (years to return to pre-treatment Torching and Crowning Indices) of the regression. In comparing the effect of the CRNMULT Keyword on the regression results, significant changes in coefficients between the simulation sets were tested at the α = 0.05 level. To more succinctly deliver the results and discussion, the years to return to pre-treatment Torching and Crowning Indices will be referred to as RTT and RTC, respectively.

3. Results

Following thinning there was an average decrease in trees ha−1 of 53% and basal area ha−1 of 32% across all stands, with QMD increasing from an average of 23 to 29 cm (Table 1). The removal of half the trees in each stand reduced the CBD on average by 36% and increased the FSG on average by 2.7 m, which is a near tripling of the pre-treatment average (Table 2). These changes in stand structure from pre- to post-treatment led to an average increase in the necessary 10 m open wind speed to initiate Torching by >70% or +5.6 km h−1 and to sustain Crowning by 130% or +26.5 km h−1 (Table 2).
Model prediction of RTT ranged from 5 to >100 years, with 15% of the tested simulations failing to return to within 10% of their corresponding pre-treatment value within 100 years. The Tobit regression indicated that both the number of seedlings ha−1 and temporal distribution of how the seedlings entered the stand had significant impacts on treatment longevity (Table 3), while site index was not statistically significant. Time until RTT was reduced by five years for every ~550 seedling ha−1 introduced to the simulations. The establishment of a single narrow seedling cohort led to a RTT that was on average ~9.8 years shorter than when seedlings established over a longer cyclic distribution (Single Long and Dual Narrow), but did not differ from the constant regeneration scenario (Figure 4). These results support hypotheses H1 and H2 that postulated increasing seedling density and increasing the rate at which seedlings enter a stand following treatment would reduce the longevity of treatment effects on fire hazard.
Dependent Variable = β 0 + β 1   Site Index + β 2   Seedlings + β 3   Distribution
Similarly, the RTC ranged from 5 to >100 years, with 47% of the simulations failing to return to within 10% of the pre-treatment Crowning Index after 100 years. Analysis showed that both the number of seedlings ha−1 and the stand’s site index significantly impacted the treatment longevity in terms of Crowning Index (Table 3), but that temporal distribution was not a significant factor. Time until RTC was reduced by 5 years for every ~150 seedlings ha−1 introduced to the simulations (Figure 4), which supports hypothesis H1. Additionally, for each 6 m increase to site index, the RTC increased by 4.5 years. However, this finding is contrary to H3 that stated that longevity would decrease as site index increased.
In assessing the sensitivity of the study’s results to the modeling of crown recession, changes in the CRNMULT significantly impacted the coefficients for site index and regeneration density in predicting RTT (Table 4). The most substantial change is that site index becomes a significant parameter in the model, with CRNMULT values of 1.0, 0.5, and 0.0 corresponded to coefficients of 0.053, −0.011, and −0.167, respectively (Table 4). However, site index was only a significant parameter at a CRNMULT value of 0.0. Since site index is not a significant parameter at CRNMULT values of 1.0 and 0.5 we would reject H3, but accept H3 at a CRNMULT values of 0.0 since increases in site index would now result in decreased RTT (Table 4). Additionally, the magnitude of the seedling density coefficient significantly decreased so that at CRNMULT values of 1.0, 0.5, and 0.0 it would take ~550, 625, and 1650 seedlings ha−1 to reduce RTT by five years (Figure 5). However, under each of these scenarios we would accept H1 and since there was no significant changes to the temporal distribution coefficients we would still accept H2 (Table 4).
The greatest change in coefficients predicting RTC under the different CNRMULT scenarios were reductions in the magnitude of site index and seedling density. (Table 4). For site index the model coefficients were 0.748, 0.702, and 0.309 for the 1.0 (default), 0.5, and 0.0 CRNMULT scenarios respectively (Table 4). These changes result in a narrowing of the longevity range at any given seedling density as you move from CRNMULT values of 1.0 to 0.0 (Figure 5). However, under each of the CRNMULT scenarios H3 would be rejected since each of these scenarios show that increasing site index results in increased treatment longevity. Additionally, coefficients for seedling density change from −0.034 to −0.027 as you advance from CRNMULT values of 1.0 to 0.0. This reduction means that under the 1.0, 0.5, and 0.0 scenarios it would take ~150, 160, and 260 seedling ha−1 to reduced RTC by 5 years, but under each of these scenarios we would accept H1 (Figure 5).
Overall, increasing seedling density reduced treatment longevity as a function of both Torching and Crowning Indices, supporting hypothesis H1. Additionally, increasing the temporal distribution of seedlings entering the simulation reduced treatment longevity in terms of Torching Index, partially supporting hypothesis H2. However, for H3 the interaction of site index with treatment longevity in terms of Torching Index was inconclusive and highlighted the significance of crown recession modeling on the results.

4. Discussion

The reductions in stem density and basal area we observed following treatment are similar to those observed in other dry conifer forest systems of Arizona and California [23,25,60]. Our results show a significant inverse relationship between the number of seedlings ha−1 and the longevity of treatment benefits. The linkage between the number of seedlings ha−1 entering the stand and RTT is attributed to stand growth and mortality dynamics (Figure 4). As the number of seedlings entering the simulation increases, FSG decreases as a result of canopy fuel loading bulk density reaching the FVS 0.011 kg m−3 threshold at a lower height as ingrowth from the young cohort begins contributing to canopy fuel calculations. This lowering of the CBH increases vertical fuel continuity and ultimately decreases the time before passive crown fire activity is initiated. These higher seedling densities also increase the canopy competition factor for small trees which in turn increases to the mortality rate of small trees, where across the simulated site indices and temporal distributions annual mortality averaged 0.5, 1.0, 2.5, 6.0, and 12.5 trees ha−1 at the density levels of 124, 371, 618, 1,235, and 2470 seedling ha−1, respectively. The increasing rates of mortality with increasing seedling density resulted in increases in SFC as small branches and foliage are added to the surface fuel stratum. Similar regeneration effects on surface fuels were seen by Thomas and Agee [61] in dry-mixed conifer forest of Oregon, where by 10 years following a prescribed burn seedling mortality was credited with returning fine fuel loading to within 30% of pre-burn levels. While the linkage between the temporal distribution of how the seedlings enter the stand and RTT is less clear, introducing a single narrow pulse of regeneration seems to have accelerated the effects of canopy competition in the small trees on the rates of vertical growth and mortality, ultimately lowering FSG and increasing SFC during the simulations. This earlier increase in small tree canopy competition factor in the single narrow pulse was enough to result in the significant difference between it and the other temporal distributions (Figure 4).
Although the impact of the number of seedlings ha−1 on CBD is delayed until the seedlings enter the main canopy, there is a direct connection between this and RTC (Figure 4). This connection comes from the canopy biomass that the number of seedlings ha−1 contributes to the total CBD, which is the driving parameter in determining the transition between passive and active crown fire behavior [54]. While the calculation of CBD in this study differs from that used in the development of CFIS, our calculated CBD values are in line with reports for ponderosa pine dominated forests of the Rocky Mountains [55,56]. The use of CBD estimates based on the load over depth method [62] as done during the development of CFIS would have resulted in 75% greater CBD estimates immediately following treatment. However, as regeneration is entered into the system the mean crown length will increase disproportionately to the amount of biomass introduced resulting in a decrease in the estimated CBD. Thus, our approach would result in greater estimate of CBD and more conservative RTC estimates throughout the simulation time period. While our reported CBD estimates are generally lower than the reported theoretical minimum value required for sustained active crown fire behavior (0.05 kg m−3) [63] these systems likely can still maintain active crown fire due to greater within canopy wind speeds associated with reduced biomass.
We expected RTC to decrease with increasing site index because we anticipated that more rapid residual tree growth at higher site indices would lead to faster increases in CBD and more rapid returns to pre-treatment conditions. Similarly, we expected faster height growth of seedlings at higher site indices would mean seedlings would become part of the main canopy sooner, thus their crown biomass would contribute to CBD sooner and cause RTC to decrease. However, we were surprised to find that for every 6 m increase in site index RTC increased by 4.5 years (Figure 4). This counterintuitive result arose because crown recession in FVS is driven by height growth (Figure 3), which caused CBH to increase more rapidly on better sites where trees grew faster. Consequently, although seedlings grew taller faster at higher site indices, it took more time for their crown biomass to contribute to CBD because it took longer for the crowns of seedlings and residual trees to begin to substantially overlap in the canopy profile.
Changing the CRNMULT Keyword to 0.5 and 0.0 increased CBD values ~5% to 10% and decreased FSG of ~10% to 20% during the first 20 years of the simulations (Figure 6). Conversely, lowering the rate of crown recession reduced SFC 1%–2% for the first 25 years, but then led to significant increases in SFC throughout the rest of the simulation (Figure 6). This short term decline is attributed to the loss of overstory input to the surface fuels strata as a result of reduced self pruning when CRNMULT values are smaller, while the longer term increases are attributed to increased crown competition factor levels that increased mortality within the young cohort of trees. The effect that the CRNMULT Keyword has on the inputs to CFIS significantly altered both which parameters and the magnitude of the parameters used in predicted RTT (Table 4). Setting the CRNMULT Keyword to 0.0 shortened RTC for the best quality site by about a decade by reducing the magnitude of the site index coefficient by ~50%. This highlights the influence of crown recession assumptions on predictions of future crown fire behavior.
The assumptions of crown development modeling are important considerations when trying to model crown fire behavior, especially in restored forest stands that are believed to follow a different development trajectory than closed canopy stands [64]. In this study crown ratio was directly measured in the field for every tree. Had only total height been measured, as is common in most forest inventories, FVS would have underestimated CBD by 13% and overestimated CBH resulting in a 40% increase in FSG. These prediction errors highlight the importance of measuring crown ratios in the field when assessing crown fire hazard as they could have significant implications on predictions of treatment longevity. It is unclear which CRNMULT scenario is most appropriate for modeling crown changes in restored open canopy ponderosa pine systems, where light is generally not a limiting factor. The crown recession model in FVS essentially attempts to adjust crown ratios toward target values based on tree and stand characteristics within a set of constraints (e.g., ΔCR cannot exceed 1% year−1 [49]). We presume that in this case the default setting overestimated the rate of crown recession because the model predicted smaller crown ratios for the trees in our study than we obtained from field measurements. This would cause the model to simulate crown recession earlier in stand development in an attempt to maintain crown ratios that were too low. While the combination of tree- and stand-level variables used to predict crown recession in FVS appears conceptually sound, studies of crown recession invariably focus on closed canopy stands [65,66]. Presumably, crown recession is slower in open canopy stands, as shedding of lower branches is largely driven by light competition within and among tree crowns [65], which is minimal in these stands. As more spatially explicit forest restoration treatments are implemented the need for spatially and temporally informed models of forest growth, regeneration, and fire behavior will be needed to accurately predict treatment effects and longevity. The sensitivity of fire behavior outputs to crown recession assumptions identified in this work suggests more research on stand development in spatially heterogeneous stands is needed to ensure simulations provide sensible outputs.

5. Conclusions

The results demonstrate a significant relationship between the number of seedlings on a site and length of time before a stand will return to an undesirable fire hazard condition. Specifically, using FVS simulation outputs to calculate the onset of passive crown fire activity in CFIS demonstrated how the number of seedlings ha−1 and temporal distribution of the regeneration dictates restoration treatment longevity. Finding that passive and active crown fire treatment longevity were reduced five years for every 550 and 150 seedlings ha−1, and that regeneration occurring over a short time period further reduces passive crown fire longevity by 10 years over my delayed regeneration patterns. However, the analysis highlights the sensitivity of this method of predicting fuel treatment longevity when the rate of crown recession is taken into consideration. This may be even more import in restored dry conifer forests, which exhibit a heterogeneous forest structure that departs from the closed canopy systems that most forest models were developed from. Currently, no management oriented fire behavior modeling system is able to reliably represent the actual crown fire hazard potential within forest stands composed of elements of individual trees and openings between clumps of trees. However, physics based modeling platforms, such as the Wildland Urban Interface Fire Dynamics simulator (WFDS) and FIRETEC, may prove useful for investigating the effects of non-homogeneous fuels on potential fire hazard [67,68], while these models have shown some level of agreement with experimental data additional assessment of model performance is needed [69]. Alternatively, it has been suggested that use of FVS-FFE’s relatively new output called P-Torch, which produces a probability of torching from random subplots within the stand, may better represent crown fire potential in heterogeneous forests but this approach also remains to be tested [70,71]. To reliably and accurately predict changes in potential fire behavior within these heterogeneous conditions, research is needed that characterizes the local growing environment and quantifies its relationship to stand development dynamics. Fully understanding how understory plant communities, regeneration, tree physiology, and crown morphology will respond to the range of micro-site conditions created following restoration of dry conifer forests is pivotal to advancing how we model fuels, fire, carbon, habitat, and hydrologic processes in these systems.
Regardless of our need to further our understanding of stand development in these spatially heterogeneous sites, this study’s results demonstrate the sensitivity of treatment longevity to the number of seedling per hectare, timing of regeneration, and site index. Each of these factor contribute to the temporal dynamics of surface fuel accumulation, vertical fuel continuity, and the effective canopy bulk density within a stand, which ultimately govern treatment longevity in terms of crown fire hazard. Until better understanding of stand development dynamics can be established, the most conservative approach to modeling the effects of regeneration on treatment longevity would be to implement the maximum expected regeneration as a single narrow pulse immediately following treatment. This process would allow managers to determine the longevity of crown fire hazard reduction to whatever prescription objective is defined (e.g., no crowning under 90th percentile fire weather). Following this approach would define a hypothetical minimum bounds on the time needed to return to an undesirable crown fire behavior conditions.

Acknowledgments

This work would not have been possible without the funding support provided by the Joint Fire Science Program projects 13-1-04-53, 14-1-01-18, funds provided by the Rocky Mountain Research Station agreement number 13-JV-11221633-058, and the support of the Colorado Forest Restoration Institute.

Author Contributions

All authors equally contributed to conceiving and designing the experiment; W.T.T. performed the experiments; W.T.T. and C.M.F. analyzed the data; all authors contributed to writing and revising the manuscript.

Conflicts of Interest

The authors declare no conflict of interest. The founding sponsors had no role in the design of the study; in the collection, analyses, or interpretation of data; in the writing of the manuscript, and in the decision to publish the results.

References

  1. Bentz, B.J.; Régnière, J.; Fettig, C.J.; Hansen, E.M.; Hayes, J.L.; Hicke, J.A.; Kelsey, R.G.; Negrón, J.F.; Seybold, S.J. Climate change and bark beetles of the western United States and Canada: Direct and indirect effects. BioScience 2010, 60, 602–613. [Google Scholar] [CrossRef]
  2. Kemp, K.B.; Blades, J.J.; Klos, Z.P.; Hall, T.E.; Force, J.; Morgan, P.; Tinkham, W.T. Managing for climate change on federal lands of the western United States: Perceived usefulness of climate science, effectiveness of adaptation strategies, and barriers to implementation. Econ. Soc. 2015, 20, 17. [Google Scholar] [CrossRef]
  3. Westerling, A.L.; Turner, M.G.; Smithwick, E.A.H.; Romme, W.H.; Ryan, M.G. Continued warming could transform Greater Yellowstone fire regimes by mid-21st century. Proc. Nat. Acad. Sci. USA 2011, 108, 13165–13170. [Google Scholar] [CrossRef] [PubMed]
  4. Smith, A.M.S.; Kolden, C.A.; Tinkham, W.T.; Talhelm, A.; Marshall, J.D.; Hudak, A.T.; Boschetti, L.; Falkowski, M.J.; Greenberg, J.A.; Anderson, J.W.; et al. Remote sensing the vulnerability of vegetation in natural terrestrial ecosystems. Remote Sens. Environ. 2014, 154, 322–337. [Google Scholar] [CrossRef]
  5. Covington, W.W. Helping western forests heal: The prognosis is poor for US forest ecosystems. Nature 2000, 408, 135–136. [Google Scholar] [CrossRef] [PubMed]
  6. Allen, S.R.; Savage, M.; Falk, D.A.; Suckling, K.F.; Swetnam, T.W.; Shulke, T.; Stacey, P.B.; Morgan, P.; Hoffman, M.; Klingel, J.T. Ecological restoration of southwestern ponderosa pine ecosystems: A broad perspective. Econ. Appl. 2002, 12, 1418–1433. [Google Scholar] [CrossRef]
  7. Cooper, C.F. Changes in vegetation, structure, and growth of southwestern pine forests since white settlement. Econ. Monogr. 1960, 30, 129–164. [Google Scholar] [CrossRef]
  8. Covington, W.W.; Moore, M.M. Southwestern ponderosa forest structure: Changes since Euro-American settlement. J. For. 1994, 92, 39–47. [Google Scholar]
  9. Clement, J.; Brown, P.M. Front Range Roundtable, Collaborative Forest Landscape Restoration Project 2011: Ecological, Social, and Economic Monitoring Plan; Colorado Forest Restoration Institute: Fort Collins, CO, USA, 2011; p. 57. [Google Scholar]
  10. Dickinson, Y. Landscape restoration of a forest with a historically mixed-severity fire regime: What was the historical landscape pattern of forest and openings? For. Econ. Manag. 2014, 331, 264–271. [Google Scholar] [CrossRef]
  11. Franklin, J.F.; Mitchell, R.J.; Palik, B.J. Natural Disturbance and Stand Development Principles for Ecological Forestry; United States Department of Agriculture/Forest Service Rocky Mountain Research Station: Fort Collins, CO, USA, 2007.
  12. Larson, A.J.; Churchill, D.C. Tree spatial patterns in fire-frequent forests of western North America, including mechanisms of pattern formation and implications for designing fuel reduction and restoration treatments. For. Econ. Manag. 2012, 267, 74–92. [Google Scholar] [CrossRef]
  13. Reynolds, R.T.; Sánchez Meador, A.J.; Youtz, J.A.; Nicolet, T.; Matonis, M.S.; Jackson, P.L.; DeLorenzo, D.G.; Graves, A.D. Restoring Composition and Structure in Southwestern Frequent-Fire Forests: A Science-Based Framework for Improving Ecosystem Resiliency; United States Department of Agriculture/Forest Service Rocky Mountain Research Station: Fort Collins, CO, USA, 2013.
  14. Aubry, K.B.; Amaranthus, M.P.; Halpern, C.B.; White, J.D.; Woodard, B.L.; Peterson, C.E.; Lagoudakis, C.A.; Horton, A.J. Evaluating the effects of varying levels and patterns of green-tree retention: Experimental design of the DEMO study. Northwest Sci. 1999, 73, 12–26. [Google Scholar]
  15. Carey, A.B. Biocomplexity and restoration of biodiversity in temperate coniferous forests: Inducing spatial heterogeneity with variable-density thinning. Forestry 2003, 76, 127–136. [Google Scholar] [CrossRef]
  16. Stanturf, J.A.; Palik, B.J.; Dumroese, R.K. Contemporary forest restoration: A review emphasizing function. For. Econ. Manag. 2014, 331, 292–323. [Google Scholar] [CrossRef]
  17. Agee, J.K.; Skinner, C.N. Basic principles of forest fuel reduction treatments. For. Econ. Manag. 2005, 211, 83–96. [Google Scholar] [CrossRef]
  18. Fulé, P.Z.; Crouse, J.E.; Roccaforte, J.A.; Kalies, E.L. Do thinning and/or burning treatments in wester USA ponderosa and Jeffrey pine-dominated forests help restore natural fire behavior? For. Econ. Manag. 2012, 269, 68–81. [Google Scholar] [CrossRef]
  19. Hudak, A.T.; Rickert, I.; Morgan, P.; Strand, E.; Lewis, S.A.; Robichaud, P.; Hoffman, C.; Holden, Z.A. Review of Fuel Treatment Effectiveness in Forests and Rangelands and a Case Study from the 2007 Megafires in Central Idaho USA; USDA: Washington, DC, USA, 2007.
  20. Omi, P.N.; Martinson, E.J. Effectiveness of thinning and prescribed fire in reducing wildfire severity. In Proceedings of the Sierra Nevada Science Symposium: Science for Management and Conversation, Davis, CA, USA, 10 March 2015; Murphy, D.D., Stine, P.A., Eds.; pp. 87–92.
  21. Stephens, S.L.; Moghaddas, J.J.; Ediminster, C.; Fiedler, C.E.; Hasse, S.; Harrington, M.; Keeley, J.E.; McIver, J.D.; Metlen, K.; Skinner, C.N.; et al. Fire treatment effects on vegetation structure, fuels, and potential fire severity in western US forests. Ecol. Appl. 2009, 19, 305–320. [Google Scholar] [CrossRef] [PubMed]
  22. Battaglia, M.A.; Smith, F.W.; Shepperd, W.D. Can prescribed fire be used to maintain fuel treatment effectiveness over time in Black Hills ponderosa pine forests? For. Econ. Manag. 2008, 256, 2029–2038. [Google Scholar] [CrossRef]
  23. Fulé, P.Z.; Laughlin, D.C.; Covington, W.W. Pine-oak forest dynamics five years after ecological restoration treatments, Arizona, USA. For. Econ. Manag. 2005, 218, 129–145. [Google Scholar] [CrossRef]
  24. Fulé, P.Z.; Roccaforte, J.P.; Covington, W.W. Posttreatment tree mortality after forest ecological restoration, Arizona, United States. Environ. Manag. 2007, 40, 623–634. [Google Scholar] [CrossRef] [PubMed]
  25. Stephens, S.L.; Collins, B.M.; Roller, G. Fuel treatment longevity in a Sierra Nevada mixed conifer forest. For. Econ. Manag. 2012, 285, 204–212. [Google Scholar] [CrossRef]
  26. Johnson, M.C.; Kennedy, M.C.; Peterson, D.L. Simulating fuel treatment effects in dry forests of the western United States: Testing the principles of a fire-safe forest. Can. J. For. Res. 2011, 41, 1018–1030. [Google Scholar] [CrossRef]
  27. Mast, J.N.; Fulé, P.Z.; Moore, M.M.; Covington, W.W.; Waltz, A.E.M. Restoration of presettlement age structure of an Arizona ponderosa pine forest. Ecol. Appl. 1999, 9, 228–239. [Google Scholar] [CrossRef]
  28. Boyden, S.; Binkley, D.; Shepperd, W. Spatial and temporal patterns in structure, regeneration, and mortality of an old-growth ponderosa pine forest in the Colorado Front Range. For. Econ. Manag. 2005, 219, 43–55. [Google Scholar] [CrossRef]
  29. Zald, H.S.J.; Gray, A.N.; North, M.; Kern, R.A. Initial tree regeneration responses to fire and thinning treatments in a Sierra Nevada mixed-conifer forest, USA. For. Econ. Manag. 2008, 256, 168–179. [Google Scholar] [CrossRef]
  30. Miina, J.; Eerikäinen, K.; Hasenauer, H. Modeling forest regeneration. In Sustainable Forest Management: Growth Models for Europe; Hasenauer, H., Ed.; Springer: Berlin, Germany, 2006; pp. 93–109. [Google Scholar]
  31. Shepperd, W.D.; Edminster, C.B.; Mata, S.A. Long-term seedfall, establishment, survival, and growth of natural and planted ponderosa pine in the Colorado Front Range. West. J. Appl. For. 2006, 21, 19–26. [Google Scholar]
  32. Flathers, K.N.; Kolb, T.E.; Bradford, J.B.; Waring, K.M.; Moser, K.W. Long-term thinning alters ponderosa pine reproduction in northern Arizona. For. Econ. Manag. 2016, 374, 154–165. [Google Scholar] [CrossRef]
  33. Puhlick, J.J.; Laughlin, D.C.; Moore, M.M. Factors influencing ponderosa pine regeneration in the southwestern USA. For. Econ. Manag. 2012, 264, 10–19. [Google Scholar] [CrossRef]
  34. Brown, P.M.; Wu, R. Climate and disturbance forcing of episodic tree recruitment in a Southwestern ponderosa pine landscape. Ecology 2005, 86, 3030–3038. [Google Scholar] [CrossRef]
  35. Battaglia, M.A.; Smith, F.W.; Shepperd, W.D. Predicting mortality of ponderosa pine regeneration after prescribed fire in the Black Hills, South Dakota, USA. Int. J. Wildl. Fire 2009, 18, 176–190. [Google Scholar] [CrossRef]
  36. Mason, G.J.; Baker, T.T.; Cram, D.S.; Boren, J.C.; Fernald, A.G.; VanLeeuwen, D.M. Mechanical fuel treatment effects on fuel loads and indices of crown fire potential in a south central New Mexico dry mixed conifer forest. For. Econ. Manag. 2007, 251, 195–204. [Google Scholar] [CrossRef]
  37. Stephens, S.L. Evaluation of the effects of silvicultural and fuels treatments on potential fire behavior in Sierra Nevada mixed conifer forests. For. Econ. Manag. 1998, 105, 21–35. [Google Scholar] [CrossRef]
  38. Scott, J.H.; Reinhardt, E.D. Assessing Crown Fire Potential by Linking Models of Surface and Crown Fire Behavior; United States Department of Agriculture: Fort Collins, CO, USA, 2001.
  39. Rothermel, R.C. A Mathematical Model for Predicting Fire Spread in Wildland Fuels; United States Department of Agriculture: Washington, DC, USA, 1972.
  40. Rothermel, R.C. Predicting Behavior and Size of Crown Fires in the Northern Rocky Mountains; United States Department of Agriculture: Washington, DC, USA, 1991.
  41. Van Wagner, C.E. Conditions for the start and spread of crown fire. Can. J. For. Res. 1977, 7, 23–34. [Google Scholar] [CrossRef]
  42. Cruz, M.G.; Alexander, M.E.; Wakimoto, R.H. Definition of a fire behavior model evaluation protocol: A case study application to crown fire behavior models. In Proceedings of the Fire, Fuel Treatments, and Ecological Restoration Conference, Fort Collins, CO, USA, 16–18 April 2002; Omi, P.N., Joyce, L.N., Eds.; USDA Forest Service Proceeding: Washington, DC, USA, 2003. [Google Scholar]
  43. Cruz, M.G.; Alexander, M.E. Assessing crown fire potential in coniferous forests of western North America: A critique of current approaches and recent simulation studies. Int. J. Wildl. Fire 2010, 19, 377–398. [Google Scholar] [CrossRef]
  44. Cruz, M.G.; Alexander, M.E.; Wakimoto, R.H. Modeling the likelihood of crown fire occurrence in conifer forest stands. For. Sci. 2004, 50, 640–658. [Google Scholar]
  45. Comer, P.J.; Reid, M.S.; Rondeau, R.J.; Black, A.; Stevens, J.; Bell, J.; Menefee, M.; Cogan, D. A Working Classification of Terrestrial Ecological Systems in the Northern Colorado Plateau: Analysis of Their Relation to the National Vegetation Classification System and Application to Mapping; NatureServe, National Park Service: Arlington, VA, USA, 2002; p. 23. [Google Scholar]
  46. Tuhy, J.; Comer, P.; Dorfman, D.; Lammert, M.; Neely, B.; Whitham, L.; Silbert, S.; Bell, G.; Humke, J.; Baker, B.; et al. An Ecoregional Assessment of the Colorado Plateau; The Nature Conservancy, Moab Project Office: Arlington, VA, USA, 2002; p. 112. [Google Scholar]
  47. Carmean, W.H. Forest site quality evaluation in the United States. Adv. Agron. 1975, 27, 209–269. [Google Scholar]
  48. Ziegler, J. Impacts of Treatments on Forest Structure and Fire Behavior in Dry Western Forests. Master’s Thesis, Colorado State University, Fort Collins, CO, USA, May 2014. [Google Scholar]
  49. Dixon, G.E. Essential FVS: A User’s Guide to the Forest Vegetation Simulator; United States Department of Agriculture/Forest Service Management Service Center: Fort Collins, CO, USA, 2002; p. 204.
  50. Crookston, N.L.; Dixon, G.E. The forest vegetation simulator: A review of its structure, content, and applications. Comput. Electron. Agric. 2005, 49, 60–80. [Google Scholar] [CrossRef]
  51. Reinhardt, E.; Crookston, N.L. The Fire and Fuels Extension to the Forest Vegetation Simulator; Department of Agriculture, Forest Service, Rocky Mountain Research Station: Fort Collins, CO, USA, 2003.
  52. Bailey, J.D.; Covington, W.W. Evaluating ponderosa pine regeneration rates following ecological restoration treatments in northern Arizona, USA. For. Econ. Manag. 2002, 155, 271–278. [Google Scholar] [CrossRef]
  53. Ferguson, D.E.; Crookston, N.L. User’s Guide to Version 2 of the Regeneration Establishment Model: Part of the Prognosis Model; Department of Agriculture, Forest Service, Rocky Mountain Research Station: Fort Collins, CO, USA, 1991.
  54. Alexander, M.E.; Cruz, M.G.; Lopes, A.M.G. CFIS: A software tool for simulating crown fire initiation and spread. In Proceedings of the V International Conference on Forest Fire Research, Coimbra, Portugal, 27–30 November 2006.
  55. Reinhardt, E.; Scott, J.; Gray, K.; Keane, R. Estimating canopy fuel characteristics in five conifer stands in the western United States using tree and stand measurements. Can. J. For. Res. 2006, 36, 2803–2814. [Google Scholar] [CrossRef]
  56. Scott, J.H.; Reinhardt, E.D. Stereo Photo Guide for Estimating Canopy Fuel Characteristics in Conifer Stands; Department of Agriculture, Forest Service, Rocky Mountain Research Station: Fort Collins, CO, USA, 2005.
  57. Keyser, C.E.; Dixon, G.E. Central Rockies (CR) Variant Overview—Forest Vegetation Simulator; Department of Agriculture, Forest Service, Forest Management Service Center: Fort Collins, CO, USA, 2008; p. 70. [Google Scholar]
  58. Tobin, J. Estimation of relationships for limited dependent variables. Econometrica 1958, 26, 24–36. [Google Scholar] [CrossRef]
  59. McDonald, J.F.; Moffitt, R.A. The uses of Tobit Analysis. Rev. Econ. Stat. 1980, 62, 318–321. [Google Scholar] [CrossRef]
  60. Roccaforte, J.P.; Huffman, D.W.; Fulé, P.Z.; Covington, W.W.; Chancellor, W.W.; Stoddard, M.T.; Crouse, J.E. Forest Structure and fuels dynamics following ponderosa pine restoration treatments, White Mountains, Arizona, USA. For. Econ. Manag. 2015, 337, 174–185. [Google Scholar] [CrossRef]
  61. Thomas, T.L.; Agee, J.K. Prescribed fire effects on mixed conifer forest structure at Crater Lake, Oregon. Can. J. For. Res. 1986, 16, 1082–1087. [Google Scholar] [CrossRef]
  62. Cruz, M.G.; Alexander, M.E.; Wakimoto, R.H. Development and testing of models for predicting crown fire rate of spread in conifer forest stands. Can. J. For. Res. 2005, 35, 1626–1639. [Google Scholar] [CrossRef]
  63. Johnson, E.A. Fire and Vegetation Dynamics: Studies from the North American Boreal Forest; Cambridge University Press: Cambridge, UK, 1996. [Google Scholar]
  64. Laessle, A.M. Spacing and competition in natural stands of sand pine. Ecology 1965, 46, 65–72. [Google Scholar] [CrossRef]
  65. Weiskittel, A.R.; Maguire, D.A.; Monserud, R.A. Response of branch growth and mortality to silvicultural treatments in coastal Douglas-fir plantations: Implications for predicting tree growth. For. Econ. Manag. 2007, 251, 182–194. [Google Scholar] [CrossRef]
  66. Garber, S.M.; Monserud, R.A.; Maguire, D.A. Crown recession patterns in three conifer species of the northern Rocky Mountains. For. Sci. 2008, 54, 633–646. [Google Scholar]
  67. Hoffman, C.; Morgan, P.; Mell, W.; Parsons, R.; Strand, E.K.; Cook, S. Numerical simulation of crown fire hazard immediately after bark beetle-caused mortality in Lodgepole pine forests. For. Sci. 2012, 58, 178–188. [Google Scholar] [CrossRef]
  68. Linn, R.R.; Sieg, C.H.; Hoffman, C.M.; Winterkamp, J.L.; McMillin, J.D. Modeling wind fields and fire propagation following bark beetle outbreaks in spatially-heterogeneous pinyon-juniper woodland fuel complexes. Agric. For. Met. 2013, 173, 139–153. [Google Scholar] [CrossRef]
  69. Hoffman, C.M.; Canfield, J.; Linn, R.R.; Mell, W.; Sieg, C.H.; Pimont, F.; Ziegler, J. Evaluating crown fire rate of spread predictions from physics-based models. Fire Technol. 2016, 52, 221–237. [Google Scholar] [CrossRef]
  70. Rebain, S.A. The Fire and Fuels Extension to the Forest Vegetation Simulator; United States Department of Agriculture/Forest Service Rocky Mountain Research Station, Forest Management Service Center: Fort Collins, CO, USA, 2009.
  71. North, M. Managing Sierra Nevada Forest; United States Department of Agriculture/Forest Service Rocky Mountain Research Station, Forest Management Service Center: Fort Collins, CO, USA, 2012.
Figure 1. Spatial extent (>6 billion hectares) of ponderosa pine and dry-mixed conifer forest and woodlands within the Southwestern United States [41] and location of the four stem-mapped study sites.
Forests 07 00137 g001
Figure 2. Temporal distribution of natural regeneration simulated in each post-treatment stand.
Forests 07 00137 g002
Figure 3. Depiction of how the FVS Crown Change Multiplier Keyword (CRNMULT) influences crown base height recession. This scenario shows a tree growing 1 m in height with FVS predicting a 10% reduction in crown ratio during one FVS cycle (10 years). The end of cycle outputs is set to correspond to CRNMULT values of 0.0, 0.5, and 1.0 (default) as you go from left to right respectively. In this scenario the CRNMULT values result in 0%, 5%, and 10% reductions in crown ratio as you go from left to right, with each having a slightly different effect on crown base height (CBH).
Forests 07 00137 g003
Figure 4. Relationship between significant variables and years to return to within 10% of pre-treatment wind speeds for (A) Torching and (B) Crowning Indices.
Forests 07 00137 g004
Figure 5. Impact of setting the FVS CRNMULT to (A) default; (B) 0.5, and (C) 0.0 on the time to return to within 10% of pre-treatment wind speeds for Torching (left) and Crowning (right) Indices.
Forests 07 00137 g005
Figure 6. Average departure across all simulations of the FSG (Top), CBD (Middle), and SFC (Bottom) when calculated for simulations with the 0.5 (dashed line) and 0.0 (solid line) FVS CRNMULT settings as compared to the Default.
Forests 07 00137 g006
Table 1. Pre and post-treatment conditions for the four simulation stands.
SiteThinning StatusSite Index § (m)Tree ha−1Basal Area (m2 ha−1)QMD (cm)CBH (m)Species Proportion *
Boulder County Open SpacePre1141718.923.93.0PIPO †† (99%)
Post29614.324.93.4PIPO (99%)
Roosevelt National ForestPre1741014.020.82.4PIPO (95%) PSME †† (4%)
Post1489.027.94.6PIPO (97%) PSME (3%)
Pike National ForestPre2371129.022.93.0PIPO (86%) PSME (13%)
Post24515.526.95.2PIPO (86%) PSME (11%)
Kaibab National ForestPre2941025.528.24.0PIPO (100%)
Post19019.836.38.2PIPO (100%)
§ Site Index is calculated at a base age of 100; QMD—quadratic mean diameter; CBH–FVS calculated canopy base height; * Species proportion was calculated as percentage of total basal area; †† PIPO—ponderosa pine; PSME—Douglas-fir.
Table 2. Immediate pre- and post-treatment FVS-FFE derived fuel parameters and CFIS fire hazard levels for the four stands.
SiteThinning StatusFVS-FFE Derived ParametersCFIS Fire Hazard Level
CBD (kg m−3)FSG (m)SFC (kg m−2)Torching (km h−1)Crowning (km h−1)
Boulder County Open SpacePre0.0841.50.7447.513.2
Post0.0602.90.74112.020.7
Roosevelt National ForestPre0.0511.50.2367.514.1
Post0.0343.60.23011.943.1
Pike National ForestPre0.0440.90.8156.225.3
Post0.0253.70.80510.767.3
Kaibab National ForestPre0.0452.40.6769.230.1
Post0.0286.70.67118.057.7
CBD—canopy bulk density; FSG—fuel stratum gap; SFC—surface fuel consumed.
Table 3. Tobit analysis regression coefficients (β) for predicting the dependent values of time to return to within 10% of pre-treatment Torching and Crowning Indices using the Single Narrow Distribution as the base distribution (Equation (2)).
Dependent Variable Torching
βSE *p-ValueLB *UB *
β0—Intercept22.5585.764<0.00111.26233.855
β1—Site Index0.0530.0680.432−0.0800.186
β2—Seedlings−0.0090.002<0.001−0.013−0.005
β3—Distribution
Single Narrow0----
Single Long11.5634.286<0.0103.16219.963
Dual Narrow8.1254.291<0.100−0.28416.534
Constant6.5624.2940.432−1.85314.977
Dependent Variable Crowning
βSE *p-ValueLB *UB *
β0—Intercept46.76417.627<0.01012.21581.313
β1—Site Index0.7480.214<0.0010.3291.167
β2—Seedlings−0.0340.006<0.001−0.046−0.022
β3—Distribution
Single Narrow0----
Single Long9.87413.2440.456−16.08435.832
Dual Narrow17.08613.3260.200−9.03143.204
Constant13.57213.2820.307−12.46039.603
* SE—standard error; 95% confidence interval LB (lower bound) and UB (upper bound).
Table 4. Tobit analysis regression coefficients (β) for each set of simulations run at the three CRNMULT levels (i.e., 1.0, 0.5, 0.0) using the Single Narrow Distribution as the base distribution.
Dependent Variable Torching
CRNMULT1.00.50.0
β (p-Value)LB–UB *β (p-Value)LB–UB *β (p-Value)LB–UB *
β0—Intercept22.558 (<0.001)11.262–33.85524.420 (<0.001)14.368–34.47221.497 (<0.001)14.298–28.695
β1—Site Index0.053 (0.432)−0.080–0.186−0.011 (0.856)−0.129–0.107−0.083 (<0.100)−0.167–0.002
β2—Seedlings−0.009 (<0.001)−0.013–(−0.005)−0.008 (<0.001)−0.011–(−0.004)−0.003 (<0.010)−0.005–(−0.001)
β3—Distribution
Single Narrow000
Single Long11.563 (<0.010)3.162 –19.9638.438 (<0.050)0.969–15.9067.813 (<0.010)2.472–13.153
Dual Narrow8.125 (<0.100)−0.284–16.5342.500 (0.513)−4.992–9.9921.250 (0.647)−4.100–6.600
Constant6.562 (0.432)−1.853–14.9776.875 (<0.100)−0.597–14.3472.500 (0.359)−2.846–7.846
Dependent Variable Crowning
CRNMULT1.00.50.0
β (p-Value)LB–UB *β (p-Value)LB–UB *β (p-Value)LB–UB *
β0—Intercept46.764 (<0.010)12.215–81.31343.835 (<0.010)14.014 –77.65549.074 (<0.001)26.228–71.919
β1—Site Index0.748 (<0.001)0.329–1.1670.702 (<0.001)0.317–1.0860.309 (<0.050)0.040–0.578
β2—Seedlings−0.034 (<0.001)−0.046–(−0.022)−0.032 (<0.001)−0.042–(−0.021)−0.019 (<0.001)−0.027–(−0.012)
β3—Distribution
Single Narrow000
Single Long9.874 (0.456)−16.084–35.83210.784 (0.377)−13.140–34.7083.004 (0.729)−13.983–19.992
Dual Narrow17.086 (0.200)−9.031–43.20411.479 (0.347)−12.457–35.4147.211 (0.406)−9.780–24.202
Constant13.572 (0.307)−12.460–39.60311.985 (0.327)−11.959–35.9294.629 (0.593)−12.358–21.617
* 95% confidence interval LB (lower bound) and UB (upper bound).

