Abstract
Fertilization increases productivity in Eucalyptus plantations, but losses in productivity associated with soil fertility continue at operational scales. In this study, we evaluated the fertilization response (FR), light use efficiency (LUE) and growth efficiency (GE), i.e., the amount of wood biomass accumulated per unit of light absorbed (LUE) and per unit of leaf area index of Eucalyptus plantations. We used a “twin plot” approach, with 161 blocks representing 52,700 ha of planted forests that spanned a broad range of edaphoclimatic conditions in southeastern Brazil. The normal plots (NP) were part of a permanent inventory network, whereas the twin plots (TP) received extra high levels of fertilization and extra weed control after fertilization. The intensive management (twin plots) led to a large increase of 5.3 Mg·ha−1·year−1 of wood increment. The region without dry periods and with soils with high clay content was most responsive to fertilization, with a 15% increment in the LUE and 10% increase in the GE of the TPs compared with those of the NPs. Our results suggested that water availability was the primary element affecting productivity and potential response to fertilization. With this information, decisions can be made on which regions should receive priority fertilization investments. However, more research is required to determine the most limiting nutrient in each type of environment.
1. Introduction
In recent decades, the global planted area of Eucalyptus has increased significantly, covering approximately 10% of the planted forest area worldwide (approximately 12 million ha) [1]. In Brazil, Eucalyptus forests occupy 5.1 million ha, of which over 1.1 million are in São Paulo [2]. The supply chain activities of the wood industry, including production, harvesting, and transportation, contribute to the social, economic, and environmental well-being of society. For example, approximately 0.97 ha of native forest is preserved per 1.0 ha of Eucalyptus plantation in Brazil [2]; thus, millions of hectares of native forests are preserved. Eucalyptus is the most productive planted forest in Brazil, with an average productivity of 40 m3·ha−1·year−1 [3]. This high productivity is linked to the availability of natural resources, genetic characteristics, and silvicultural management [4]. Productivity in São Paulo State is limited by nutrient deficiencies in soils of low fertility, high nutrient export at harvest, and inefficient nutrient use. The lack of nutrients such as nitrogen, phosphorus, boron, potassium, and magnesium or the excess of nutrients such as calcium, magnesium, and copper limits productivity [5].
Among the natural resources required for plant growth (i.e., water, light, and nutrients), nutrient availability is the resource most easily manipulated by foresters, throughout practices of soil preparation and conservation and applications of fertilizers. The efficiency of this management approach is site-specific for each type of nutrient applied [5,6,7,8].
Although knowledge on tree nutrition has advanced, losses in timber productivity associated with nutritional problems continue at operational scales [6]. Trees without equilibrated nutrition may lead to a heterogeneous population, compromising the site productivity [9]. For industrial forests, understanding the value and spatial distribution of the fertilization response is essential for optimal investments in silviculture. A twin plots (TP) design is one approach to quantify the potential response to fertilization. This method establishes paired plots (control and treated plots) across a number of selected sites that represent the landscape [8]. This approach differs from that of the classic experimental design of fertilization experiments because of a greater power of statistical inference across many stands, leading to a broader understanding of fertilization response by covering most of the environmental variability in a short period of time [6]. The control plot may be a normal plot of a permanent inventory network used to measure the actual productivity of a forest under the traditional fertilization regime of a particular owner. The treated plot receives an intensive treatment (high levels of fertilization and weed control) for quantitative insights into the factors that limit operational productivity.
The relationship between resource availability and productivity is expressed in the following equation: Production = supply + resource capture efficiency + resource use efficiency. Thus, productivity is strongly influenced by the resource supply and is dependent on the efficiency of the plant in capturing and using these resources [10,11]. Resource use efficiency is an indication of how plants use resources (e.g., biomass produced per unit of resource consumed) and is a determining factor in wood growth. Growth efficiency, e.g., the amount of wood growth per unit of leaf area, also express how active are the leaves in converting carbon into biomass; this process is strongly influenced by leaf nutritional status [12].
The use efficiency of different natural resources has been examined in several studies (i.e., water use efficiency-WUE; light use efficiency-LUE; and nutrient use efficiency-NUE; [10,13]. With increases in the resource supply, e.g., through fertilization, plants use not only nutrients but also other resources more efficiently [10]. For example, an increase in the availability of water can increase LUE, WUE, and nitrogen use efficiency [11]. Soil fertility influences LUE by increasing the amount of light absorbed with an increase in leaf area index (LAI) or by increasing plant efficiency in using radiation absorbed with an increase in leaf retention, as occurs in response to potassium fertilization [14].
Even though nutritional management of Eucalyptus leads to significant increases in the productivity and sustainability of forest plantations in Brazil [15,16,17], few studies have quantified light use and growth efficiency in response to fertilization. The objective of our study was to gain insight into fertilization response, light use efficiency, and growth efficiency of Eucalyptus plantations along an edaphoclimatic gradient in southeastern Brazil. Moreover, this study addressed the following questions: What is the difference between actual and potential productivity of Eucalyptus forests in southern Brazil? Is there variability in wood productivity on a temporal and spatial scale that can be adjusted by forestry management? Can the increases in productivity correlated with fertilization be explained by increases in light use and growth efficiencies?
2. Materials and Methods
2.1. Site Description and Location
A total of 161 plots (400 m2, containing 66 trees per plot) were installed in Eucalyptus plantations at Suzano Pulp and Paper Company in São Paulo State. The plots were selected based on a random sample of 1832 inventory plots (ranging between 2 and 4 years of age) that spanned a broad range of soil and climatic conditions separated into three regions (Table 1). The selected plots represented a 52,700-ha area of planted forests in three regions in the state of São Paulo (Figure 1).

Table 1.
Climatic characteristics and classification (Köppen) of the three study regions.
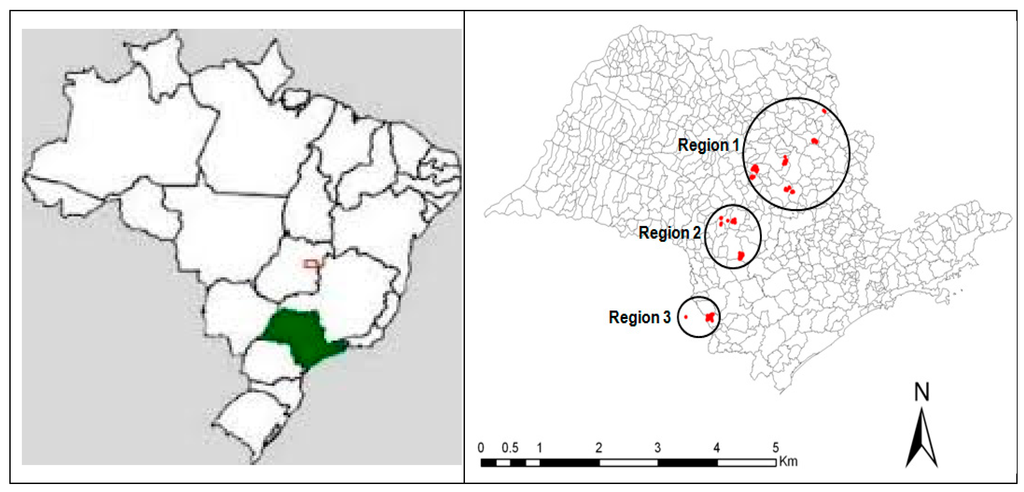
Figure 1.
Geographical location of plots in three regions of São Paulo state, Brazil. The circles represent the regions and the red areas the experimental blocks.
Each inventory plot (normal plot–NP) was paired with a second plot (twin plot-TP) of identical dimensions separated by approximately 20 m. A paired t-test was used to test for initial differences in wood biomass between normal and twin plots.
Following plot establishment, soils were sampled at 0–15 and 15–30 cm depths at four locations inside each plot. The soils were analyzed using the methodology described by Raij et al. [18] for the following chemical variables: pH (CaCl2), organic matter (OM), P, Ca, K, Mg, and micronutrients. Nitrogen was not directly included in the original analysis, but we used organic matter amount as an indicator of nitrogen soil content [19,20,21]. Brazilian Eucalyptus plantations typically do not respond to nitrogen fertilization [21].
All stands received maintenance fertilization with N, P, K, Ca, and Mg according to the conventional prescriptions of the company (Table 2). Twin plots received an additional fertilization that contained 4 t·ha−1 of lime, 2.5 t·ha−1 of NPK 18:08:18, 800 kg·ha−1 of Single Superphosphate, and 300 kg·ha−1 of FTE (Fritted Traced Elements: 1.8% B, 0.8% Cu, 3% Fe, 2% Mn, 9% Zn, and 0.1% Mo); the fertilizer was applied four times from January 2004 to April 2005. To eliminate the effects of other factors on tree growth, pests, diseases, and weeds were effectively controlled in the plot areas. Both treatments were weed-controlled, but the twin plot received an extra weed control when necessary to avoid weed effects after the extra fertilization (three times during the study period).
Table 2.
Total amount of macronutrients (kg·ha−1) applied to the conventional fertilization plots and the extra fertilization twin plots.
Two primary soil types were included in the study areas. In regions 1 and 2, the typical soil is an Entisol-Psamment, which has a sandy texture, low clay content, low cation exchange capacity, and low base saturation. In region 3, the typical soil is an Ultisol, which has a clay texture (clay content > 40% in the 0–30 cm layer), with twice the organic matter content and higher K content than in regions 1 and 2 (Table 3). The differences in physical and chemical properties between the two soil layers (0–15 and 15–30 cm) were small. The nutrient content of the surface layer (0–15 cm) was higher than that in the deeper layer.
Table 3.
Soil physical and chemical properties at the three sites.
2.2. Growth Determination and Fertilization Response
We measured all tree diameters (D) and 20% of tree heights: heights of the other trees were estimated with a site-specific hypsometric regression (Hest = lnβ0 × ln(−β1 × (1/D)), where Hest is the estimated height and β0 and β1 are the coefficients estimated for each region.
Tree volume (Vol) was estimated from tree diameter (DBH, in cm). Tree height (H, in m) was estimated using a specific taper model developed through the Smalian method and then the Schumacher-Hall [24] model was used to determine the individual volume: Vol = e( −9.56170571390879 + 1.94813158669387 × Ln(D) + 0.868952145305574 × Ln(Hest)) (p = 274; R2 = 0.98). Basic wood density was determined after cubage of trees using the hydrostatic scale method [25], which was also used to calculate stem biomass.
The mean annual increment at 7 years of age for each plot was calculated to compare the paired plots and the fertilization response (FR) of each pair, in each period. The FR was determined using the equation proposed by Ferreira and Stape [6]: FR = (CAWT/BIOMT − CAWN/BIOMN) × ((BIOMT + BIOMN)/2), where CAW = current annual woody increment (Mg·ha−1·year−1); BIOM = stem initial biomass (Mg·ha−1); and T = twin plot and N = normal plot.
2.3. Leaf Area Index, Light Use Efficiency, and Growth Efficiency
Leaf area index (LAI) was determined (m2leaf.m−2soil) using an indirect method of hemispherical photography. Photographs of the forest canopy were collected using an Opteka Fisheye hemispheric lens 0.22× (New York, USA) and a Fujifilm S5000 digital camera (Tokyo, Japan). A total of six photos were taken inside each plot (three photos within rows and three between rows). All photographs were taken using a tripod leveled and positioned centrally with the north axis (azimuth = 0°).
The photographs were analyzed with Hemisfer ® software [26] to calculate the vegetation area index (VAI) of the canopy. To estimate LAI, we used the calibration equation (LAI = ln((1.24285 × VAI) −0.82229) developed by Giunti Neto et al. [27].
Growth efficiency (GE) was calculated [28] using the relationship between current annual increment (CAI) and LAI for a determined period (n): GE = CAIn/LAIn.
LUE was estimated using the equation proposed by Landsberg and Gower [29] (LUE = CAIn × 100/APARn). Absorption of photosynthetically active radiation was calculated based on the Lambert-Beer law that relates LAI and the coefficient of forest light extinction with the incident radiation (APARn = PAR − PAR−k.LAI), where k is the extinction coefficient of PAR for Eucalyptus, 0.45. We used this value based on some work performed for clonal Eucalyptus in Brazil [30,11].
Photosynthetically active radiation was approximately 50% of global radiation (Qg) [31]. Global radiation was calculated using the equation Qg = Q0 × 0.16 × (Tmax − Tmin)−2, where Q0 = extraterrestrial radiation (MJ·m−2·day−1) and Tmax and Tmin = maximum and minimum air temperature (°C), respectively. Extraterrestrial radiation was estimated with the equation (1):
where N = number of days in a year (1 to 365); hn = hour angle sunrise (radians); Φ = latitude (radians); and δ = solar declination (radians).
2.4. Statistical Analyses
Each pair of twin plots was treated as a repetition and the twin and normal plots were the treatments. Tree growth, CAW, biomass, tree density, LAI, GE, and LUE after treatment with fertilization were analyzed using paired t-tests. For comparisons of average growth rate and LAI among different regions, the data were submitted to analysis of variance, hypothesis testing, and Tukey’s tests, with a significance level of 0.05. The analysis of variance was based on a completely randomized design.
3. Results
3.1. Productivity Plots
As expected, tree volume was not significantly different between the control and twin plots of each pair before the fertilization treatment (158 m3·ha−1 (TP) vs. 157 m3·ha−1 (NP), p = 0.241; Figure 2). With this equality, the correct interpretation of comparisons between plots after treatment application was assured.
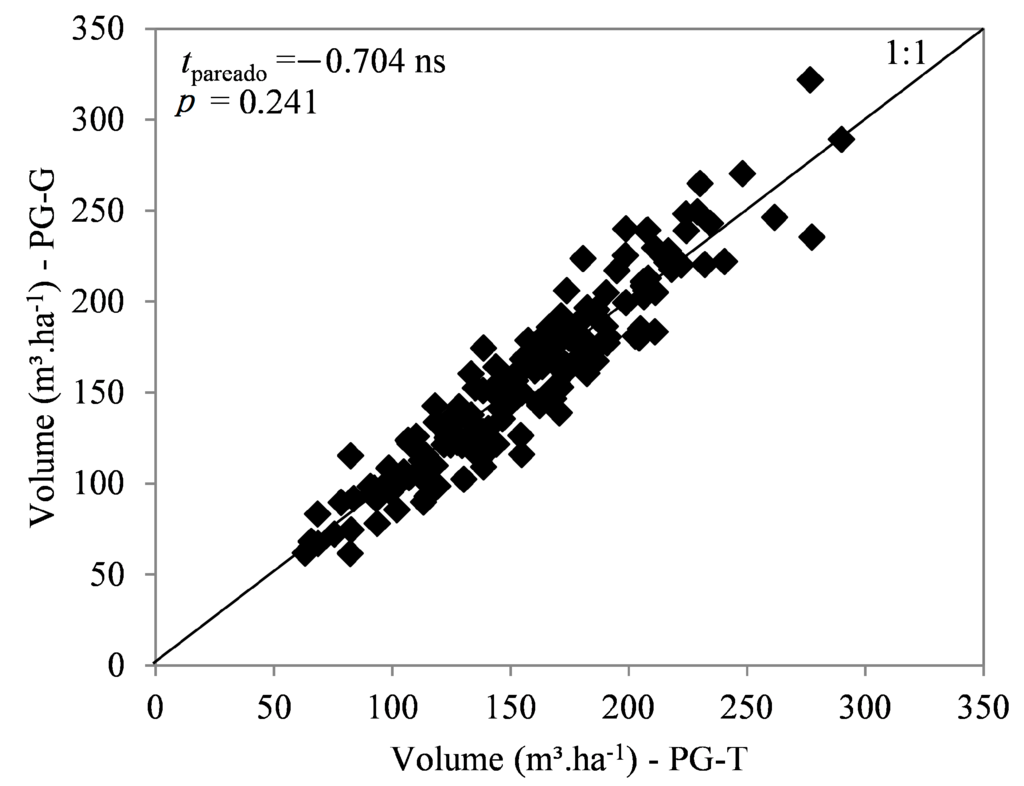
Figure 2.
Correlation between initial volume of twin (TP) and normal (NP) plots.
Between 2003 and 2006, the average increase in the annual increment of TP plots was 24% compared with NP plots (Figure 3). In the first year (2003–2004), after the additional fertilization, a small increase was observed in the twin plots (6%). However, responses to fertilization were more evident in the second year of evaluation (2004–2005), and the approximate increases were 30% in region 1, 44% in region 2, and 70% in region 3, with an average of 45%. In the final period (2005–2006), the growth rate in the plantations decreased, and the relative difference between treatments was 30%.
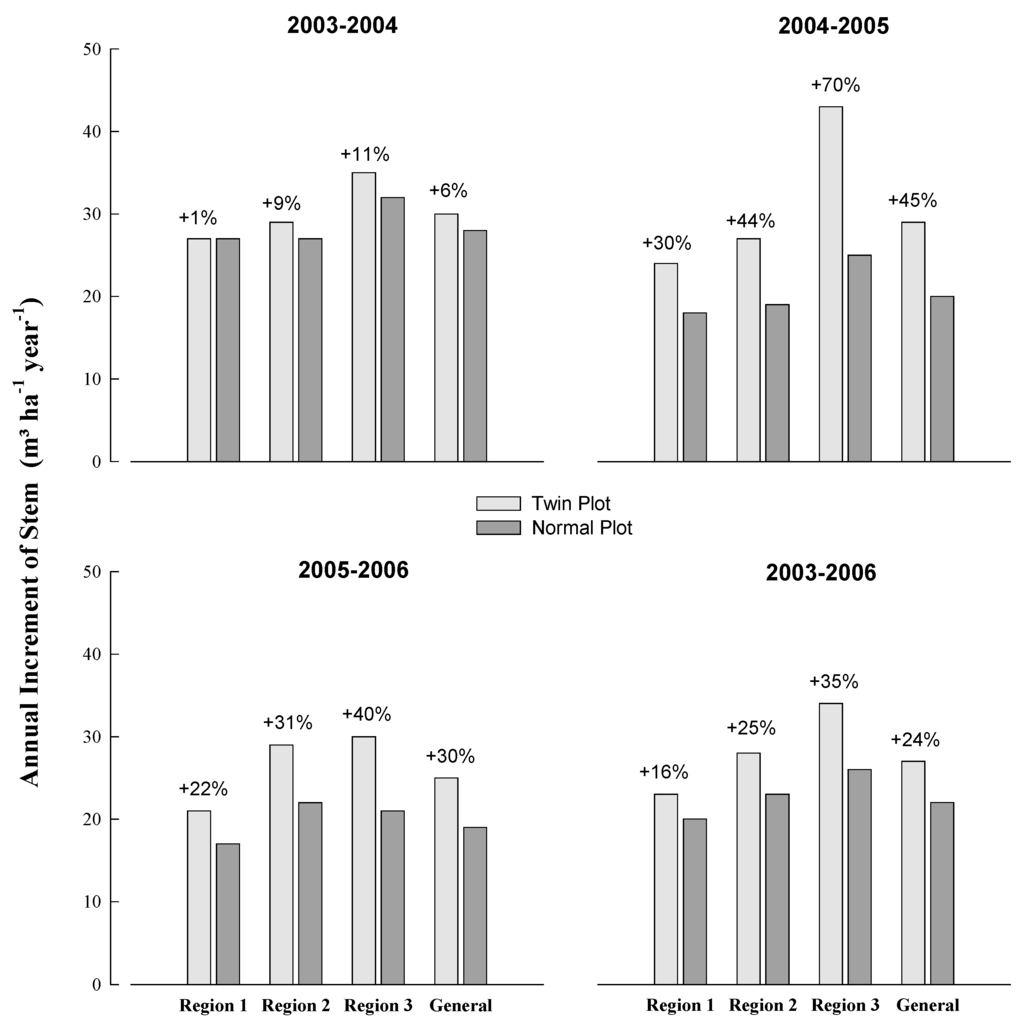
Figure 3.
Current annual increment (CAI) for stems in the twin (TP) and normal plots (NP) for the periods between 2003 and 2006 in the three regions.
At 7 years of age, the average attainable productivity of the twin plots (TP) was 49 m3·ha−1·year−1 (22 Mg·ha−1·year−1), which was 11% higher than the productivity of the normal plots (NP), i.e., 44 m3·ha−1·year−1 (20 Mg·ha−1·year−1).
The mean annual increment at 7 years of age (MAI7) in NPs (54 m3·ha−1·year−1) and TPs (62 m3·ha−1·year−1) was the highest in region 3. Region 1 had the lowest MAI7, of 38 m 3·ha−1·year−1 (NP) and 41 m3·ha−1·year−1 (TP). The greatest difference between the actual and the attainable productivity was in region 3 (15%). The maximum productivity occurred in region 3, i.e., 82 m³·ha−1·year−1, followed by regions 2 and 1 with maximum productivity of 78 and 57 m3·ha−1·year−1, respectively (Table 4).
Table 4.
The average and maximum annual increment at 7 years of age (MAI7) for twin and normal plots.
3.2. Fertilization Response (FR)
The average fertilization response (FR) between 2003 and 2006 was 5.3 Mg·ha−1·year−1. Region 3 was the most responsive region, followed by regions 2 and 1 (Table 5). The FR was normally distributed (Figure 4), with ~85% of the data showing a positive FR and 50% of the plots with an FR equal to or higher than the average (5.3 Mg·ha−1·year−1); similar proportions were found by Ferreira & Stape [6].
Table 5.
Response to fertilization in the three regions.
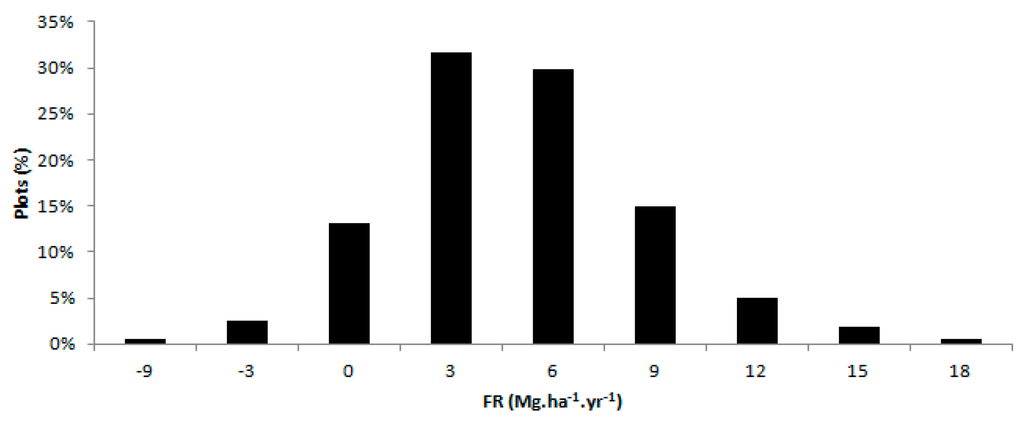
Figure 4.
Distribution of fertilization response (FR) in 161 experimental plots.
Fertilization response was also affected by soil characteristics (Table 6). Considering all regions together, organic matter and clay content were the most important variables. Region 1 was strongly affected by physical characteristics, such as clay and sand content. Chemical variables such as potassium and magnesium were more strongly related to FR in region 2. In region 3, the sum of bases and percentage of silt were the most strongly related soil variables influencing the FR.
Table 6.
Pearson’s coefficient relating fertilization response and soil variables.
3.3. Leaf Area Index, Light Use Efficiency, and Growth Efficiency
In the absence of nutritional limitation, the LAI of the twin plots was 2.6 m2·m−2, compared with the LAI of 2.2 m2·m−2 in the normal plots, which was an increase of 15% in the LAI of the TPs. However, in region 3, with the highest productivity, the difference in LAI between NPs and TPs was not significant (Figure 5a).
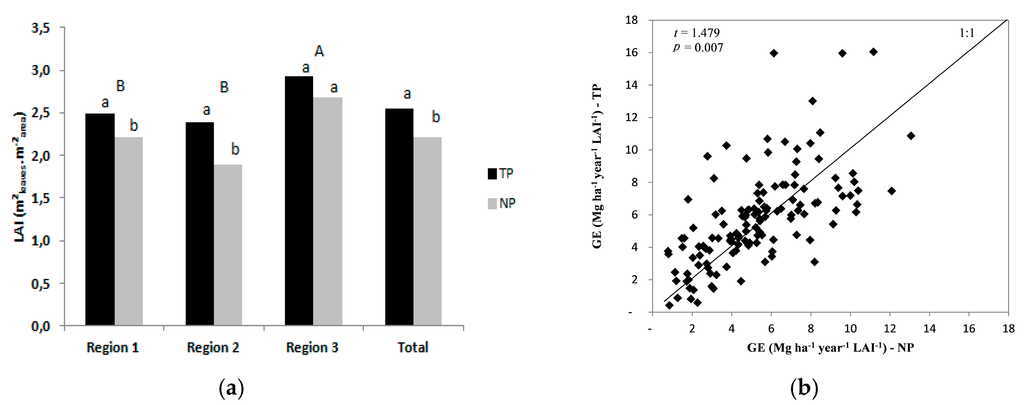
Figure 5.
(a) Average LAI for each region and treatment. Bars with identical letters are not significantly different. Lowercase letters represent the comparisons of treatments and uppercase letters represent the differences between regions (p = 0.05); (b) Correlation between growth efficiency (GE) in twin plots (TP) and normal plots (NP).
In additional, the growth efficiency (GE) of the twin plots was higher (10%) than that of the normal plots, with values of 5.8 and 5.3 Mg·ha−1·year−1, respectively, the difference was significant (p > 0.05; Figure 5b).
The light use efficiency (LUE) in the twin plots, 0.65 g·MJ−1, was 15% higher than that in the normal plots, 0.56 g·MJ−1 (p > 0.05; Figure 6).
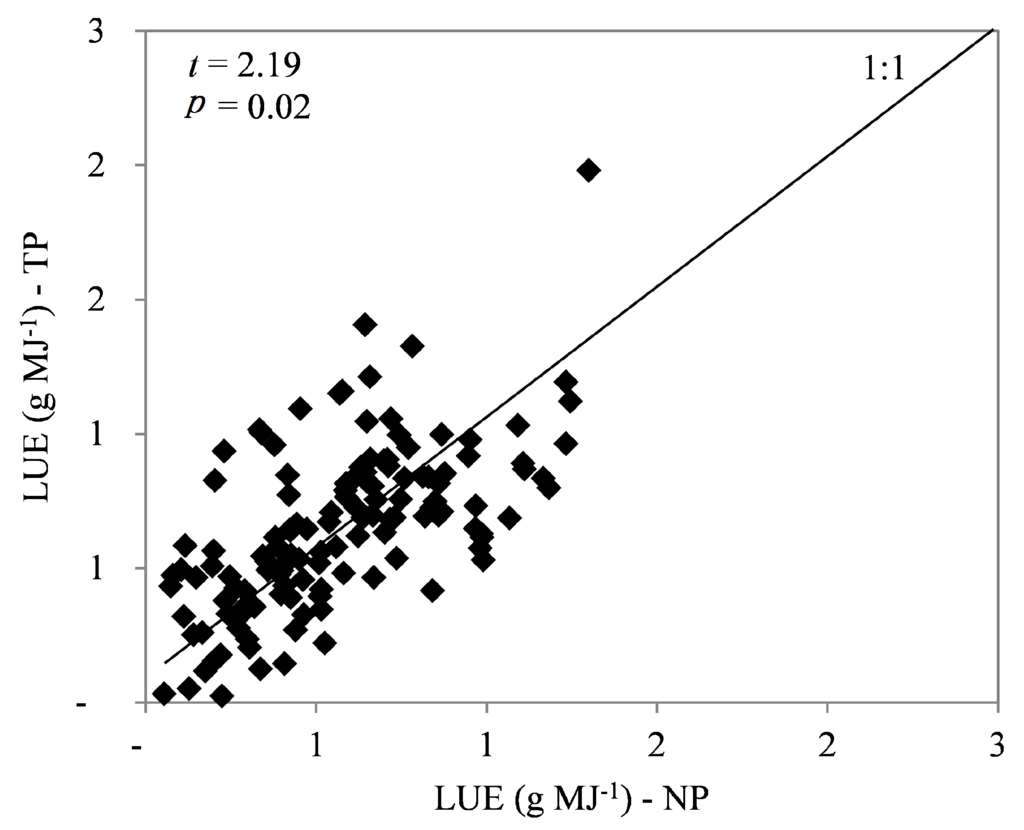
Figure 6.
Correlation between light use efficiency (LUE) in twin plots (TP) and normal plots (NP).
4. Discussion
The additional fertilization led to large increases in wood increment, with an average response in the annual increment of 5.3 Mg3·ha−1·year−1. Similar results were found in other studies, with responses of 4.8 Mg3·ha−1·year−1 [8] and 4 Mg3·ha−1·year−1 [6] in Eucalyptus plantations in São Paulo State.
Region 3 was the most responsive to fertilization, which can be explained primarily by the climate, with no dry periods, and by the high clay content in the soils; consequently, the water retention capacity and organic matter content were high. Plant growth is controlled by the most limiting resource, according to Liebig’s law of the minimum [32]. In tropical regions where water and light are not limiting resources, nutrition starts to be important and normally limits wood growth [29]. For region 3, the negative correlation of FR with the sum of bases and the silt content, which is an indicator of the primary source of nutrients [33], revealed nutritional aspects interfere more with FR than water availability.
In region 1, the climate has extended dry periods and the soils are sandy, which resulted in the lowest productivity (Table 4). Soil physical properties, particularly the clay content, are directly correlated with wood quality (lignin and holocellulose content) and the productive capacity of a site [34]. In this region, where water is a limiting factor, the extra addition of nutrients did not lead to an extra amount of wood, confirmed by the positive correlation between the FR and sand content.
The largest response to fertilization was in the region that also had the highest productivity (Region 3), which was different from the response observed by Ferreira and Stape [6]. Therefore, the area with the highest nutrient limitations on growth was also the most productive. Thus, water, the primary growth factor [17,11], was not limiting at this site, whereas in the other regions, particularly in region 1, the most limiting factor was water.
In the twin plots, LAI increased by 15% and GE increased by 10% compared with the normal plots. The increase in leaf area might explain the increase in productivity. Albaugh et al. [35] found much larger gains, an increase of 101% in the LAI, in response to fertilization in loblolly pine. In Eucalyptus nitens plantations, nitrogen fertilization increased the LAI by up to 3.1 units, i.e., 56% increment [36].
Fertilization increased the LUE and the GE, which was also reported by Binkley et al. [37] for Eucalyptus and for other forest trees, including loblolly pine [38] and Liquidambar styraciflua [39]. These responses might be a result of higher photosynthetic rates with the addition of nutrients [40] or caused by less carbon partitioning to shoots [10,41].
Additional fertilization reduced nutrient limitations in the Eucalyptus plantations and increased wood productivity, LAI, and LUE. Thus, we can identify and quantify opportunities to improve the current fertility management of these plantation populations (high probability of response in 85% of the experimental blocks), particularly in region 3. Moreover, with nutrient limitations, wood production was reduced by 5.3 Mg·ha−1·year−1. We identified that for all sites, organic matter and clay content were related to FR. Additionally, for the intermediate and high fertility sites (region 2 and 3, respectively), potassium and magnesium, and the sum of bases and the silt content, respectively, were related to FR (Table 6). All of these responses together indicate these variables can be used as diagnostic tools for managers to decide where to invest in fertilization.
Water availability was the primary element affecting productivity and potential response to fertilization. When water resources are available, nutrient limitations become more apparent as the primary difference among the three regions. For practical applications, forest managers can use these results to determine which regions should receive priority in analyses of fertilization investment. For example, on a regional scale, fertilization investments would have a much higher return in region 3 compared with the other regions because of the greater potential for response and generation of economic returns from the plantation forests. Our findings do not provide exact information of where the responses would occur, but the main drivers are described in Table 6 (quantity of organic matter, clay content, potassium, magnesium, sum of bases and silt content). Fisher and Binkley [42] proposed a decision support method to minimize the risks. According to the authors, the risks are related to the average and variance of the response, being a high negative risk if the response is low and with a high variance. In our case, the high percentage of plots that had a positive FR (85%) could help managers to support a decision to apply fertilizer.
The aim of this study was to quantify the potential wood productivity and the proportional response to fertilization with a complete nutrient supplement when plants were grown across a wide range of soil types and climatic conditions. Future studies should focus on the separate effects of different nutrients following fertilization to determine the most limiting elements in each environment.
Acknowledgments
This research was supported by Suzano Paper and Pulp Company, the University of São Paulo, Forestry Science and Research Institute (IPEF) and São Paulo Research Foundation (FAPESP).
Author Contributions
Main text.
Conflicts of Interest
The authors declare no conflict of interest.
References
- Lungo, A.D.; Ball, J.; Carle, J. Global Planted Forests Thematic Study: Results and Analysis; Planted Forests and Trees Working Paper; The Food and Agriculture Organization of the United Nations (FAO): Rome, Italy, 2006. [Google Scholar]
- Associação Brasileira Dos Produtores De Florestas Plantadas. Anuário Estatístico ABRAF 2014: Base Year 2013; Associação Brasileira Dos Produtores De Florestas Plantadas: Brasília, Brazil, 2014; p. 74. [Google Scholar]
- IBÁ. Indústria Brasileira de Árvores. Available online: http://www.iba.org/shared/iba_2014_pt.pdf (accessed on 10 June 2015).
- Zen, S. Influência da Matocompetição em Plantios de Eucalyptus grandis, Série técnica. IPEF 1987, 4, 25–35. [Google Scholar]
- Sgarbi, F. Produtividade do Eucalyptus sp. em Função do Estado Nutricional e da Fertilidade do Solo em Diferentes Regiões do Estado de São Paulo. Ph.D. Thesis, Superior School of Agriculture Luiz de Queiroz, University of Sao Paulo, Piracicaba, Brazil, 2002; p. 101. [Google Scholar]
- Ferreira, J.M.A.; Stape, J.L. Productivity gains by fertilization in Eucalyptus urophylla clonal plantations across gradients in site and stand conditions. South. For. 2009, 71, 253–258. [Google Scholar]
- Laclau, J.P.; Ranger, J.; Gonçalves, J.L.M.; Maquère, V.; Krusche, A.V.; M’bou, A.T.; Nouvellon, Y.; Saint-Ándré, L.; Bouillet, J.-P.; de Cassia Piccolo, M.; et al. Biogeochemical cycles of nutrients in tropical Eucalyptus plantations Main features shown by intensive monitoring in Congo and Brazil. For. Ecol. Manag. 2010, 259, 1771–1785. [Google Scholar] [CrossRef]
- Stape, J.L.; Binkley, D.; Jacob, W.S.; Takahashi, E.N. A twin-plot approach to determine nutrient limitation and potential productivity in Eucalyptus plantations as landscapes scales in Brazil. For. Ecol. Manag. 2006, 223, 358–362. [Google Scholar] [CrossRef]
- Hakamada, R.E.; Stape, J.L.; Lemos, C.C.Z.; Almeida, A.A.; Silva, L.F. Uso do inventário florestal e da uniformidade entre árvores como ferramenta de monitoramento da qualidade silvicultural em plantios clonais de eucalipto. Sci. For. 2015, 43, 27–36. [Google Scholar]
- Binkley, D.; Stape, J.L.; Ryan, M.G. Thinking about efficiency of resource use in forests. For. Ecol. Manag. 2004, 193, 5–16. [Google Scholar] [CrossRef]
- Stape, J.L.; Binkley, D.; Ryan, M.G. Eucalyptus production and the supply, use and efficiency of use of water, light and nitrogen across a geographic gradient in Brazil. For. Ecol. Manag. 2004, 193, 17–31. [Google Scholar] [CrossRef]
- Nilsson, U.; Allen, H.L. Short- and long-term effects of site preparation, fertilization and vegetation control on growth and stand development of planted loblolly pine. For. Ecol. Manag. 2003, 175, 367–377. [Google Scholar] [CrossRef]
- Otto, M.S.G.; Hubbard, R.M.; Binkley, D.; Stape, J.L. Dominant clonal Eucalyptus grandis x urophylla trees use water more efficiently. For. Ecol. Manag. 2014, 328, 117–121. [Google Scholar] [CrossRef]
- Laclau, J.P.; Almeida, J.C.R.; Gonçalves, J.L.M. Influence of nitrogen and potassium fertilization on leaf lifespan and allocation of above-ground growth in Eucalyptus plantation. Tree Physiol. 2009, 29, 111–124. [Google Scholar] [CrossRef] [PubMed]
- Barros, N.F.; Novais, R.F.; Neves, J.C.L.; Leal, P.G.L. Fertilizing eucalypt plantations on the Brazilian savannah soils. S. Afr. For. J. 1992, 160, 7–12. [Google Scholar]
- Gonçalves, J.L.M.; Barros, N.F.; Nambiar, E.K.S.; Novais, R.F. Soil and stand management for short-rotation plantations. In Management of Soil, Water, and Nutrients in Tropical Plantation Forests; Nambiar, E.K.S., Brown, A., Eds.; ACIAR Monograph 43; Australian Centre for International Agricultural Research: Canberra, Australia, 1997; pp. 379–418. [Google Scholar]
- Gonçalves, J.L.M.; Stape, J.L.; Laclau, J.-P.; Bouillet, J.-P.; RANGER, J. Assessing the effects of early silvicultural managements on long-term site productivity of fast-growing Eucalypt plantations: The Brazilian experience. South. For. 2008, 70, 105–118. [Google Scholar] [CrossRef]
- Van Raij, B.; Andrade, J.C.; Cantarella, H.; Quaggio, J.A. Análise Química para Avaliação da Fertilidade de Solos Tropicais; Instituto Agronômico de Campinas: Campinas, Brazil, 2001; p. 285. [Google Scholar]
- Gonçalves, J.L.M.; Mendes, K.C.F.S.; Sasaki, C.M. Mineralização de nitrogênio em ecossistemas florestais naturais e implantados do estado de São Paulo. Rev. Bras. Ciênci. Solo 2001, 25, 601–616. [Google Scholar] [CrossRef]
- Gonçalves, J.L.M.; Alvares, C.A.; Higa, A.R.; Silva, L.D.; Alfenas, A.C.; Stahl, J.; Ferraz, S.F.B.; Lima, W.P.; Brancalion, P.H.S.; Hubner, A.; et al. Integrating genetic and silvicultural strategies to minimize abiotic and biotic constraints in Brazilian Eucalypt plantations. For. Ecol. Manag. 2013, 301, 6–27. [Google Scholar] [CrossRef]
- Pulito, A.P.; Leonardo de Moraes Gonçalves, J.; Smethurst, P.J.; Junior, J.C.A.; Alcarde Alvares, C.; Rocha, J.H.T.; Hübner, A.; de Moraes, L.F.; Miranda, A.C.; Kamogawa, M.Y.; et al. Available Nitrogen and Responses to Nitrogen Fertilizer in Brazilian Eucalypt Plantations on Soils of Contrasting Texture. Forests 2015, 6, 973–991. [Google Scholar] [CrossRef]
- Sentelhas, P.C.; Pereira, A.R.; Marin, F.R.; Angelocci, L.R.; Alfonsi, R.R.; Caramori, P.H.; Swart, S. Balanços Hídricos Climatológicos de 500 Localidades Brasileiras. Piracicaba: Núcleo de Monitoramento Agroclimático. Disponível em. 2001. Available online: http://www.esalq.usp.br/departamentos/lce/nurma.htm (accessed on 20 May 2008).
- Donagemma, G.K.; de Campos, D.V.B.; Calderano, S.B.; Teixeira, W.G.; Viana, J.H.M. Manual de Métodos de Análise de Solo, 2nd ed.; Centro Nacional de Pesquisa de Solos: Rio de Janeiro, Brazil, 1997; p. 212. [Google Scholar]
- Schumacher, F.X.; Hall, F.S. Logarithmic expression of timber-tree volume. J. Agric. Res. 1993, 47, 719–734. [Google Scholar]
- Barrichelo, L.E.G.; Foelkel, C.E.B.; Brasil, M.A.M. Métodos para determinação da densidade básica de coníferas e folhosas. IPEF 1971, 2, 65–74. [Google Scholar]
- Schleppi, P.; Conedera, M.; Sedivy, I.; Thimonier, A. Correcting non-linearity and slope effects in the estimation of the leaf area index of forests from hemispherical photographs. Agric. For. Meteorol. 2007, 144, 236–242. [Google Scholar] [CrossRef]
- Giunti Neto, C.J.; Stape, J.L.; Silva, S.R.; Hakamada, R.E. Calibração do Uso de Fotos Hemisféricas, Do LAI—2000 e Do Ceptômetro para Estimativas de Índice de Área Foliar em Plantações de Eucalyptus; Technical Report; Superior School of Agriculture “Luiz de Queiroz”, University of Sao Paulo: Piracicaba, Brazil, 2007; p. 61. [Google Scholar]
- Waring, R.H.; Thies, W.G.; Muscato, D. Stem growth per unit of leaf area: A measure of tree vigor. For. Sci. 1980, 26, 112–117. [Google Scholar]
- Landsberg, J.J.; Gower, S.T. Applications of Physiological Ecology to Forest Management; Academic Press: Waltham, MA, USA, 1997; p. 354. [Google Scholar]
- Almeida, A.C.; Landsberg, J.J.; Sands, P.J. Parametrization of 3-PG model for fast growing Eucalyptus grandis plantations. For. Ecol. Manag. 2004, 193, 179–195. [Google Scholar] [CrossRef]
- Larcher, W. Ecofisiologia Vegetal; RiMa: São Carlos, Brazil, 2000; p. 531. [Google Scholar]
- Sinclair, T.R. Mineral nutrition and plant growth response to climate change. J. Exp. Bot. 1992, 43, 1141–1146. [Google Scholar] [CrossRef]
- Lana, M.C.; Neves, J.C.L. Capacidade de suprimento de potássio em solos sob reflorestamento com eucalipto do estado de São Paulo. Rev. Árvore 1994, 18, 115–122. [Google Scholar]
- Gava, J.L.; Gonçalves, J.L.M. Soil atributes and wood quality for pulp production in plantations of Eucalyptus grandis clone. Sci. Agric. 2008, 63, 306–313. [Google Scholar]
- Albaugh, T.J.; Allen, H.L.; Dougherty, P.M.; Kress, L.W.; King, J.S. Leaf area and above- and belowground growth responses of loblolly pine to nutrient and water additions. For. Sci. 1998, 44, 1–12. [Google Scholar]
- Smethurst, P.; Baillie, C.; Cherry, M.; Holz, G. Fertilizer effects on LAI and growth of four Eucalyptus nitens plantations. For. Ecol. Manag. 2003, 176, 531–542. [Google Scholar] [CrossRef]
- Binkley, D.; Stape, J.L.; Bauerle, W.L.; Ryan, M.G. Explaining growth of individual trees: Light Interception and efficiency of light use by Eucalyptus at four sites in Brazil. For. Ecol. Manag. 2010, 259, 1695–1703. [Google Scholar] [CrossRef]
- Campoe, O.C.; Stape, J.L.; Albaugh, T.J.; Allen, H.L.; Fox, T.R.; Rubilar, R.; Binkley, D. Fertilization and irrigation effects on tree level growth, light interception and light use efficiency in Pinus taeda. For. Ecol. Manag. 2013, 288, 43–48. [Google Scholar] [CrossRef]
- Allen, C.B.; Will, R.E.; Jacobson, M.A. Production Efficiency and Radiation Use Efficiency of Four Tree Species Receiving Irrigation and Fertilization. For. Sci. 2005, 51, 556–569. [Google Scholar]
- Clearwater, M.J.; Meinzer, F.C. Relationships between hydraulic architecture and leaf photosynthetic capacity in nitrogen-fertilized Eucalyptus grandis trees. Tree Physiol. 2001, 21, 683–690. [Google Scholar] [CrossRef]
- Giardina, C.P.; Ryan, M.G.; Binkley, D.; Fownes, J.H. Primary production and carbon allocation in relation to nutrient supply in a tropical experimental forest. Glob. Change Biol. 2003, 9, 1438–1450. [Google Scholar] [CrossRef]
- Fisher, R.F.; Binkley, D. Ecology and Management of Forest Soils, 3rd ed.; Wiley: New York, NY, USA, 2000. [Google Scholar]
© 2016 by the authors; licensee MDPI, Basel, Switzerland. This article is an open access article distributed under the terms and conditions of the Creative Commons Attribution (CC-BY) license (http://creativecommons.org/licenses/by/4.0/).