Abstract
Widespread and economically important European tree species such as Norway spruce, Scots pine, and European beech are projected to be negatively affected by the increasing intensity and frequency of dry and hot conditions in a future climate. Hence, there is an increasing need to investigate the suitability of presumably more drought tolerant species to ensure future ecological stability, biodiversity, and productivity of forests. Based on their distribution patterns and climatic envelopes, the rare, minor broadleaved tree species Sorbus torminalis ((L.) CRANTZ), S. domestica (L.), Acer campestre (L.), and A. platanoides (L.) are assumed to be drought tolerant, however, there is only limited experimental basis to support that notion. This study aimed at quantifying growth and gas exchange of seedlings of these species during drought conditions, and their capacity to recover following drought. For that purpose, they were compared to the common companion species Quercus petraea ((MATTUSCHKA) LIEBL.) and Fagus sylvatica (L.). Here, potted seedlings of these species were exposed to water limitation followed by rewetting cycles in a greenhouse experiment. Photosynthesis and transpiration rates, stomatal conductance as well as root and shoot growth rates indicated a high drought resistance of A. campestre and A. platanoides. Sorbus domestica showed a marked ability to recover after drought stress. Therefore, we conclude that these minor tree species have the potential to enrich forests on drought-prone sites. Results from this pot experiment need to be complemented by field studies, in which the drought response of the species is not influenced by restrictions to root development.
1. Introduction
Climate change poses one of the major challenges of our time to forestry. For Central Europe, increasing temperatures accompanied by less precipitation during summer are expected [1]. The exceptionally warm and dry summer of 2003 with its wide-spread negative effects on growth and vitality of lowland forest ecosystems [2,3] may be considered a warning of changes to come [4,5,6]. Some of the most important timber species in Europe such as Norway spruce (Picea abies L. H. KARST.), Scots pine (Pinus sylvestris L.) and European beech (Fagus sylvatica L.) are already affected by climate change. A distinct sensitivity to drought is well known for Picea abies [7,8] and is currently being intensively discussed for Pinus sylvestris [9,10] and Fagus sylvatica [11,12,13]. Owing to the likely decline in the distribution areas of the currently dominant tree species [14], forestry is looking for alternative tree species to maintain forest ecosystems and their many functions in areas that may be particularly affected by increasing drought severity and frequency [15,16].
Owing to their small root systems and lack of storage reserves, small trees in the understory are commonly the most affected by water limitation in forest stands [17,18,19,20,21,22]. The failure of regeneration of one or more tree species as a result of increasingly harsh environmental conditions could lead to changes in stand structure and composition [23,24,25], biodiversity [26,27], and in the long-term to negative economic effects [14]. One silvicultural solution to avoid this problem could be the incorporation of more drought-adapted but currently rare tree species [16,28]. For example, minor broadleaved tree species like the wild service tree (Sorbus torminalis (L.) CRANTZ), service tree (Sorbus domestica L.), field maple (Acer campestre L.) or Norway maple (Acer platanoides L.) amongst others are thought to be very drought-tolerant [15,29] and at the same time have a high economic and ecological value [30,31]. These four species have a similar southern distribution margin, but the distribution of A. platanoides, which is apparently more frost tolerant, extends further to the north and to higher altitudes. In the future, minor tree species might contribute considerably more to European forests and timber production to compensate for the local or regional loss of other species in ecological and economic terms. However, information on the ability of these species to cope with drought is mainly based on observations of their natural occurrence (Table 1), climatic envelopes, and the phytosociological composition of forest stands [32,33,34,35,36,37,38,39,40,41,42,43,44]. Experimental studies on the responses to water shortage of those minor broadleaved tree species have been very few and are not sufficient to quantify their drought tolerance accurately.

Table 1.
Overview of basic biogeographical information on the studied tree species. F-scale (moistness) and T-scale (temperature) abbreviate the indicator values [32]. For Acer platanoides, only the European provenances are considered.
Plants have developed different strategies to withstand conditions of water shortage uninjured. In simple terms, plants that strongly reduce stomatal conductance as soil water potential decreases are classified as ‘isohydric’ or ‘water savers’, while plants that are less sensitive to low soil water potentials and maintain a relatively high stomatal conductance are classified as ‘anisohydric’ or ‘water spenders’ [45,46]. Grouping plant species according to their drought response as isohydric or anisohydric disregards that there is a continuum across species in physiological processes such as stomatal conductance [47]. However, such categories are helpful for a conceptual understanding of drought adaptations in plants. A stress tolerant plant has the ability to withstand changes to its functioning or performance in the face of stress, which can be described as resistance. Resilience and recovery describe the timespan required to return to the pre-stress level of functioning or a new post-stress level [48]. Since recovery defines the immediate response following cessation of stress [48], it seems to be the more appropriate variable to quantify the short- and medium-term response to drought. The maintenance of carbon assimilation and water transport even under stressful conditions are useful measures for the drought effects on plant functioning [49]. Therefore, the temporal pattern of physiological processes like photosynthetic rate, transpiration, and stomatal conductance in forest trees in relation to drought can be used to develop a measure of resistance and recovery based on the stability of these processes in the face of drought [50]. As trees limit their transpiration and therefore their photosynthesis at low soil water content [9], the magnitude of this decline can be seen as a measure of resistance, especially when tree species are compared. In the long term, resistant and resilient seedlings are more likely to survive droughts [51].
Here, we aimed at determining the drought tolerance of minor tree species at the seedling stage based on their physiological performance. Therefore, we employed an experimental setting with controlled conditions of water availability in a greenhouse environment to quantify physiological and growth responses during and after drought stress. In addition to the quantification of drought stress and tolerance in absolute terms, we also tried to develop a measure of relative drought tolerance by comparison of the minor broadleaved tree species with their most important companion tree species [34], sessile oak (Quercus petraea) and European beech, in the experiment. This is also aided by extensive information on the physiological responses to water shortage of the latter species [52,53,54].
Considering their occurrence especially on drought-prone forest sites, we hypothesize that the minor broadleaved species A. campestre, A. platanoides, S. torminalis, and S. domestica are more adapted to drought than Q. petraea and F. sylvatica. This would be expressed in a lower mortality and lower reduction in biomass production under drought conditions. We further assumed that the physiological processes in minor broadleaved species are characterized by a higher resistance to drought stress; a faster recovery after drought stress, or both when compared to the more common tree species, beech and oak.
2. Materials and Methods
2.1. Plant Material
The experiment was designed to investigate the drought tolerance in seedlings of Sorbus torminalis, S. domestica, Acer campestre, A. platanoides, Quercus petraea, and Fagus sylvatica in a controlled environment. Since there is hardly any information on the drought tolerance of different provenances, we collected tree wildlings from one forest area, where all species occurred, to ensure that all species were adapted to the same climatic conditions. All plants were collected at the end of October 2011 near the town of Sailershausen, Lower Franconia (50°2′ N, 10°30′ E) at the center of the species’ natural distribution area (Table 1). The area is known for its warm and dry climate, as indicated by an average annual temperature of 8.4 °C and a cumulative precipitation of 687 mm per year (standard reference period 1961–1990).
Tree wildlings were sampled from a species diverse, closed forest stand, where the soil was a clayey rendzic leptosol originating from shell limestone. Soil water availability was low owing to shallow and rocky soils with a maximum soil depth of about 60 cm. Within this stand, regeneration of all focal tree species was found in large numbers except for Sorbus domestica. Since S. domestica regeneration could not be found in adjacent stands or in the wider region, which is not untypical for this species [55], seedlings had to be procured from a nursery. All wildlings were carefully excavated by hand and individuals with visible damage of the root system were not included in the experiment. After excavation, wildlings were transplanted into plastic pots and watered before transportation (cf. [56]).
In total, 22 wildlings per species were brought to the greenhouse facilities of the Chair of Botany at the University of Freiburg, Germany. In addition, the same numbers of seedlings including Sorbus domestica were provided by a commercial nursery as backup plants in case there would be complications with the transplanting of tree wildlings. The seeds of the nursery seedlings originated all from nearby forest stands of the same region (cf. [57]). After weighing of the plant material (Table S1), the seedlings were planted into 10 L pots (22.5 cm height, 28.4 cm diameter) containing a uniform mixture of 50% standard potting mix and 50% soil from the original forest stand, where the wildlings had been excavated, to ensure that associations with the typical microflora were possible. The pot size was matched to the plant size to avoid unnecessary artefacts in the experiment [58].
Between November 2011 and May 2012, the potted plants were kept in the open to acclimate to the new conditions and to buffer any planting shock [53]. In May 2012, 18 wildlings of Acer campestre, A. platanoides, Quercus petraea, and Fagus sylvatica as well as 18 seedlings of Sorbus domestica and S. torminalis were transferred to the greenhouse to conduct the study under controlled conditions. For the latter species, nursery stock had to be employed because the wildlings showed distinct dieback caused by fungi. During the experiment, a fungicide (Difenoconazole, C19H17Cl2N3O3) was applied monthly to all potted plants. For ease of readability, we refer to all potted plants, wildlings as well as seedlings from nursery stock, as ‘seedlings’. Wildlings from the species from which they have been used in our study have also developed from seeds. Although no climate control was used inside, temperature and brightness inside this well ventilated greenhouse were only slightly different from outside conditions. At the onset of the experiment, significant differences between some species in shoot and root length, biomass, and plant age existed (Table S1). Especially the Sorbus species were more uniform, younger, and larger, which can be explained by their nursery origin.
2.2. Experimental Setup
Six individuals per species were randomly assigned to one of three different watering treatments. One group was watered daily (‘control’). To assess the maximum resistance to drought, a second group did not receive any water during the whole experiment (‘dry’). This treatment group simulated the conditions of an enduring drought event [59] and was expected to ascertain the growth limits of the studied species. Owing to the limited number of sample plants and the small size of the seedlings, destructive measurements of plant water status using a pressure chamber [60] or the relation of fresh and dry weight of the tissue [61] were not feasible within this experiment. As a consequence, it might be argued that without the measurement of water potentials, growth limits and mortality of the seedlings caused by drought cannot be described properly. However, the dry treatment can be considered as an extreme method to stress plants and eventually disrupt all their physiological processes [62] and represents a suitable compromise between non-destructive measurements and reliable results. Moreover, even destructive approaches like pressure chambers are not invulnerable to errors, as results for the water status of plants can be distorted under very dry conditions [63].
To examine both the resistance as well as the recovery in relation to drought, the third group (dry/rewetting; ‘d/rw’) was watered like the control group, except for three periods without watering that extended from 30 June to 9 July (10 days), from 13 July to 30 July (18 days), and from 2 August to 4 September (32 days). The lengths of the three periods without irrigation were established to generate three phases of increasing drought stress. The experiment was started at the end of June 2012 (week 26) and ended at the beginning of September 2012 (week 36), lasting 69 days altogether. Measurements of leaf gas exchange were carried out at the beginning and the end of the study, as well as in mid-July (week 28) and the beginning of August (week 31). In addition, the plants undergoing drying and rewetting cycles were also analyzed directly before and 3 days after rewetting, to capture plant reaction after a period of physiological recovery. The locations of all pots in the greenhouse experiment were systematically randomized every 4 weeks.
2.3. Soil Water Status
Soil volumetric water content (VWC) in pots was determined by time domain reflectometry (TDR) using a TRIME-IT probe in conjunction with a handheld display device TRIME-HD (IMKO GmbH, Ettlingen, Germany). Prior to leaf gas exchange measurements, the TDR sensors assessed VWC data at 5–10 cm soil depth, where most fine roots occur [64]. Two measurements of water content were taken at opposite sides of every pot, and the data were subsequently averaged.
To translate volumetric water content into absolute values for available water content in the soils, water retention curves (pF-curves) of the soil were developed. For that purpose, five 100 mL soil cores were taken at about 10 cm and water retention curves were determined [65]. Finally, the available water content (AWC) was determined as the difference between water content at field capacity (FC; pF 1.8–2.48) and the permanent wilting point (PWP; pF 4.2 or −1.5 MPa); (cf. [66]). This approach allows the calculation of a reliable proxy to determine water use by trees [67,68]. We used this PWP value from the literature and did not determine the PWP for each tree species separately. Hence, the PWP should be regarded here as an indicator for water stress in plants, and not as an absolute measure of the true physiological witling point of seedlings for the soil used in this study.
2.4. Seedling Biomass, Growth, Leaf Area, and Shoot Dieback
To assess biomass increment of seedlings over the course of the experiment, total fresh mass of all individuals was determined in November 2011 (beginning) and mid-September 2012 (end of pot experiment). Before weighing, the plant roots were gently rinsed by hand and the water was carefully shaken off. Afterwards, the total fresh mass was measured. As it is difficult to estimate biomass distribution in plants non-destructively, their total dry mass was determined after the experiment. Directly after the second measurement of total fresh mass, plants were cut at the root collar and aboveground and belowground parts separately packed into paper bags. Subsequently, plant age was determined by counting the tree-rings at the root collar. Afterwards, all plant material was dried at 70 °C for 72 h and weighed afterwards [69]. Water content of leaves [57], and the root-to-shoot ratio was calculated as the ratio between root and shoot dry mass.
Subsequent to the determination of the plants’ fresh mass, their height from the tip of the leading bud to the root collar, as well as the maximum length of the root system from root collar to the tip of the primary root, were measured in November 2011, and September 2012, respectively. In addition, absolute and relative biomass increment for shoots, roots, and total fresh plant mass were determined, where the initial values were set at 100% [70,71]. The calculation of relative as compared to absolute biomass increment has the advantage of being almost independent of the initial biomass of the seedlings, which is typically quite variable especially when wildlings are studied [57]. Additionally, all leaves were clipped off the shoots and leaf area was determined using a scanner in conjunction with the image analysis software WinRHIZO™ (Regent Instruments Inc., Quebec, QC, Canada). Afterwards, leaves were dried likewise and weighed. The specific leaf area (SLA) was calculated as the ratio of leaf area to leaf dry mass [72].
Leaves that showed clear evidence of loss of elasticity, rupture of epidermal tissue, or chlorophyll degradation were assessed as senescent [73]. Since many seedlings had shed all leaves during the continuous drying treatment, it could not be ascertained visually, whether they had died or were still alive. Therefore, seedlings were tested for vitality using the TTC-test at leading shoots [74]. Before drying for biomass determination, the buds were cut from the shoots and a colorless solution of 2,3,5 tryphenil-tetrazolium-chloride (TTC) was applied. When cells still respire actively, the liquid turns into a reddish precipitate indicating living tissue. If the buds did not change color upon application of the indicator, and the whole shoot showed distinct signs of desiccation and turgor loss, the shoot was determined dead.
2.5. Leaf Gas Exchange
Maximum photosynthetic rate (Amax; µmol CO2 m−2·s−1), transpiration rate (E; mmol H2O m−2·s−1) and stomatal conductance to water vapor (gs; mol H2O m−2·s−1) were measured with a portable infrared gas analyzer (Licor 6400, Li-Cor Inc., Lincoln, NE, USA). Water use efficiency (WUE) and intrinsic water use efficiency (WUEi) were calculated as Amax/E respectively Amax/gs [75]. Based on leaf area and transpiration data, the daily rates of leaf-level transpiration (ELL) were calculated [19].
During the measurements in the greenhouse environment, CO2 concentration was kept constant at 350 ppm, while photosynthetic active radiation (PAR) was emitted by an intra-system light source (LI-6400-02 LED system, Li-Cor Inc., Lincoln, NE, USA) with an intensity of 1500 µmol·m−2·s−1. These settings were chosen to enhance comparability of the results with further studies using the same settings (cf. [76,77,78]). Molar flow rate of air entering the leaf chamber was kept constant at 500 µmol·s−1. Leaf temperature was maintained near 21 °C (20.6 °C mean ± 1.8 °C SD) and vapor pressure deficit ranged around 1.4 kPa (1.38 kPa mean ± 0.07 kPa SD). Before starting the measurements, the leaf chamber was tested for leakages by emitting high CO2 concentrations outside the measurement device by blowing breathing air to the chamber. To pass the test, the detected CO2 concentrations inside the leaf chamber were not allowed to increase by more than 1 µmol·mol−1 CO2. One healthy and undamaged leaf per plant from the upper part of the seedling was clamped into the standard leaf chamber with an area of 6 cm2 and a volume of 80 cm3. Within a measurement period, leaf gas exchange of all 108 seedlings was quantified as long as at least one healthy and undamaged leaf per plant was in place. As the determination of leaf gas exchange was performed between 10 a.m. and 4 p.m. in a sunny environment, 5 min time for the acclimation of the leaves to the set conditions were adequate [78]. After the acclimation phase, the actual measurement of leaf gas exchange lasted for 4 min per seedling (cf. [79]).
2.6. Indices to Quantify Resistance and Recovery
Here, the tolerance indices [48] for the interpretation of radial tree growth in relation to stress were employed to quantify the resistance and recovery of seedling in relation to drought and rewetting (cf. [80,81]). The basic considerations for calculation of these indices are visualized in Figure 1.
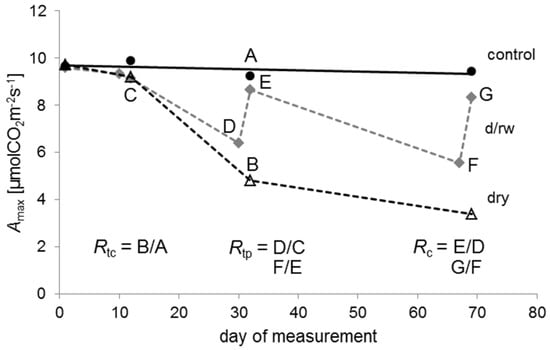
Figure 1.
An example of the temporal patterns of the maximum photosynthetic rate (Amax) for Quercus petraea seedlings of the control (black circles, black solid line), the drying/rewetting (d/rw; grey diamonds, grey dashed line), and the dry group (empty triangles, black dashed line) during the experiment. Resistance in relation to control (Rtc) is for example the ratio B/A of Amax values indicated by the points A and B; resistance in relation to pre-drought conditions (Rtp) is the ratio D/C or F/E of Amax values indicated by the respective points; recovery (Rc) is the ratio E/D or G/F of Amax values indicated by the respective points. Day 1 was the 25 June 2012.
Resistance Rt can be defined as the ability to withstand stress. Resistance was quantified in two different ways, here. First, Rtc was quantified as the ratio between the physiological performance during the drought and under normal conditions without drought stress, represented by control plants. It was calculated as the ratio between the drought treatment and the control: Rtc = dry: control. Values of 1 indicate no differences between the treatments, while values below 1 imply a reduction in the performance of seedlings caused by water shortage.
A second measure of resistance (Rtp) was calculated for plants of the drying/rewetting regime as the ratio between the performance during the drought and during irrigated conditions before the actual drought: Rtp = d/rw during drought: d/rw before drought. We used the period before each drought period as the reference. Values of 1 indicate no differences between the two phases, while values below 1 imply a reduction of the performance during drought.
Recovery (Rc) was defined [48] as the ability to recover relative to the damage experienced during drought after cessation of the drought stress. Rc is the ratio between the performance after and during the drought: Rc = d/rw following rewetting: d/rw during drought. Values below 1 indicate an incomplete recovery in seedling performance, whereas, for example, a value of 2 indicates that performance following drought has doubled in comparison to the drought period.
2.7. Statistical Analyses
All data were subjected to two-way or multivariate analysis of variances (ANOVA) using IBM SPSS Statistics 20.0 (IBM Corp., Armonk, NY, USA). Analyses of normality and homogeneity of variance for all variables were carried out with Kolmogorov-Smirnov and Levene tests. Variables that did not fulfil the requirements for an analysis of variance were log-transformed until the variables were normally distributed and showed homoscedasticity. The interrelations between variables were verified with Pearson correlations (p < 0.05).
Relative biomass increment and root-to-shoot ratio were analyzed with a two-way ANOVA assuming irrigation and tree species as fixed effects. Differences over time within irrigation regimes and tree species were subsequently tested with post-hoc comparisons based on Fisher’s Least Significant Difference (LSD) test (p < 0.05). Analysis of covariance (ANCOVA) was performed to test for the influence of initial plant biomass on leaf area, biomass increment, and root-to-shoot ratio. Where repeated measurements at the same object were conducted (data on plant leaf-gas exchange, soil volumetric water content, and the metric indices of resistance and recovery), multivariate ANOVA was used with species and/or irrigation regime as fixed factors. Equally, post-hoc comparisons based on Fisher’s LSD test (p < 0.05) were applied to test for differences between species and irrigation regime.
The deviations of the indices of resistance and recovery from unity were calculated using confidence intervals. The effects of irrigation on the metric indices were considered as significant if the 95% confidence interval did not overlap with 1.
3. Results
3.1. Water Relations
Whereas the volumetric water content (VWC) of soils in pots was relatively constant in the control treatment, albeit with some variation, the VWC of the pots that did not receive any water decreased from 27.0% (±3.3% SD) at the beginning to 3.9% (±0.8% SD) at the end of the experiment (Figure 2). The high variability after 12 days within the dry group was caused by lower VWC values of Sorbus torminalis compared to the other seedlings, owing to the high transpiration of the species (Table 2). The high water consumption in S. torminalis was only partially driven by high leaf area as the comparison with Acer platanoides, which had a similar leaf area, indicates (Table 2). After 32 days of the experiment, all soils of the dry group reached almost consistently low VWC values (Figure 2). A more detailed comparison between the studied tree species showed a similar pattern (Figure S1). The only differences between the species were detectable after 10 days of the experiment, when both unirrigated treatments of Sorbus torminalis showed lower VWC compared to the other seedlings.
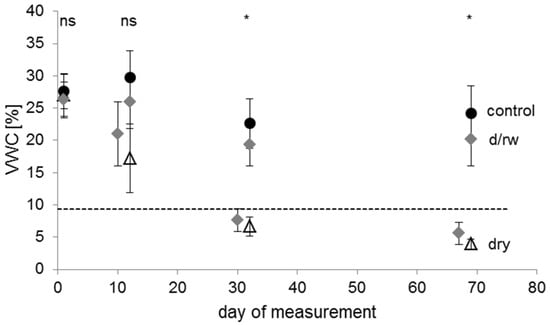
Figure 2.
Mean values of soil volumetric water content (VWC) at different points in time of the experiment for plants of the control (filled circles, n = 144 measurements with 36 plants), the drying/rewetting (d/rw; grey diamonds, n = 241 measurements with 36 plants), and the dry (empty triangles, n = 119 measurements with 36 plants) treatment groups. Error bars indicate standard deviation. The dashed horizontal line represents the permanent wilting point (9.4% VWC at pF 4.2) of the soil. Asterisks indicate significant differences between the irrigation regimes (p < 0.05); ‘ns’ indicates no significant difference. Day 1 was the 25 June 2012.
Table 2.
Means and standard deviation (±SD) of leaf area and daily rates of leaf-level transpiration (ELL) at the beginning of the experiment. Various letters indicate significant differences between species (p < 0.05), n = 18 per tree species.
An interpretation of the water retention curve indicated values of pF 1.78 (upper threshold of field capacity) at 25.0% VWC (±2.3% SD), of pF 2.48 (lower threshold of field capacity) at 22.8% VWC (±1.9% SD), and of pF 4.2 (permanent wilting point) at 9.4% VWC (±0.8% SD). Thus, volumetric water content for control-plants was near field capacity during the whole experiment, whereas VWC-values for pots in the dry treatment dropped below the permanent wilting point after approximately 25 days under continuous drought conditions. Hence, for this treatment, drought resistance was assessed at two points in time (at days 12 and 32) because measurements of leaf gas exchange were not feasible after 69 days owing to leaf mortality or shedding in many plants of this treatment group.
In the drying/rewetting treatment, the VWC dropped below the permanent wilting point after withholding irrigation for 18 days (7.6% ± 1.8% SD) and decreased further after days without watering (5.6% ± 1.7% SD). The following three days of rewetting led to a significant improvement in soil water availability to levels slightly below, but not significantly different from the control treatment (Figure 2). Thus, if there was a hysteresis effect in the drying and rewetting process [66], this would have had only a minor effect on potted plants. Therefore, these two phases of water shortage were selected to assess resistance and recovery in detail.
3.2. Shoot Dieback, Biomass Increment and Within-Plant Allocation
There was no difference between most species in relative biomass increment within the control treatment except for the Acer species, which were more productive than the others (Table 3). The most distinct differences among the tree species were found in the drying/rewetting treatment, where A. campestre produced considerably more biomass than Sorbus torminalis within a single year. Relative biomass increment (compared to 100% at the beginning of the experiment) was significantly lower for all species of the dry group with least increment for Quercus petraea (164% ± 149% SD) and S. torminalis (165% ± 97% SD). However, the Acer species showed clearly higher growth rates under drying/rewetting conditions than all other species investigated. Likewise, the Acer species achieved the significantly highest relative biomass increment across all treatments. While A. platanoides was the best performing species in relation to relative biomass increment in the control (733% ± 348% SD) and dry (400% ± 243% SD) treatments, A. campestre showed the highest growth of all tree species in the drying/rewetting group (809% ± 362% SD), which was the highest overall value for biomass increment within the experiment. Both irrigation and tree species had a significant effect on relative biomass increment, but no significant interactions between those variables were detectable. In absolute terms, S. torminalis achieved the highest absolute dry weights for all treatments (Table 3).
Table 3.
Means and standard deviation (±SD) of relative biomass increment, absolute dry weight of the seedlings at the end of the experiment, and the root-to-shoot ratios for plants of the control, drying/rewetting (d/rw), and dry treatment groups, where fresh plant mass at the beginning of the experiment was 100%. Different letters indicate significant differences between species and irrigation regimes (p < 0.05), n = 18 per tree species.
Compared to the control treatment, root-to-shoot ratios were significantly lower in the dry group for all but the Acer species (Table 3). Seedling root-to-shoot ratios were highest for A. campestre in the control (1.68 ± 0.51 SD) and dry (1.46 ± 0.39 SD) treatments, A. platanoides showed the highest root-to-shoot ratios in the drying/rewetting (1.73 ± 0.34 SD) treatment. Irrigation as well as tree species significantly affected the root-to-shoot ratios. Only seedlings of the genus Acer showed average root-to-shoot ratios above 1 in the dry treatment.
In most cases, the measured leaf traits of the seedlings showed no relations to the different watering regimes. Acer platanoides exhibited the largest leaf area (649 ± 397 cm2 SD, control group), while the calculated specific leaf area was highest for Fagus sylvatica (23.3 ± 6.0 m2·kg−1 SD, control group). Total leaf area of A. platanoides and Sorbus domestica decreased significantly with intensifying drought conditions. In contrast, no significant differences were identified for the SLA of all plants within the irrigation treatments (Table S2). Biomass increment, leaf area, and the within-plant allocation of carbon may be strongly influenced by the initial biomass of seedlings at the onset of the experiment. The performed analysis of covariance confirmed a significant influence of initial biomass on biomass increment and leaf area, but not on the root-to-shoot ratio.
Within the control treatment, neither leaf senescence nor shoot dieback was observed in any species over the course of the experiment (Table S3). Likewise, no shoot dieback occurred within the drying/rewetting treatment, and only a small percentage of plants showed signs of leaf senescence. Even within the dry treatment, no plants of the genus Acer died, whereas shoot dieback occurred in 50% of the Sorbus seedlings and in one third of Quercus petraea and Fagus sylvatica seedlings. Also, more than half of all plants showed indications of leaf senescence or abscission. At the end of the experiment, no vital leaves of S. torminalis remained on seedlings in the dry treatment group, whereas two thirds of the leaves of A. platanoides were still intact. Likewise, the water content of leaves was lowest for S. torminalis for all treatments (Table S2).
3.3. Leaf Gas Exchange
After 32 days of the experiment, Sorbus torminalis reached the highest levels for Amax within the control group (12.4 ± 2.0 µmol CO2 m−2·s−1; Figure 3). However, S. torminalis showed the lowest Amax values for the dry group after 32 days (1.4 ± 2.4 µmol CO2 m−2·s−1), whereas Acer campestre reached the highest Amax levels of that group (6.7 ± 5.2 µmol CO2 m−2·s−1). A similar trend was detectable for E, where S. torminalis performed best for the control treatment (4.2 ± 0.5 mmol H2O m−2·s−1), but A. campestre showed the highest E values after 32 days without irrigation (1.5 ± 1.2 mmol H2O m−2·s−1). Equally, within the control group, S. torminalis reached the highest gs values (0.33 ± 0.07 mol H2O m−2·s−1), and A. campestre performed best for gs within the dry treatment (0.12 ± 0.10 mol H2O m−2·s−1). In contrast, WUE values were highest for A. platanoides within the control group (5.0 ± 0.7 µmol CO2 mmol−1 H2O), and within the dry group Quercus petraea reached the highest WUE levels after 32 days without watering (5.2 ± 0.9 µmol CO2 mmol−1 H2O).
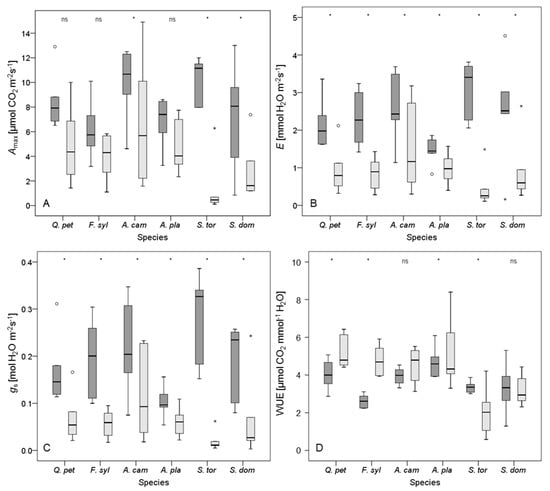
Figure 3.
Box plots for (A) maximum photosynthetic rate (Amax); (B) transpiration rate (E); (C) stomatal conductance to water vapor (gs); and (D) water use efficiency (WUE (Amax/E)) for plants of the control (dark grey box plots) and the dry group (light grey box plots) after 32 days without irrigation. Species are abbreviated as Q. pet (Quercus petraea), F. syl (Fagus sylvatica), A. cam (Acer campestre), A. pla (A. platanoides), S. tor (Sorbus torminalis), and S. dom (S. domestica). Empty circles denote outliers (defined as 1.5–3 times of box height), small stars represent extreme values (defined as more than 3 times of box height). Asterisks indicate significant differences between irrigation regimes (p < 0.05); ‘ns’ indicates no significant difference. n = 12 per tree species.
A period of 32 days without irrigation led to a significant decrease in E and gs for all investigated tree species (Figure 3). Indeed, drought conditions led to a reduction in Amax too, but in contrast to the other species, this decrease was not significant for Quercus petraea, Fagus sylvatica, and Acer platanoides as was also indicated by high resistance to drought (Rtc, Table 4). The effect of drying WUE was inconsistent. Whereas A. campestre and Sorbus domestica showed no significant change in WUE, values for Q. petraea, F. sylvatica, and A. platanoides significantly increased in response to drought, and values for S. torminalis dropped (Figure 3). As the Amax and E values for S. torminalis were very low under drought conditions, the resulting WUE values should be interpreted with caution, as even small deviations in Amax or E may cause distinct changes in WUE here (cf. [82]).
Table 4.
Means and standard deviation (±SD) of the resistance in relation to control (Rtc) for maximum photosynthetic rate (Amax), transpiration rate (E), stomatal conductance to water vapor (gs), and water use efficiency (WUE) for control and dry treatments after 12 and 32 days without watering, respectively. Values in bold type indicate a statistically significant deviation of the indices from unity (95% of the confidence intervals do not overlap with 1). Species and treatments sharing the same lower case letters were significantly different (p < 0.05); n = 24 per tree species.
Considering all three physiological variables, the Acer species appeared to resist periods of water shortage better than the other species, with A. platanoides performing slightly better than A. campestre, however, most of the differences were not significant (Table 4). Nevertheless, also Quercus petraea and Fagus sylvatica were able to resist a prolonged drought. Notably, F. sylvatica showed a marked increase in WUE (Table 4). Compared to the other species, the rapid decline of all physiological variables for Sorbus torminalis after 32 days of drought was significant (Figure 3, Table 4). Likewise, S. domestica showed no distinct ability to resist periods of water shortage. In general, drying treatments had a significant effect on all variables of leaf gas exchange measured. However, the interaction between tree species and irrigation was significant only for Amax.
This interaction is well illustrated when plotting Amax against gs (Figure 4). Here, gs could be considered as an indicator for water availability (cf. [2,83,84]). Under conditions of adequate water availability, described by high gs values, S. torminalis and A. campestre performed best, while F. sylvatica lagged behind. With decreasing gs values, Amax declined sharply for S. torminalis, substantially below the maximum photosynthesis rates of A. campestre and Q. petraea. Under conditions of severe water shortage, Amax values of S. torminalis were even lower than maximum photosynthesis rates of S. domestica and F. sylvatica.

Figure 4.
Relationship between maximum photosynthetic rate (Amax) and stomatal conductance to water vapor (gs) for Quercus petraea (Q. pet; black solid line; y = 17.70x0.440, R2 = 0.52, p < 0.01, n = 86), Fagus sylvatica (F. syl; black dashed line; y = 15.19x0.469, R2 = 0.70, p < 0.01, n = 85), Acer campestre (A. cam; dark grey solid line; y = 25.15x0.561, R2 = 0.83, p < 0.01, n = 87), A. platanoides (A. pla; dark grey dashed line; y = 20.38x0.541, R2 = 0.67, p < 0.01, n = 82), Sorbus torminalis (S. tor; light grey solid line; y = 29.13x0.780, R2 = 0.81, p < 0.01, n = 80), and S. domestica (S. dom; light grey dashed line; y = 17.96x0.519, R2 = 0.49, p < 0.01, n = 80).
In contrast to the resistance index Rtc, which compared drought stressed to control plants, the differences between the species for the resistance index Rtp, which compared performance during the drought period with physiological performance before that period, were not as clear (Table 5). Tree species had a significant effect on the Rtp index for E and gs whereas the watering status had a significant effect only on Amax.
Table 5.
Means and standard deviation (±SD) for the resistance in relation to pre-drought conditions (Rtp), which compared physiological performance during drought with the period immediately before it, and subsequent recovery (Rc) for maximum photosynthetic rate (Amax), transpiration rate (E), and stomatal conductance to water vapor (gs) for control and drying/rewetting treatments of periods of 18 and 32 days without watering, respectively. Values in bold type indicate a statistically significant deviation of the indices from unity (95% of the confidence intervals do not overlap with 1). Species and treatments not sharing the same lower case letters were significantly different (p < 0.05). Quercus petraea (n = 36), Fagus sylvatica (n = 34), Acer campestre (n = 36), A. platanoides (n = 32), Sorbus torminalis (n = 33), and S. domestica (n = 34).
Compared to Rtp, the recovery Rc was highly variable among species and drought period lengths. In all cases, except for Amax of Acer platanoides, physiological performance of all species made a full recovery from the drought (Table 5). In most cases, the performance after the drought exceeded that before the drought. Sorbus torminalis and Fagus sylvatica recovered quickly following the shorter drought period of 18 days, but this ability was much lower after the longer drought period of 32 days. In contrast, the length of the drought period had no influence on the recovery of leaf gas exchange in S. domestica and A. campestre. Nevertheless, significant interactions between tree species and irrigation occurred for all measured variables.
4. Discussion
4.1. How Resistant to Drought Are Seedlings of the Minor Tree Species?
A synoptic evaluation of the species’ drought tolerance is not straightforward since the measured variables did not always provide a clear picture for individual species and were not necessarily consistent for the duration of the experiment. In addition, there is no agreed formula for the combination of these variables into an index. However, we attempted such a synthesis of the main outcomes of the experiment (Table 6). The selection and ranking of the variables was based on their validity to express drought impacts on plants. Shoot dieback was selected as the most important variable to rank drought tolerance because it integrates the influence of many different processes and, if it translates into mortality, has a high relevance for the higher hierarchical level, the population [24,59,85]. Shedding of leaves or twigs may be regarded as the ultimate measure of drought resistance, although without further information one might not be able to identify the cause of dieback such as hydraulic failure or carbon starvation [21]. Biomass increment under drought conditions was selected as the second most important variable as it integrates various manifestations of assimilation, physiology, and metabolism [86,87]. Therefore, biomass increment under conditions of water shortage serves as a proxy to evaluate drought tolerance, but single physiological parameters like Amax, E, gs, and WUE are nonetheless important [59,63,64], especially the relationship between Amax and gs [49,57,84]. The relation of both variables is a straightforward measure of physiological drought stress, as Amax decreases with declining gs values owing to water shortage [84]. Further variables like the root-to-shoot (r/s) ratio could also be selected to convey drought tolerance [88,89]. Although initial biomass of the seedlings had no significant influence on the root-to-shoot ratio, it remains unclear if 69 days of artificial drought were sufficient to alter within-plant carbon allocation of the seedlings expressed in the calculated r/s ratios. Therefore, we did not add it to the relative ranking of the species’ drought tolerance. The drought tolerance ranking of tree species in Table 6 would not change if the r/s ratio was also taken into account. However, the two Acer species were the only ones where the r/s ratio did not decline significantly from control to dry treatment.
Table 6.
Relative ranking of the tree species according to their drought tolerance based on the variables shoot dieback, resistance to drought stress in relation to biomass growth (defined as relative biomass growth of seedlings within the dry group), and physiological performance under severe drought stress (physiology; defined as the integral of the Amax to gs curve; Figure 4). The variables were ordered according to their relevance to express drought tolerance, the ranking of species’ drought tolerance in relation to each variable was from 1 (most drought tolerant) to 6 (least drought tolerant). When no significant differences between the species were detectable, the same numbers were assigned.
In summary, the Acer species and Quercus petraea obtained a higher drought tolerance ranking than Fagus sylvatica and the Sorbus species. This ranking is somewhat unexpected when considering the ecosystems in which the species occur naturally, which might suggest a higher ranking of the Sorbus species. Both Sorbus species typically occur in xerothermic Mediterranean ecosystems ([90,91]; Table 1), whereas Acer platanoides is often regarded as a temperate to sub-boreal species [92,93] with a broad range of suitable site conditions [32]. However, the southern distribution limit of A. platanoides comes close to those of the Sorbus species (Table 1). Although the seedlings of both Acer species were very resistant to drought, Amax, E, and gs of Acer platanoides were slightly less affected by water stress than respective physiological properties in A. campestre (Table 4). However, the latter species gained more biomass, aboveground and belowground, attained the highest root-to-shoot ratios, and its Rtc values showed no statistically significant deviations from unity for all tested variables under severe drought conditions (Table 3 and Table 4). In addition, and in contrast to all the other species studied, no Acer seedlings died in this experiment, even if they were not watered at all.
Only a few published studies are available for seedlings of the minor tree species for direct comparisons with our results. Transpiration of A. campestre was similar to values measured by [94], whereas Amax and the root-to-shoot ratio were much higher in plants from our experiment. High root-to-shoot ratios of A. platanoides were in accordance with the values provided by [88], but some differences in gas exchange were noticeable. Maximum photosynthesis rates in this species were notably higher when compared to rates quantified by [57,77,88], while E and gs were slightly higher in other studies [88,95] than in our experiment. In contrast to [57], E values were higher in our pot experiment, while values of gs and WUE were slightly higher in their study. Based on measurements of xylem hydraulic conductivity, vessel density, and vessel grouping, A. platanoides was regarded as better adapted to lower water availability than A. campestre [96]. However, other studies found similar hydraulic conductivity in the xylem of the two Acer species [97]. This may indicate that the variation in these properties that may be caused by tree age, site conditions or genetics has not been captured by the available studies so far. The fact that no shoot dieback occurred in both Acer species indicates a high resistance to hydraulic failure [98]. Although A. campestre was ranked the most drought tolerant species, the results of our experiment do not suggest a clear differentiation between the two Acer species according to their drought tolerance, since they differed only in their physiological performance under drought stress (Table 6).
In contrast to the Acer species, drought resistance of the Sorbus seedlings was surprisingly low. The resistance of Sorbus domestica was comparable to that of Fagus sylvatica, but S. torminalis was the least drought-resistant tree species within this study as indicated by a rapid decline of physiological performance as soon as the water supply became limited (Table 4). The measured values for gs are in accordance with those of another study, where S. torminalis restricted gs rapidly with increasing drought stress and was highly vulnerable to xylem embolism [90]. However, we could not detect indications of lasting xylem embolism for S. torminalis, since the species recovered quickly after drought stress (Table 5), which might demonstrate that the hydraulic conductivity was either not completely lost [24] or that the seedlings may have the capacity to actively ‘refill’ their possibly embolised vessels with water rapidly [63]. When sufficient water was available, the seedlings of S. torminalis showed even higher maximum photosynthetic rates than adult trees [78]. Likewise, S. domestica seedlings of the control group showed higher values of Amax, E, and gs compared to similar studies [76]. However, seedlings of the Sorbus species were the largest at the beginning of the experiment and this may also explain why they experienced drought stress more strongly than the other species. However, differences in plant height of more than 100 cm between species were accepted in comparable pot experiments [57], whereas mean seedling height differed by less than 23 cm between S. torminalis and Q. petraea here (Table S1).
Considering all measured variables, the seedlings of Quercus petraea were less resistant to drought than the Acer species, but obviously more resistant than Fagus sylvatica and the Sorbus species (Figure 3, Table 6). This classification of oak in relation to beech is consistent with other studies that have documented the higher physiological performance of oak under conditions of water shortage [52,99]. The root-to-shoot ratios measured in this study were in accordance with values determined for F. sylvatica [100], but slightly higher for Q. petraea than in other studies [101].
In the long term, high root-to-shoot ratios can be regarded as an adaptation to dry sites [89]. In the short-term, however, the root-to-shoot ratio may decline with increasing drought stress in seedlings as was found also in other studies [53,102]. This might indicate that carbon (C) assimilation is so strongly reduced by drought that there is not sufficient C to facilitate its allocation to below-ground structures. Only the Acer species were able to maintain their C allocation patterns between aboveground and belowground structures, which might be one explanation for their distinct drought resistance observed in our study. Hence, only these species may have been able to invest into further aboveground biomass.
4.2. How Well do Seedlings of the Minor Tree Species Recover after Drought?
Surprisingly, some of the least drought-resistant species in our study such as Sorbus domestica recovered most quickly or fully from drought (Table 5). Also, Fagus sylvatica and S. torminalis showed a high ability to recover, especially from less severe droughts. The fact that seedlings were able to recover, although the soil matric potential had dropped below the permanent wilting point (−1.5 MPa), indicates that this value does not represent a true physiological wilting point for the entire woody seedlings. Here, the PWP may instead be regarded as an indicator of severe drought stress. The swift recovery also indicates that these species did obviously not suffer from a high degree of fine-root mortality or xylem embolism during drought [67,97,103]. Unfortunately, these processes, which may also explain the slower recovery of the Acer species and Quercus petraea, were not investigated in our study. The ability to recover quickly after periods of water shortage may be a particular advantage for tree species growing in environments with erratic or highly fluctuating precipitation patterns during the growing season. This may be true on shallow soils, where the available water depends largely on recent rainfall [99,104]. Such warm and dry forest sites, mostly with calcareous and rendzic soils, are very often occupied by Acer and Sorbus species [34].
Our findings are in accordance with experiments that have documented the ability of Fagus sylvatica to regain high values of Amax and gs with rewetting following drought [54,105]. In our study, F. sylvatica recovered quickly within three days following drought. Contradictory results have been observed previously in a comparative study with Quercus petraea and F. sylvatica [99]. However, in that study, the physiological variables were measured only one day after rewetting, which might be too short for F. sylvatica to recover fully. Unfortunately, physiological and growth performance of seedlings during repeated droughts has been studied in few experiments only and thus it is difficult to compare our results for the investigated species with those of other studies.
4.3. Are There Different Mechanisms that Enable Seedlings of Minor Tree Species to Withstand Droughts?
On the basis of this experiment, different strategies of the investigated tree species to cope with drought stress are discernible. The maintenance of high values for E and gs even under intensifying drought stress, followed by a breakdown of Amax, E, and gs under severe drought conditions in Sorbus torminalis (Table 4), suggests anisohydric behavior [21,106]. The low values of Amax with increasing drought conditions (Figure 3), and the early onset of leaf wilting and abscission also fit into this strategy.
Although species that maintain stomatal opening under drought conditions bear a high risk of damage or death by cavitation, they are expected to be more tolerant to prolonged drought of intermediate intensity, because the risk of carbon starvation is reduced [21,107]. The maintenance of stomatal conductance, which is characteristic of an anisohydric behavior, is often found in deep-rooted species like tuart gum (Eucalyptus gomphocephala DC.) or northern red oak (Quercus rubra L.), which may maintain water access for longer periods following the onset of drought conditions [108,109,110]. As deep roots are thought to be a key factor for plants to survive droughts [85,111], this adaptation could not be expressed in the potted seedlings of this experiment, and thus the attribution of strategies to cope with drought and the comparisons between species has to be viewed with caution. In nature, the vast majority of regeneration of the two Sorbus species consists of root sprouts, which would be supported by the mother trees that have a deep root system [112]. Whether this would aid the maintenance of transpiration or just prevent carbon starvation by lateral transport of assimilates has, to our knowledge, not been researched.
In contrast to the anisohydric behaviour of Sorbus torminalis, growth and physiology of Acer platanoides is representative of an isohydric behavior. This is indicated by high water-use efficiency (Figure 3) and a constant reduction in gs as drought conditions become more severe. On the one hand, this response to drought reduces the risk of hydraulic failure through cavitation [21]. On the other hand, mortality of isohydric species through carbon starvation is more likely during prolonged droughts of intermediate intensity [21]. Obviously, the drought periods in our experiment were not long enough to induce carbon starvation in the Acer species.
Species with isohydric or anisohydric behavior might have different preferences or realized niches with regard to soil water availability. However, co-occurrences of Acer campestre, A. platanoides, Sorbus torminalis, and S. domestica within one forest stand are not uncommon [34]. Whether or not these different strategies of water use under drought conditions might be a mechanism of complementary resource use that leads to an overall higher resistance and resilience of the whole tree community in relation to drought stress (e.g., [113]) is not known.
Not all plants can be clearly classified into those with anisohydric or isohydric behavior, however. Instead, the physiological behavior of plants should be seen as a continuum between these discrete categories [47]. There are exceptions to these extreme expressions of anisohydric or isohydric behavior, and some species take an intermediate position [21]. Classifications according to physiological properties alone are difficult, especially when pronounced changes in Amax [17,114] or gs [115] between seedlings and adult trees are not uncommon. Even between species of the same genus, obvious differences in drought avoidance strategies exist. In our study, the response of transpiration and stomatal conductance to drought in Sorbus domestica might indicate an isohydric strategy (Figure 3), whereas the rapid breakdown of leaf gas exchange under conditions of severe water shortage of S. torminalis could be indicative of an anisohydric strategy. To classify species according to these different water-spending or water-saving behaviors during drought, it is necessary to monitor their physiological processes over extended drought periods and in situations where their morphological adaptations such as the development of a deep root system are not restricted. Hence, our greenhouse experiment with potted seedlings can provide only a first indication. For the short drought cycles that seedlings experienced in the drying-rewetting cycles of this trial, the indices of drought resistance and recovery appear to be more appropriate. In addition, drought cycles of different lengths are important to assess the relative success of the different mechanisms to cope with drought under different conditions.
4.4. How Suitable Are Pot Experiments to Extrapolate and Transfer Results to the Field?
Although pot experiments cannot replicate the processes in a natural setting, they are frequently used for comparative plant physiological studies under controlled conditions [69,116]. Such studies might be particularly helpful to improve our understanding of highly understudied species like Sorbus torminalis or S. domestica.
Based on a widespread evaluation of pot experiments, a number of recommendations to improve transferability of the experimental results to field conditions have been provided [58]. An adequate adjustment period before starting the experiment, the use of natural soils in contrast to standard potting mix, and a sufficient pot size were identified as crucial factors [58]. The ratio of the total plant biomass to rooting volume (BVR) has been suggested as an index to assess the adequacy of pot sizes [117], where BVR ratios less than 2 indicate that pots are of sufficient size [118]. In this experiment, all species except for S. torminalis had mean BVR values of less than 2 at the end of the experiment (Table S4). The higher values of S. torminalis seedlings can be explained by higher biomass at the onset of the experiment. The high initial biomass of this species might also explain its low resistance to drought. However, we tested for potential effects of initial plant biomass on physiological performance and growth under drought stress. Since there were no effects of initial plant biomass within and between species, differences in physiology and biomass increment are explained by species and/or treatments. Apart from this, all further recommendations by [58] had been followed in our experiment.
The validity and relevance of results might have been enhanced through an extension of the experiment beyond one vegetation period. Then, long-term effects like delayed changes in biomass increment and partitioning, carbon allocation or resprouting could have been observed. Also, only one provenance has been studied here, whereby effects like plasticity, adaptation or niche segmentation are mostly neglected. However, our results provide first indications of contrasting mechanisms in the seedlings of different species to withstand drought.
5. Conclusions
Since drought is a major source of tree seedling mortality [85], young plants need to survive this critical life stage by gradually gaining more carbon, more biomass and deeper roots [20]. Here, seedlings of Acer campestre and A. platanoides appeared to be particularly drought-resistant because they increased biomass, root growth and root-to-shoot ratios under conditions of water shortage. Even under a severe lack of water, A. campestre showed only little decrease in its physiological performance. In contrast, seedlings of the Sorbus species, which are rather uncommon in nature, where most regeneration is through root sprouts [119], were less resistant to drought but recovered more quickly from it. As vegetative regeneration of S. torminalis is more common on extreme sites [120], sprouts might be more drought-tolerant as they can resort to the rooting system of the mother tree, which should be an advantage compared to seedlings.
The diverse strategies to cope with drought exhibited by the different species, which have been indicated by the results from this study, need to be assessed also for mature trees. The varying response patterns to drought indicate that different minor broadleaved species may be suitable for several types of drought conditions and thus different sites, characterized by contrasting soil and climatic conditions. Whereas the two Sorbus species may be more suitable for sites with frequently recurring, less intense drought stress, where the ability to recover quickly from this stress offers competitive advantages, the two Acer species may be better adapted to sites with chronic, severe drought stress. However, as the minor tree species often occur together in forest communities, contrasting strategies of water consumption may also be a suitable approach to facilitate co-existence.
Our findings show that the minor broadleaved tree species have the potential to enrich forests on drought-prone sites. Particularly, seedlings of Acer campestre and A. platanoides are at least as drought tolerant as young plants of Quercus petraea, and should therefore be more often considered by forest managers as mixed species on these sites.
Supplementary Materials
The following are available online at http://www.mdpi.com/1999-4907/7/10/239/s1. Figure S1: Mean values of soil volumetric water content (VWC) at different points in time of the experiment for plants of the control, the drying/rewetting, and the dry treatment group, Table S1: Means and standard deviation (±SD) of shoot length, root length, fresh plant mass, and plant age at the beginning of the experiment, Table S2: Means and standard deviation (±SD) of specific leaf area (SLA), and relative water content of the leaves of the control, drying/rewetting (d/rw), and dry treatment groups at the end of the experiment, Table S3: Rates for shoot dieback and leaf senescence in seedlings of the drying/rewetting (d/rw), and dry treatments at the end of the experiment; no leaf senescence and shoot dieback occurred in the controls, Table S4: Means and standard deviation (±SD) of the total plant biomass to rooting volume ratio (BVR).
Acknowledgments
Jörg Kunz received a Ph.D. scholarship of the Landesgraduiertenförderung Baden-Württemberg (LGFG) and further support through the Graduate School “Environment, Society and Global Change” at the Albert-Ludwigs-University Freiburg. This work received additional financial supported through the Georg-Ludwig-Hartig Foundation. We are grateful for access granted to the greenhouse facilities of the Chair of Botany, Albert-Ludwigs-University Freiburg by Siegfried Fink and thank Karl Merz and his co-workers for maintaining the pot experiment. Thanks to Benedikt Speicher for age determination of the seedlings and to Peggy Heide for leaf area measurements. We wish to thank Helmer Schack-Kirchner and Christina Petschke at the Chair of Soil Ecology, Albert-Ludwigs-University Freiburg for developing the soil pF-curves. Many thanks to Hans Stark, head of the forest department of the University of Würzburg in Sailershausen, and the forest nursery J. H. Diercks for technical support. We would like to thank Florian Hartig of the Department of Biometry and Environmental System Analysis, Albert-Ludwigs-University Freiburg for the validation of the statistical approaches.
Author Contributions
J.K., and J.B. designed the study. J.K. established the experiment, guided the data collection, run the data analyses, and wrote the manuscript. A.R. collected and processed the field data. J.B. supervised the research project, discussed important tasks of establishment of the experiment, data collection and data analyses, and wrote the manuscript.
Conflicts of Interest
The authors declare no conflict of interest. The founding sponsors had no role in the design of the study; in the collection, analyses, or interpretation of data; in the writing of the manuscript, and in the decision to publish the results.
Abbreviations
The following abbreviations are used in this manuscript:
| Amax | Maximum photosynthetic rate |
| E | Transpiration rate |
| ELL | Daily leaf-level transpiration |
| gs | Stomatal conductance to water vapor |
| WUE | Water use efficiency |
| WUEi | Intrinsic water use efficiency |
| SLA | Specific leaf area |
| r/s ratio | Root-to-shoot ratio |
| Rtc | Index of resistance in relation to control |
| Rtp | Index of resistance in relation to pre-drought conditions |
| Rc | Index of recovery |
| VWC | Soil volumetric water content |
| AWC | Available water content |
| BVR | Total plant biomass to rooting volume ratio |
References
- IPCC. Climate Change 2013. The Physical Science Basis Working Group I Contribution to the Fifth Assessment Report of the Intergovernmental Panel on Climate Change; Cambridge University Press: Cambridge, UK, 2013. [Google Scholar]
- Bréda, N.; Huc, R.; Granier, A.; Dreyer, E. Temperate forest trees and stands under severe drought: A review of ecophysiological responses, adaptation processes and long-term consequences. Ann. For. Sci. 2006, 63, 625–644. [Google Scholar] [CrossRef]
- Ciais, P.; Reichstein, M.; Viovy, N.; Granier, A.; Ogé, J.; Allard, V.; Aubinet, M.; Buchmann, N.; Bernhofer, C.; Carrara, A.; et al. Europe-wide reduction in primary productivity caused by the heat and drought in 2003. Nature 2005, 437, 529–533. [Google Scholar]
- Beniston, M. The 2003 heat wave in Europe: A shape of things to come? An analysis based on Swiss climatological data and model simulations. Geophys. Res. Lett. 2004, 31, 2022–2026. [Google Scholar]
- Mayer, H.; Holst, T.; Brugger, U.; Kirchgässner, A. Trends der forstlich relevanten Klimavariablen Lufttemperatur und Niederschlag im Südwesten Deutschlands von 1950 bis 2000. Allg. Forst Jagdztg 2005, 176, 45–56. [Google Scholar]
- Schär, C.; Vidale, P.L.; Lüthi, D.; Frei, C.; Häberli, C.; Liniger, M.A.; Appenzeller, C. The role of increasing temperature variability in European summer heatwaves. Nature 2004, 427, 332–336. [Google Scholar] [CrossRef] [PubMed]
- Spiecker, H. Silvicultural management in maintaining biodiversity and resistance of forests in Europe-temperate zone. J. Environ. Manag. 2003, 67, 55–65. [Google Scholar] [CrossRef]
- Zang, C.; Rothe, A.; Weis, W.; Pretzsch, H. Zur Baumarteneignung bei Klimawandel: Ableitung der Trockenstressanfälligkeit wichtiger Waldbaumarten aus Jahrringbreiten. Allg. Forst Jagdztg 2011, 182, 98–112. [Google Scholar]
- Bouriaud, O.; Popa, I. Comparative dendroclimatic study of Scots pine, Norway spruce, and silver fir in the Vrancea Range, Eastern Carpathian Mountains. Trees 2009, 23, 95–106. [Google Scholar] [CrossRef]
- Eilmann, B.; Weber, P.; Rigling, A.; Eckstein, D. Growth reactions of Pinus sylvestris L. and Quercus pubescens Willd. To drought years at a xeric site in Valais, Switzerland. Dendrochronologia 2006, 23, 121–132. [Google Scholar]
- Ammer, C.; Albrecht, L.; Borchert, H.; Brosinger, F.; Dittmar, C.; Elling, W.; Ewald, J.; Felbermeier, B.; von Gilsa, H.; Huss, J.; et al. Zur Zukunft der Buche (Fagus sylvatica L.) in Mitteleuropa. Allg. Forst Jagdztg 2005, 176, 60–67. [Google Scholar]
- Friedrichs, D.A.; Büntgen, U.; Frank, D.C.; Esper, J.; Neuwirth, B.; Löffler, J. Complex climate controls on 20th century oak growth in Central-West Germany. Tree Physiol. 2009, 29, 39–51. [Google Scholar] [CrossRef] [PubMed]
- Rennenberg, H.; Seiler, W.; Matyssek, R.; Geßler, A.; Kreuzwieser, J. Die Buche (Fagus sylvatica L.)—Ein Waldbaum ohne Zukunft im südlichen Mitteleuropa? Allg. Forst Jagdztg 2004, 175, 210–224. [Google Scholar]
- Hanewinkel, M.; Cullmann, D.A.; Schelhaas, M.-J.; Nabuurs, G.-J.; Zimmermann, N.E. Climate change may cause severe loss in the economic value of European forest land. Nat. Clim. Chang. 2013, 3, 203–207. [Google Scholar] [CrossRef]
- Hemery, G.E.; Clark, J.R.; Aldinger, E.; Claessens, H.; Malvolti, M.E.; O’Connor, E.; Raftoyannis, Y.; Savill, P.S.; Brus, R. Growing scattered broadleaved tree species in Europe in a changing climate: A review of risks and opportunities. Forestry 2010, 83, 65–81. [Google Scholar] [CrossRef]
- Reif, A.; Brucker, U.; Kratzer, R.; Schmiedinger, A.; Bauhus, J. Waldbau und Baumartenwahl in Zeiten des Klimawandels aus Sicht des Naturschutzes; Bundesamt für Naturschutz: Bonn, Germany, 2010. [Google Scholar]
- Bond, B.J. Age-related changes in photosynthesis of woody plants. Trends Plant Sci. 2000, 5, 349–353. [Google Scholar] [CrossRef]
- Brix, H. Effects of plant water stress on photosynthesis and survival of four conifers. Can. J. For. Res. 1979, 9, 160–165. [Google Scholar] [CrossRef]
- Dawson, T.E. Determining water use by trees and forests from isotopic, energy balance and transpiration analyses: The roles of tree size and hydraulic lift. Tree Physiol. 1996, 16, 263–272. [Google Scholar] [CrossRef] [PubMed]
- Donovan, L.A.; Ehleringer, J.R. Contrasting water-use patterns among size and life-history classes of a semi-arid shrub. Funct. Ecol. 1992, 6, 482–488. [Google Scholar] [CrossRef]
- McDowell, N.; Pockman, W.T.; Allen, C.D.; Breshears, D.D.; Cobb, N.; Kolb, T.; Plaut, J.; Sperry, J.; West, A.; Williams, D.G.; et al. Mechanisms of plant survival and mortality during drought: Why do some plants survive while others succumb to drought? New Phytol. 2008, 178, 719–739. [Google Scholar] [CrossRef] [PubMed]
- Newton, M.; Preest, D.S. Growth and Water Relations of Douglas Fir (Pseudotsuga menziesii) Seedlings under Different Weed Control Regimes. Weed Sci. 1998, 36, 653–662. [Google Scholar]
- Bolte, A.; Ammer, C.; Löf, M.; Madsen, P.; Nabuurs, G.-J.; Schall, P.; Spathelf, P.; Rock, J. Adaptive forest management in central Europe: Climate change impacts, strategies and integrative concept. Scand. J. For. Res. 2009, 24, 473–482. [Google Scholar] [CrossRef]
- Choat, B.; Jansen, S.; Brodribb, T.J.; Cochard, H.; Delzon, S.; Bhaskar, R.; Bucci, S.J.; Feild, T.S.; Gleason, S.M.; Hacke, U.G.; et al. Global convergence in the vulnerability of forests to drought. Nature 2012, 491, 752–755. [Google Scholar] [CrossRef] [PubMed]
- Fonti, P.; Cherubini, P.; Rigling, A.; Weber, P.; Biging, G. Tree rings show competition dynamics in abandoned Castanea sativa coppices after land-use changes. J. Veg. Sci. 2006, 17, 103–112. [Google Scholar] [CrossRef]
- Archaux, F.; Wolters, V. Impact of summer drought on forest biodiversity: What do we know? Ann. For. Sci. 2006, 63, 645–652. [Google Scholar] [CrossRef]
- Saxe, H.; Cannell, M.G.R.; Johnsen, Ø.; Ryan, M.G.; Vourlitis, G. Tree and forest functioning in response to global warming. New Phytol. 2001, 149, 369–400. [Google Scholar] [CrossRef]
- Brang, P.; Bugmann, H.; Bürgi, A.; Mühlethaler, U.; Rigling, A.; Schwitter, R. Klimawandel als waldbauliche Herausforderung. Schweiz Z Forstwes 2008, 159, 362–373. [Google Scholar] [CrossRef]
- Grundmann, B.M.; Roloff, A. Use of Forest Tree Species under Climate Change. In Crop Plant Resistance to Biotic and Abiotic Factors; Feldmann, F., Alford, D.F., Furk, C., Eds.; Deutsche Phytomedizinische Gesellschaft: Braunschweig, Germany, 2009; pp. 53–65. [Google Scholar]
- Eriksson, G. Conservation of noble hardwoods in Europe. Can. J. For. Res. 2001, 31, 577–587. [Google Scholar] [CrossRef]
- Schrötter, H. Vogelkirsche, Spitzahorn und Elsbeere: Drei wertvolle Baumarten in Mecklenburg-Vorpommern im Abseits. Forst Holz 2001, 56, 188–196. [Google Scholar]
- Ellenberg, H.; Leuschner, C. Vegetation Mitteleuropas mit den Alpen: In Ökologischer, Dynamischer und Historischer Sicht, 6th ed.; Ulmer: Stuttgart, Germany, 2010. [Google Scholar]
- Ebert, H.P. Die Behandlung von Häufig Vorkommenden Baumarten (Hauptbaumarten), 4th ed.; Hochschule für Forstwirtschaft: Rottenburg am Neckar, Germany, 2006. [Google Scholar]
- Härdtle, W.; Ewald, J.; Hölzel, N. Wälder des Tieflandes und der Mittelgebirge; Ulmer: Stuttgart, Germany, 2004. [Google Scholar]
- Pirc, H. Ahorne; Verlag Eugen Ulmer: Stuttgart, Germany, 1994. [Google Scholar]
- Sebald, O.; Seybold, S.; Phillipi, G.; Demuth, S.; Kappus, A.; Voggesberger, M.; Wörz, A. Die Farn- und Blütenpflanzen Baden-Württembergs. Band 4: Spezieller Teil (Spermatophyta, Unterklasse Rosidae), Haloragaceae bis Apiaceae; Verlag Eugen Ulmer: Stuttgart, Germany, 1992. [Google Scholar]
- Sachse, U. Die Anthropogene Ausbreitung von Berg- und Spitzahorn (Acer pseudoplatanus L. und Acer platanoides L.). Ökologische Voraussetzungen am Beispiel Berlin; Technische Universität: Berlin, Germany, 1989. [Google Scholar]
- Hochbichler, E. Die Elsbeere (Sorbus torminalis CRANTZ) im Weinviertel (Niederösterreich). Forst Holz 2003, 58, 647–653. [Google Scholar]
- Paganová, V. Ecological requirements of wild service tree (Sorbus torminalis [L.] CRANTZ) and service tree (Sorbus domestica L.) in relation with their utilization in forestry and landscape. J. For. Sci. 2008, 54, 216–226. [Google Scholar]
- Brütsch, U.; Rotach, P. Der Speierling (Sorbus domestica L.) in der Schweiz: Verbreitung, Ökologie, Standortsansprüche, Konkurrenzkraft und waldbauliche Eignung. Schweiz Z Forstwes 1993, 144, 967–991. [Google Scholar]
- Asthalter, K. Ursachen und standörtliches Vorkommen periodischer Trocknisschäden und mögliche Folgerungen für die Baumartenwahl. AFZ 1980, 35, 510–512. [Google Scholar]
- Jurek, J.; Weihs, U. Der Spitzahorn im Stadtwald Northeim. Kleinstandörtliches Vorkommen und Wachstum. Forst Holz 1998, 53, 15–18. [Google Scholar]
- Kölling, C. Klimahüllen für 27 Waldbaumarten. AFZ-DerWald 2007, 62, 1242–1245. [Google Scholar]
- Rasmussen, K.K.; Kollmann, J. Defining the habitat niche of Sorbus torminalis from phytosociological relevés along a latitudinal gradient. Phytocoenologia 2004, 34, 639–662. [Google Scholar] [CrossRef]
- Levitt, J. Responses of Plants to Environmental Stresses. Volume II: Water, Radiation, Salt and Other Stresses, 2nd ed.; Academic Press: New York, NY, USA; London, UK, 1980. [Google Scholar]
- Tardieu, F. Will increases in our understanding of soil-root relations and root signalling substantially alter water flux models? Philos. Trans R. Soc. B 1993, 341, 57–66. [Google Scholar] [CrossRef]
- Klein, T. The variability of stomatal sensitivity to leaf water potential across tree species indicates a continuum between isohydric and anisohydric behaviours. Funct. Ecol. 2014, 28, 1313–1320. [Google Scholar] [CrossRef]
- Lloret, F.; Keeling, E.G.; Sala, A. Components of tree resilience: Effects of successive low-growth episodes in old ponderosa pine forests. Oikos 2011, 120, 1909–1920. [Google Scholar] [CrossRef]
- Flexas, J.; Bota, J.; Galmés, J.; Medrano, H.; Ribas-Carbó, M. Keeping a positive carbon balance under adverse conditions: Responses of photosynthesis and respiration to water stress. Physiol. Plant. 2006, 127, 343–352. [Google Scholar] [CrossRef]
- Taylor, G.J. Maximum potential growth rate and allocation of respiratory energy as related to stress tolerance in plants. Plant Physiol. Biochem. 1989, 27, 605–611. [Google Scholar]
- Thompson, I.; Mackey, B.; McNulty, S.; Mosseler, A. Forest Resilience, Biodiversity, and Climate Change. A Synthesis of the Biodiversity/Resilience/Stability Relationship in Forest Ecosystems; Secretariat of the Convention on Biological Diversity: Montreal, QC, Canada, 2009. [Google Scholar]
- Backes, K.; Leuschner, C. Leaf water relations of competitive Fagus sylvatica and Quercus petraea trees during 4 years differing in soil drought. Can. J. For. Res. 2000, 30, 335–346. [Google Scholar] [CrossRef]
- Fotelli, M.N.; Geßler, A.; Peuke, A.D.; Rennenberg, H. Drought affects the competitive interactions between Fagus sylvatica seedlings and an early successional species, Rubus fruticosus: Responses of growth, water status and δ 13C composition. New Phytol. 2001, 151, 427–435. [Google Scholar] [CrossRef]
- Sánchez-Gómez, D.; Robson, T.M.; Gascó, A.; Gil-Pelegrín, E.; Aranda, I. Differences in the leaf functional traits of six beech (Fagus sylvatica L.) populations are reflected in their response to water limitation. Environ. Exp. Bot. 2013, 87, 110–119. [Google Scholar]
- Rotach, P. Noble Hardwoods in Switzerland. In Noble Hardwoods Network, Proceedings of the Report of the First Meeting, Escherode, Germany, 24–27 March 1996; Turok, J., Eriksson, G., Kleinschmit, J., Canger, S., Eds.; International Plant Genetic Resources Institute: Rome, Italy, 1996; pp. 91–100. [Google Scholar]
- Negash, L. Rapid seed-based propagation method for the threatened African cherry (Prunus africana). New For. 2004, 27, 215–227. [Google Scholar] [CrossRef]
- Hommel, R.; Siegwolf, R.; Saurer, M.; Farquhar, G.D.; Kayler, Z.; Ferrio, J.P.; Gessler, A. Drought response of mesophyll conductance in forest understory species—Impacts on water-use efficiency and interactions with leaf water movement. Physiol. Plant 2014, 152, 98–114. [Google Scholar] [CrossRef] [PubMed]
- Kawaletz, H.; Mölder, I.; Annighöfer, P.; Terwei, A.; Zerbe, S.; Ammer, C. Pot experiments with woody species—A review. Forestry 2014, 87, 482–491. [Google Scholar] [CrossRef]
- Percival, G.C.; Sheriffs, C.N. Identification of Drought-Tolerant Woody Perennials Using Chlorophyll Fluorescence. J. Arboric. 2002, 28, 215–223. [Google Scholar]
- Scholander, P.F.; Hammel, H.T.; Bradstreet, E.D.; Hemmingsen, E.A. Sap Pressure in Vascular Plants. Science 1965, 148, 339–346. [Google Scholar] [CrossRef] [PubMed]
- Slatyer, R.O. Plant-Water Relationships; Academic Press: London, UK; New York, NY, USA, 1967. [Google Scholar]
- Fernandez, R.T.; Perry, R.L.; Flore, J.A. Drought Response of Young Apple Trees on Three Rootstocks. II. Gas Exchange, Chlorophyll Fluorescence, Water Relations, and Leaf Abscisic Acid. J. Am. Soc. Hortic. Sci. 1997, 122, 841–848. [Google Scholar]
- Tyree, M.T.; Zimmermann, M.H. Xylem Structure and the Ascent of Sap, 2nd ed.; Springer: Berlin/Heidelberg, Germany; New York, NY, USA, 2002. [Google Scholar]
- Bittner, S.; Talkner, U.; Krämer, I.; Beese, F.; Hölscher, D.; Priesack, E. Modeling stand water budgets of mixed temperate broad-leaved forest stands by considering variations in species specific drought response. Agric. For. Meteorol. 2010, 150, 1347–1357. [Google Scholar] [CrossRef]
- Hartge, K.H.; Horn, R. Die Physikalische Untersuchung von Böden, 4th ed.; E. Schweizerbart’sche Verlagsbuchhandlung: Stuttgart, Germany, 2009. [Google Scholar]
- Scheffer, F.; Schachtschabel, P. Lehrbuch der Bodenkunde, 15th ed.; Spektrum Akademischer Verlag: Heidelberg, Germany, 2002. [Google Scholar]
- Irvine, J.; Perks, M.P.; Magnani, F.; Grace, J. The response of Pinus sylvestris to drought: Stomatal control of transpiration and hydraulic conductance. Tree Physiol. 1998, 18, 393–402. [Google Scholar] [CrossRef] [PubMed]
- Leuzinger, S.; Körner, C. Water savings in mature deciduous forest trees under elevated CO2. Glob. Chang. Biol. 2007, 13, 2498–2508. [Google Scholar] [CrossRef]
- Kruger, E.L.; Reich, P.B. Coppicing affects growth, root:shoot relations and ecophysiology of potted Quercus rubra seedlings. Physiol. Plant. 1993, 89, 751–760. [Google Scholar] [CrossRef]
- Chen, H.Y.H. Interspecific responses of planted seedlings to light availability in interior British Columbia: Survival, growth, allometric patterns, and specific leaf area. Can. J. For. Res. 1997, 27, 1383–1393. [Google Scholar] [CrossRef]
- Curt, T.; Coll, L.; Prévosto, B.; Balandier, P.; Kunstler, G. Plasticity in growth, biomass allocation and root morphology in beech seedlings as induced by irradiance and herbaceous competition. Ann. For. Sci. 2005, 62, 51–60. [Google Scholar] [CrossRef]
- Evans, G.C. The Quantitative Analysis of Plant Growth; Blackwell Scientific Publications: Oxford, UK, 1972. [Google Scholar]
- Thomas, H.; Stoddart, J.L. Leaf senescence. Annu. Rev. Plant. Phys. 1980, 31, 83–111. [Google Scholar] [CrossRef]
- Gottardini, E.; Cristofori, A.; Cristofolini, F.; Maccherini, S.; Ferretti, F. Ambient levels of nitrogen dioxide (NO2) may reduce pollen viability in Austrian pine (Pinus nigra Arnold) trees—Correlative evidence from a field study. Sci. Total Environ. 2008, 402, 299–305. [Google Scholar] [CrossRef] [PubMed]
- Medrano, H.; Tomás, M.; Martorell, S.; Flexas, J.; Hernández, E.; Rosselló, J.; Pou, A.; Escalona, J.M.; Bota, J. From leaf to whole-plant water use efficiency (WUE) in complex canopies: Limitations of leaf WUE as a selection target. Crop J. 2015, 3, 220–228. [Google Scholar] [CrossRef]
- Ďurkovič, J.; Lengyelová, A.; Čaňová, I.; Kurjak, D.; Hladká, D. Photosynthetic performance and stomatal characteristics during ex vitro acclimatisation of true service tree (Sorbus domestica L.). J. Hortic. Sci. Biotechnol. 2009, 84, 223–227. [Google Scholar] [CrossRef]
- Kloeppel, B.D.; Abrams, M.D. Ecophysiological attributes of the native Acer saccharum and the exotic Acer platanoides in urban oak forests in Pennsylvania, USA. Tree Physiol. 1995, 15, 739–746. [Google Scholar] [CrossRef] [PubMed]
- Pyttel, P.; Kunz, J.; Bauhus, J. Growth, regeneration and shade tolerance of the Wild Service Tree (Sorbus torminalis (L.) Crantz) in aged oak coppice forests. Trees 2013, 27, 1609–1619. [Google Scholar]
- Kazda, M.; Schmid, I.; Klumpp, K. Photosynthetische Leistungsfähigkeit von Fagus sylvatica, Acer pseudoplatanus und Quercus petraea bei unterschiedlichem Lichtangebot. Bield Ökol Beit 1999, 14, 18–26. [Google Scholar]
- Geris, J.; Tetzlaff, D.; Soulsby, C. Resistance and resilience to droughts: Hydropedological controls on catchment storage and run-off response. Hydrol. Process. 2015, 29, 4579–4593. [Google Scholar] [CrossRef]
- Taeger, S.; Sparks, T.H.; Menzel, A. Effects of temperature and drought manipulations on seedlings of Scots pine provenances. Plant Biol. 2015, 17, 361–372. [Google Scholar] [CrossRef] [PubMed]
- Pons, T.L.; Flexas, J.; von Caemmerer, S.; Evans, J.R.; Genty, B.; Ribas-Carbó, M.; Brugnoli, E. Estimating mesophyll conductance to CO2: Methodology, potential errors, and recommendations. J. Exp. Bot. 2009, 60, 2217–2234. [Google Scholar] [CrossRef] [PubMed]
- Cornic, C.; Massacci, A. Leaf Photosynthesis under Drought Stress. In Photosynthesis and the Environment; Baker, N.R., Ed.; Kluwer Academic Publishers: Dordrecht, The Netherlands; Boston, MA, USA; London, UK, 1996; pp. 347–366. [Google Scholar]
- Galle, A.; Florez-Sarasa, I.; El Aououad, H.; Flexas, J. The Mediterranean evergreen Quercus ilex and the semi-deciduous Cistus albidus differ in their leaf gas exchange regulation and acclimation to repeated drought and re-watering cycles. J. Exp. Bot. 2011, 62, 5207–5216. [Google Scholar] [CrossRef] [PubMed]
- Coomes, D.A.; Grubb, P.J. Impacts of root competition in forests and woodlands: A theoretical framework and review of experiments. Ecol. Monogr. 2000, 70, 171–207. [Google Scholar] [CrossRef]
- Kramer, P.J. Water Relations of Plants; Academic Press: New York, NY, USA, 1983. [Google Scholar]
- Williams, A.P.; Allen, C.D.; Macalady, A.K.; Griffin, D.; Woodhouse, C.A.; Meko, D.M.; Swetnam, T.S.; Rauscher, S.A.; Seager, R.; Grissino-Mayer, H.D.; et al. Temperature as a potent driver of regional forest drought stress and tree mortality. Nat. Clim. Chang. 2013, 3, 292–297. [Google Scholar] [CrossRef]
- Fini, A.; Mattii, G.B.; Ferrini, F. Physiological responses to different irrigation regimes for shade trees grown in container. Adv. Hortic. Sci. 2008, 22, 13–20. [Google Scholar]
- Mokany, K.; Raison, R.J.; Prokushkin, A.S. Critical analysis of root:shoot ratios in terrestrial biomes. Glob. Chang. Biol. 2006, 12, 84–96. [Google Scholar] [CrossRef]
- Martínez-Vilalta, J.; Prat, E.; Oliveras, I.; Piñol, J. Xylem hydraulic properties of roots and stems of nine Mediterranean woody species. Oecologia 2002, 133, 19–29. [Google Scholar] [CrossRef] [PubMed]
- Quevedo, L.; Rodrigo, A.; Espelta, J.A. Post-fire resprouting ability of 15 non-dominant shrub and tree species in Mediterranean areas of NE Spain. Ann. For. Sci. 2007, 64, 883–890. [Google Scholar] [CrossRef]
- Jensen, M. Temperature Relations of Germination in Acer platanoides L. Seeds. Scand. J. For. Res. 2001, 16, 404–414. [Google Scholar] [CrossRef]
- Niinemets, Ü. Growth of Young Trees of Acer platanoides and Quercus robur along a Gap-Understory Continuum: Interrelationships between Allometry, Biomass Partitioning, Nitrogen, and Shade Tolerance. Int. J. Plant Sci. 1998, 159, 318–330. [Google Scholar] [CrossRef]
- Fini, A.; Frangi, P.; Amoroso, G.; Piatti, R.; Faoro, M.; Bellasio, C.; Ferrini, F. Effect of controlled inoculation with specific mycorrhizal fungi from the urban environment on growth and physiology of containerized shade tree species growing under different water regimes. Mycorrhiza 2011, 21, 703–719. [Google Scholar] [CrossRef] [PubMed]
- Fini, A.; Ferrini, F.; Frangi, P.; Amoroso, G.; Piatti, R. Withholding Irrigation during the Establishment Phase Affected Growth and Physiology of Norway Maple (Acer platanoides) and Linden (Tilia spp.). Arboric. Urban For. 2009, 35, 241–251. [Google Scholar]
- Nardini, A.; Dimasi, F.; Klepsch, M.; Jansen, S. Ion-mediated enhancement of xylem hydraulic conductivity in four Acer species: Relationships with ecological and anatomical features. Tree Physiol. 2012, 32, 1434–1441. [Google Scholar] [CrossRef] [PubMed]
- Tissier, J.; Lambs, L.; Peltier, J.P.; Marigo, G. Relationships between hydraulic traits and habitat preference for six Acer species occurring in the French Alps. Ann. For. Sci. 2004, 61, 81–86. [Google Scholar] [CrossRef]
- Sperry, J.S.; Hacke, U.G.; Oren, R.; Comstock, J.P. Water deficits and hydraulic limits to leaf water supply. Plant Cell Environ. 2002, 25, 251–263. [Google Scholar] [CrossRef] [PubMed]
- Thomas, F.M. Growth and water relations of four deciduous tree species (Fagus sylvatica L., Quercus petraea [Matt.] Liebl., Q. pubescens Willd., Sorbus aria [L.] Cr.) occuring at Central-European tree-line sites on shallow calcareous soils: Physiological reactions of seedlings to severe drought. Flora 2000, 195, 104–115. [Google Scholar]
- García-Plazaola, J.I.; Becerril, J.M. Effects of drought on photoprotective mechanisms in European beech (Fagus sylvatica L.) seedlings from different provenances. Trees 2000, 14, 485–490. [Google Scholar]
- Mayhead, G.J.; Boothman, I.R. The effect of treeshelter height on the early growth of sessile oak (Quercus petraea (Matt.) Liebl.). Forestry 1997, 70, 151–155. [Google Scholar] [CrossRef]
- Rose, L.; Leuschner, C.; Köckemann, B.; Buschmann, H. Are marginal beech (Fagus sylvatica L.) provenances a source for drought tolerant ecotypes? Eur. J. For. Res. 2009, 128, 335–343. [Google Scholar]
- Mainiero, R.; Kazda, M. Depth-related fine root dynamics of Fagus sylvatica during exceptional drought. For. Ecol. Manag. 2006, 237, 135–142. [Google Scholar] [CrossRef]
- Peterken, G.F.; Mountford, E.P. Effects of drought on beech in Lady Park Wood, an unmanaged mixed deciduous woodland. Forestry 1996, 69, 125–136. [Google Scholar] [CrossRef]
- Tognetti, R.; Johnson, J.D.; Michelozzi, M. The response of European beech (Fagus sylvatica L.) seedlings from two Italian populations to drought and recovery. Trees 1995, 9, 348–354. [Google Scholar]
- Tardieu, F.; Simonneau, T. Variability among species of stomatal control under fluctuating soil water status and evaporative demand: Modelling isohydric and anisohydric behaviours. J. Exp. Bot. 1998, 49, 419–432. [Google Scholar] [CrossRef]
- Pou, A.; Medrano, H.; Tomàs, M.; Martorell, S.; Ribas-Carbó, M.; Flexas, J. Anisohydric behaviour in grapevines results in better performance under moderate water stress and recovery than isohydric behaviour. Plant Soil 2012, 359, 335–349. [Google Scholar] [CrossRef]
- Franks, P.J.; Drake, P.L.; Froend, R.H. Anisohydric but isohydrodynamic: Seasonally constant plant water potential gradient explained by a stomatal control mechanism incorporating variable plant hydraulic conductance. Plant Cell Environ. 2007, 30, 19–30. [Google Scholar] [CrossRef] [PubMed]
- Thomsen, J.E.; Bohrer, G.; Matheny, A.M.; Ivanov, V.Y.; He, L.; Renninger, H.J.; Schäfer, K.V.R. Contrasting Hydraulic Strategies during Dry Soil Conditions in Quercus rubra and Acer rubrum in a Sandy Site in Michigan. Forests 2013, 4, 1106–1120. [Google Scholar] [CrossRef]
- Roman, D.T.; Novick, K.A.; Brzostek, E.R.; Dragoni, D.; Rahman, F.; Phillips, R.P. The role of isohydric and anisohydric species in determining ecosystem-scale response to severe drought. Oecologia 2015, 179, 641–654. [Google Scholar] [CrossRef] [PubMed]
- Canadell, J.; Jackson, R.B.; Ehleringer, J.R.; Mooney, H.A.; Sala, O.E.; Schulze, E.D. Maximum rooting depth of vegetation types at the global scale. Oecologia 1996, 108, 583–595. [Google Scholar] [CrossRef]
- Kutschera, L.; Lichtenegger, E. Wurzelatlas Mitteleuropäischer Waldbäume und Sträucher; Leopold Stocker Verlag: Graz, Austria; Stuttgart, Germany, 2002. [Google Scholar]
- Schwendenmann, L.; Pendall, E.; Sanchez-Bragado, R.; Kunert, N.; Hölscher, D. Tree water uptake in a tropical plantation varying in tree diversity: Interspecific differences, seasonal shifts and complementarity. Ecohydrology 2015, 8, 1–12. [Google Scholar] [CrossRef]
- Thomas, S.C.; Winner, W.E. Photosynthetic differences between saplings and adult trees: An integration of field results by meta-analysis. Tree Physiol. 2002, 22, 117–127. [Google Scholar] [CrossRef] [PubMed]
- Mediavilla, S.; Escudero, A. Stomatal responses to drought of mature trees and seedlings of two co-occurring Mediterranean oaks. For. Ecol. Manag. 2004, 187, 281–294. [Google Scholar] [CrossRef]
- Diamond, J.M. Laboratory, field and natural experiments. Nature 1983, 304, 586–587. [Google Scholar] [CrossRef]
- Kerstiens, G.; Hawes, C.V. Response of growth and carbon allocation to elevated CO2 in young cherry (Prunus avium L.) saplings in relation to root environment. New Phytol. 1994, 128, 607–614. [Google Scholar]
- Poorter, H.; Bühler, J.; van Dusschoten, D.; Climent, J.; Postma, J.A. Pot size matters: A meta-analysis of the effects of rooting volume on plant growth. Funct. Plant Biol. 2012, 39, 839–850. [Google Scholar] [CrossRef]
- Biedenkopf, S.; Ammer, C.; Müller-Strack, G. Genetic aspects of seed harvests for the artificial regeneration of wild service tree (Sorbus torminalis [L.] Crantz). New For. 2007, 33, 1–12. [Google Scholar] [CrossRef]
- Rasmussen, K.K.; Kollmann, J. Poor sexual reproduction on the distribution limit of the rare tree Sorbus torminalis. Acta Oecol. 2004, 25, 211–218. [Google Scholar] [CrossRef]
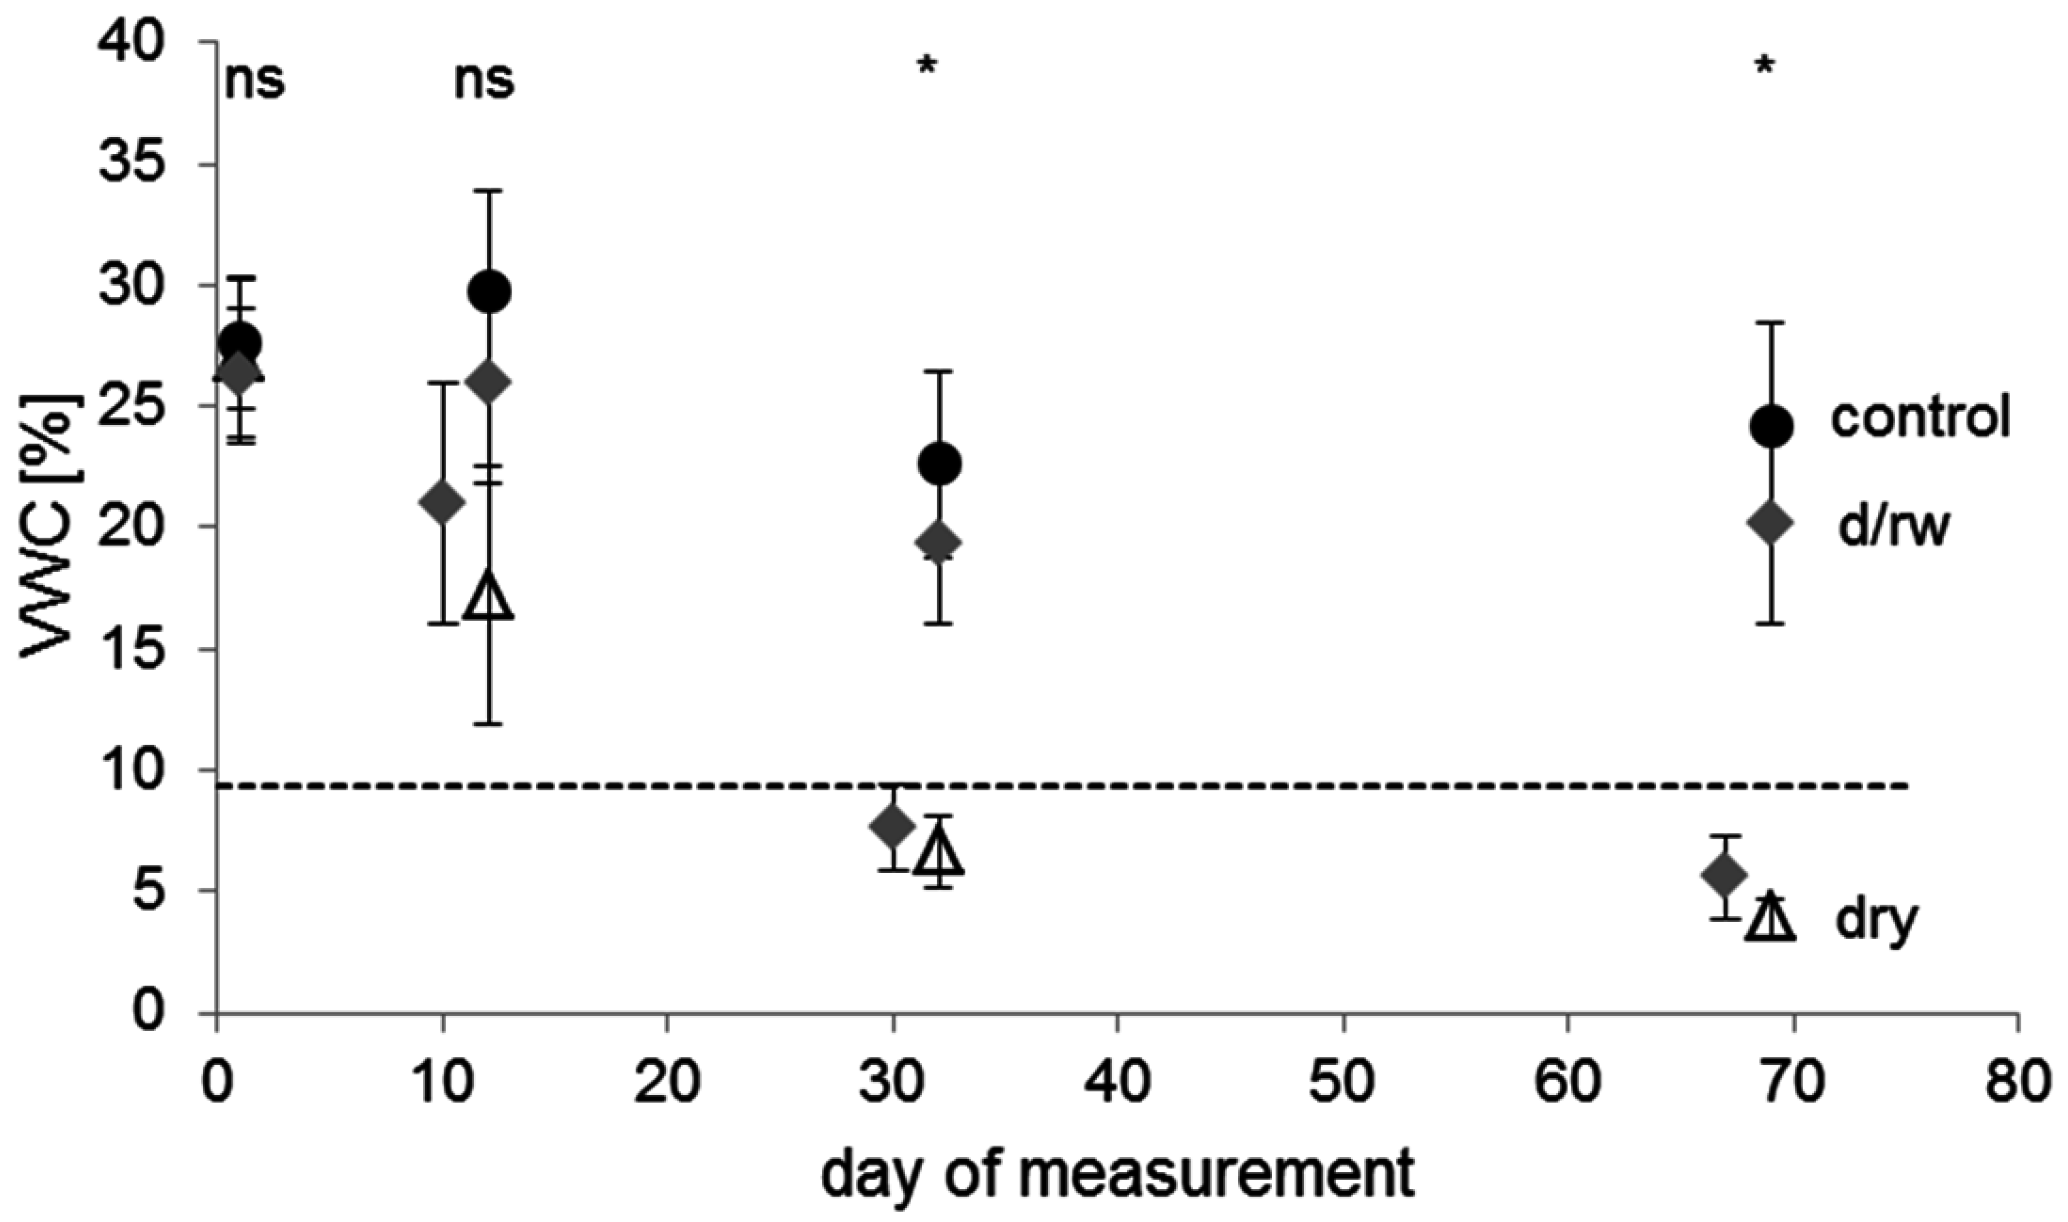
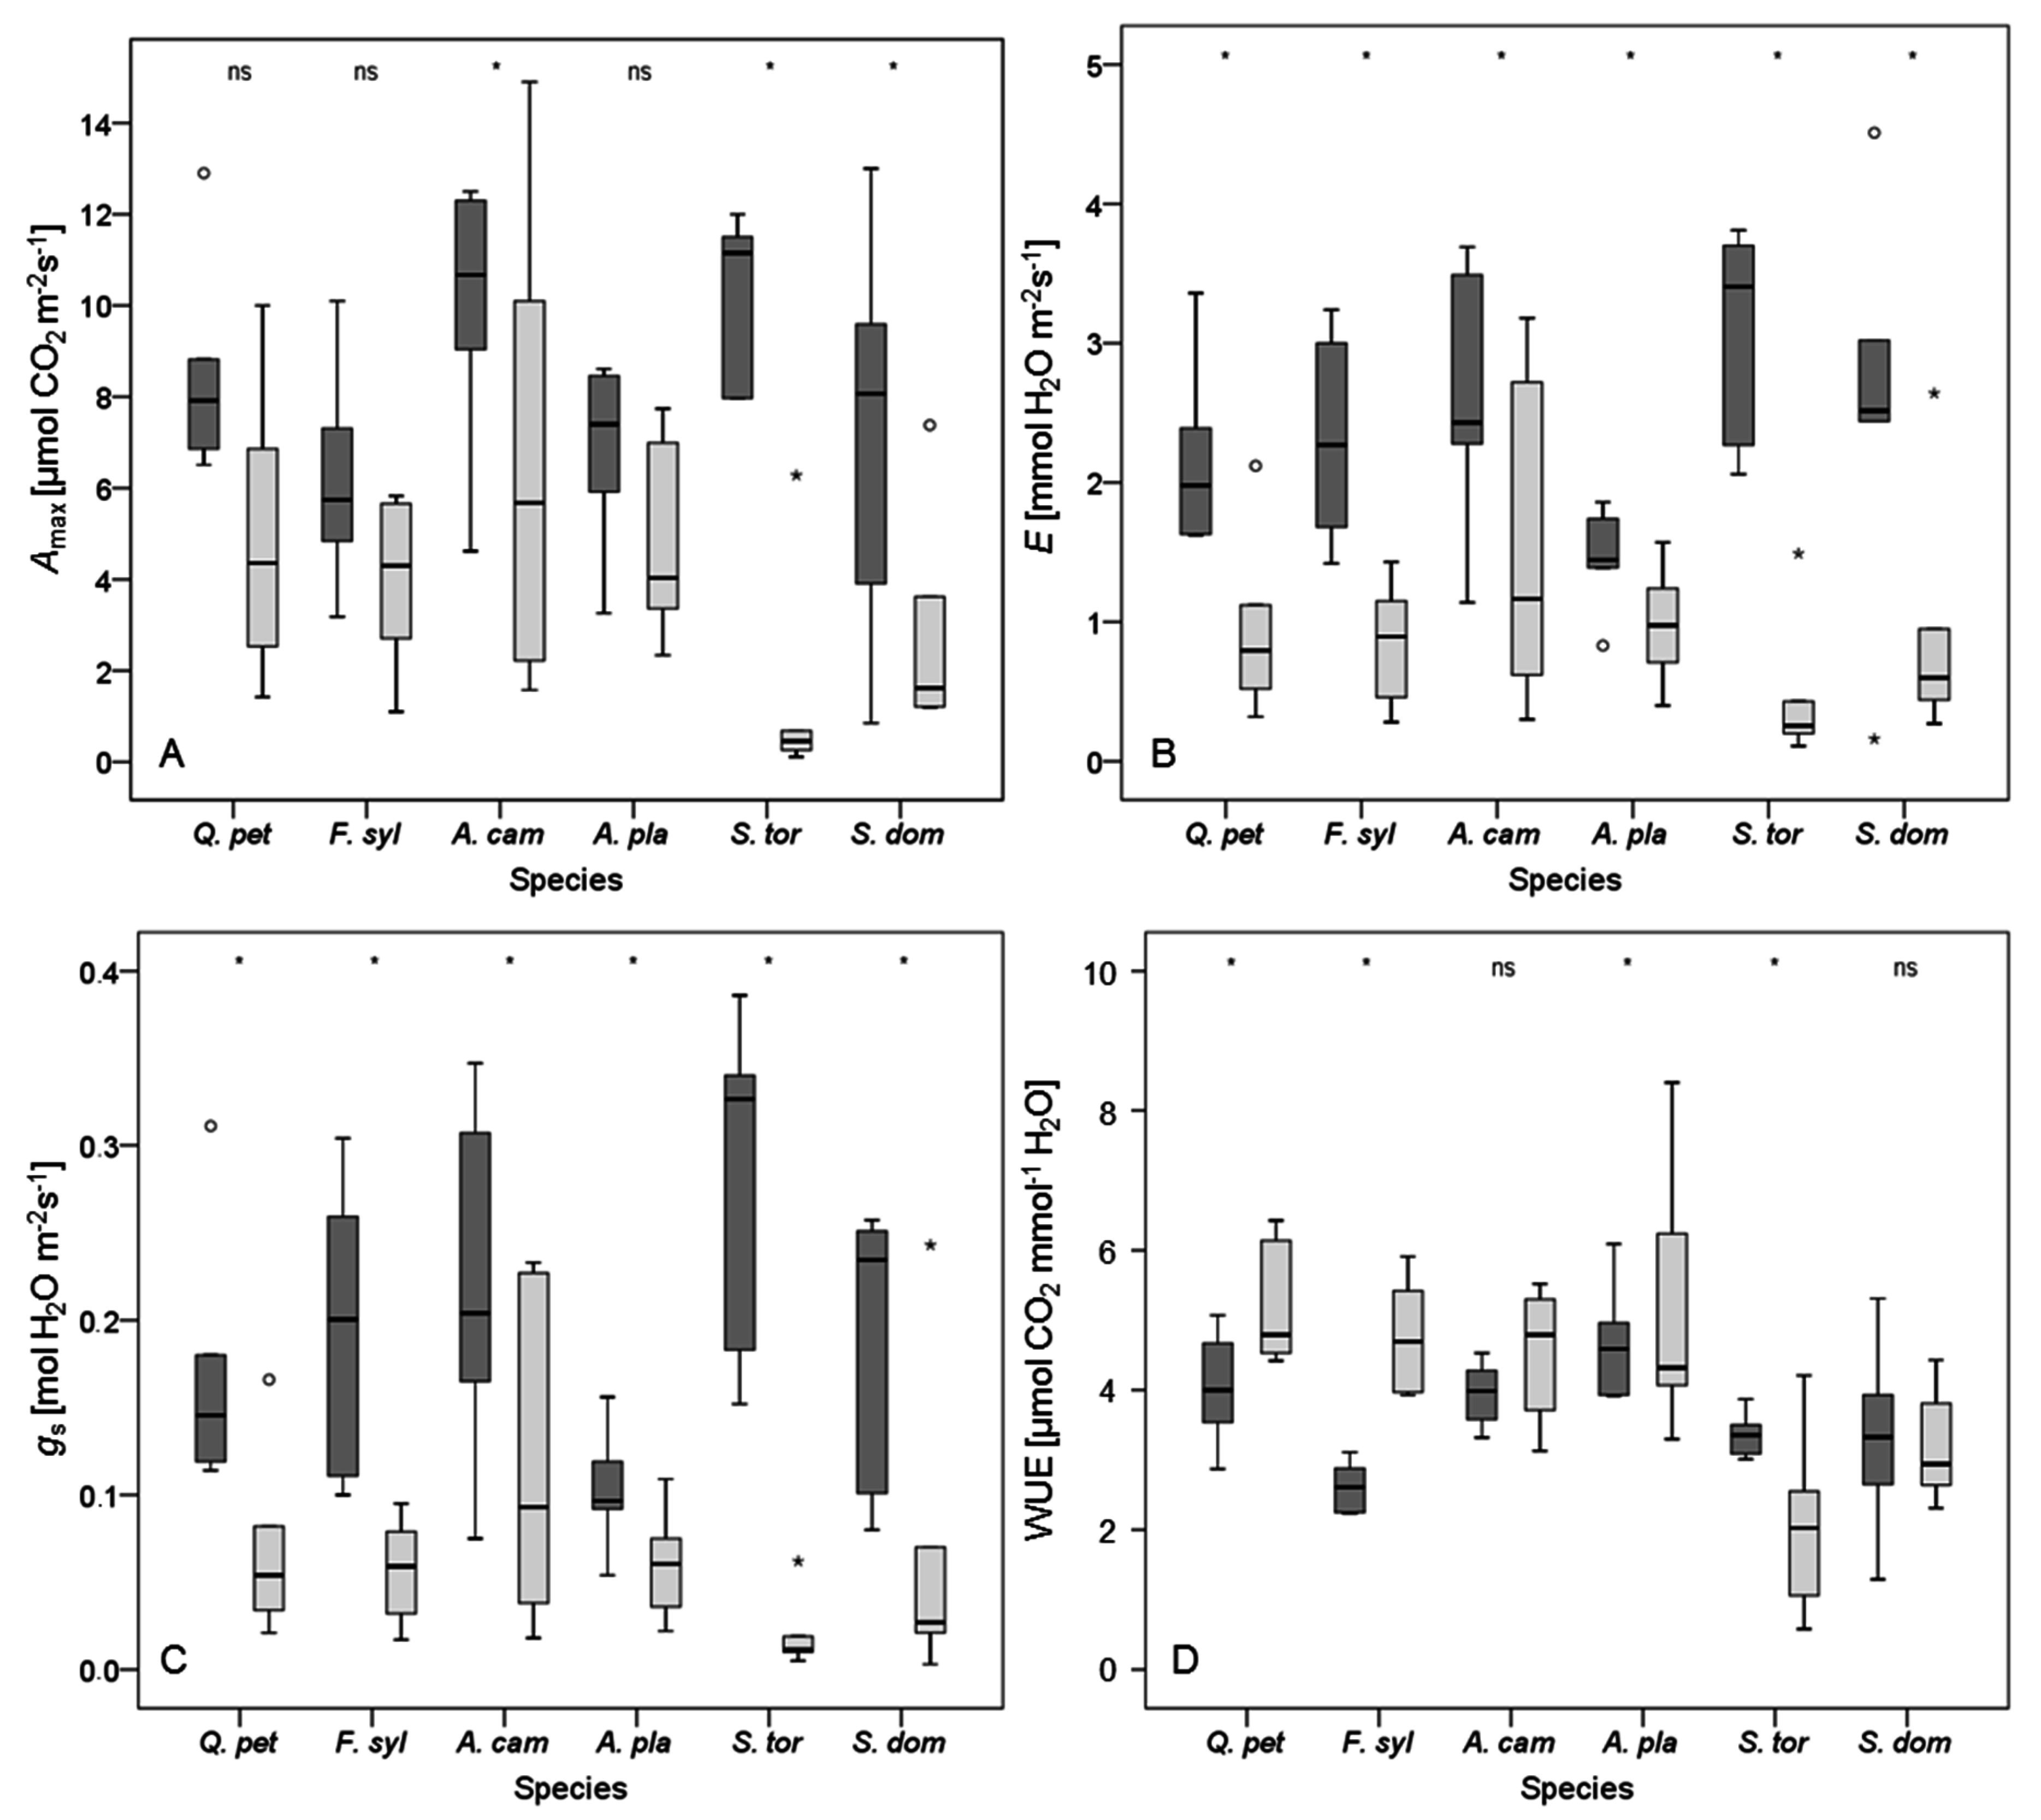
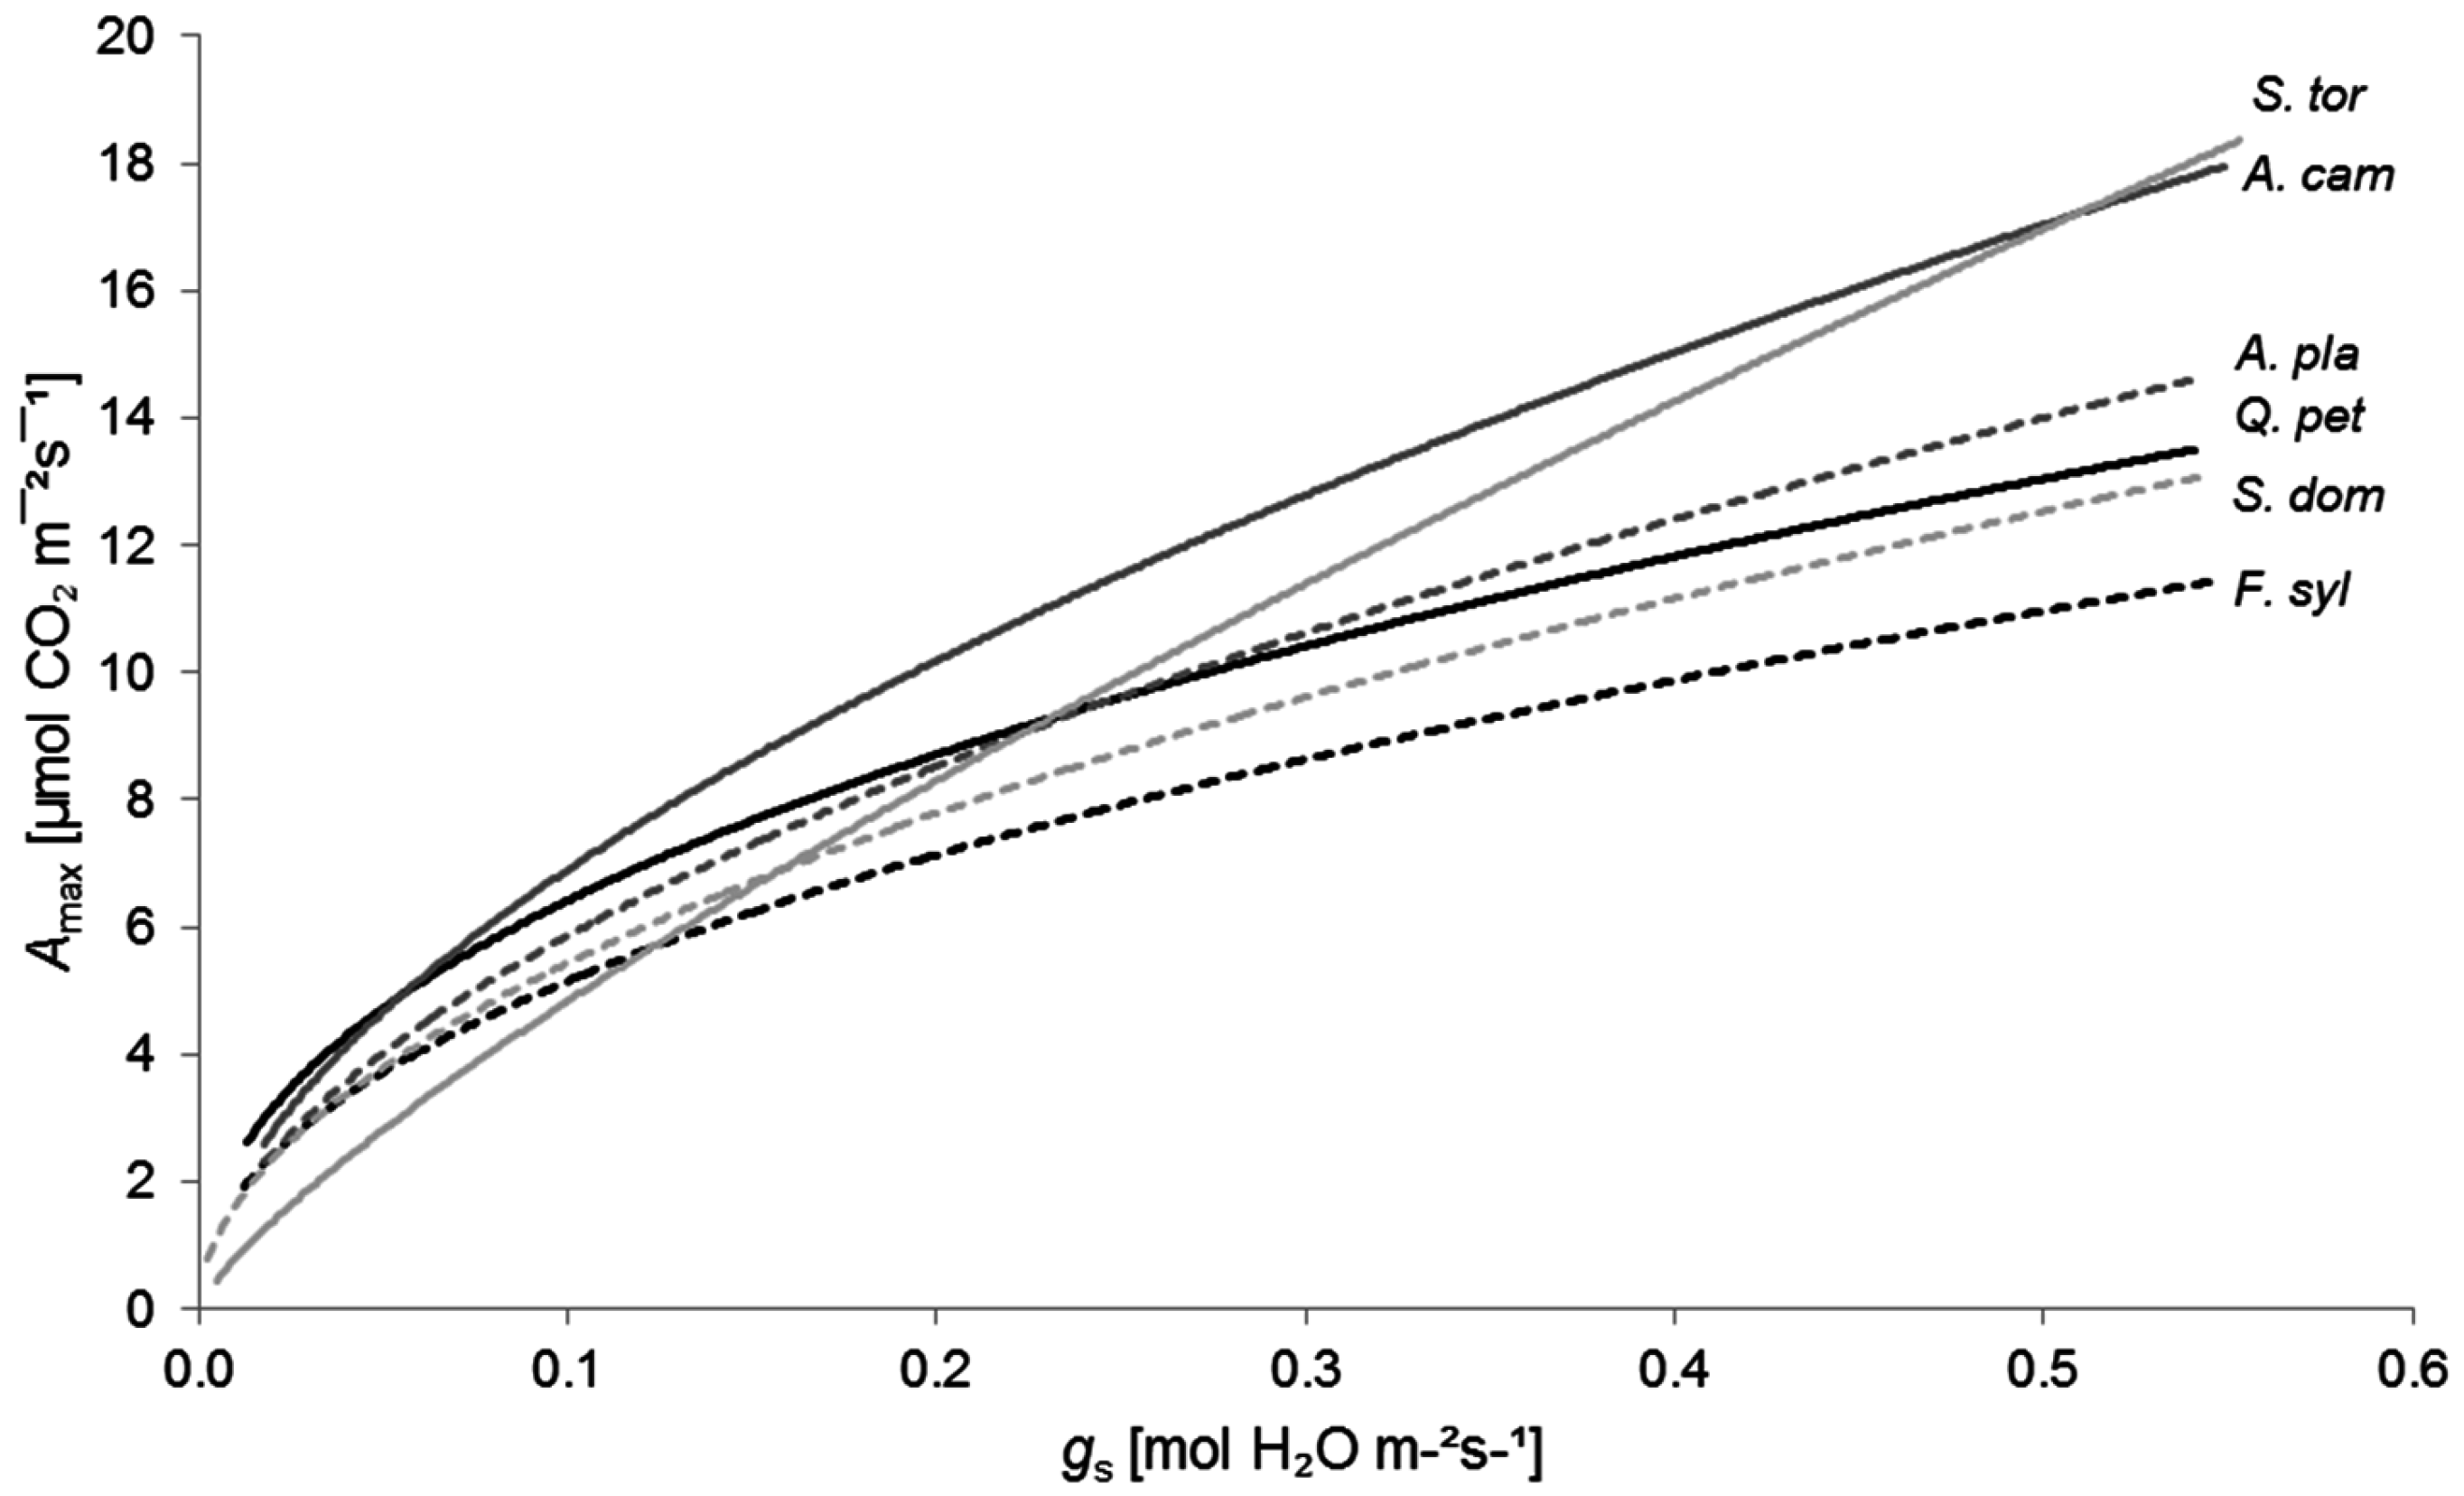
© 2016 by the authors; licensee MDPI, Basel, Switzerland. This article is an open access article distributed under the terms and conditions of the Creative Commons Attribution (CC-BY) license (http://creativecommons.org/licenses/by/4.0/).