Article

Spatial Heterogeneity in Tree Diversity and Forest Structure of Evergreen Broadleaf Forests in Southern China along an Altitudinal Gradient

Ministry of Education Key Laboratory for Silviculture and Conservation, College of Forestry, Beijing Forestry University, Beijing 100083, China
*
Author to whom correspondence should be addressed.
Forests 2016, 7(10), 216; https://doi.org/10.3390/f7100216
Submission received: 14 July 2016 / Revised: 9 September 2016 / Accepted: 21 September 2016 / Published: 30 September 2016

Abstract

:
We studied the influence of altitude on the spatial heterogeneity of tree diversity and forest structure in a subtropical evergreen broadleaf forest in southern China. Significant positive correlation was found between tree species diversity, basal area and altitude, but negative correlation between slenderness of trunks and altitude. According to topography, tree species diversity, diameter at breast height, height and basal area increased from ridges to valleys, while slenderness and stem density did not differ significantly with topography. Redundancy analysis (RDA) was employed to clarify relationships between tree species diversity and environmental factors (topography and soil water holding capacity). Topography and water conditions jointly explained 57.8% of the diversity variation. Tree species diversity was significantly correlated with altitude, slope and bulk density (Monte Carlo permutation test with 999 permutations, p < 0.05). A positive relationship existed between altitude, soil non-capillary porosity and diversity, while slope, aspect and soil water content were the opposite. Our results show that soil water holding capacity has a positive effect on maintaining species diversity. When comparing with topographic factors—the main driving forces affecting the pattern of tree species diversity—the effect of soil water holding capacity was weak.

1. Introduction

Plant species diversity along altitudinal and environmental gradients has long been the focus of attention of ecologists [1,2,3,4]. Different patterns of plant species diversity variation with altitude have been recorded: (I) a decline in diversity with increased altitude [5]; (II) an increase in diversity with increasing altitude [6]; (III) a hump in diversity at mid-altitude [7,8]; (iv) a dip in diversity at mid-altitude [9]; (v) no relationship with altitude [10]. At a local scale, previous studies looking at altitude variation have focused on total trend of plant diversity patterns without considering different types of forest. Despite being a key source of the world’s biodiversity and sustainable development [11], there is little research on tree species diversity patterns and factors that impact on subtropical evergreen broadleaf forest.
Studies of tree species-environment associations in forests are often based on topography and water conditions [12]. Topographic variations bring changes in soil fertility and distribution of forest types and tree species are limited by soil conditions [13,14,15,16]. Compared with topography, water conditions are also an important factor influencing tree species diversity. At relatively large spatial scales, the relationship between water conditions and diversity is primarily influenced by climate, especially temperature and precipitation [17]. At local scale, previous studies mainly focus on water availability for plants [18], however the water holding capacity is non-negligible. Soil water holding capacity has been long discussed and has well known effects on the distribution of plant species [19]. Former studies mostly focus on the forests with seasonal changes in water status and suggest that soil water condition is likely to determine the species coexistence. However, how the water-diversity association changes across plant communities is still ambiguous [20]. The classical habitat control model suggests that species assemblage is determined by variation in environmental conditions, but which factor is the dominant component remains obscure [21]. Whether topographic or water gradients are the main driving force of variations in diversity is still been discussed in relation to local habitats.
As a hotspot of the subtropical evergreen broadleaf forests in southern China, forests in Jiangle region, Sanming City, Fujian province present an ideal location to test the altitudinal patterns of tree species diversity and their relation to environmental gradients [22,23]. To identify possible causes of the spatial heterogeneity of tree species diversity and stand structure, an array of plots with an altitudinal gradient of 900 m were set within a homogeneous evergreen broadleaf forest. The aims of the study were: (1) to quantify changes in tree species diversity and stand structure along altitudinal gradients; (2) analyze interrelations between tree diversity and environmental factors; and (3) clarify the main factors influencing tree species diversity.

2. Materials and Methods
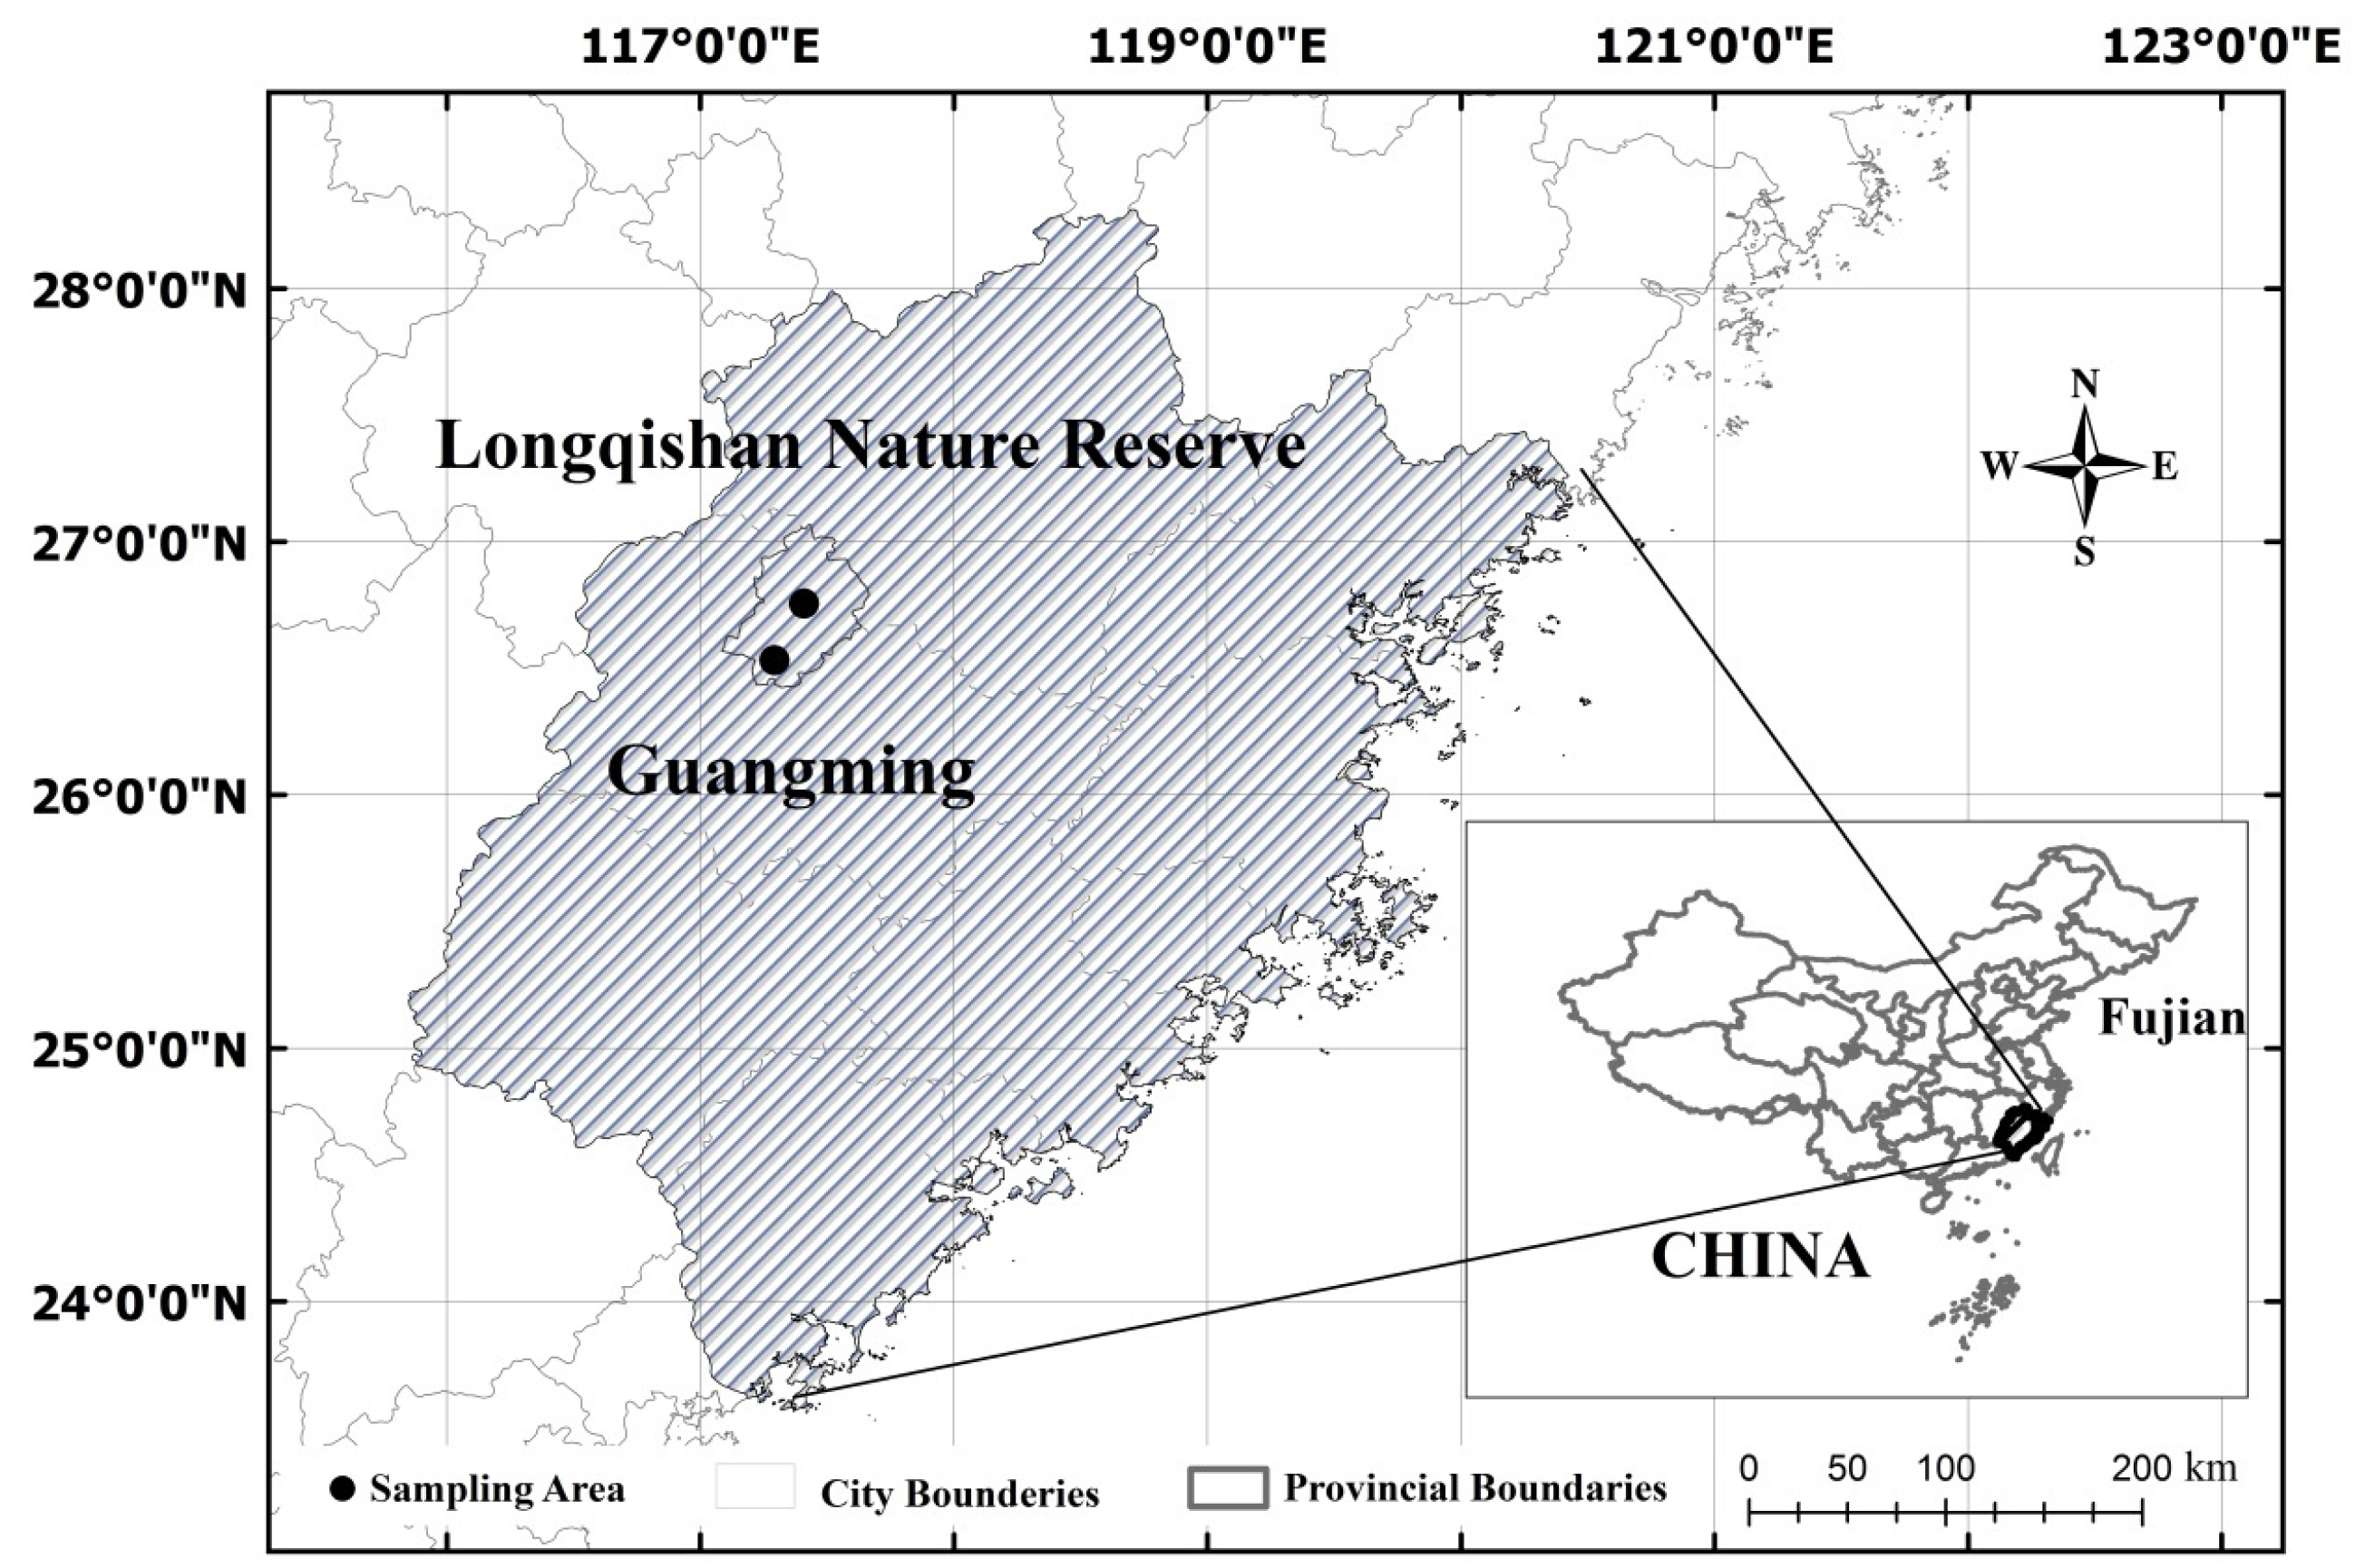
2.1. Study Site

This study was conducted in Jiangle County, Sanming City, Fujian province, China on the southeast slope of the Cordillera Wuyi, covering a 16° latitudinal range and an altitude range from 230 to 1190 m. Two sites at different altitudes and covered by well-conserved subtropical evergreen broadleaf forest were chosen for plotting (Figure 1). One site, over 500 m above sea level (a.s.l.), is located at Longqishan Nature Reserve (LQS), and the other, below 500 m a.s.l., at Guangming township, 46 km to the northeast of the reserve. There are two dominant types of soils in the region, which developed on top of igneous rocks including granite, quartzite and metamorphic rocks, with red soil at high altitudes and yellow soil in low mountains. The area is dominated by mid-to-low mountains predominantly covered by evergreen broadleaf forest. The main part of the study site was located on steep slopes (20°–40°). Mean annual temperature is 14.6–18.8 °C in Guangming and below 14 °C in the reserve; mean annual precipitation is 1797 mm (range 799–1859 mm, data from Jiangle County meteorological station, observed from 1943 to 2005).
The target evergreen broadleaf forest is mainly distributed under 1200 m a.s.l., with broadleaf deciduous and mixed forest at 1100–1300 m a.s.l. There is no significant pattern of changes in tree composition along the altitudinal gradient. However, we limited the study of environmental control to the effect of topography on the distribution of tree species diversity and forest structure and in this case a significant difference was observed. Two dominant types of forest were distinguished for the study site. Type A is mainly distributed in ridges with trees rarely reaching a height of 15 m. The shrub and herb layers of this forest were well developed. The most speciose tree taxa are Castanopsis spp. (Fagaceae), Castanea spp. (Fagaceae), Alniphyllum spp. (Styracaceae) and Schima spp. (Theaceae). Compared with type A, type B is mainly located in valleys with higher canopy density, but few herbs and shrubs under the canopy. It is dominated by Ilex spp. (Aquifoliaceae), Elaeocarpus spp. (Elaeocarpaceae) and Cyclobalanopsis spp. (Fagaceae). The two forest types were classified to be a comprehensive effect of topography on species diversity and forest structure.

2.2. Study Design and Sample Collection

The distribution of evergreen broadleaf forest was on average between 400 and 600 m a.s.l. with an upper limit of 1200 m a.s.l. [24]. To investigate altitudinal alternation in composition and richness of trees species and forest structure, 20 permanent plots (total area 1.2 ha), each with a size of 600 m2, were established at 230–1190 m a.s.l., of which 13 plots (altitude > 500 m a.s.l.) were set in LQS and the other 7 plots (altitude ≤ 500m a.s.l.) were set in Guangming. All plots were set within homogenous forest, representative of vegetation for the corresponding altitude. No obviously recent disturbances by either humans or nature are recorded. Plots were located in structurally homogeneous patches, in contrast with the overall heterogeneous environment. Forest structure and capacity of water holding capacity were measured in all plots.

Tree Diversity, Stand Structure and Environmental Variables

The species of all individual tree was identified along with diameter at breast height (dbh, ≥5 cm) and tree height (m) were measured in each plot. The altitude was measured in the centre of each plot (the span in altitude between the highest and lowest plots was 920 m). To determine how specific topographic factors influence tree species, another two micro-topographic parameters were measured: slope, and aspect. Aspect was transformed using A = cos ( A max A ) + 1 , where A = transformed aspect, where A max = 45° and A = measured aspect [25]. In each permanent plot, three soil profiles were randomly set to test soil water holding capacity. Five soil samples were collected using the cutting ring method within each profile at a depth of up to 80 cm: two top soil layers each with 10 cm thick and the remaining three were layers of 20 cm respectively. Bulk density, non-capillary porosity and water content were tested [26,27,28].

3. Data Analysis

The least-square method was used for correlation analysis, with a significance threshold of p < 0.05. Three parameters were adopted to describe stand structure [29]: basal area (m2/ha), stem density (stems/ha) for dbh ≥ 5cm, and slenderness—the ratio of mean height to dbh (with both height and dbh measured in metres). Five parameters were chosen to describe the variation of species diversity [30]: species richness (S) was represented by the number of species in the plot after individual-based rarefaction [31], the rarefied number of species (RS) was on the basis of 59 individuals, which was the smallest number among the 20 permanent plots and was assigned as the standard number for rarefaction. The Shannon diversity index ( H ) using the formula H = ( p i   ln   p i ) , where p i is the relative abundance of the i-th species, was used to represent species diversity [32]. The Shannon evenness index (E) was derived using the formula E = H / ln   S , where H is the Shannon diversity index and S is the maximum diversity [33]. The Sorenson similarity index (Cs) C S = 2 j / ( a + b ) , where a and b are the number of species in each of the plots in comparison and j is the number of species common to both plots, was drawn for each pair of plots within and between forest types. The relationship between tree species diversity, forest structure and altitude was examined separately in our study. To compare the relationship of stand structure and diversity between forest types A and B, a t-test was applied after the test of Gaussian distribution.
Redundancy analysis (RDA) was applied to quantify and test the effects of environmental factors (topography and soil water holding capacity) on tree species diversity. Partial RDA was also performed to extract the variation in tree species diversity explained by each of the two sets of explanatory variables and shared by the two data sets [34]. Explanatory variables were standardized before analysis, and diversity data were transformed prior to analysis using log transformations which were not normally distributed. The whole process was operated using the VEGAN statistical package of R 3.2.5 [35].

4. Results

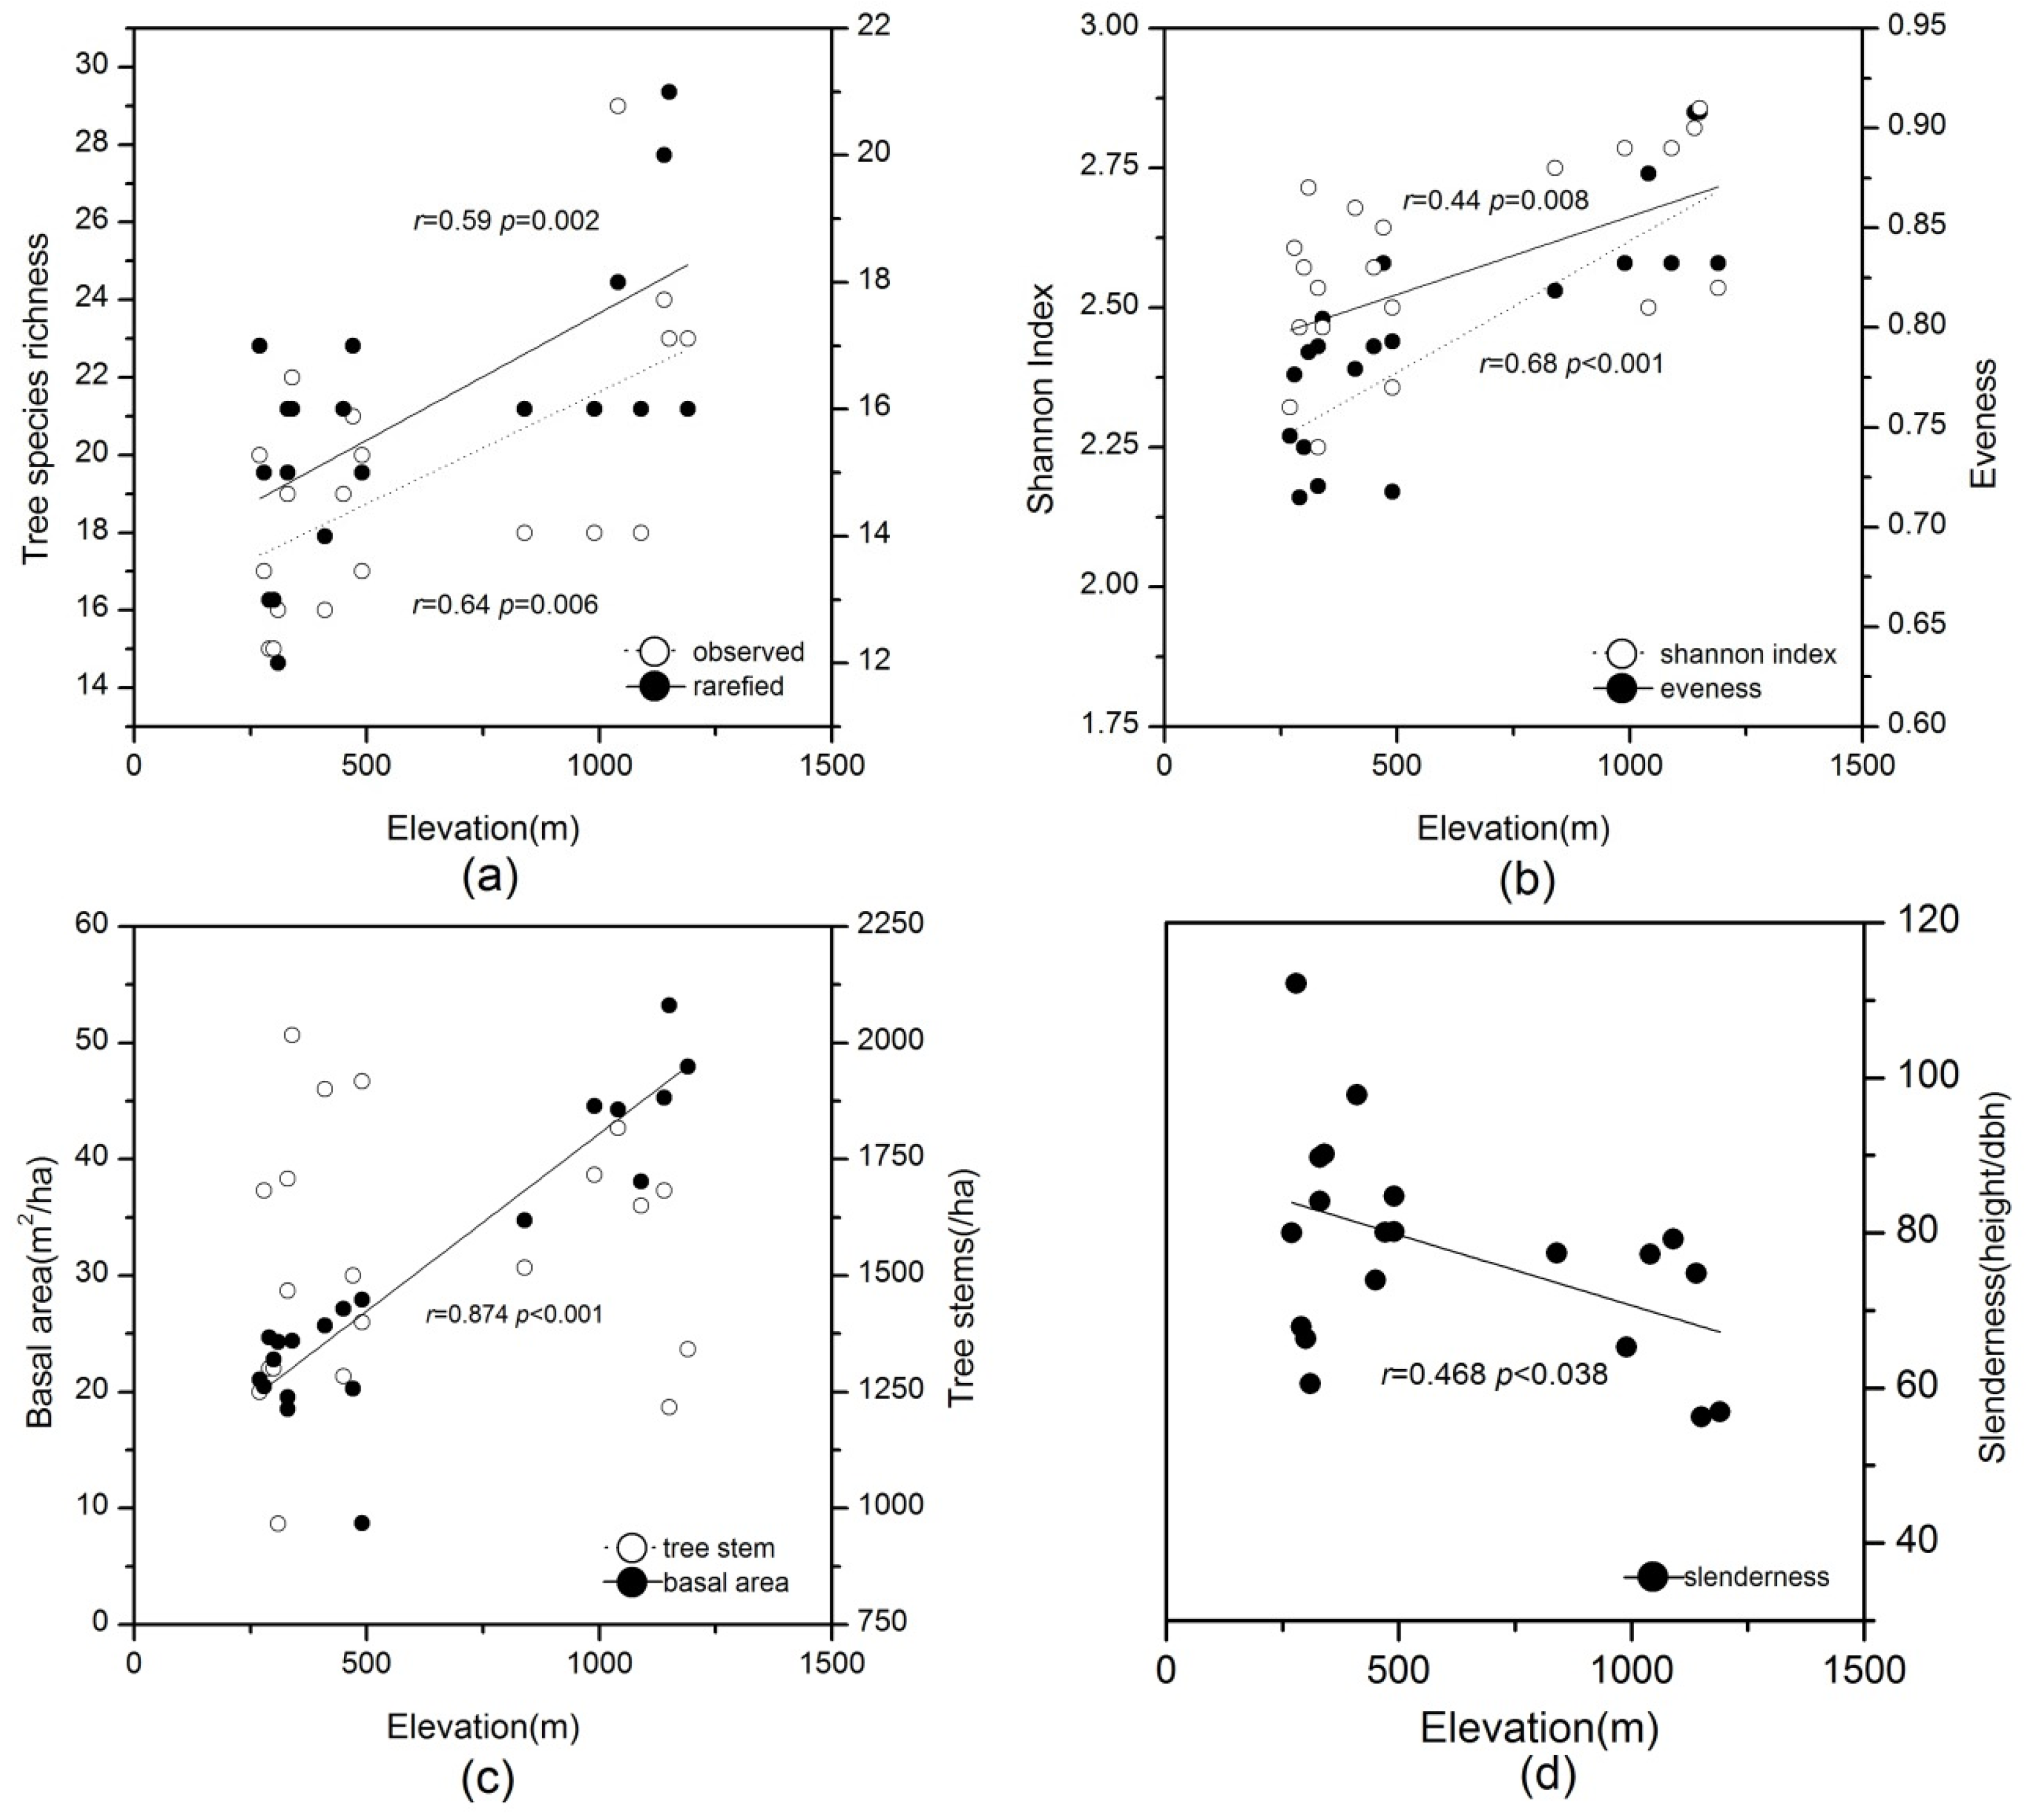
4.1. Tree Diversity and Stand Structure as a Function of Altitude

In the 20 permanent plots, 2255 stems (dbh ≥ 5 cm) were found in total belonging to 102 species and 47 families. The dominant family was Fagaceae (16 species) and Lauraceae (13 species). Both the observed (from 15 to 29) and rarefied (from 12 to 21) species richness increased with altitude (Figure 2a), and the slope of the rarefied fitted line was steeper because of the higher stem density in the plots at higher altitude.
The Shannon diversity index increased with altitude, in the ranges 2.16–2.58 and 2.53–2.85 for forest types A and B, respectively. The average showed a slight increase from 2.35 at 270–490 m a.s.l. to around 2.57 at over 500 m a.s.l. The Shannon evenness index showed a similar trend, increasing from 0.74 to 0.87 at approximately 270–490 m a.s.l. to 0.65–0.91 at 600–1190 m a.s.l. On average, trees had a more uniform distribution in the uppermost plots (Figure 2b). Basal area increased from 8.7 to 27.9 m2/ha at 290–400 m a.s.l. to 34.7–53.2 m2/ha on plots over 500 m a.s.l. The tree stem density (stems/ha) did not show significant variation pattern with altitude (Figure 2c). Trees had a higher slenderness in plots at lower altitude. The mean slenderness of trees decreased from 82.1 to 69.6 from below to over 500 m a.s.l., respectively (Figure 2d).

4.2. Stand Structure and Species Diversity in Different Forest Types (A and B)

Tree species diversity and stand structure parameters except for stem density and slenderness, significantly differed between the two forest types (Table 1). With a slight variation from forest types A to B, the average of both observed and rarefied richness had an increment of 20.4% and 17.8%, respectively. The average Shannon indexes were 2.35 and 2.67, respectively, with type B 13.6% higher than type A. The difference in average Shannon evenness index showed a mere increment (7.4%, from 0.81 to 0.87) between forest types A to B. The mean dbh increased significantly, to be as high as 34.5%, however, the average tree height increased slightly, with a difference of 13.6% (from 9.38 to 10.66). Due to the larger dbh and the similar average stem density, which changed little from forest type A to B (3.2%, from 1514.77 to 1563.30), a significant change in average basal area was observed between forest types A (21.96 m2/ha) to B (44.01 m2/ha).
The Sorenson similarity index for the same stand ranged from 0.21 to 0.63 in type A and 0.21 to 0.74 in type B. The average Sorenson index was 0.29 and 0.47 in the two types, respectively. Among the 102 tree species, there were 71 species in type A and 61 in type B, and the Sorenson similarity index between the two was 45% (the number of species occurred in both types was 30).

4.3. Variation of Topography and Water Conservation Capacity

Topographic factors showe a high variation across the study area and the coefficient of variation (CV) was ranked as: altitude (58.00%) > aspect (55.61%) > slope (19.53%). The water holding capacity data also showed a high degree of variation and was ranked as follows: soil non-capillary porosity (60.90%) > soil water content (52.71%) > bulk density (8.99%).

4.4. Redundancy Analysis of Topography and Water on Species Diversity

RDA applied to tree species diversity constrained by topographic data was performed to quantify the effects of topography on variation in tree species diversity. The eigenvalues of the first and second constrained axes were 0.498 and 0.037 respectively, and axis 1 explained most of the variation in species diversity. Integration of all topography data explained 53.5% of species diversity variation (Monte Carlo permutation test with 999 permutations, p = 0.001). As a key element of topography, altitude alone explained 27.7% of the variance in the functional diversity of soil microbial community (Monte Carlo permutation test with 999 permutations, p = 0.001).
Tree species diversity constrained by water holding capacity was also tested using RDA. The eigenvalues of the first and second constrained axes were 0.263 and 0.003, respectively. The combination of all water holding capacity variables explained 26.6% of the variance in species diversity (Monte Carlo permutation test with 999 permutations, p = 0.018). The most significant variation was bulk density, which explained 10.7% of species diversity variation (Monte Carlo permutation test with 999 permutations, p < 0.05).

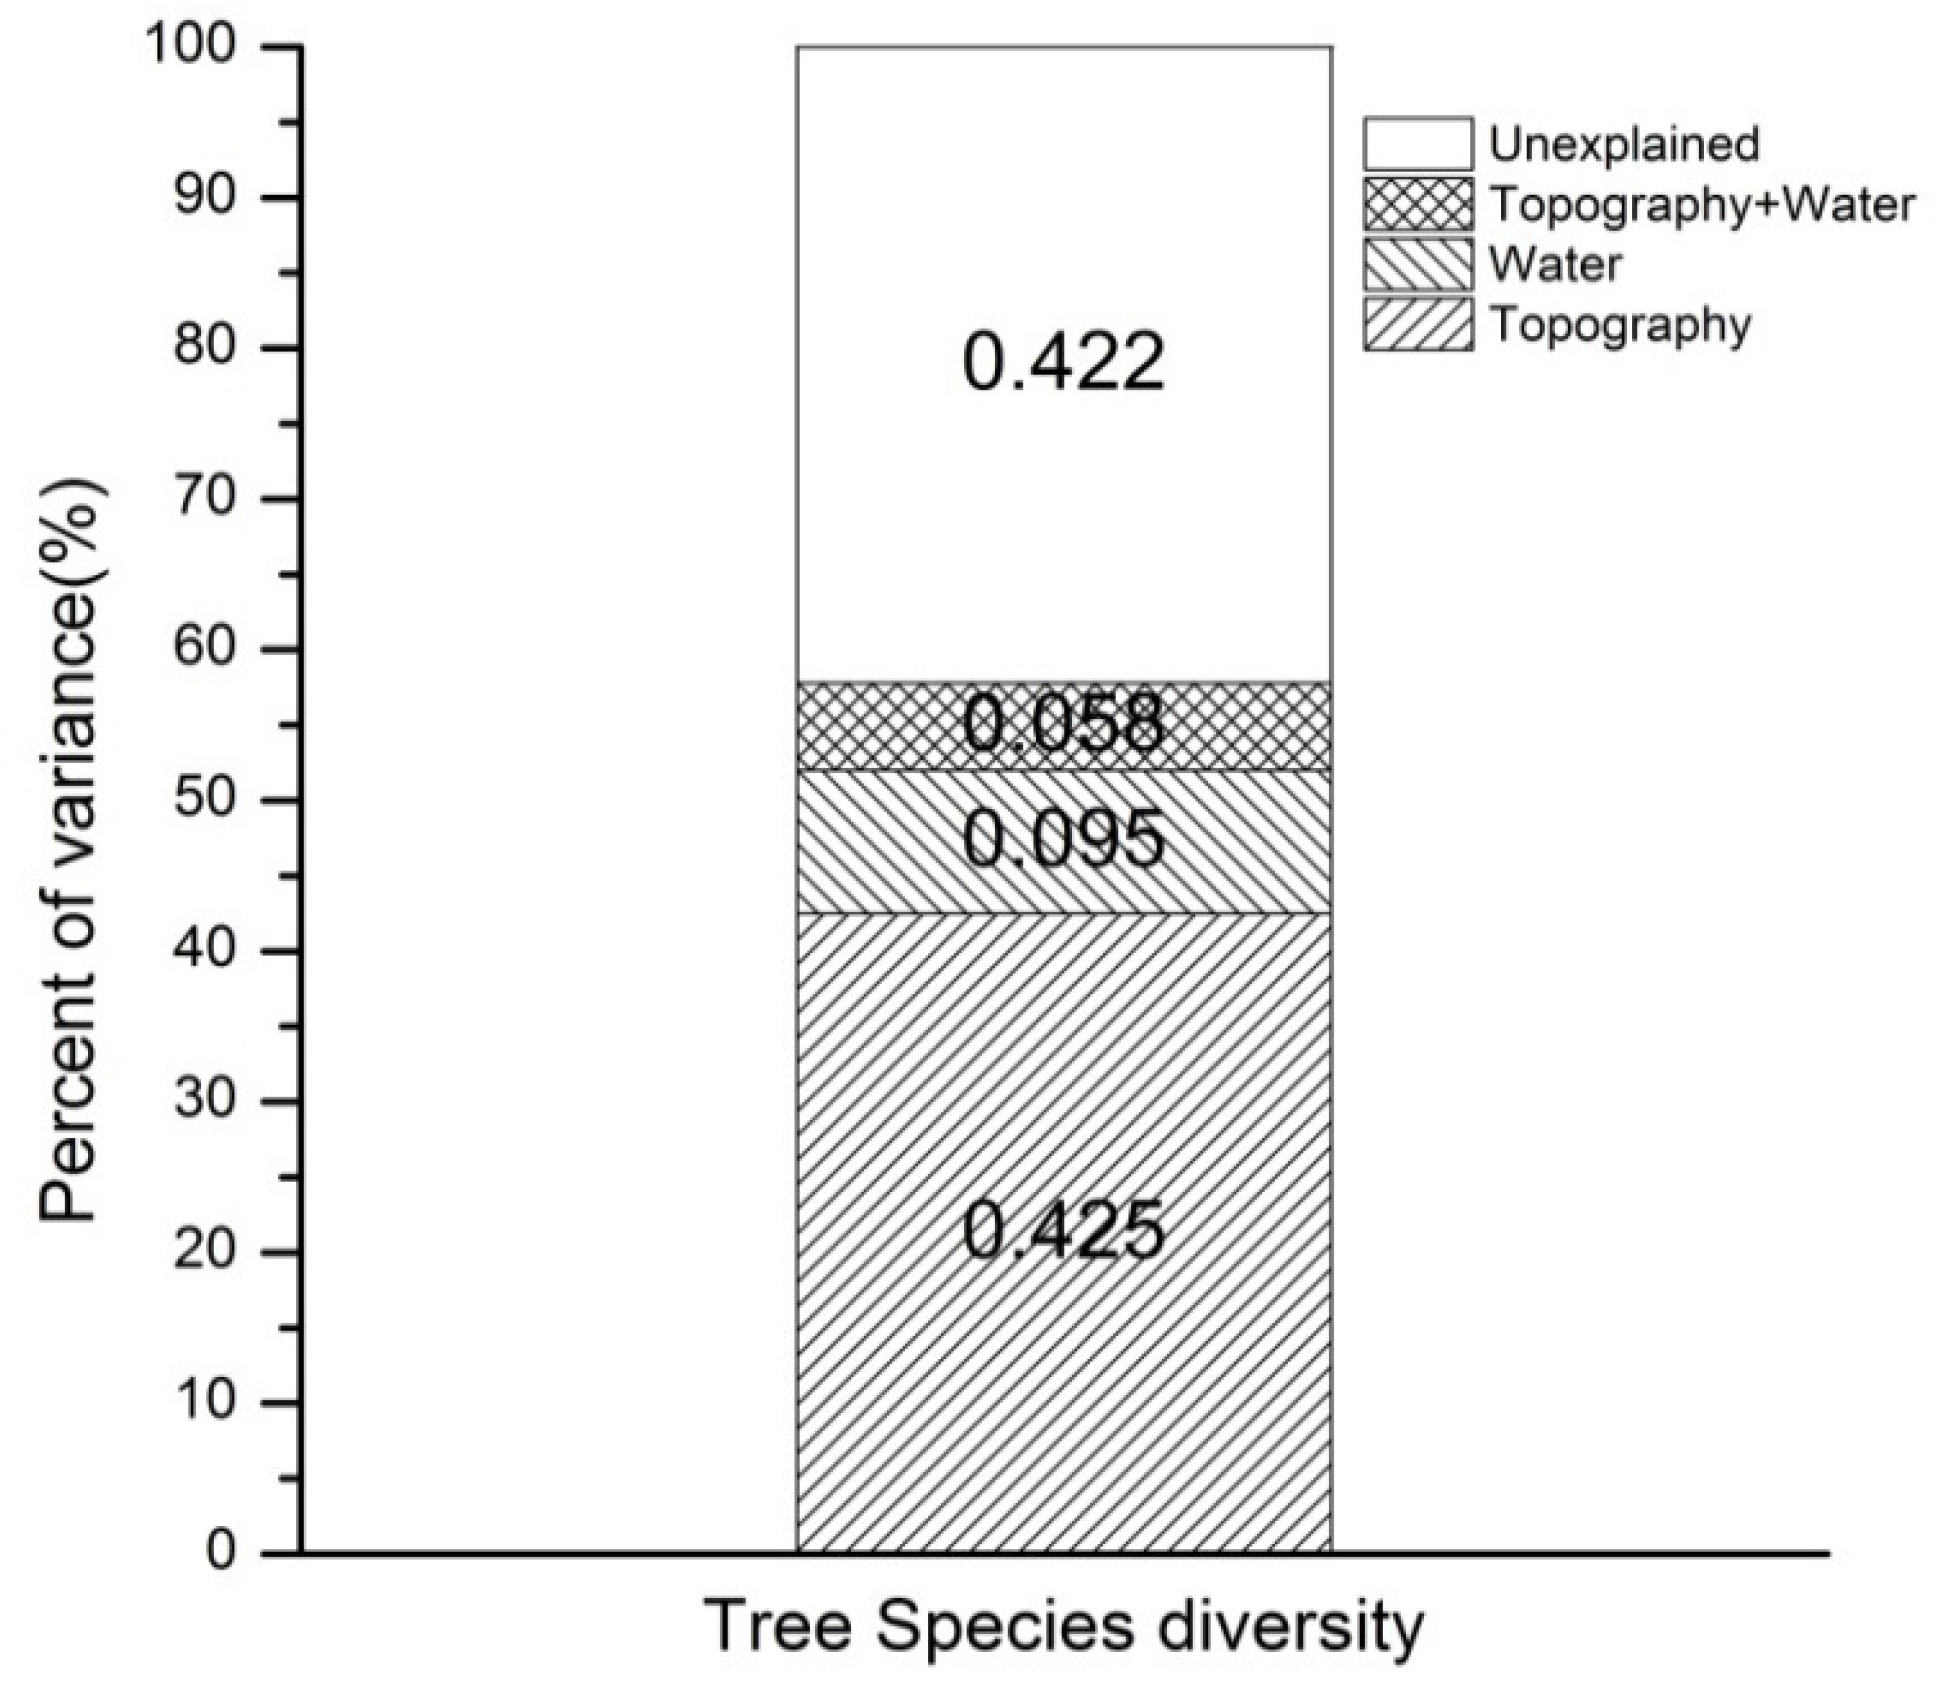
4.5. Variation Partitioning of Topography and Water Conservation on Species Diversity

Topographic factors were contributed differently to species diversity; there was a significant correlation with altitude (p < 0.001) and slope (p = 0.01), but a less significant correlation with aspect. For water holding capacity of the substratum, only bulk density showed species diversity (p = 0.05), while soil water content and, non-capillary porosity played minor roles (Monte Carlo permutation test with 999 permutations). The total variance explained by the two sets of variables was 57.8% (p = 0.01) (Figure 3). Axis1 explained most of the variation (53.1%, p = 0.001), followed by Axis 2 (4.6%, p < 0.05). Shannon diversity index, Shannon evenness index and richness were positively correlated with altitude and negatively correlated with other factors, including aspect, slope, soil water content, bulk density and non-capillary porosity.
Variation in tree species diversity with each of the two sets of explanatory variables (topographic data and water data) without the effect of the other was extracted by partial RDA, as well as the variation in common between by the two data sets. The variation of tree species diversity explained by each data set (topography data and water data) without the second was also significant (topography data: p = 0.001; water data: p = 0.018). The percentages of variation presented in Figure 4 are those without the shared variation. Topographic factors and water status explained 42.5% and 9.5% of the variation, respectively. The variation shared by the two data sets was 5.8%. However, 42.2% of variation in tree species diversity could not be explained by the measured variables.

5. Discussion

5.1. Tree Diversity as a Function of Altitude

Evergreen broadleaf forests in our study region had their upper limit to 1200 m a.s.l., while in Shennongjia Mountain, central China’s Hubei province, it is below 1000 m [36] and can be found below only 800 m a.s.l. in Mount Gutian, in southeast China’s Zhejiang province [37]. Compared to other subtropical evergreen forests, the distribution pattern of tree diversity in our research sites is summarized as follows:
First, species diversity of evergreen broadleaf trees increased with altitude in a similar manner as was found in other studies for subtropical communities [38,39]. Liu et al. found that species richness has a trend towards high values in the lower half of the altitude gradients, and it increases with a limit of about 1500 m a.s.l. in Yunnan province [40]. However, richness and diversity have not always been found to be synchronous in variation: evergreen broadleaf tree richness has a slight increment but diversity index had a minimum at around 700 m a.s.l. in the Emei mountains in Sichuan province [41]. The pattern of tree species diversity can probably be attributed to human disturbance and tree genera. For the 20 plots in our two study sites, a mean of 19 tree species (dbh ≥ 5 cm) per 600 m2 was determined, which is lower than that investigated in 1998 in the same location [24]. Compared to the Wuyi Mountain in Fujian province and Wuyanling mountain in Zhejiang province, our sites showed relatively poor richness in species diversity [42,43].
Second, a higher tree species diversity was observed in forest type B (valleys) in comparison with forest type A (ridges) (Table 1). This was probably because ridges are more nutrient-poor and unfavorable to water conservation than valleys [44,45]. The proportion of shared tree species and the Sorenson similarity index between the two forest types indicated that tree species had a slight difference between the two forest types, most likely due to similar hydrothermal conditions.

5.2. Stand Structure Variations

Basal area in our study sites (with an average of 34 m2/ha), when compared with evergreen broadleaf forest in Nanling mountains (36 m2/hm2, southern China, 740m a.s.l.), appear to be similar in terms of the dominant genus of Castanopsis [46]. Positive correlations between tree stem density and altitude have been reported in various communities, and a negative relationship was determined in southern Ecuador [47]. To our knowledge, this relationship exists on larger altitudinal gradients which alter temperature and precipitation. Tree stem density in our study tended to increase with altitude, but less significantly than previously observed in the eastern Himalaya region [48] as was found in our study. The differences were attributed to forest types and plot conditions [49,50]. Structural parameters differed significantly between the two types, but stem density and slenderness differed less. Forests distributed in valleys (type B) showed better growth compared to ridges (type A), because of the superior conditions in terms of nutrients and soil moisture.

5.3. Environmental Variation and Tree Diversity

A series of forest types has come into being as a result of long-term effects of topography, water condition and altitude [51,52,53]. Relationship between aspect, slope and tree diversity has been a matter of debate and disagreement. Wolf et al. argued that aspect and slope have a considerable effect on tree species diversity, because they determine water availability [54]. Enoki found that the diversity of plant species distributed on concave and convex slopes have significant differences [55]. However, Legendre et al. found that the effects of slope and aspect on distribution of richness and species composition are weak [56], similar to our results.
Distribution pattern of trees has been shown to vary strongly with water conditions [57,58]. At small scales, the water holding capacity of the soil is one of the main parameters [59,60,61]. Ability of soil water conservation and permeability seem to be limited by soil moisture, porosity and bulk density etc. [62,63,64]. Non-capillary porosity is designed to permit the percolation of water and the entrance of air [27] and it was positively correlated but weak with tree species richness and diversity (Figure 3). Rainfall interception and its subsequent evaporation affect the water yield from soil [65]. As a consequence of lower altitude and less precipitation, litter and soil layers of evergreen broadleaf forests can rarely saturate with water. The maximum soil-litter moisture capacity did not show a significant relationship with tree species diversity in our study site.
Using traditional niche theory, the environmental-control model has been widely used to explain the maintenance of local species diversity, assuming that the habitat–species associations results in variation [66]. Species with niche differentiation assemble in a specific habitat and compete the resources. In our study, a large proportion (57.8%) of variation in tree species diversity is determined by topographic and water conditions (Figure 4). Plant distribution is controlled by water and temperature conditions [67]. Partial RDA for tree species diversity showed that topography was the main factor affecting the pattern of tree species diversity (42.5%) and water conditions were the second (9.5%) (Figure 4). It is not surprising that topography is the first-order control factor for the habitat diversification. Variations in topographic factors, especially altitude, bring differences in water supply, while factors such as soil porosity and soil moisture also alter the holding capacity. Study of the soil water holding capacity in a tropical dry lowland forest of Guanacaste of Costa Rica found that species diversity varied significantly with soil water conditions [20]. However, water holding capacity is less important in our study sites (Figure 4). This may be due to the different water status between the two forest types. Tree development in dry forest varies during the dry season between species and water conditions. While our study sites, there is precipitation in most months of a year which varies little between sites because of the narrow span in altitude. Therefore, water condition is not a dominant limitation to species diversity.
It is not insignificant that over 40% variation cannot be explained by the two components. Several reasons may lead to this result, including other unmeasured environmental parameters such as soil nutrients and light availability [68]. Another reasonable explanation is that the unexplained variation may be caused by the species assemblages themselves through the neutral processes [69]. In other words, the species diversity may be due to stochastic processes and the dispersal limit for the coexistence of species. Due to lack of this type of data, for example, spatial distribution of species in various areas of plots, the hypothesis cannot be tested for now and our future work will therefore focus on dispersal or stochastic processes.

6. Conclusions

Several hypotheses including the niche divergence hypothesis [70], lottery competition hypothesis [71] and ecological hypothesis [72] have been proposed to explain patterns of tree species diversity, however, these hypothesis are mainly tested in local scales. Our results could be explained by the ecological hypothesis and can contribute to scaling up these relationships to regional plant diversity [73].
This work has provided an examination of the main driving forces affecting tree species diversity in a subtropical evergreen broadleaf forest. Although our results suggested that the chosen topographic and water parameters can well explain the variation of tree species diversity, it is essential to do further investigation since 42.2% of the variation was undetermined. In order to gain better understanding of the mechanism between diversity and environmental factors, it may be necessary to incorporate other non-spatially biological or soil chemical factors.

Acknowledgments

The study is supported by the project of “Research and demonstration of sustainable management technology of ecological public welfare forest in Southern Collective Forest Region” (2012BAD22B05). We thank all those who involved for the hard work in field data collection and who helped us in the paper written.

Author Contributions

Wei Cui analyzed the data and wrote the manuscript. Xiao-Xian Zheng assisted in discussion and paper revision.

Conflicts of Interest

The authors declare no conflict of interest.

References

  1. Whittaker, R.H. Vegetation of the Siskiyou mountains, Oregon and California. Ecol. Monogr. 1960, 30, 279–338. [Google Scholar] [CrossRef]
  2. MacArthur, R.H. Geographical Ecology: Patterns in the Distribution of Species; Princeton University Press: Princeton, NJ, USA, 1972. [Google Scholar]
  3. Walter, H.; Breckle, S. Ecological Systems of the Geobiosphere: 2 Tropical and Subtropical Zonobiomes; Springer Science & Business Media: New York, NY, USA, 2013; Volume 2. [Google Scholar]
  4. Givnish, T.J. Altitudinal gradients in tropical forest composition, structure, and diversity in the Sierra de Manantlán. J. Ecol. 1998, 86, 999–1020. [Google Scholar]
  5. Aiba, S.; Kitayama, K. Structure, composition and species diversity in an altitude-substrate matrix of rain forest tree communities on Mount Kinabalu, Borneo. Plant Ecol. 1999, 140, 139–157. [Google Scholar] [CrossRef]
  6. Baruch, Z. Ordination and classification of vegetation along an altitudinal gradient in the Venezuelan paramos. Vegetatio 1984, 55, 115–126. [Google Scholar]
  7. Whittaker, R.H.; Niering, W.A. Vegetation of the Santa Catalina Mountains, Arizona. V. Biomass, production, and diversity along the elevation gradient. Ecology 1975, 56, 771–790. [Google Scholar] [CrossRef]
  8. Lomolino, M. Elevation gradients of species-density: Historical and prospective views. Glob. Ecol. Biogeogr. 2001, 10, 3–13. [Google Scholar] [CrossRef]
  9. Peet, R.K. Forest vegetation of the Colorado Front Range: Patterns of species diversity. Vegetatio 1978, 37, 65–78. [Google Scholar] [CrossRef]
  10. Wilson, J.B.; Sykes, M.T. Some tests for niche limitation by examination of species diversity in the Dunedin area, New Zealand. N. Z. J. Bot. 1988, 26, 237–244. [Google Scholar] [CrossRef]
  11. Ovington, J.D. Ecosystems of the World 10. Temperate Broad-Leaved Evergreen Forests; Elsevier Science Publishers BV: Amsterdam, Netherlands, 1983. [Google Scholar]
  12. Fu, B.J.; Liu, S.L.; Ma, K.M.; Zhu, Y.G. Relationships between soil characteristics, topography and plant diversity in a heterogeneous deciduous broad-leaved forest near Beijing, China. Plant Soil 2004, 261, 47–54. [Google Scholar] [CrossRef]
  13. Edwards, P.J.; Grubb, P.J. Studies of mineral cycling in a montane rain forest in New Guinea: I. The distribution of organic matter in the vegetation and soil. J. Ecol. 1977, 65, 943–969. [Google Scholar] [CrossRef]
  14. Johnston, M.H. Soil-vegetation relationships in a tabonuco forest community in the Luquillo Mountains of Puerto Rico. J. Trop. Ecol. 1992, 8, 253–263. [Google Scholar] [CrossRef]
  15. Oliveira-Filho, A.D.; Curi, N.; Vilela, E.A.; Carvalho, D.D. Tree species distribution along soil catenas in a riverside semideciduous forest in southeastern Brazil. Flora Morphol. Geobot. Oekophysiol. 1997, 192, 47–64. [Google Scholar]
  16. Mangan, S.A.; Schnitzer, S.A.; Herre, E.A.; Mack, K.M.; Valencia, M.C.; Sanchez, E.I.; Bever, J.D. Negative plant-soil feedback predicts tree-species relative abundance in a tropical forest. Nature 2010, 466, 752–755. [Google Scholar] [CrossRef] [PubMed]
  17. Thuiller, W.; Lavorel, S.; Araújo, M.B.; Sykes, M.T.; Prentice, I.C. Climate change threats to plant diversity in Europe. Proc. Natl. Acad. Sci. USA 2005, 102, 8245–8250. [Google Scholar] [CrossRef] [PubMed]
  18. Ryan, M.G.; Stape, J.L.; Binkley, D.; Fonseca, S.; Loos, R.A.; Takahashi, E.N.; Silva, C.R.; Silva, S.R.; Hakamada, R.E.; Ferreira, J.M.; et al. Factors controlling Eucalyptus productivity: How water availability and stand structure alter production and carbon allocation. For. Ecol. Manag. 2010, 259, 1695–1703. [Google Scholar] [CrossRef]
  19. Xiong, S.; Johansson, M.E.; Hughes, F.M.; Hayes, A.; Richards, K.S.; Nilsson, C. Interactive effects of soil moisture, vegetation canopy, plant litter and seed addition on plant diversity in a wetland community. J. Ecol. 2003, 91, 976–986. [Google Scholar] [CrossRef]
  20. Borchert, R. Soil and stem water storage determine phenology and distribution of tropical dry forest trees. Ecology 1994, 75, 1437–1449. [Google Scholar] [CrossRef]
  21. Whittaker, R.H. Vegetation of the great smoky mountains. Ecol. Monogr. 1956, 26, 1–80. [Google Scholar] [CrossRef]
  22. Li, Z. Vegetation in Longqi Mountain; Science and Technology of China Press: Beijing, China, 1994. [Google Scholar]
  23. Wang, G.L.; Sun, Q.G. Characteristics of Subtropical Plants from Longqi Mountain, Fujian Province and Analysis of Ecological Value. J. Fujian Coll. For. 2002, 22, 376–380. [Google Scholar]
  24. He, J.; Chen, W.; Xie, Z.; Hu, D. Types of the evergreen broadleaf forest and their community species diversity in Longqishan Nature Reserve, Fujian Province. Chin. J. Ecol. 1998, 17, 2–7. [Google Scholar]
  25. Beers, T.W.; Dress, P.E.; Wensel, L.C. Notes and observations: Aspect transformation in site productivity research. J. For. 1966, 64, 691–692. [Google Scholar]
  26. Blake, G.R. Bulk density. In Methods of Soil Analysis. Part 1. Physical and Mineralogical Properties, Including Statistics of Measurement and Sampling; American Society of Agronomy: Guilford, NC, USA, 1965; pp. 374–390. [Google Scholar]
  27. Baver, L.D. Soil permeability in relation to non-capillary porosity. Soil Sci. Soc. Am. J. 1939, 3, 52–56. [Google Scholar] [CrossRef]
  28. Gardner, C.M.; Robinson, D.A.; Blyth, K.; Cooper, J.D. Soil water content. In Soil Analysis: Physical Methods; Soil Science Society of America: Madison, WI, USA, 2000; pp. 1–74. [Google Scholar]
  29. Greig-Smith, P. Quantitative Plant Ecology; University of California Press: Berkeley, CA, USA, 1983; Volume 9. [Google Scholar]
  30. Magurran, A.E. Ecological Diversity and Its Measurement; Springer Science & Business Media: New York, NY, USA, 2013. [Google Scholar]
  31. Gotelli, N.J.; Colwell, R.K. Quantifying biodiversity: Procedures and pitfalls in the measurement and comparison of species richness. Ecol. Lett. 2001, 4, 379–391. [Google Scholar] [CrossRef]
  32. Shannon, R.T. Revised effective ionic radii and systematic studies of interatomic distances in halides and chalcogenides. Acta Crystallogr. Sect. A 1976, 32, 751–767. [Google Scholar] [CrossRef]
  33. Pielou, E.C. An introduction to mathematical ecology. In An Introduction to Mathematical Ecology; Wiley-interscience: Hoboken, NJ, USA, 1969. [Google Scholar]
  34. Borcard, D.; Legendre, P.; Drapeau, P. Partialling out the spatial component of ecological variation. Ecology 1992, 73, 1045–1055. [Google Scholar] [CrossRef]
  35. Oksanen, J.; Kindt, R.; O Hara, B. Vegan: R functions for vegetation ecologists. Date Access 2005, 15, 2014. [Google Scholar]
  36. Shen, Z.; Hu, H.; Zhou, Y.; Fang, J. Altitudinal patterns of plant species diversity on the southern slope of Mt. Shennongjia, Hubei, China. Biodivers. Sci. 2004, 12, 99–107. [Google Scholar]
  37. Yu, M.; Hu, Z.; Yu, J.; Ding, B.; Fang, T. Forest vegetation types in Gutianshan Natural Reserve in Zhejiang. J. Zhejiang Univ. 2000, 27, 375–380. [Google Scholar]
  38. Fang, J.Y. Exploring altitudinal patterns of plant diversity of China’s mountains. Biodivers. Sci. 2004, 12, 1–212. [Google Scholar]
  39. Bhattarai, K.R.; Vetaas, O.R. Variation in plant species richness of different life forms along a subtropical elevation gradient in the Himalayas, east Nepal. Glob. Ecol. Biogeogr. 2003, 12, 327–340. [Google Scholar] [CrossRef]
  40. Liu, Y.; Zhang, Y.; He, D.; Cao, M.; Zhu, H. Climatic control of plant species richness along elevation gradients in the Longitudinal Range-Gorge Region. Chin. Sci. Bull. 2007, 52, 50–58. [Google Scholar] [CrossRef]
  41. Tang, C.Q.; Ohsawa, M. Zonal transition of evergreen, deciduous, and coniferous forests along the altitudinal gradient on a humid subtropical mountain, Mt. Emei, Sichuan, China. Plant Ecol. 1997, 133, 63–78. [Google Scholar] [CrossRef]
  42. Song, Y.; Zhang, K.; Liu, J.; Gu, Y.; Wang, X.; Hu, S. Evergreen broad-leaved forest community analysis of Wuyanling in Taishun country of Zhejiang province. Acta Phytoecol. Geobot. Sin. 1982, 1, 14–35. [Google Scholar]
  43. He, J.; Chen, W.; Li, L. Community diversity of the main types of the evergreen broad-leaved forest in the eastern part of the middle subtropical China. Acta Phytoecol. Sin. 1998, 22, 16–24. [Google Scholar]
  44. Lippok, D.; Beck, S.G.; Renison, D.; Hensen, I.; Apaza, A.E.; Schleuning, M. Topography and edge effects are more important than elevation as drivers of vegetation patterns in a neotropical montane forest. J. Veg. Sci. 2014, 25, 724–733. [Google Scholar] [CrossRef]
  45. Takyu, M.; Aiba, S.; Kitayama, K. Changes in biomass, productivity and decomposition along topographical gradients under different geological conditions in tropical lower montane forests on Mount Kinabalu, Borneo. Oecologia 2003, 134, 397–404. [Google Scholar] [CrossRef] [PubMed]
  46. Nanami, S.; Kawaguchi, H.; Tateno, R.; Li, C.; Katagiri, S. Sprouting traits and population structure of co-occurring Castanopsis species in an evergreen broad-leaved forest in southern China. Ecol. Res. 2004, 19, 341–348. [Google Scholar] [CrossRef]
  47. Homeier, J.; Breckle, S.W.; Günter, S.; Rollenbeck, R.T.; Leuschner, C. Tree Diversity, Forest Structure and Productivity along Altitudinal and Topographical Gradients in a Species-Rich Ecuadorian Montane Rain Forest. Biotropica 2010, 42, 140–148. [Google Scholar] [CrossRef]
  48. Acharya, B.K.; Chettri, B.; Vijayan, L. Distribution pattern of trees along an elevation gradient of Eastern Himalaya, India. Acta Oecol. 2011, 37, 329–336. [Google Scholar] [CrossRef]
  49. Parthasarathy, N. Changes in forest composition and structure in three sites of tropical evergreen forest around Sengaltheri, Western Ghats. Curr. Sci. India 2001, 80, 389–393. [Google Scholar]
  50. Kumar, A.; Marcot, B.G.; Saxena, A. Tree species diversity and distribution patterns in tropical forests of Garo Hills. Curr. Sci. 2006, 91, 1370–1381. [Google Scholar]
  51. Gentry, A.H. Changes in plant community diversity and floristic composition on environmental and geographical gradients. Ann. Mo. Bot. Gard. 1988, 75, 1–34. [Google Scholar] [CrossRef]
  52. O’Brien, E.M.; Field, R.; Whittaker, R.J. Climatic gradients in woody plant (tree and shrub) diversity: Water-energy dynamics, residual variation, and topography. Oikos 2000, 89, 588–600. [Google Scholar] [CrossRef]
  53. Knapp, A.K.; Fahnestock, J.T.; Hamburg, S.P.; Statland, L.B.; Seastedt, T.R.; Schimel, D.S. Landscape patterns in soil-plant water relations and primary production in tallgrass prairie. Ecology 1993, 74, 549–560. [Google Scholar] [CrossRef]
  54. Wolf, J.A.; Fricker, G.A.; Meyer, V.; Hubbell, S.P.; Gillespie, T.W.; Saatchi, S.S. Plant species richness is associated with canopy height and topography in a neotropical forest. Remote Sens. 2012, 4, 4010–4021. [Google Scholar] [CrossRef]
  55. Enoki, T. Microtopography and distribution of canopy trees in a subtropical evergreen broad-leaved forest in the northern part of Okinawa Island, Japan. Ecol. Res. 2003, 18, 103–113. [Google Scholar] [CrossRef]
  56. Legendre, P.; Mi, X.; Ren, H.; Ma, K.; Yu, M.; Sun, I.F.; He, F. Partitioning beta diversity in a subtropical broad-leaved forest of China. Ecology 2009, 90, 663–674. [Google Scholar] [CrossRef] [PubMed]
  57. Geris, J.; Tetzlaff, D.; McDonnell, J.; Soulsby, C. The relative role of soil type and tree cover on water storage and transmission in northern headwater catchments. Hydrol. Process. 2015, 29, 1844–1860. [Google Scholar] [CrossRef]
  58. Martinez-Fernandez, J.; Hernandez-Santana, V. Soil water reserve estimation and vegetation relationships in a Mediterranean sub-humid forested catchment. Hydrol. Res. 2012, 43, 167–178. [Google Scholar] [CrossRef]
  59. Wu, G.; Zhang, Z.; Wang, D.; Shi, Z.; Zhu, Y. Interactions of soil water content heterogeneity and species diversity patterns in semi-arid steppes on the Loess Plateau of China. J. Hydrol. 2014, 519, 1362–1367. [Google Scholar] [CrossRef]
  60. Wang, Z.; Hou, Y.; Fang, H.; Yu, D.; Zhang, M.; Xu, C.; Chen, M.; Sun, L. Effects of plant species diversity on soil conservation and stability in the secondary succession phases of a semihumid evergreen broadleaf forest in China. J. Soil Water Conserv. 2012, 67, 311–320. [Google Scholar] [CrossRef]
  61. Mathys, A.; Coops, N.C.; Waring, R.H. Soil water availability effects on the distribution of 20 tree species in western North America. For. Ecol. Manag. 2014, 313, 144–152. [Google Scholar] [CrossRef]
  62. Saxton, K.E.; Rawls, W.J.; Romberger, J.S.; Papendick, R.I. Estimating generalized soil-water characteristics from texture. Soil Sci. Soc. Am. J. 1986, 50, 1031–1036. [Google Scholar] [CrossRef]
  63. Saxton, K.E.; Rawls, W.J. Soil Water Characteristic Estimates by Texture and Organic Matter for Hydrologic Solutions. Soil Sci. Soc. Am. J. 2006, 70, 1569–1578. [Google Scholar] [CrossRef]
  64. Zhang, L.; Mi, X.; Shao, H.; Ma, K. Strong plant-soil associations in a heterogeneous subtropical broad-leaved forest. Plant Soil 2011, 347, 211–220. [Google Scholar] [CrossRef]
  65. Fleischbein, K.; Wilcke, W.; Goller, R.; Boy, J.; Valarezo, C.; Zech, W.; Knoblich, K. Rainfall interception in a lower montane forest in Ecuador: Effects of canopy properties. Hydrol. Process. 2005, 19, 1355–1371. [Google Scholar] [CrossRef]
  66. Tilman, D. Resource Competition and Community Structure; Princeton University Press: Princeton, NJ, USA, 1982. [Google Scholar]
  67. Holdridge, L.R. Determination of world plant formations from simple climatic data. Science 1947, 105, 267–268. [Google Scholar] [CrossRef] [PubMed]
  68. Silvertown, J. Plant coexistence and the niche. Trends Ecol. Evol. 2004, 19, 605–611. [Google Scholar] [CrossRef]
  69. Hubbell, S.P. The Unified Neutral Theory of Biodiversity and Biogeography (MPB-32); Princeton University Press: Princeton, NJ, USA, 2001; Volume 32. [Google Scholar]
  70. Whittaker, R.H. Dominance and Diversity in Land Plant Communities Numerical relations of species express the importance of competition in community function and evolution. Science 1965, 147, 250–260. [Google Scholar] [CrossRef] [PubMed]
  71. Warner, R.R.; Chesson, P.L. Coexistence mediated by recruitment fluctuations: A field guide to the storage effect. Am. Nat. 1985, 125, 769–787. [Google Scholar] [CrossRef]
  72. Mittelbach, G.G.; Schemske, D.W.; Cornell, H.V.; Allen, A.P.; Brown, J.M.; Bush, M.B.; Harrison, S.P.; Hurlbert, A.H.; Knowlton, N.; Lessios, H.A. Evolution and the latitudinal diversity gradient: Speciation, extinction and biogeography. Ecol. Lett. 2007, 10, 315–331. [Google Scholar] [CrossRef] [PubMed]
  73. Harrison, S.; Cornell, H. Toward a better understanding of the regional causes of local community richness. Ecol. Lett. 2008, 11, 969–979. [Google Scholar] [CrossRef] [PubMed]
Figure 1. Location of study area and sampling sites.
Forests 07 00216 g001
Figure 2. Tree diversity and structural parameters as a function of altitude. Correlations are significant (p < 0.05): (a) observed and rarefied (N = 59) richness; (b) Shannon diversity index and evenness; (c) basal area (m2/ha) and tree density; (d) stem slenderness (ratio of height to dbh).
Forests 07 00216 g002
Figure 3. Biplots diagram of redundancy analysis (RDA) on tree species diversity constrained by topographic and water conservation data. S (observed richness), H′ (Shannon diversity index), E (Shannon evenness index) are response variables (solid line with arrow). Altitude, aspect, slope, bulk density (bd), soil water content (swc) and soil non-capillary porosity (snc) are as explanatory variables (dashed line with arrow).
Forests 07 00216 g003
Figure 4. Variance partitioning with partial RDA of tree species diversity based on topography and soil water. Monte Carlo permutation test was performed on each set without the effect of the other by permuting samples freely (999 permutations).
Forests 07 00216 g004
Table 1. Structural and diversity parameters for forest types A (ridges) and B (valley) at altitudes of 200–1200 m a.s.l. Means ± S.E. are given. Significant differences (p < 0.05) between the two forest types are indicated in bold text.
Stand StructureType A (Means ± S.E.)Type B (Means ± S.E.)
Tree species richness (/600 m2) (plots, dbh ≥ 5 cm)18.15 ± 2.3021.85 ± 4.14
Species diversity (rarefied to per N = 59 trees; /600 m2) (plots, dbh ≥ 5 cm)14.92 ± 1.5517.57 ± 2.15
Shannon diversity (plots, dbh ≥ 5 cm)2.35 ± 0.132.67 ± 0.14
Shannon evenness (plots, dbh ≥ 5 cm)0.81 ± 0.390.87 ± 0.40
Slenderness (height/dbh) (plots, dbh ≥ 5 cm)76.31 ± 14.0880.38 ± 13.73
Average dbh (cm) (plots, dbh ≥ 5 cm)11.58 ± 1.7115.58 ± 2.37
Average height (m) (plots, dbh ≥ 5 cm)9.38 ± 1.3410.66 ± 0.55
Basal area (m2) (plots, dbh ≥ 5 cm; /ha)21.96 ± 4.9644.01 ± 6.11
Tree stem number (/ha) (plots, dbh ≥ 5 cm)1514.77 ± 310.891563.30 ± 216.36

