
Enhanced Soil Carbon Storage under Agroforestry and Afforestation in Subtropical China

Abstract
:1. Introduction
2. Materials and Methods
2.1. Study Site
2.2. Experimental Design

| Parameters | Range | Mean ± SD |
|---|---|---|
| pH | 8.1–8.4 | 8.2 ± 0.2 |
| Organic matter (g·kg−1) | 9.1–9.6 | 9.4 ± 0.2 |
| Total N (g·kg−1) | 0.6–0.7 | 0.6 ± 0.0 |
| Hydrolysable N (mg·kg−1) | 59.2–67.5 | 62.4 ± 4.7 |
| Total P (g·kg−1) | 0.5–0.6 | 0.5 ± 0.0 |
| Available P (mg·kg−1) | 36.7–45.9 | 41.2 ± 4.4 |
| Total K (g·kg−1) | 1.0–1.1 | 1.1 ± 0.1 |
| Available K (mg·kg−1) | 28.6–35.3 | 31.5 ± 3.6 |
2.3. Sample Protocol
2.4. Sample Analysis
2.5. Statistical Analysis
3. Results
3.1. TSC
| Soil layer | 0–80 cm | 0–20 cm | 20–40 cm | 40–60 cm | 60–80 cm |
|---|---|---|---|---|---|
| P | F = 943.3 | F = 209.0 | F = 380.1 | F = 150.5 | F = 60.4 |
| p < 0.001 | p < 0.001 | P < 0.001 | p < 0.001 | p < 0.001 | |
| Y | F = 32.9 | F = 64.7 | F = 11.5 | F = 1.1 | F = 1.3 |
| p < 0.001 | p < 0.001 | p < 0.001 | p = 0.382 | p = 0.279 | |
| P × Y | F = 3.7 | F = 6.2 | F = 3.1 | F = 2.2 | F = 1.5 |
| p < 0.001 | p < 0.001 | p = 0.002 | p = 0.020 | p = 0.167 |
| Soil layer | Planting treatment | Year | ||||
|---|---|---|---|---|---|---|
| 2008 | 2009 | 2010 | 2011 | 2012 | ||
| 0–80 cm | GRP | 60.5 ± 1.3 b | 61.3 ± 3.5 c | 64.0 ± 2.8 b | 68.6 ± 3.8 c | 74.3 ± 3.5 b c |
| GM | 78.2 ± 2.9 a | 75.1 ± 3.5 a | 87.4 ± 4.4 a | 90.5 ± 3.5 a | 93.3 ± 3.8 a | |
| GWP | 64.3 ± 2.7 b | 68.32 ± 2.9 b | 65.0 ± 2.9 b | 74.8 ± 1.7 b | 78.9 ± 3.6 b | |
| G | 60.5 ± 1.1 b | 60.4 ± 3.5 c | 65.1 ± 3.3 b | 66.2 ± 3.8 c | 72.4 ± 1.2 c | |
| WP | 34.5 ± 3.1 c | 30.6 ± 2.9 d | 32.9 ± 2.3 c | 34.5 ± 2.4 d | 33.9 ± 3.4 d | |
| 0–20 cm | GRP | 19.6 ± 2.0 a, a, a | 21.6 ± 0.5 bc, a, a | 26.0 ± 1.8 b, a, b | 28.4 ± 2.6 b, a, b | 32.0 ± 3.2 b, a, c |
| GM | 22.1 ± 1.3 a, a, a | 26.9 ± 1.7 a, a, b | 32.8 ± 3.9 a, a, c | 34.4 ± 1.3 a, a, cd | 36.4 ± 1.4 a, a, d | |
| GWP | 22.4 ± 0.9 a, a, a | 24.0 ± 0.4 ab, a, a | 27.0 ± 3.1 b, a, b | 32.0 ± 1.5 a, a, c | 37.6 ± 2.5 a, a, d | |
| G | 19.2 ± 1.2 a, a, a | 19.1 ± 2.0 c, a, b | 19.7 ± 1.7 c, a, ab | 24.1 ± 1.8 c, a, c | 29.6 ± 1.7 b, a, d | |
| WP | 14.1 ± 1.2 b, a, a | 12.6 ± 1.3 d, a, a | 14.1 ± 1.3 d, a, a | 14.3 ± 2.1 d, a, a | 14.2 ± 1.2 c, a, a | |
| 20–40 cm | GRP | 19.5 ± 0.9 b, a, a | 18.2 ± 1.0 b, b, a | 18.7 ± 1.5 b, b, a | 20.4 ± 0.9 b, b, a | 21.5 ± 1.2 b, b, a |
| GM | 26.9 ± 1.2 a, b, ab | 24.3 ± 2.0 a, a, b | 27.5 ± 1.0 a, b, ab | 27.2 ± 1.2 a, b, ab | 28.7 ± 1.1 a, b, b | |
| GWP | 21.1 ± 1.1 b, a, a | 22.9 ± 0.8 a, a, a | 19.3 ± 0.9 b, b, a | 21.9 ± 1.3 b, b, a | 22.7 ± 1.4 b, b, a | |
| G | 20.3 ± 0.2 c, b, b | 19.9 ± 1.1 b, a, a | 20.9 ± 0.5 b, a, a | 21.6 ± 0.6 b, b, ab | 22.3 ± 1.0 b, b, ab | |
| WP | 11.8 ± 0.9 d,b,a | 8.9 ± 1.3 c, b, a | 10.2 ± 1.5 c, b, a | 11.3 ± 1.0 c, b, a | 11.0 ± 1.1 c, b, a | |
| 40–60 cm | GRP | 13.5 ± 1.3 b, b, a | 14.1 ± 4.1 a, c, a | 12.1 ± 1.3 b, c, a | 11.7 ± 1.1 b, c, a | 13.4 ± 0.9 b, c, a |
| GM | 16.9 ± 0.8 a, c, a | 14.8 ± 1.3 a, b, a | 16.5 ± 1.1 a, c, a | 18.8 ± 1.6 a, c, a | 17.7 ± 1.3 a, c, a | |
| GWP | 11.4 ± 0.4 b, b, ab | 14.2 ± 1.7 a, b, b | 11.1 ± 0.9 b, c, ab | 12.2 ± 0.9 b, c, ab | 10.1 ± 1.0 b c, c, a | |
| G | 13.4 ± 0.6 b, c, a | 13.1 ± 1.0 a, b, a | 11.9 ± 1.4 b, b, a | 13.4 ± 1.5 b, c, a | 11.3 ± 0.7 c, c, a | |
| WP | 5.0 ± 1.6 c, c, a | 4.2 ± 1.1 b, c, a | 4.2 ± 1.1 c, c, a | 3.8 ± 0.8 c, c, a | 4.4 ± 0.9 d, c, a | |
| 60–80 cm | GRP | 7.9 ± 1.0 b, c, a | 7.4 ± 0.5 b, d, a | 7.1 ± 0.8 b, d, a | 8.0 ± 1.0 b, d, a | 7.2 ± 0.7 b, d, a |
| GM | 12.3 ± 1.2 a, d, a | 9.2 ± 1.7 a, c, a | 10.4 ± 1.2 a, d, a | 9.9 ± 1.2 a, d, a | 10.3 ± 1.6 a, d, a | |
| GWP | 9.4 ± 1.6 b, b, a | 7.2 ± 1.1 b, c, a | 7.6 ± 1.0 b, d, a | 8.6 ± 1.8 b, d, a | 8.3 ± 0.9 b, c, a | |
| G | 7.6 ± 0.6 b, d, a | 8.2 ± 1.5 b, c, a | 7.4 ± 1.1 b, c, a | 6.9 ± 1.4 b, d, a | 9.1 ± 0.9 b, d, a | |
| WP | 3.7 ± 0.9 c, c, a | 4.8 ± 1.0 c, c, a | 4.1 ± 0.8 c, c, a | 5.0 ± 0.4 c, c, a | 4.1 ± 1.1 c, c, a | |
| GRP | GWP | GM | G | WP | |
|---|---|---|---|---|---|
| L | F = 205.0 | F = 1893.2 | F = 540.8 | F = 448.3 | F = 294.9 |
| p < 0.001 | p < 0.001 | p < 0.001 | p < 0.001 | p < 0.001 | |
| Y | F = 9.2 | F = 22.4 | F = 11.4 | F = 8.2 | F = 0.9 |
| p = 0.004 | p < 0.001 | p = 0.002 | p = 0.006 | p = 0.531 | |
| L × Y | F = 7.3 | F = 14.2 | F = 11.0 | F = 12.2 | F = 1.2 |
| p < 0.001 | p < 0.001 | p < 0.001 | p = 0.006 | p = 0.362 |
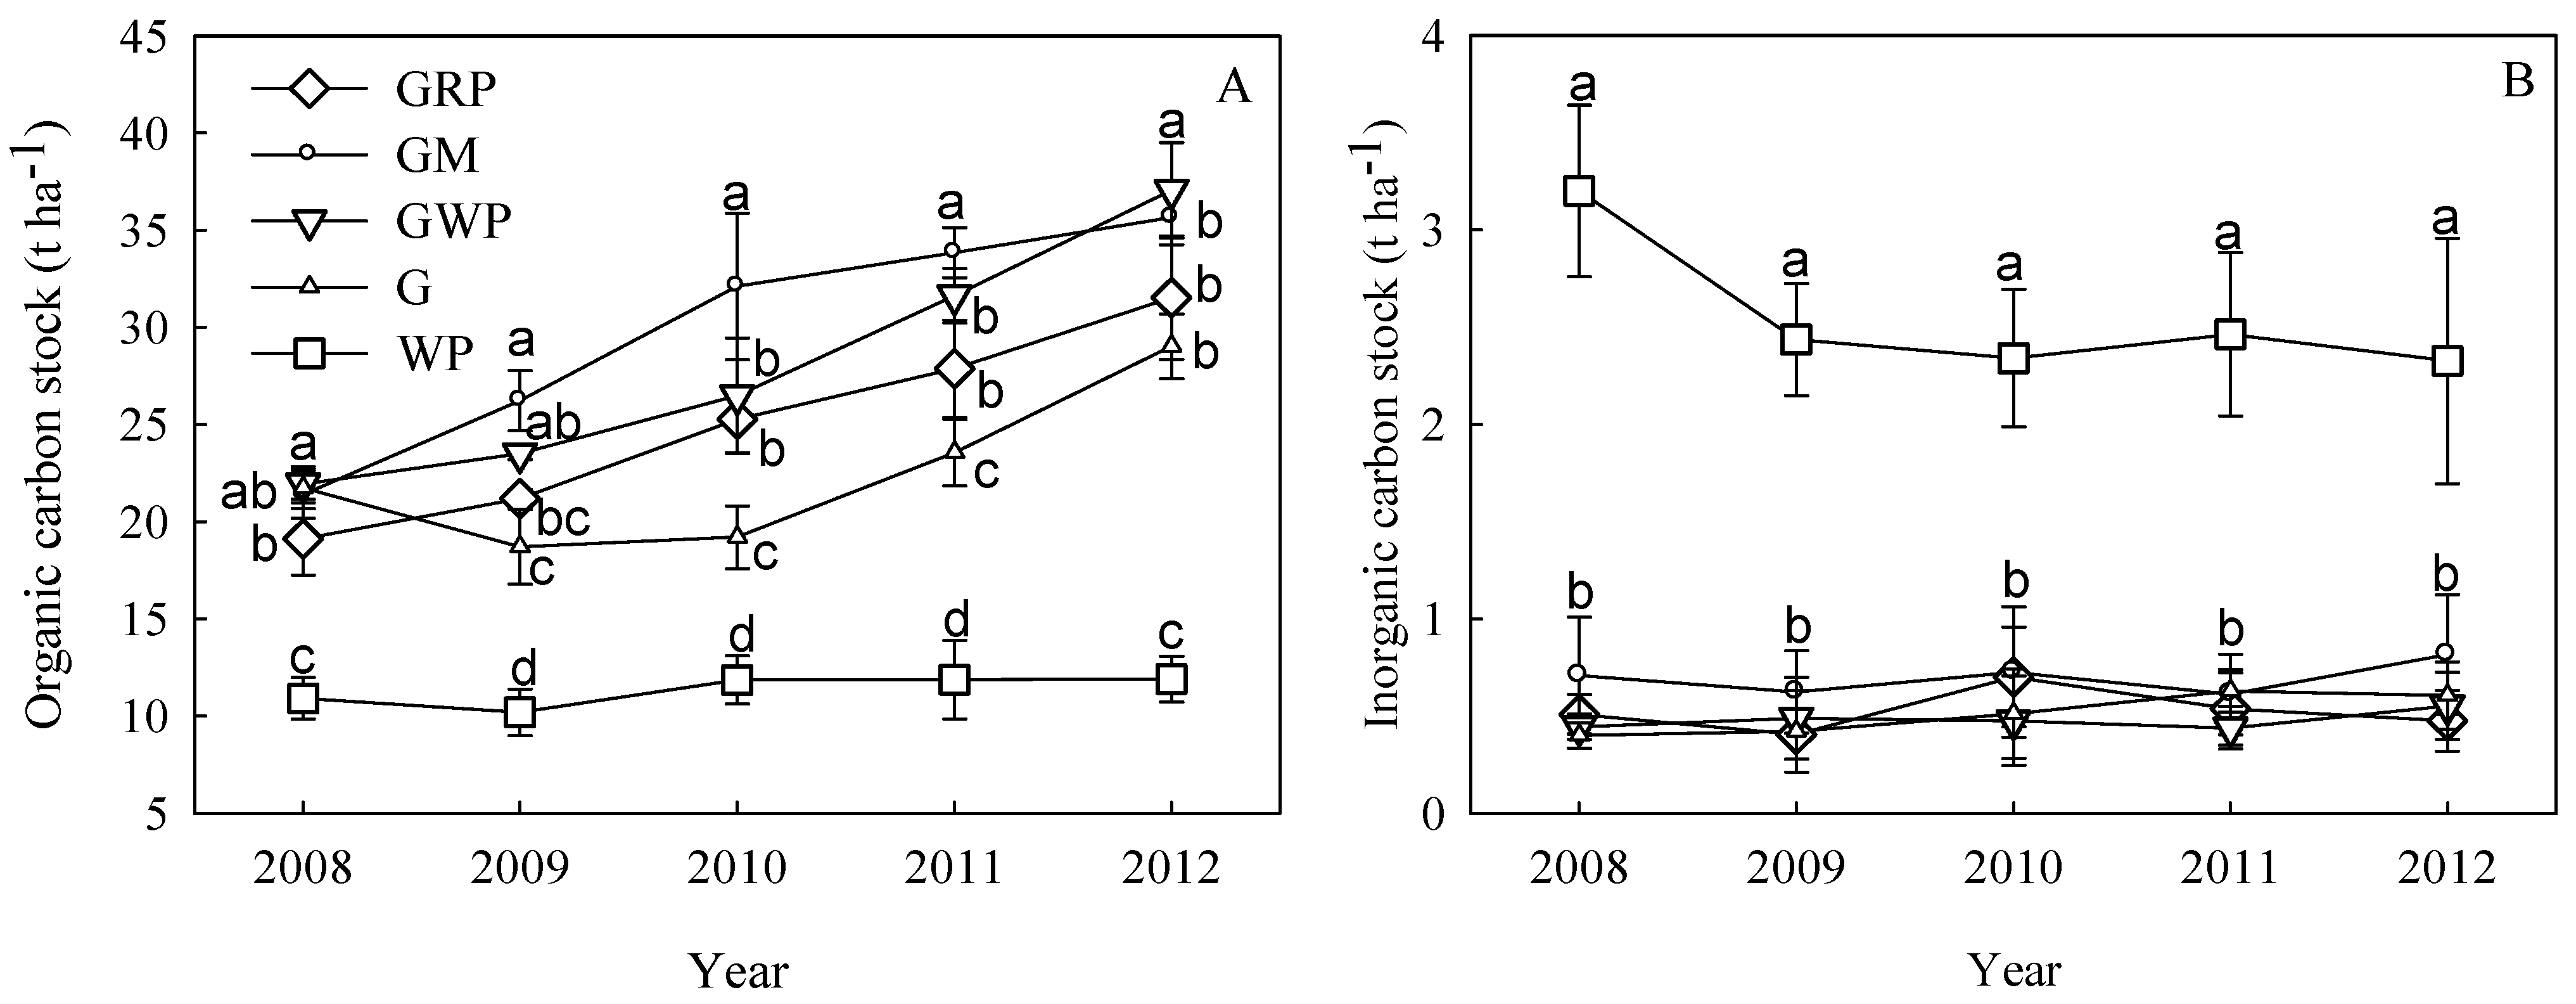
3.2. SOC and SIC
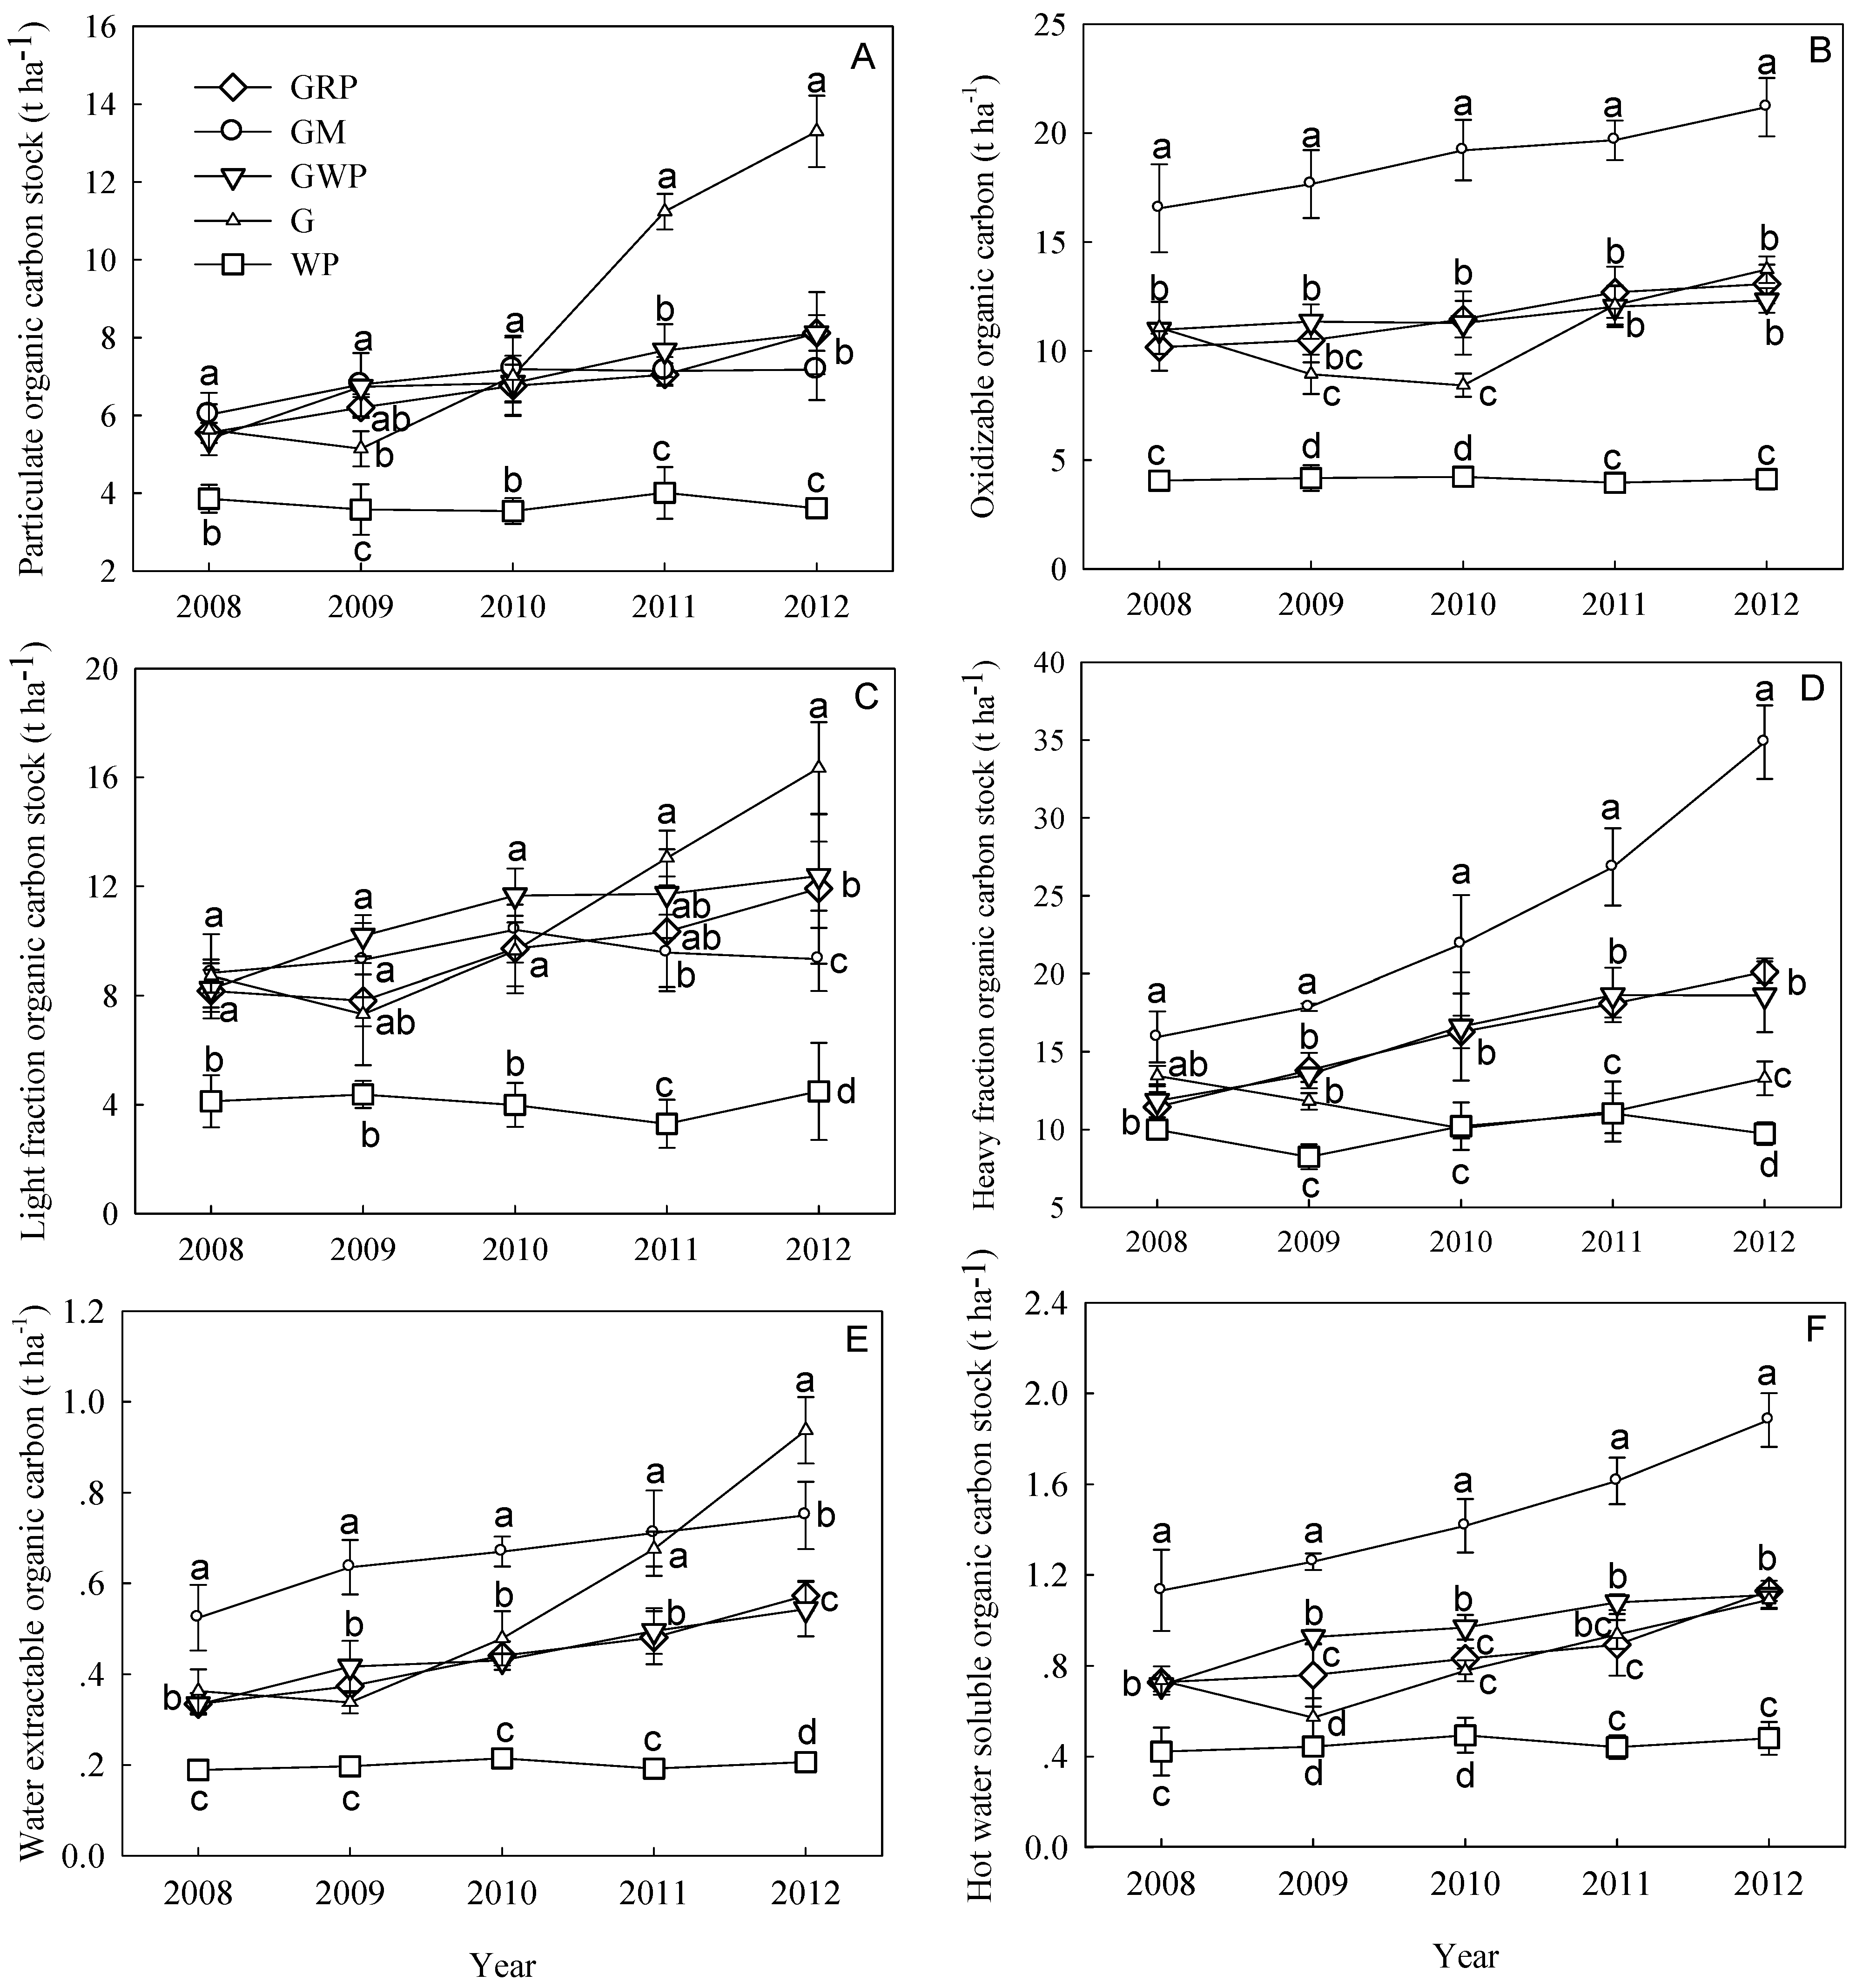
3.3. C fractions
| Source | SOC | SIC | POC | OOC | LOC | HOC | WEOC | HSOC |
|---|---|---|---|---|---|---|---|---|
| P | F = 162.3 | F = 41.2 | F = 118.8 | F = 274.9 | F = 70.1 | F = 91.9 | F = 136.5 | F = 206.9 |
| p < 0.001 | p < 0.001 | p < 0.001 | p < 0.001 | p < 0.001 | p < 0.001 | p < 0.001 | p < 0.001 | |
| Y | F = 61.3 | F = 0.1 | F = 54.9 | F = 18.9 | F = 14.6 | F = 60.6 | F = 74.5 | F = 62.1 |
| p < 0.001 | p = 0.990 | p < 0.001 | p < 0.001 | p < 0.001 | p < 0.001 | p < 0.001 | p < 0.001 | |
| P×Y | F = 6.5 | F = 0.7 | F = 17.2 | F = 3.9 | F = 4.1 | F = 15.6 | F = 13.3 | F = 6.6 |
| p < 0.001 | p = 0.786 | p < 0.001 | p < 0.001 | p < 0.001 | p < 0.001 | p < 0.001 | p < 0.001 |
4. Discussion
4.1. Storage
4.2. Fractions
5. Conclusions
Acknowledgments
Author Contributions
Conflicts of Interest
References
- IPCC (Intergovernmental Panel on Climate Change). Climate Change: The Physical Science Basis. Contribution of Working Group I to the Fifth Assessment Report of the Intergovernmental Panel on Climate Change; Cambridge University Press: Cambridge, UK, 2013. [Google Scholar]
- Schmidt, W.I.; Torn, M.S.; Abiven, S.; Dittmar, T.; Guggenberger, G.; Janssens, I.A.; Kleber, M.; Kogel-Knabner, I.; Lehmann, J.; Manning, D.A.C.; et al. Persistence of soil organic matter as an ecosystem property. Nature 2011, 478, 49–56. [Google Scholar] [CrossRef] [PubMed]
- Smith, P.; Fang, C.; Dawson, J.; Moncrieff, J. Impact of global warming on soil organic carbon. Adv. Agron. 2008, 97, 1–43. [Google Scholar]
- Le Quéré, C.; Andres, R.J.; Boden, T.; Conway, T.; Houghton, R.A.; House, J.I.; Marland, G.; Peters, G.P.; van der Werf, G.; Ahlström, A.; et al. The global CO2 budget 1959–2011. Earth Syst. Sci. Data 2013, 5, 165–185. [Google Scholar] [CrossRef]
- Benbi, D.K.; Brar, K.; Toor, A.S.; Singh, P.; Singh, H. Soil carbon pools under poplar-based agroforestry, ricewheat, and maize-wheat cropping systems in semi-arid India. Nutr. Cycl. Agroecosyst. 2012, 92, 107–118. [Google Scholar] [CrossRef]
- Turrión, M.-B.; Schneider, K.; Gallardo, J.F. Carbon accumulation in Umbrisols under Quercus pyrenaica forests: Effects of bedrock and annual precipitation. Catena 2009, 79, 1–8. [Google Scholar] [CrossRef]
- Davidson, E.A.; Janssens, I.A. Temperature sensitivity of soil carbon decomposition and feedbacks to climate change. Nature 2006, 440, 165–173. [Google Scholar] [CrossRef] [PubMed]
- Mahdavi, K.; Choupanian, A.; Gheytouri, M.; Mahdavi, M. Effect of physiographic factors on soil carbon sequestration in Kermanshah (Iran). Int. J. For. Soil Eros. 2012, 2, 159–162. [Google Scholar]
- Jobbágy, E.G.; Jackson, R.B. The vertical distribution of soil organic carbon and its relation to climate and vegetation. Ecol. Appl. 2000, 10, 423–436. [Google Scholar] [CrossRef]
- Poeplau, C.; Don, A.; Vesterdal, L.; Leifeld, J.; Van Wesemael, B.; Schumacher, J.; Gensior, A. Temporal dynamics of soil organic carbon after land-use change in the temperate zone—Carbon response functions as a model approach. Glob. Chang. Biol. 2011, 17, 2415–2427. [Google Scholar] [CrossRef]
- Don, A.; Schumacher, J.; Freibauer, A. Impact of tropical land-use change on soil organic carbon stocks—A meta-analysis. Glob. Chang. Biol. 2011, 17, 1658–1670. [Google Scholar] [CrossRef]
- Lorenz, K.; Lal, R. Soil organic carbon sequestration in agroforestry systems. A review. Agron. Sustain. Dev. 2014, 34, 443–454. [Google Scholar] [CrossRef]
- Santore, R.C.; Driscoll, C.T.; Aloi, M. A model of soil organic matter: Its function in temperate forest soil development. In Carbon Forms and Functions in Forest Soils; McFee, W.W., Kelly, J.M., Eds.; Soil Science Society of America: Madison, WI, USA, 1995; pp. 275–298. [Google Scholar]
- Sherrod, L.A.; Peterson, G.A.; Westfall, D.G.; Ahuja, L.R. Soil organic carbon pools after 12 years in no-till dryland agroecosystems. Soil Sci. Soc. Am. J. 2005, 67, 1533–1543. [Google Scholar] [CrossRef]
- Chan, K.Y. Soil particulate organic carbon under different land use and management. Soil Use Manag. 2001, 17, 217–221. [Google Scholar] [CrossRef]
- Bremer, E.; Jansen, H.H.; Johnston, A.M. Sensitivity of total, light fraction and mineralizable organic matter to management practices in a Lethbridge soil. Can. J. Soil Sci. 1994, 74, 131–138. [Google Scholar] [CrossRef]
- Boyer, J.N.; Groffmann, P.M. Bioavailability of water-extractable organic carbon fractions in forest and agricultural soil profiles. Soil Biol. Biochem. 1996, 28, 783–790. [Google Scholar] [CrossRef]
- Degryze, S.; Six, J.; Paustian, K.; Morris, S.J.; Paul, E.A.; Merck, R. Soil organic carbon pool changes following land-use conversions. Glob. Chang. Biol. 2004, 10, 1120–1113. [Google Scholar] [CrossRef]
- Hsiung, W. Ecosystem engineering and modern agroforestry. In Agroforestry: Research and Practice; Hsiung, W., Chandler, P.F., Eds.; China Forestry Publishing House: Beijing, China, 1996; pp. 1–10. [Google Scholar]
- Nair, P.K.R.; Kumar, B.M.; Nair, V.D. Agroforestry as a strategy for carbon sequestration. J. Plant Nutr. Soil Sci. 2009, 172, 10–23. [Google Scholar] [CrossRef]
- Nair, P.K.R.; Nair, V.D.; Kumar, B.M.; Haile, S.G. Soil carbon sequestration in tropical agroforestry systems: A feasibility appraisal. Environ. Sci. Policy 2009, 12, 1099–1111. [Google Scholar] [CrossRef]
- IPCC (Intergovernmental Panel on Climate Change). Land Use, Land-use Change, and Forestry: A Special Report of the Intergovernmental Panel on Climate Change; Cambridge University Press: Cambridge, UK, 2000. [Google Scholar]
- Kumar, B.M.; Nair, P.K.R. Carbon Sequestration Potential of Agroforestry Systems: Opportunities and Challenges; Springer: New York, NY, USA, 2011. [Google Scholar]
- Blair, G.J.; Lefroy, R.D.B.; Lisle, L. Soil carbon fractions based on their degree of oxidation, and the development of a carbon management index for agricultural systems. Aust. J. Agric. Res. 1995, 46, 1459–1466. [Google Scholar] [CrossRef]
- Skjemstad, J.O.; Swift, R.S.; McGowan, J.A. Comparison of the particulate organic carbon and permanganate oxidation methods for estimating labile soil organic carbon. Soil Res. 2006, 44, 255–263. [Google Scholar] [CrossRef]
- Vesterdal, L.; Clarke, N.; Sigurdsson, B.D.; Gundersen, P. Do tree species influence soil carbon stocks in temperate and boreal forests? For. Ecol. Manag. 2013, 309, 4–18. [Google Scholar] [CrossRef]
- Li, D.; Niu, S.; Luo, Y. Global patterns of the dynamics of soil carbon and nitrogen stocks following afforestation: A meta-analysis. New Phytol. 2012, 195, 172–181. [Google Scholar] [CrossRef] [PubMed]
- Nair, P.K.R. Agroforestry systems and environmental quality: Introduction. J. Environ. Qual. 2011, 40, 784–790. [Google Scholar] [CrossRef] [PubMed]
- Gupta, N.; Kukal, S.S.; Bawa, S.S.; Dhaliwal, G.S. Soil organic carbon and aggregation under poplar based agroforestry system in relation to tree age and soil type. Agrofor. Syst. 2009, 76, 27–35. [Google Scholar] [CrossRef]
- Cao, F. Ecological Basis for Ginkgo Agroforestry Systems. Ph.D. Thesis, Department of Forest Sciences, The University of British Columbia, Vancouver, BC, Canada, 2004. [Google Scholar]
- Xu, J. Evaluation of growth benefits in different comprehensive management patterns of Ginkgo and citrus. Nonwood For. Res. 2006, 24, 32–34. (In Chinese) [Google Scholar]
- Wang, G.; Cao, F. Integrated evaluation of soil fertility in Ginkgo (Ginkgo biloba L.) agroforestry systems in Jiangsu, China. Agrofor. Syst. 2011, 83, 89–100. [Google Scholar] [CrossRef]
- Schumacher, B.A. Methods for the Determination of Total Organic Carbon (TOC) in Soil and Sediments; Report NCEA-C- 1282, EMASC-001; Ecological Risk Assessment Support Center, Office of Research and Development, US Environmental Protection Agency: Las Vegas, NV, USA, 2002.
- Yuan, K.L. Study of organomineral complex in soil: The primary study of oxidization stability of humus in organomineral complex in soil. Acta Pedol. Sin. 1963, 11, 286–293. [Google Scholar]
- Barreto, P.A.B.; Gama-Rodrigues, E.F.; Gama-Rodrigues, A.C.; Fontes, A.G.; Polidoro, J.C.; Moço, M.K.S.; Machado, R.C.R.; Baligar, V.C. Distribution of oxidizable organic C fractions in soils under cacao agroforestry systems in Southern Bahia, Brazil. Agrofor. Syst. 2011, 81, 213–220. [Google Scholar] [CrossRef]
- Gregorich, E.G.; Janzen, H.H. Storage of soil carbon in the light fraction and macro organic matter. In Advances in Soil Science: Structure and Organic Matter Storage in Agricultural Soils; Carter, M.R., Stewart, B.A., Eds.; CRC Press: Boca Raton, FL, USA, 1996; pp. 167–190. [Google Scholar]
- Hassink, J. Density fractions of soil macroorganic matter and microbial biomass as predictors of C and N mineralization. Soil Biol. Biochem. 1995, 27, 1099–1108. [Google Scholar] [CrossRef]
- Kay, B.D. Soil structure and organic carbon, a review. In Soil Processes and the Carbon Cycle; Lal, R., Kimble, J.M., Follett, R.F., Stewart, B.A., Eds.; CRC Press: Boca Raton, FL, USA, 1998; pp. 169–197. [Google Scholar]
- Tan, Z.; Lal, R.; Owens, L.; Izaurralde, R.C. Distribution of light and heavy fractions of soil organic carbon as related to land use and tillage practice. Soil Tillage Res. 2007, 92, 53–59. [Google Scholar] [CrossRef]
- Wander, M.M.; Traina, S.J. Organic matter fractions from organically and conventionally managed soils. I. Carbon and nitrogen distribution. Soil Sci. Soc. Am. J. 1996, 60, 1081–1087. [Google Scholar] [CrossRef]
- Janzen, H.H.; Campbell, C.A.; Brandt, S.A.; Lafond, G.P.; Townley-Smith, L. Light-fraction organic-matter in soils from long-term crop rotations. Soil Sci. Soc. Am. J. 1992, 56, 1799–1806. [Google Scholar] [CrossRef]
- Lu, X.; Fan, J.; Yan, Y.; Wang, X. Soil water soluble organic carbon under three alpine grassland types in Northern Tibet, China. Afr. J. Agric. Res. 2011, 6, 2066–2071. [Google Scholar]
- Schulz, E. Influence of site conditions and management on different soil organic matter (SOM) pools. Arch. Agron. Soil Sci. 2004, 50, 33–47. [Google Scholar] [CrossRef]
- McGill, W.B.; Cannon, K.B.; Robertson, J.A.; Cook, F.D. Dynamics of soil microbial biomass and water-soluble organic C in Breton L after 50 years of cropping to two rotations. Can. J. Soil Sci. 1986, 66, 1–19. [Google Scholar] [CrossRef]
- Ghani, A.; Dexter, M.; Perrott, K.W. Hot-water extractable carbon in soils: A sensitive measurement for determining impacts of fertilisation, grazing and cultivation. Soil Biol. Biochem. 2003, 35, 1231–1243. [Google Scholar] [CrossRef]
- Chen, L. The Effects of Carbon Stocks and Soil Carbon Cycle in Ginkgo Agroforestry Systems. Ph.D. Thesis, Nanjing Forestry University, Nanjing, China, 2013. [Google Scholar]
- Singh, K.; Chauhan, H.S.; Rajput, D.K.; Singh, D.V. Report of a 60-month study on litter production, changes in soil chemical properties and productivity under poplar (P. deltoides) and Eucalyptus hybrid interplanted with aromatic grasses. Agrofor. Syst. 1989, 9, 37–45. [Google Scholar] [CrossRef]
- Bunger, M.T.; Thomson, H.J. Root development as a factor in the success or failure of windbreak trees in the southern high plains. J. For. 1938, 36, 790–803. [Google Scholar]
- Farrar, J.L. Trees of the Northern United States and Canada; Blackwell Publishing: Ames, IA, USA, 1995. [Google Scholar]
- Jackson, R.B.; Canadell, J.; Ehleringer, J.R.; Mooney, H.A.; Sala, O.E.; Schulze, E.D. A global analysis of root distributions for terrestrial biomes. Oecologia 1996, 108, 389–411. [Google Scholar] [CrossRef]
- Cohen, J.C. Statistical Power Analysis. Curr. Dir. Psych. Sci. 1992, 1, 98–101. [Google Scholar] [CrossRef]
- Demessie, A.; Singh, B.R.; Lal, R. Soil carbon and nitrogen stocks under chronosequence of arm and traditional agroforestry land uses in Gambo District, Southern Ethiopia. Nutr. Cycl. Agroecosyst. 2013, 95, 365–375. [Google Scholar] [CrossRef]
- Wu, H.; Guo, Z.; Gao, Q.; Peng, C. Distribution of soil inorganic carbon storage and its changes due to agricultural land use activity in China. Agric. Ecosyst. Environ. 2009, 129, 413–421. [Google Scholar] [CrossRef]
- Shi, Y.; Baumann, F.; Ma, Y.; Song, C.; Kühn, P.; Scholten, T.; He, J.S. Organic and inorganic carbon in the topsoil of the Mongolian and Tibetan grasslands: Pattern, control and implications. Biogeosciences 2012, 9, 2287–2299. [Google Scholar] [CrossRef]
- Montagnini, F.; Sancho, F. Net nitrogen mineralization in soils under six indigenous tree species, an abandoned pasture and a secondary forest in the Atlantic lowlands of Costa Rica. Plant Soil 1994, 162, 117–124. [Google Scholar] [CrossRef]
- Wang, W.; Wei, X.; Liao, W.; Blanco, J.A.; Liu, Y.; Liu, S.; Liu, G.; Zhang, L.; Guo, X.; Guo, S. Evaluation of the effects of forest management strategies on carbon sequestration in evergreen broad-leaved (Phoebe bournei) plantation forests using FORECAST ecosystem model. For. Ecol. Manag. 2012, 300, 21–32. [Google Scholar] [CrossRef]
- Watson, R.T.; Noble, I.R.; Bolin, B.; Ravindranath, N.H.; Verardo, J.D.; Dokken, D.J. Land Use, Land-Use Change and Forestry: IPCC Special Report; Cambridge University Press: Cambridge, UK, 2000. [Google Scholar]
- Bi, J.; Blanco, J.A.; Seely, B.; Kimmins, J.P.; Ding, Y.; Welham, C. Yield decline in Chinese-fir plantations: A simulation investigation with implications for model complexity. Can. J. For. Res. 2007, 37, 1615–1630. [Google Scholar] [CrossRef]
- Neff, J.C.; Townsend, A.R.; Gleixner, G.; Lehman, S.J.; Turnbull, J.; Bowman, W.D. Variable effects of nitrogen additions on the stability and turnover of soil carbon. Nature 2002, 419, 915–917. [Google Scholar] [CrossRef] [PubMed]
- Jastrow, J.D. Soil aggregate formation and the accrual of particulate and mineral-associated organic matter. Soil Biol. Biochem. 1996, 28, 665–676. [Google Scholar] [CrossRef]
- Song, B.; Niu, S.; Zhang, Z.; Yang, H.; Li, L.; Wan, S. Light and Heavy Fractions of Soil Organic Matter in Response to Climate Warming and Increased Precipitation in a Temperate Steppe. PLoS ONE 2012, 7, e33217. [Google Scholar] [CrossRef] [PubMed]
© 2015 by the authors; licensee MDPI, Basel, Switzerland. This article is an open access article distributed under the terms and conditions of the Creative Commons Attribution license (http://creativecommons.org/licenses/by/4.0/).
Share and Cite
Wang, G.; Welham, C.; Feng, C.; Chen, L.; Cao, F. Enhanced Soil Carbon Storage under Agroforestry and Afforestation in Subtropical China. Forests 2015, 6, 2307-2323. https://doi.org/10.3390/f6072307
Wang G, Welham C, Feng C, Chen L, Cao F. Enhanced Soil Carbon Storage under Agroforestry and Afforestation in Subtropical China. Forests. 2015; 6(7):2307-2323. https://doi.org/10.3390/f6072307
Chicago/Turabian StyleWang, Guibin, Clive Welham, Chaonian Feng, Lei Chen, and Fuliang Cao. 2015. "Enhanced Soil Carbon Storage under Agroforestry and Afforestation in Subtropical China" Forests 6, no. 7: 2307-2323. https://doi.org/10.3390/f6072307
APA StyleWang, G., Welham, C., Feng, C., Chen, L., & Cao, F. (2015). Enhanced Soil Carbon Storage under Agroforestry and Afforestation in Subtropical China. Forests, 6(7), 2307-2323. https://doi.org/10.3390/f6072307