
Modeling Tree Characteristics of Individual Black Pine (Pinus nigra Arn.) Trees for Use in Remote Sensing-Based Inventory

 ,
,  , ,
, , 
Abstract
:
1. Introduction
2. Materials and Methods
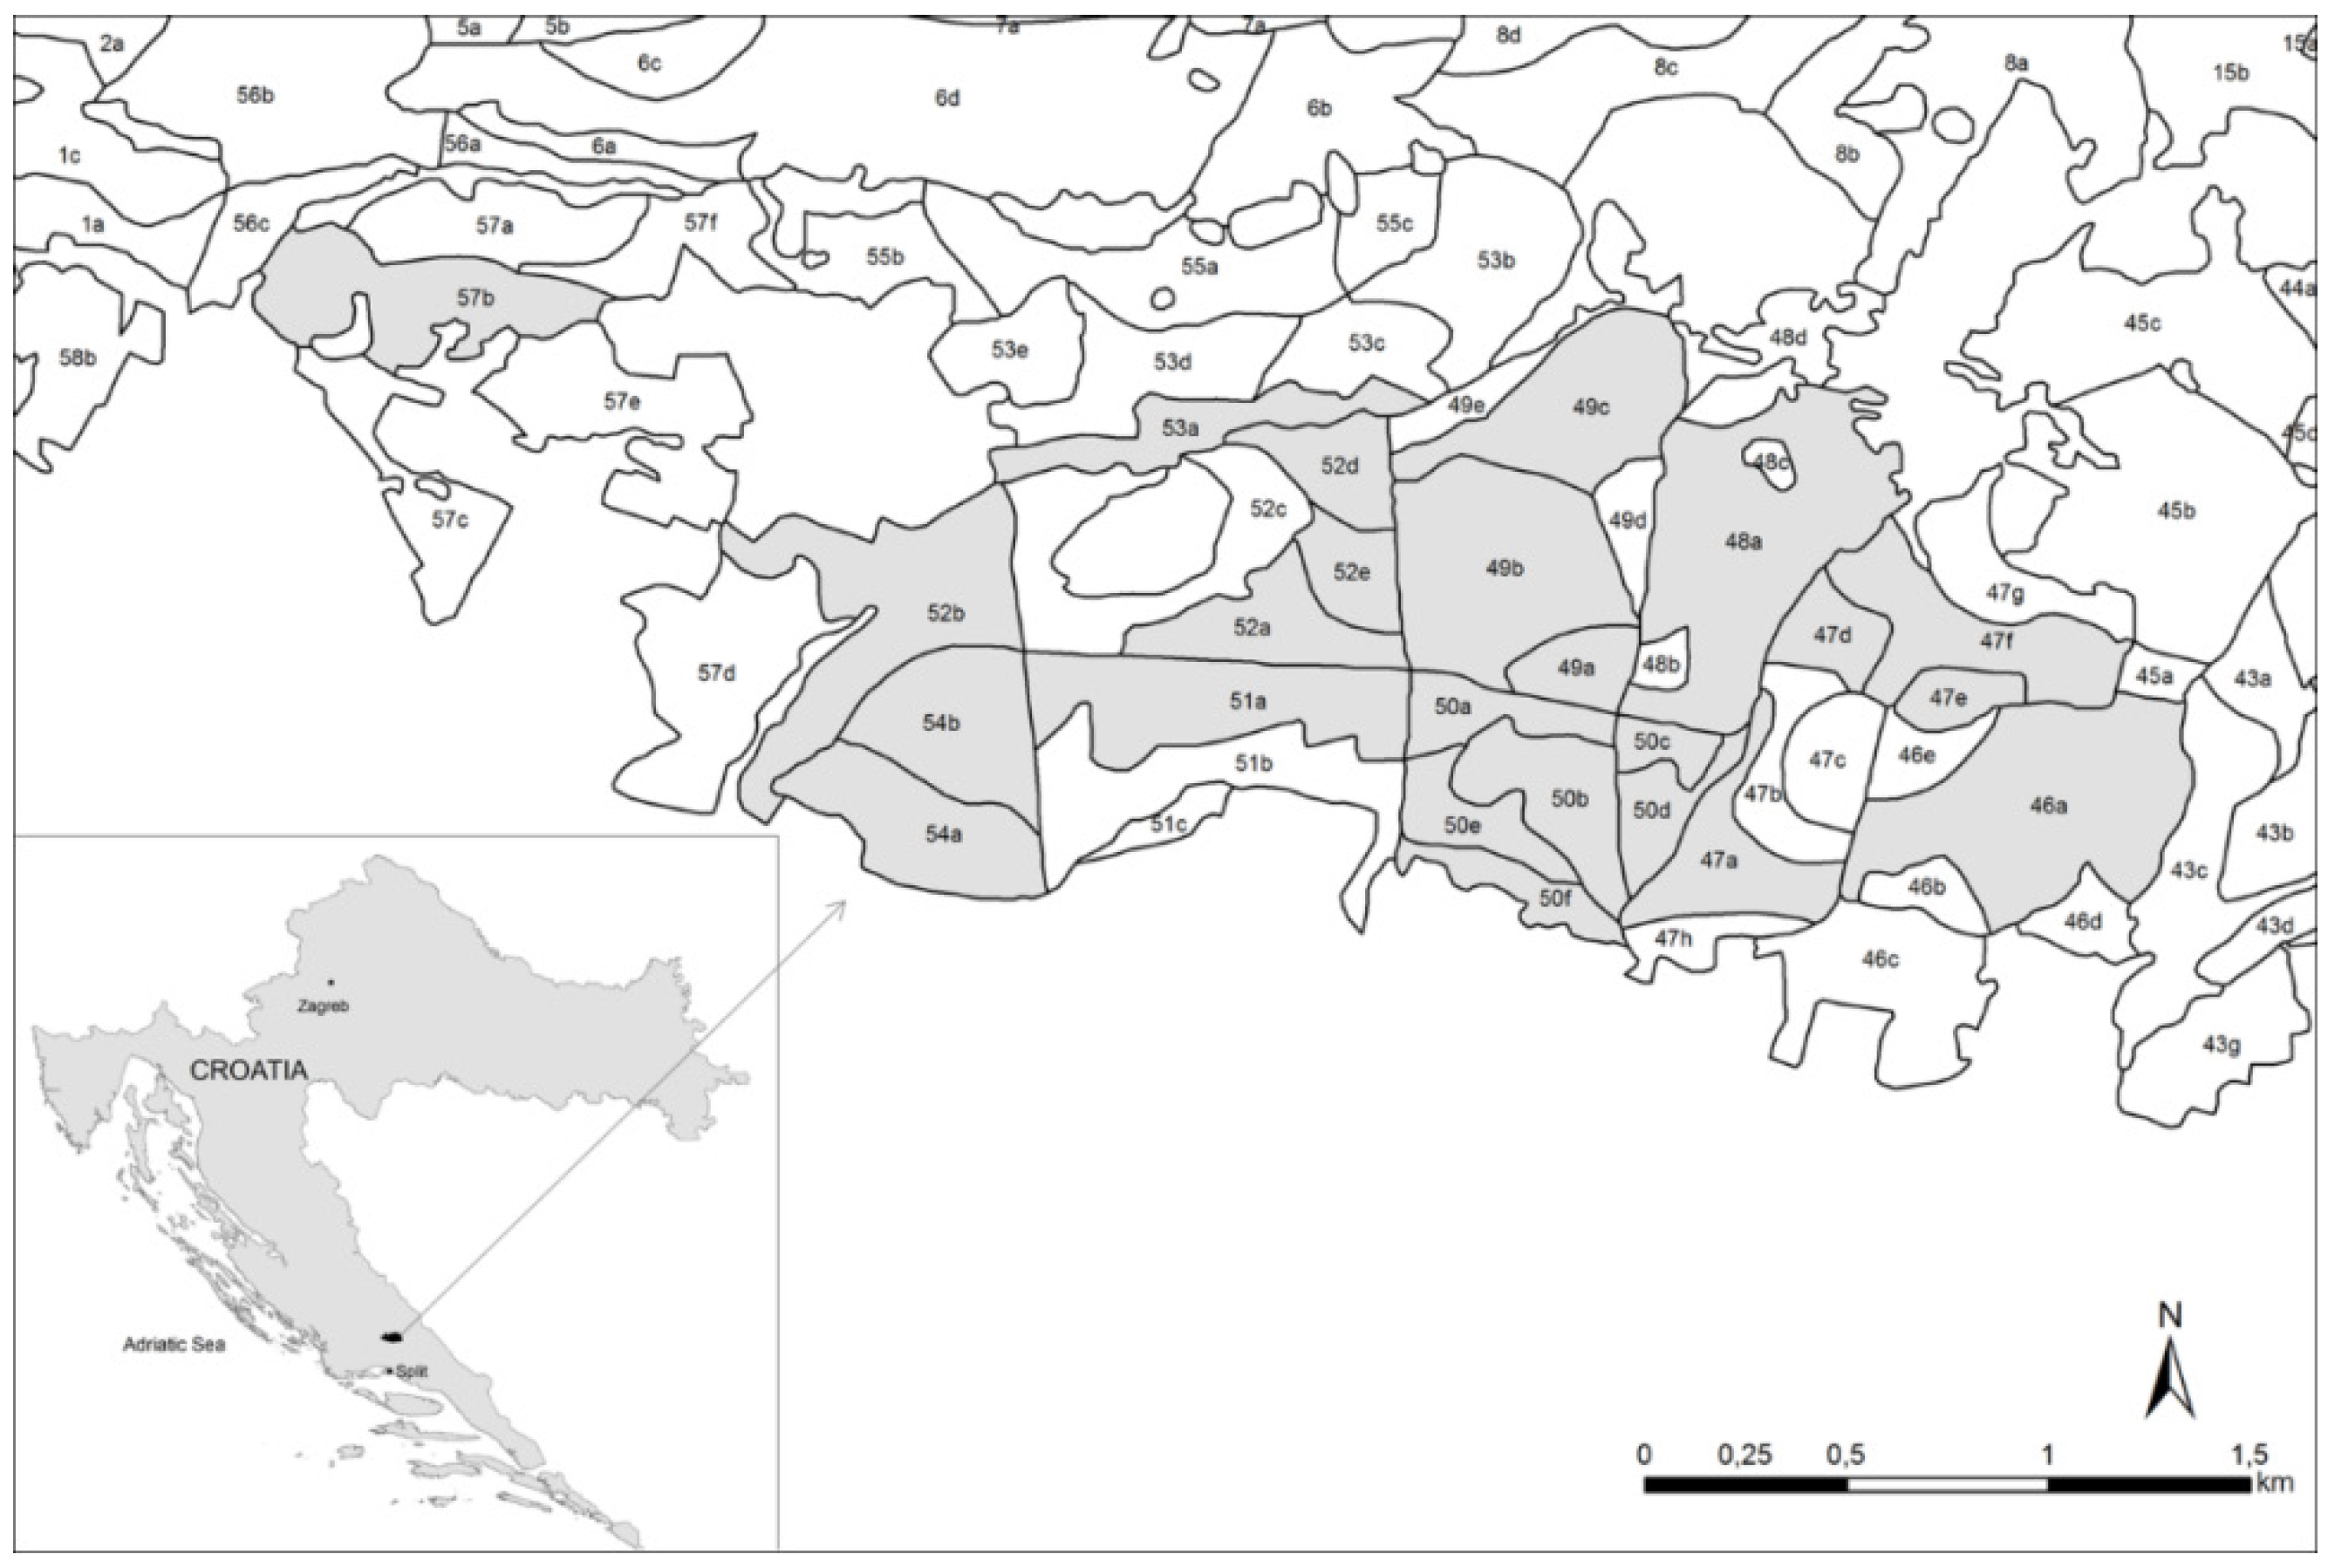
2.1. Research Area


| Age Class | Age (years) | Number of Stands | Site Class | Stand Density (Trees·ha−1) | Basal Area (m2·ha−1) | Volume (m3·ha−1) | Annual Increment (m3·ha−1) |
|---|---|---|---|---|---|---|---|
| II | 21–40 | 6 | II | 944 | 17.8 | 80.7 | 4.7 |
| (794–1186) | (15.5–22.6) | (70.9–105.1) | (3.7–6.2) | ||||
| III | 41–60 | 3 | II | 1246 | 34.9 | 278.7 | 6.7 |
| (981–1401) | (28.9–38.2) | (298.8–304.1) | (5.5–7.3) | ||||
| IV | 61–80 | 6 | II | 876 | 26.7 | 224.2 | 4.2 |
| (496–1221) | (17.0–34.2) | (144.6–285.1) | (2.5–5.1) | ||||
| V | 81–100 | 6 | II | 493 | 25 | 237.9 | 3.5 |
| (348–859) | (21.5–35.4) | (182.8–308.3) | (2.8–5.0) | ||||
| VI | 101–120 | 2 | II | 700 | 36.3 | 330.7 | 5.2 |
| (681–719) | (34.7–37.9) | (283.7–377.7) | (5.1–5.3) |
2.2. Data Collection
| Group | Variable | Description | Type | Units | Mean | SD | Min | Max |
|---|---|---|---|---|---|---|---|---|
| Tree variables | DBH | Diameter at breast height | Dependent | cm | 22.2 | 7.7 | 10.2 | 55.0 |
| V | Merchantable tree volume | Dependent | m3 | 0.32 | 0.28 | 0.02 | 1.97 | |
| AGB | Aboveground biomass | Dependent | kg | 215.46 | 179.19 | 32.72 | 1467.85 | |
| H | Tree height | Independent | m | 13.5 | 3.8 | 4.6 | 25.9 | |
| CD | Crown diameter | Independent | m | 2.88 | 1.41 | 0.42 | 8.35 | |
| Stand variables | DCT | Distance to the closest tree | Independent | m | 2.05 | 1.05 | 0.30 | 8.82 |
| N | Stand density | Independent | trees·ha−1 | 1038 | 580 | 127 | 891 | |
| SA | Stand age | Independent | years | 70 | 25 | 33 | 102 | |
| Site variables | Z | Terrain altitude | Independent | m | 564.3 | 45.8 | 467.4 | 694.7 |
| S | Terrain slope | Independent | 21.5 | 17.3 | 0 | 84.8 | ||
| A | Terrain aspect (0–360°) | Independent | 190.2 | 93.9 | 0 | 357.9 |
2.3. Statistical Analysis
3. Results
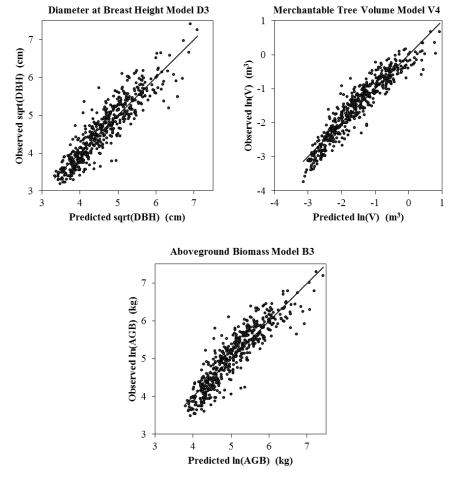
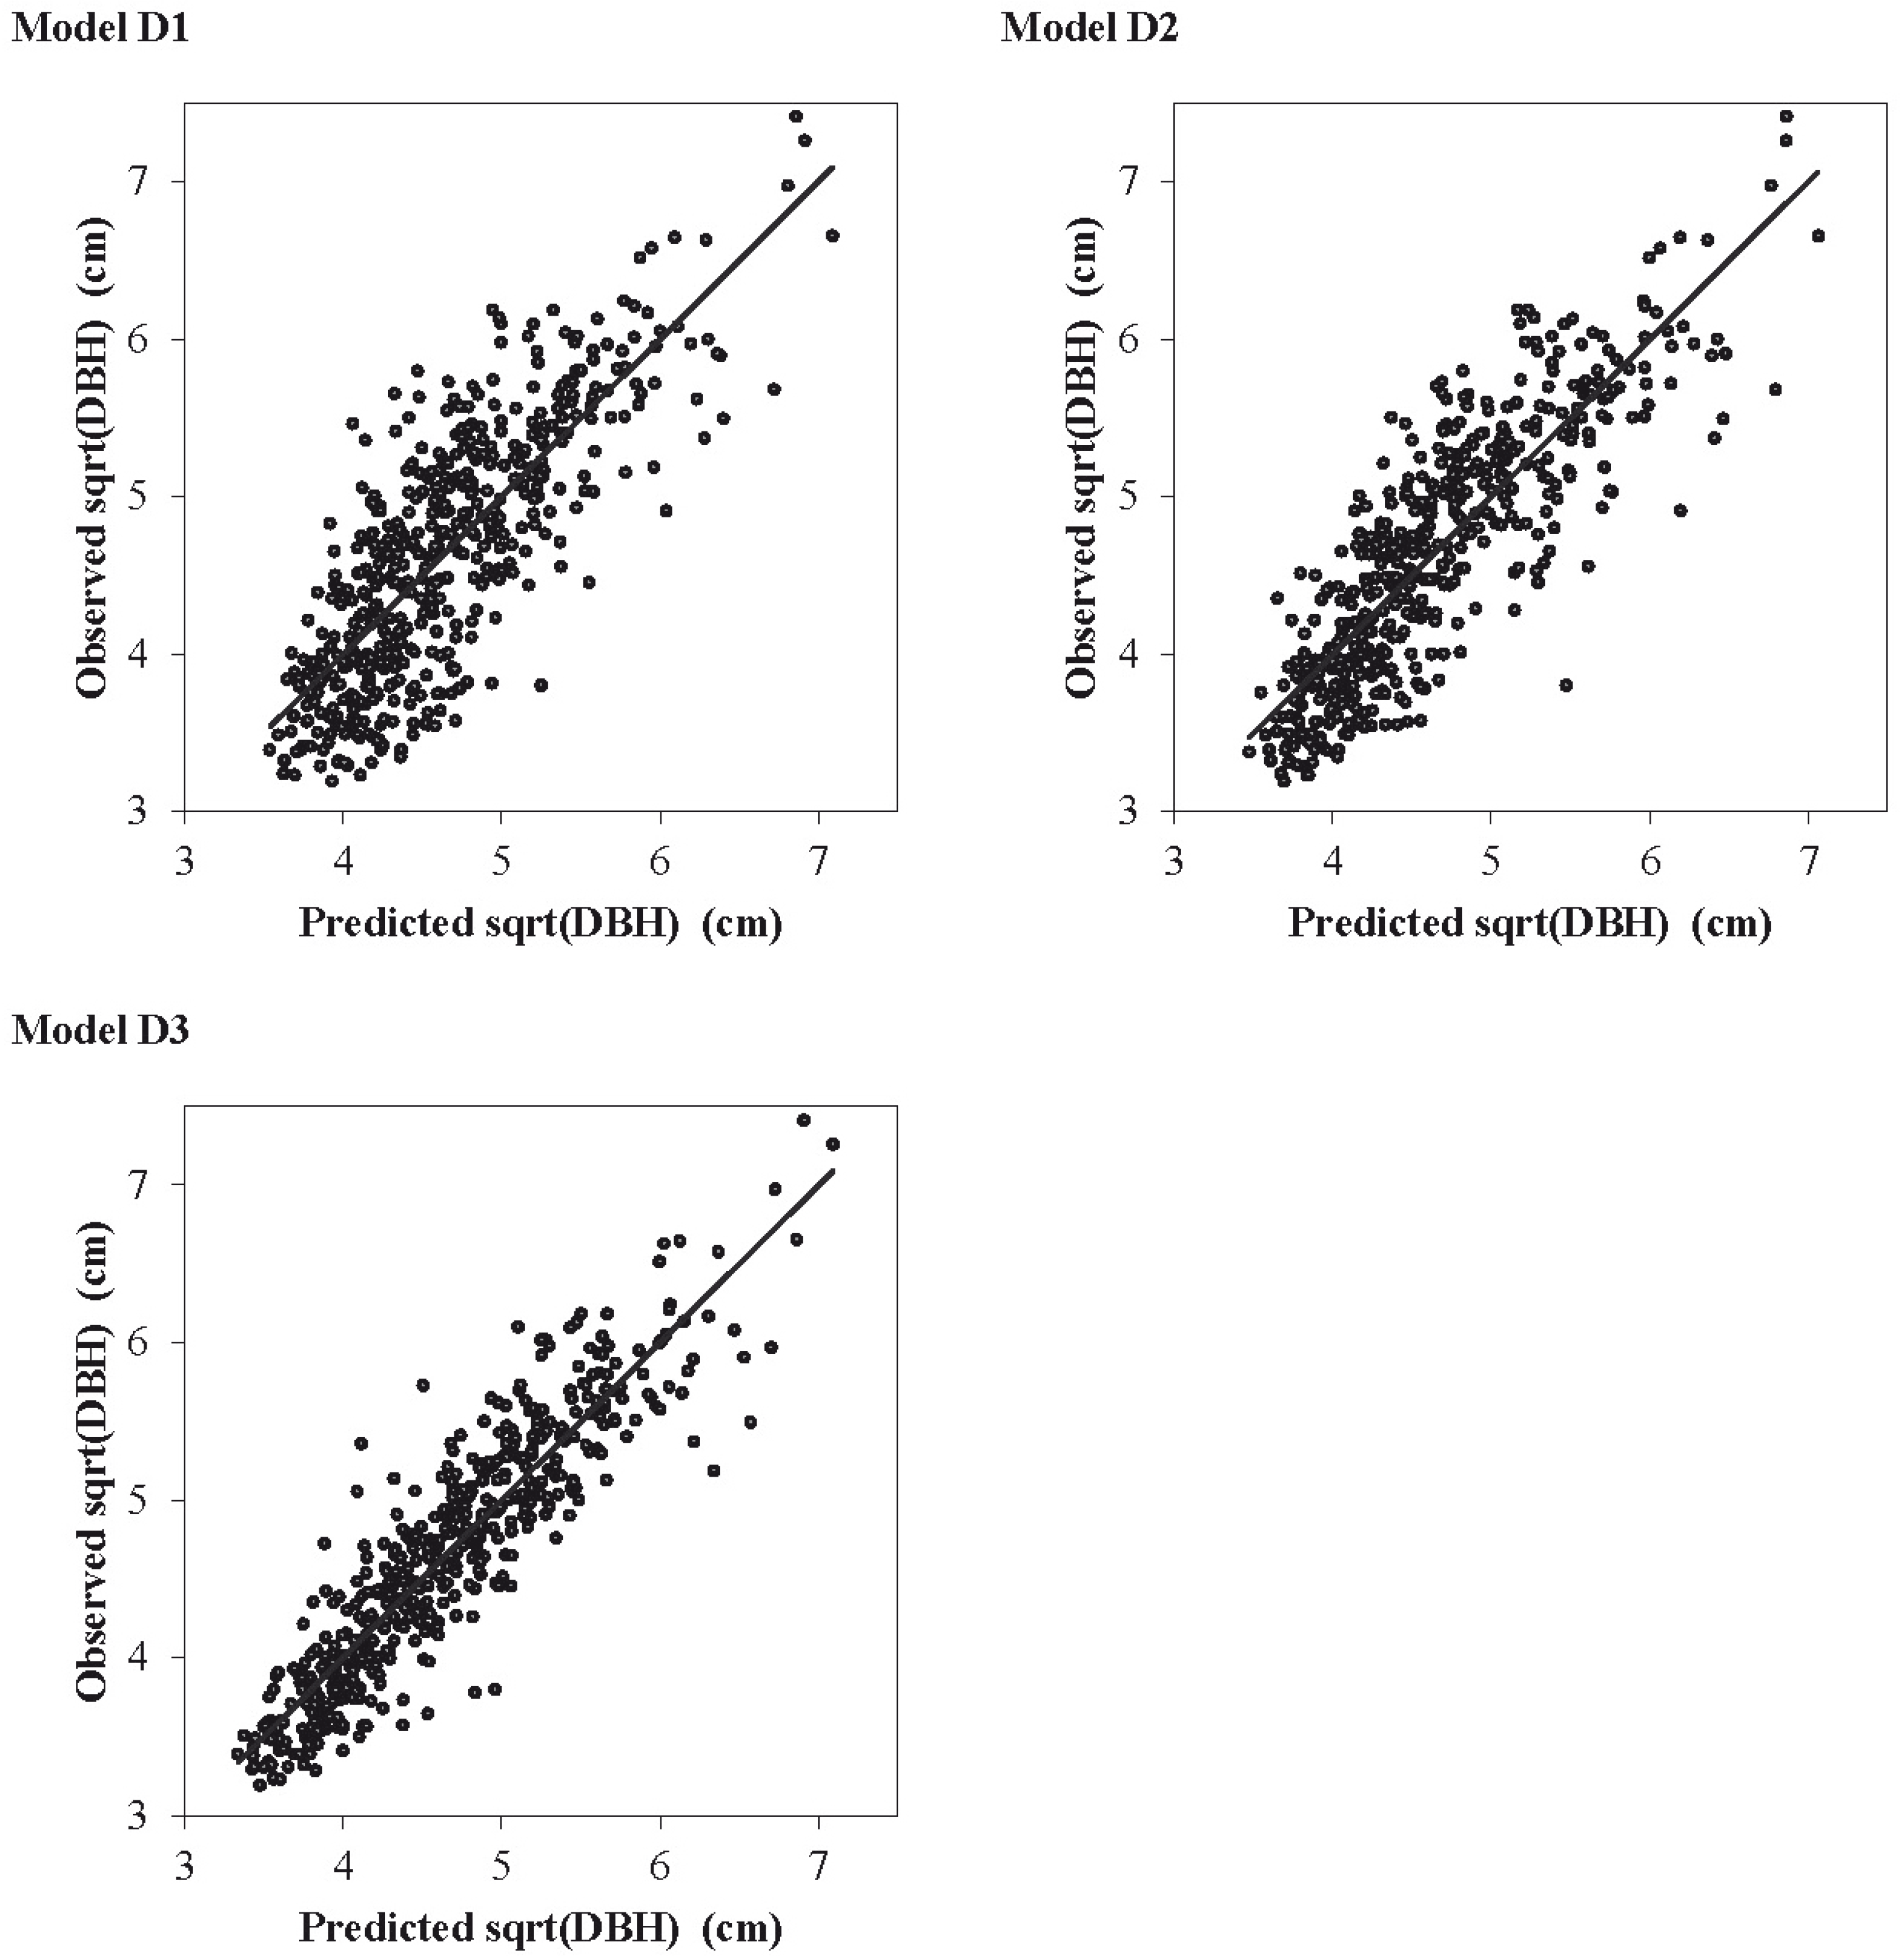
3.1. Diameter at Breast Height (DBH) Models
| No. | Regression model | Parameters | R2 | RMSEsqrt (cm) | RMSEbt (cm) | ||
|---|---|---|---|---|---|---|---|
| Symbol | Value | Standard Error | |||||
| D1 | sqrt(DBH) = β0 + β1∙CD | β0 | 3.351* | 0.050 | 0.625* | 0.491 | 4.634 |
| β1 | 0.448* | 0.016 | |||||
| D2 | sqrt(DBH) = β0 + β1∙CD + β2∙SA | β0 | 2.809* | 0.062 | 0.712* | 0.430 | 4.145 |
| β1 | 0.393* | 0.014 | |||||
| β2 | 0.010* | <0.001 | |||||
| D3 | sqrt(DBH) = β0 + β1∙CD + β2∙H | β0 | 2.225* | 0.056 | 0.832* | 0.328 | 3.226 |
| β1 | 0.377* | 0.011 | |||||
| β2 | 0.099* | 0.004 | |||||
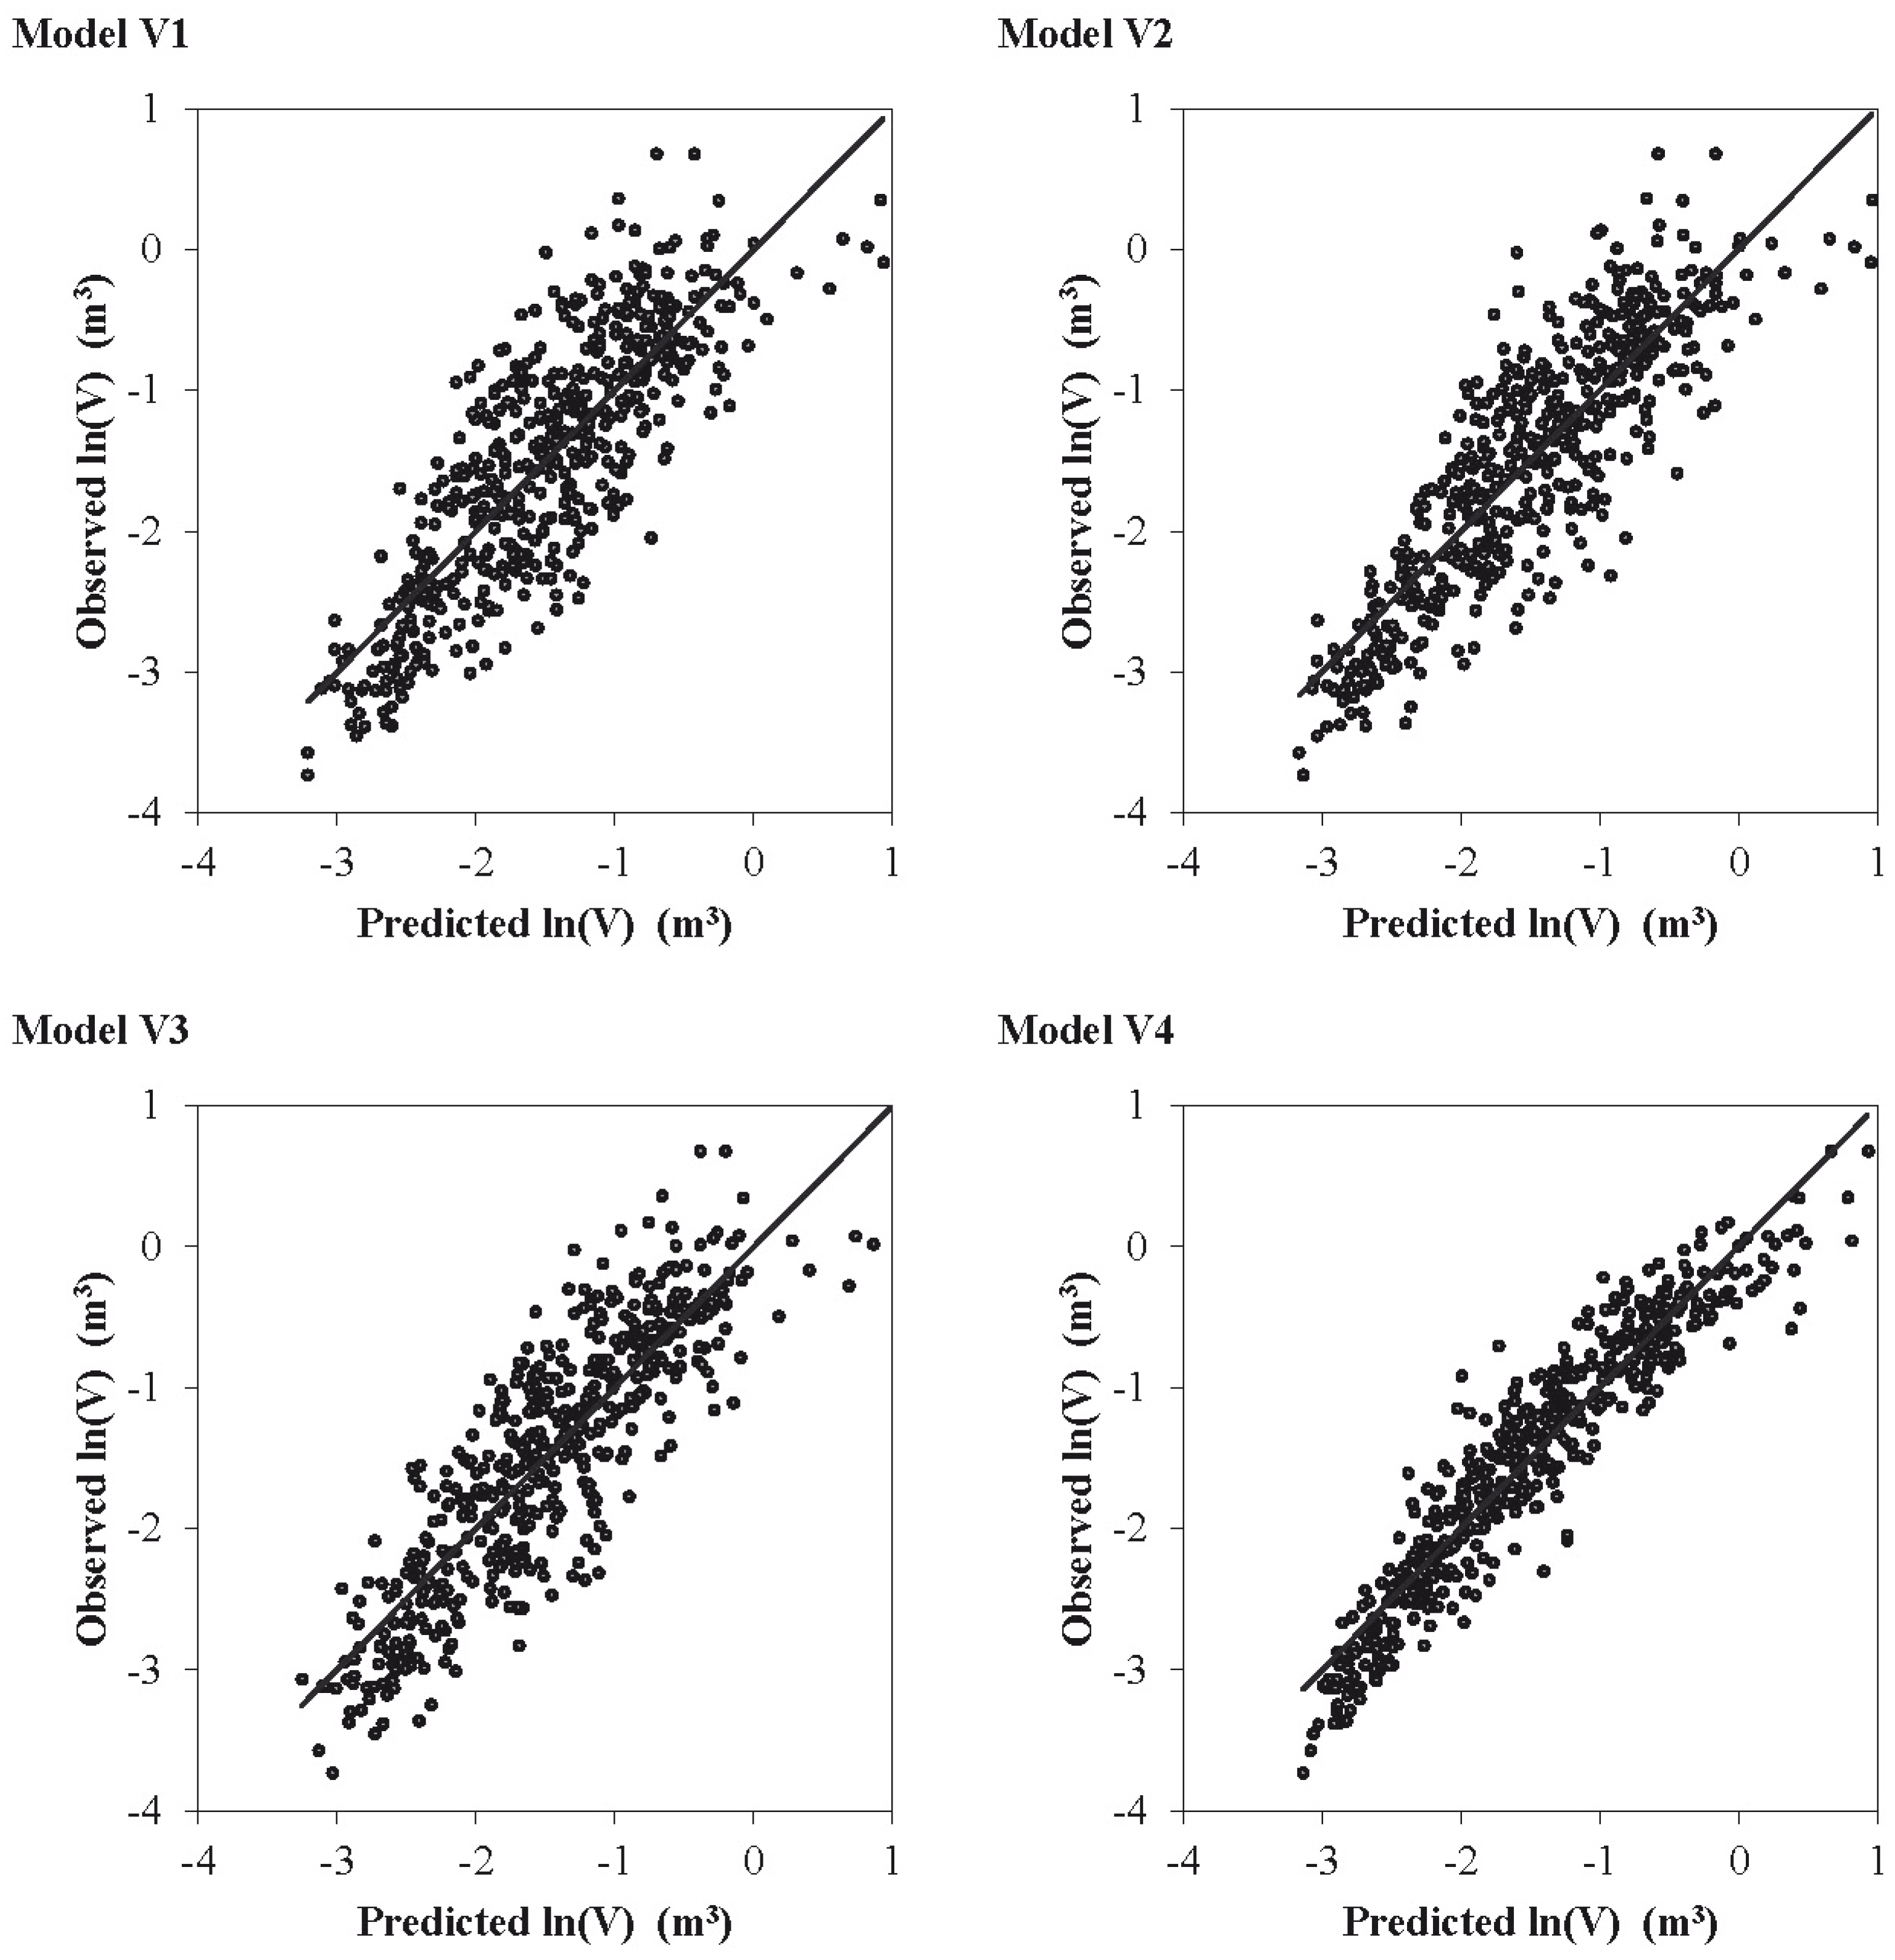
3.2. Merchantable Tree Volume (V) Models
| No. | Regression Model | Parameters | R2 | RMSEln (m3) | RMSEbt (m3) | ||
|---|---|---|---|---|---|---|---|
| Symbol | Value | Standard Error | |||||
| V1 | ln(V) = β0 + β1∙H | β0 | −4.106 * | 0.083 | 0.684 * | 0.506 | 0.233 |
| β1 | 0.195 * | 0.006 | |||||
| V2 | ln(V) = β0 + β1∙H + β2∙DCT | β0 | −4.503 * | 0.085 | 0.738 * | 0.461 | 0.223 |
| β1 | 0.194 * | 0.005 | |||||
| β2 | 0.199 * | 0.020 | |||||
| V3 | ln(V) = β0 + β1∙H + β2∙N | β0 | −3.745 * | 0.081 | 0.747 * | 0.453 | 0.226 |
| β1 | 0.198 * | 0.005 | |||||
| β2 | −0.001 * | <0.001 | |||||
| V4 | ln(V) = β0 + β1∙CD + β2∙H | β0 | −4.574 * | 0.051 | 0.889 * | 0.299 | 0.144 |
| β1 | 0.165 * | 0.004 | |||||
| β2 | 0.299 * | 0.010 | |||||

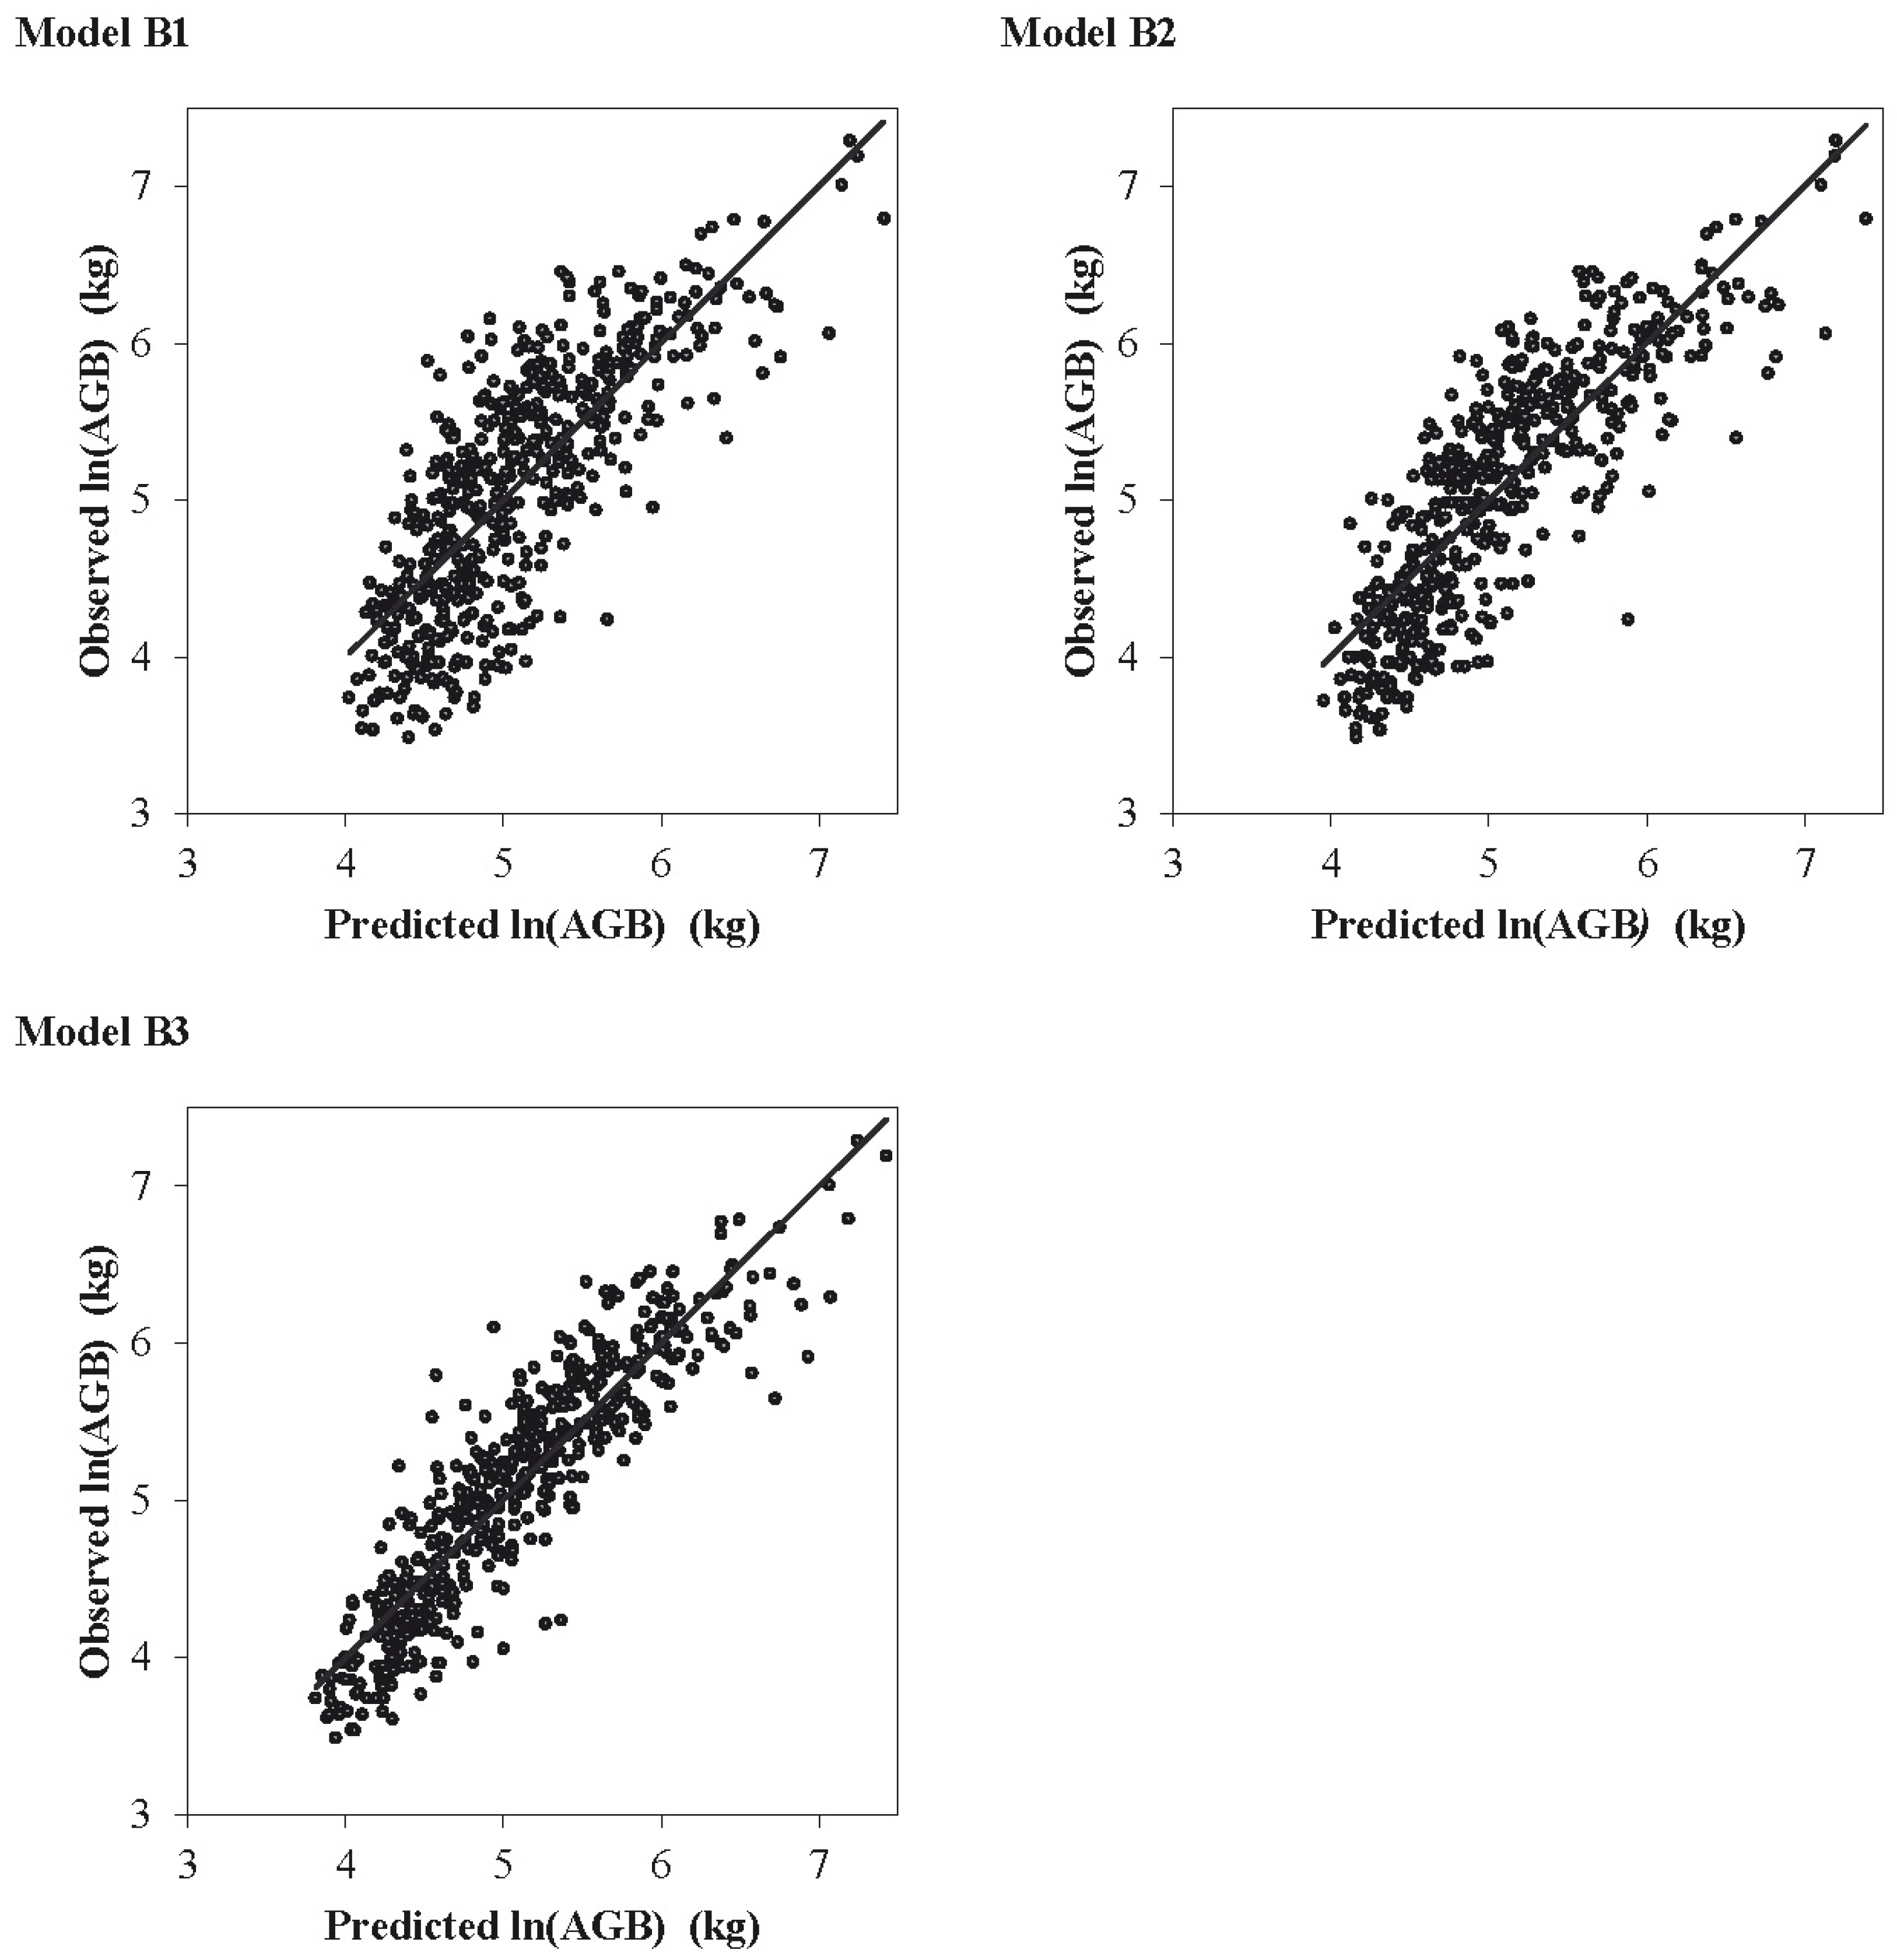
3.3. Aboveground Biomass (AGB) Models
| No. | Regression Model | Parameters | R2 | RMSEln (kg) | RMSEbt (kg) | ||
|---|---|---|---|---|---|---|---|
| Symbol | Value | Standard Error | |||||
| B1 | ln(AGB) = β0 + β1∙CD | β0 | 3.845 * | 0.050 | 0.598 * | 0.495 | 117.313 |
| β1 | 0.427 * | 0.016 | |||||
| B2 | ln(AGB) = β0 + β1∙CD + β2∙SA | β0 | 3.302 * | 0.063 | 0.691 * | 0.434 | 113.676 |
| β1 | 0.372 * | 0.015 | |||||
| β2 | 0.010 * | < 0.001 | |||||
| B3 | ln(AGB) = β0 + β1∙CD + β2∙H | β0 | 2.707 * | 0.057 | 0.821 * | 0.331 | 96.538 |
| β1 | 0.356 * | 0.011 | |||||
| β2 | 0.010 * | 0.004 | |||||

4. Discussion
5. Conclusions
Supplementary Files
Acknowledgments
Author Contributions
Conflicts of Interest
References
- Loetsch, F.; Haller, K.E. Forest Inventory; BLV Verlagsgesellschaft mbH: München, Germany, 1973; Volume I, p. 436. [Google Scholar]
- Köhl, M.; Magnussen, S.; Marchetti, M. Sampling Methods, Remote Sensing and GIS Multiresource Forest Inventory; Springer Verlag: Berlin Heidelberg, Germany, 2006; p. 373. [Google Scholar]
- Van Laar, A.; Akça, A. Forest Mensuration; Springer: Dordrecht, The Netherlands, 2007; p. 376. [Google Scholar]
- Kalliovirta, J.; Tokola, T. Functions for estimating stem diameter and tree age using tree height, crown width and existing stand database information. Silva Fenn. 2005, 39, 227–248. [Google Scholar] [CrossRef]
- Balenović, I.; Seletković, A.; Pernar, R.; Ostrogović, M.Z.; Jazbec, A. Regression Models of DBH Estimation for Photogrammetric Measurement. Sumar. List 2012, 136, 129–139. [Google Scholar]
- Gonzalez-Benecke, C.A.; Gezan, S.A.; Samuelson, L.J.; Cropper, W.P., Jr.; Leduc, D.J.; Martin, T.A. Estimating Pinus palustris tree diameter and stem volume from tree height, crown area and stand-level parameters. J. For. Res. 2014, 25, 43–52. [Google Scholar] [CrossRef]
- Popescu, S.C.; Wynne, R.H.; Nelson, R.F. Measuring individual tree crown diameter with lidar and assessing its influence on estimating forest volume and biomass. Can. J. Remote Sens. 2003, 29, 564–577. [Google Scholar] [CrossRef]
- Takahashi, T.; Yamamoto, K.; Senda, Y.; Tsuzuku, M. Predicting individual stem volumes of sugi (Cryptomeria japonica D. Don) plantations in mountainous areas using small-footprint airborne LiDAR. J. For. Res. 2005, 10, 305–312. [Google Scholar] [CrossRef]
- Villika, M.; Maltamo, M.; Packalén, P.; Vehmas, M.; Hyyppä, J. Alternatives for predicting tre-level stem volume of Norway spruce using airborne laser scanner data. Photogramm. J. Finl. 2007, 20, 33–42. [Google Scholar]
- Straub, C.; Koch, B. Estimating Single Tree Stem Volume of Pinus sylvestris Using Airborne Laser Scanner and Multispectral Line Scanner Data. Remote Sens. 2011, 3, 929–944. [Google Scholar] [CrossRef]
- Hunter, M.O.; Keller, M.; Victoria, D.; Morton, D.C. Tree height and tropical forest biomass estimation. Biogeosciences 2013, 10, 8385–8399. [Google Scholar] [CrossRef]
- Maltamo, M.; Packalén, P.; Peuhkurinen, J.; Suvanto, A.; Pesonen, A.; Hyyppä, J. Experiences and possibilities of ALS based forest inventory in Finland. In Proceedings of the ISPRS Workshop on Laser Scanning 2007 and SilviLaser 2007, Espoo, Finland, 12–14 September 2007; Rönnholm, P., Hyyppä, H., Hyyppä, J., ISPRS Working Groups; ASPRS Lidar Committee; Finnish Geodetic Institute; Institute of Photogrammetry and Remote Sensing; Helsinki University of Technology (TKK), Eds.; pp. 270–279.
- Cortini, F.; Filipescu, C.N.; Groot, A.; MacIsaac, D.A.; Nunifu, T. Regional Models of Diameter as a Function of Individual Tree Attributes, Climate and Site Characteristics for Six Major Tree Species in Alberta, Canada. Forests 2011, 2, 814–831. [Google Scholar] [CrossRef]
- Priedītis, G.; Šmits, I.; Arhipova, I.; Daģis, A.; Dubrovskis, D. Tree Diameter Models from Field and Remote sensing data. Math. Mod. Meth. Appl. S. 2012, 6, 707–714. [Google Scholar]
- Critchfield, W.B.; Little, E.L., Jr. Geographic Distribution of the Pines of the World; USDA Forest Service: Washington, DC, USA, 1966; p. 97.
- Scalotsoyiannes, A.; Rohr, R.; Panetsos, K.P.; Tsaksira, M. Allozyne Frequency Distributions in Five European Populations of Black Pine (Pinus nigra Arnold). Silvae Genet. 1994, 43, 20–30. [Google Scholar]
- Vidaković, M. Conifers: Morphology and Variation; Grafički zavod Hrvatske: Zagreb, Croatia, 1991; p. 754. [Google Scholar]
- Palahí, M.; Pukkala, T.; Trasobares, A. Modelling the diameter distribution of Pinus sylvestris, Pinus nigra and Pinus halepensis forest stands in Catalonia using the truncated Weibull function. Forestry 2006, 79, 553–562. [Google Scholar] [CrossRef]
- González-Olabarria, J.; Palahí, M.; Pukkala, T.; Trasobares, A. Optimising the management of Pinus nigra Arn. stands under endogenous risk of fire in Catalonia. For. Syst. 2008, 17, 10–17. [Google Scholar]
- Mora, J.; del Rio, M.; Bravo-Oviedo, A. Dynamic growth and yield model for Black pine stands in Spain. For. Syst. 2012, 21, 439–445. [Google Scholar]
- Čolak, A.; Martinović, J. Basic soil map Split 3; Projektni savjet za izradu pedološke karte SRH: Zagreb, Croatia, 1976. [Google Scholar]
- Schumacher, F.X.; Hall, F.D.S. Logarithhmic expression of timber-tree volume. J. Agr. Res. 1933, 47, 719–734. [Google Scholar]
- Bezak, K. Volume tables of bitter oak, black pine and Scots pine. Radovi—Šumarski Institut Jastrebarsko 1992, (Special Issue), 1–228. [Google Scholar]
- Zečić, Ž.; Vusić, D. Biomass production potential of black pine (Pinus nigra Arn.) in forest cultures. In Proceedings of the International Symposium Forestry and Agriculture of Croatian Mediterranean on the Threshold of the European Union, Split, Croatia, 13–14 October 2011; Matić, S., Ed.; Akademija šumarskih znanosti: Zagreb, Croatia, 2013; pp. 161–174. [Google Scholar]
- Antoljak, R. Forestry-Technical Manual; Sekcija šumarstva i drvne industrije društva inženjera i tehničara NR Hrvatske: Zagreb, Croatia, 1949; p. 410. [Google Scholar]
- Zečić, Ž.; Vusić, D.; Štimac, Z.; Cvekan, M.; Šimić, A. Aboveground biomass of silver fir, Europian larch and black pine. Croat. J. For. Eng. 2011, 32, 377–377. [Google Scholar]
- SAS Institute Inc. SAS/STAT® 9.3 User’s Guide. Cary, NC: SAS Institute Inc. 2011. Available online: http://support.sas.com/documentation/cdl/en/statug/63962/PDF/default/statug.pdf (accessed on 5 July 2014).
- Shapiro, S.S.; Wilk, M.B. An analysis of variance test for normality (complete samples). Biometrika 1965, 52, 591–6111. [Google Scholar] [CrossRef]
- Shapiro, S.S.; Wilk, M.B.; Chen, H.J. A comparative study of various tests for normality. J. Am. Stat. Assoc. 1968, 63, 1343–1372. [Google Scholar] [CrossRef]
- Gregoire, T.G.; Schabenberger, O.; Barrett, J.P. Linear modeling of irregularly spaced, unbalanced, longitudinal data from permanent-plot measurements. Can. J. For. Res. 1995, 25, 137–156. [Google Scholar] [CrossRef]
- Allouis, T.; Durrieu, S.; Vega, C.; Couteron, P. Stem Volume and Above-Ground Biomass Estimation of Individual Pine Trees From LiDAR Data: Contribution of Full-Waveform Signals. IEEE J. Sel. Top. App. 2013, 6, 924–934. [Google Scholar]
- Balenović, I.; Seletković, A.; Pernar, R.; Marjanović, H.; Vuletić, D.; Paladinić, E.; Kolić, J.; Benko, M. Digital Photogrammetry—State of the Art and Potential for Application in Forest Management in Croatia. South-east Eur. For. 2011, 2, 81–93. [Google Scholar] [CrossRef]
- Hall, R.J.; Morton, R.T.; Nesby, R.N. A Comparison of Existing Models for DBH Estimation from Large-scale Photos. For. Chron. 1989, 65, 114–120. [Google Scholar] [CrossRef]
- Antilla, P. Assessment of Manual and Automated Methods for Updating Stand-Level Forest Inventories Based on Aerial Photography. Ph.D. Thesis, University of Joensuu, Joensuu, Finland, 2005. [Google Scholar]
- Magnusson, M.; Fransson, J.E.S.; Olsson, H. Aerial photo-interpretation using Z/I DMC images for estimation of forest variables. Scand. J. For. Res. 2007, 22, 254–266. [Google Scholar] [CrossRef]
- Balenović, I. Applying Possibility of Digital Aerophotogrammetric Images of Different Spatial Resolution in Forest Management. Ph.D. Thesis, University of Zagreb, Zagreb, Croatia, 2011. [Google Scholar]
- Maltamo, M.; Mustonen, K.; Hyyppä, J.; Pitkänen, J.; Yu, X. The accuracy of estimating individual tree variables with airborne laser scanning in boreal nature reserve. Can. J. For. Res. 2004, 34, 1791–1801. [Google Scholar] [CrossRef]
- Heurich, M. Automatic recognition and measurement of single trees based on data from airborne laser scanning over the richly structured natural forests of the Bavarian Forest National Park. For. Ecol. Manag. 2008, 255, 2416–2433. [Google Scholar] [CrossRef]
- Persson, Å.; Holmgren, J.; Söderman, U. Detecting and measuring individual trees using an airborne laser scanner. Photogramm. Eng. Rem. S 2002, 68, 925–932. [Google Scholar]
© 2015 by the authors; licensee MDPI, Basel, Switzerland. This article is an open access article distributed under the terms and conditions of the Creative Commons Attribution license (http://creativecommons.org/licenses/by/4.0/).
Share and Cite
Balenović, I.; Jazbec, A.; Marjanović, H.; Paladinić, E.; Vuletić, D. Modeling Tree Characteristics of Individual Black Pine (Pinus nigra Arn.) Trees for Use in Remote Sensing-Based Inventory. Forests 2015, 6, 492-509. https://doi.org/10.3390/f6020492
Balenović I, Jazbec A, Marjanović H, Paladinić E, Vuletić D. Modeling Tree Characteristics of Individual Black Pine (Pinus nigra Arn.) Trees for Use in Remote Sensing-Based Inventory. Forests. 2015; 6(2):492-509. https://doi.org/10.3390/f6020492
Chicago/Turabian StyleBalenović, Ivan, Anamarija Jazbec, Hrvoje Marjanović, Elvis Paladinić, and Dijana Vuletić. 2015. "Modeling Tree Characteristics of Individual Black Pine (Pinus nigra Arn.) Trees for Use in Remote Sensing-Based Inventory" Forests 6, no. 2: 492-509. https://doi.org/10.3390/f6020492
APA StyleBalenović, I., Jazbec, A., Marjanović, H., Paladinić, E., & Vuletić, D. (2015). Modeling Tree Characteristics of Individual Black Pine (Pinus nigra Arn.) Trees for Use in Remote Sensing-Based Inventory. Forests, 6(2), 492-509. https://doi.org/10.3390/f6020492