1. Introduction
According to the ecological natural flow regime concept, the flow regime of a river comprises five fundamental components [
1,
2]: magnitude, duration, timing, frequency and flow rate change. Many fluvial ecology studies have demonstrated the influence of flow rate change on the dynamics and evolution of aquatic and semi-aquatic organisms [
3,
4,
5,
6,
7,
8,
9,
10,
11] both in natural and in regulated rivers. Indeed, flow rate change affects the composition, structure and abundance of macrophytes and riparian vegetation. It also affects habitat volumes and the availability of food for aquatic and semi-aquatic animals, as well as transfers between the low-flow channel and adjacent alluvial plain. From a morphological standpoint, flow rate change affects the evolution of banks and their sensitivity to erosion through humectation-desiccation and freeze-thaw processes, as well as the evolution of meanders and other landforms [
12]. It also determines whether streamflow is permanent or intermittent [
13,
14].
Unlike the other four components, however, flow rate change remains little studied in hydrology despite its role in fluvial ecosystem function and evolution [
15,
16,
17]. As a result, the watershed climate and physiographic factors that affect the spatial and temporal variability of this component of the flow regime remain unknown, as do human factors. In Quebec, although several studies have analyzed the hydrologic impacts of deforestation and agriculture on various components of flow [
18,
19,
20,
21,
22], none has looked at the impacts of these two human activities on flow rate change. The goal of the present study is to fill this gap. To do so, the following two major points are addressed:
- -
An analysis of the impacts of agriculture on the spatial and temporal variability of flow rate change indices. This objective is based on the following hypothesis: flow rate change in an agricultural watershed is much greater than in a forested watershed due to high runoff;
- -
An analysis of the impacts of agriculture on the relationship between climate variables (temperature and precipitation) and flow rate change indices, the underlying assumption being that agriculture changes the relationship between climate variables and flow rate change indices.
This study is carried out as part of a vast research program aimed at constraining the influence of agriculture on the spatial and temporal variability of the five components of the flow regime and its implications for the morphological and ecological evolution of fluvial ecosystems in Quebec. The ultimate goal of this research program is to develop flow management practices for restoring and conserving the ecological integrity of these ecosystems.
2. Methods
2.1. Description of Watershed
The choice of watersheds to study was based on the following criteria:
- -
The existence of continuous flow and climate data measured over at least 50 years;
- -
Similar geological, physiographic and climate characteristics in the selected watersheds in order to constrain better the impacts of land use on flow rate change indices;
- -
Two selected watersheds with differing land uses.
Two watersheds met these three criteria, namely the adjacent L’Assomption River and Matawin River watersheds. These watersheds have already been described in detail in some of our previous work [
18,
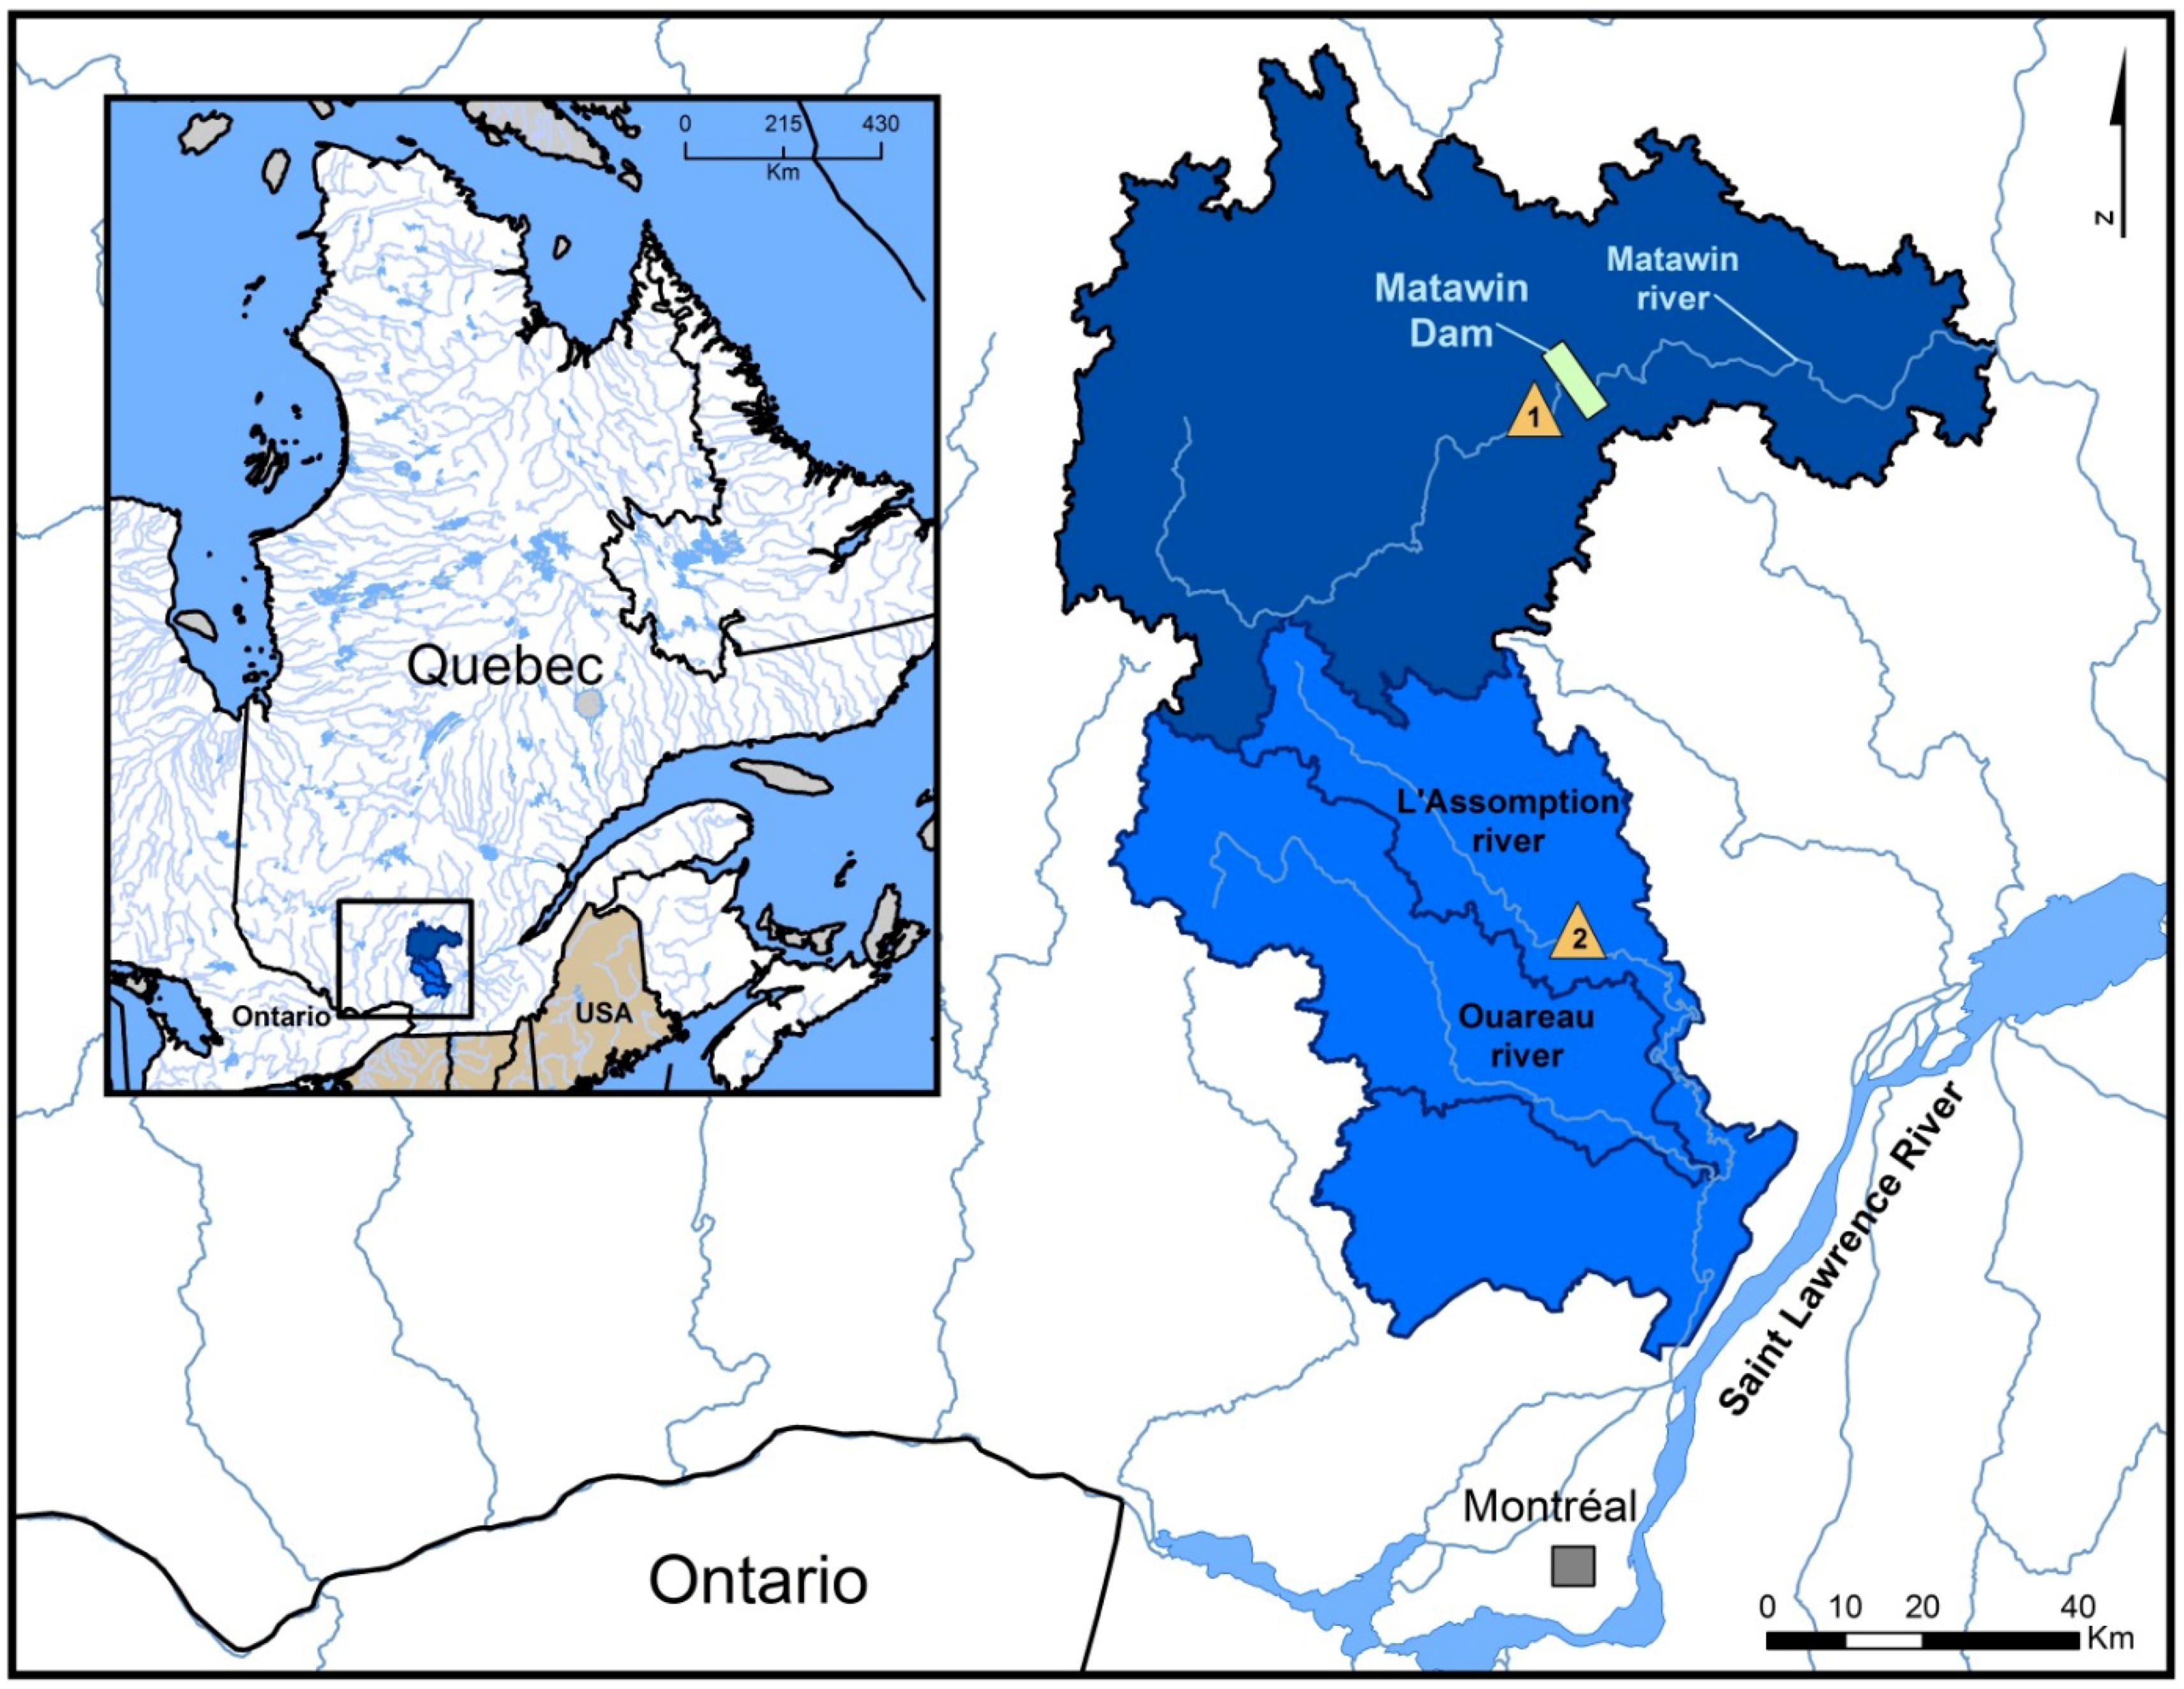
22]. The Matawin River watershed is fully contained within the Canadian Shield. It is covered entirely by forest and no farming takes place within it. This forested area, which also extends to the L’Assomption River watershed, comprises essentially sugar maple-yellow birch stands. For the Matawin River, the watershed upstream from the Saint-Michel-des-Saints station covers 1390 km
2 (
Figure 1). Flows have been measured continuously at the Saint-Michel-Des-Saints station since 1931. This station was not affected by the dam built further downstream in 1930 because it is located far from the impounded lake that makes up the Taureau reservoir. With regard to the L’Assomption River watershed, two thirds (approximately 66%) of it is located within the Canadian Shield and one third (approximately 33%) in the St. Lawrence Lowlands, where intensive agriculture (mostly grains and fodder crops) is practiced. At the Joliette station, the geographic area of the L’Assomption River watershed is 1340 km
2. Flows have been measured there on an ongoing basis since 1925. For both watersheds, flow data as well as temperature and precipitation data were taken from the Environment Canada websites [
23]. However, unlike for flow data, temperatures and precipitation were measured fairly regularly until 2008 for both watersheds, and then only intermittently afterwards.
Figure 1.
Location of stations. 1, Saint-Michel-des-Saints station on Matawin river. 2, Joliette station on L’Assomption River.
Figure 1.
Location of stations. 1, Saint-Michel-des-Saints station on Matawin river. 2, Joliette station on L’Assomption River.
2.2. Definition of Flow Rate Change Indices and Statistical Analysis
The index that is commonly used to characterize flow rate change in the literature is the number of phases of increasing and decreasing flow [
1]. Although this approach is precise, it is cumbersome and long because it requires detailed analysis of flow hydrographs. To streamline these processing steps, we propose the use of two indices to characterize flow rate change. The first index is the coefficient of variation (CV) of flows, which is in fact the ratio of the standard deviation and the mean value calculated for a series of daily flows. It is expressed as a percentage. This index measures between-day flow variations at the annual and seasonal scales. Higher values of CV indicate stronger flow variations from one day to the next. The second index is the coefficient of immoderation (CI), which is the ratio of the highest daily flow (maximum daily flow) and the lowest daily flow (minimum daily flow) measured during a given year or season [
24]. It is also expressed as a percentage. CI is a measure of the maximum amplitude of flow fluctuations at the annual or seasonal scale. Higher CI values indicate a greater difference between the maximum and minimum daily flows. We calculated the two indices using daily flows for each of the following four seasons: winter (January–March), spring (April–June), summer (July–September) and fall (October–December).
For the statistical analysis, the mean values of these two indices were compared using the paired
t test to analyze the impacts of differing land uses in the two watersheds on the spatial variability of the two indices. The use of the paired
t test is warranted by the normal distribution and the lack of autocorrelation in the CI and CV series for both watersheds. For its part, the temporal variability of the two indices was compared using the Lombard test [
25,
26]. The choice of this method is warranted by its general nature, it being the only method that can detect both sharp and gradual breaks in mean values of a statistical series, unlike other statistical tests commonly used in hydrology (e.g. test de Pettitt). The mathematical development of the Lombard test was presented by [
25] and [
26] and will not be addressed further. It should be noted, however, that a break in mean values of a statistical series is statistically significant at the 95% confidence level when the S
n value (score) calculated for the series of observations is greater than 0.0403, which is the Lombard test theoretical value.
Finally, to test the second hypothesis, we correlated the two flow rate change indices (CI and CV) with climate variables using the linear correlation method. The climate variables that were correlated with the two indices include:
- -
The series of mean daily maximum temperatures (TMAX);
- -
The series of mean daily minimum temperatures (Tmin);
- -
The series of daily mean temperatures (Tme);
- -
The series of total snowfall (TSF);
- -
The series of total rainfall (TRN);
- -
The series of total precipitation (rain and snow) (TP).
These series were assembled for each of the four seasons (except for snowfall in summer) over the period from 1930 to 2008.
3. Results and Discussion
3.1. Comparison of the Mean Values of Flow Rate Change Indices between the Two Watersheds
Mean values of CI and CV, the flow rate change indices, are shown in
Table 1, from which it can be seen that the mean values of both indices are higher for the L’Assomption River agricultural watershed than for the Matawin River forested watershed. For CI, the difference between the two watersheds is much greater for winter than for other seasons and much lower for summer. For CV, the difference between the two watersheds is greater for winter and spring, and is low for summer.
Table 1.
Comparison of mean values of coefficient of immoderation (CI) and the coefficient of variation (CV) using the paired t test (1930–2008).
Table 1.
Comparison of mean values of coefficient of immoderation (CI) and the coefficient of variation (CV) using the paired t test (1930–2008).
| Seasons | CI | CV |
|---|
| L’Assomption Watershed | Matawin Watershed | p-Values | L’Assomption Watershed | Matawin Watershed | p-Values |
|---|
| Winter | 55.3 | 3.5 | 0.000 | 57.4 | 32.6 | 0.000 |
| Spring | 19.7 | 10.7 | 0.000 | 81.5 | 61.9 | 0.000 |
| Summer | 9.3 | 7.0 | 0.000 | 57.0 | 52.2 | 0.000 |
| Fall | 9.6 | 5.0 | 0.000 | 53.7 | 39.9 | 0.000 |
These results show that streamflow varies considerably in the agricultural watershed compared to the forested watershed due to higher runoff in the former than in the latter [
18]. However, in summer, when the fields are covered by crops, the difference between the two watersheds is lower due to reduced runoff in the agricultural watershed, accounting for the small difference in values of the two indices between the watersheds in summer. During the other seasons, soil cover is generally limited in the agricultural watershed, a situation which favors higher runoff than in the forested watershed, resulting in greater flow variations in the agricultural watershed than in the forested watershed. It follows that differences in morphological and physiographic characteristics between the two watersheds cannot account for the seasonal differences in CI and CV values observed between the two watersheds, because, unlike plant cover, these morphological and physiographic characteristics do not vary according to the season. In addition, it should be recalled that, in the agricultural area, ground slopes are nearly zero (ancient seafloor), which should have produced lower streamflow variability in the agricultural watershed than in the forested watershed.
3.2. Comparison of the Temporal Variability of Flow Rate Change Indices between the Two Watersheds
Results of the Lombard analysis are shown in
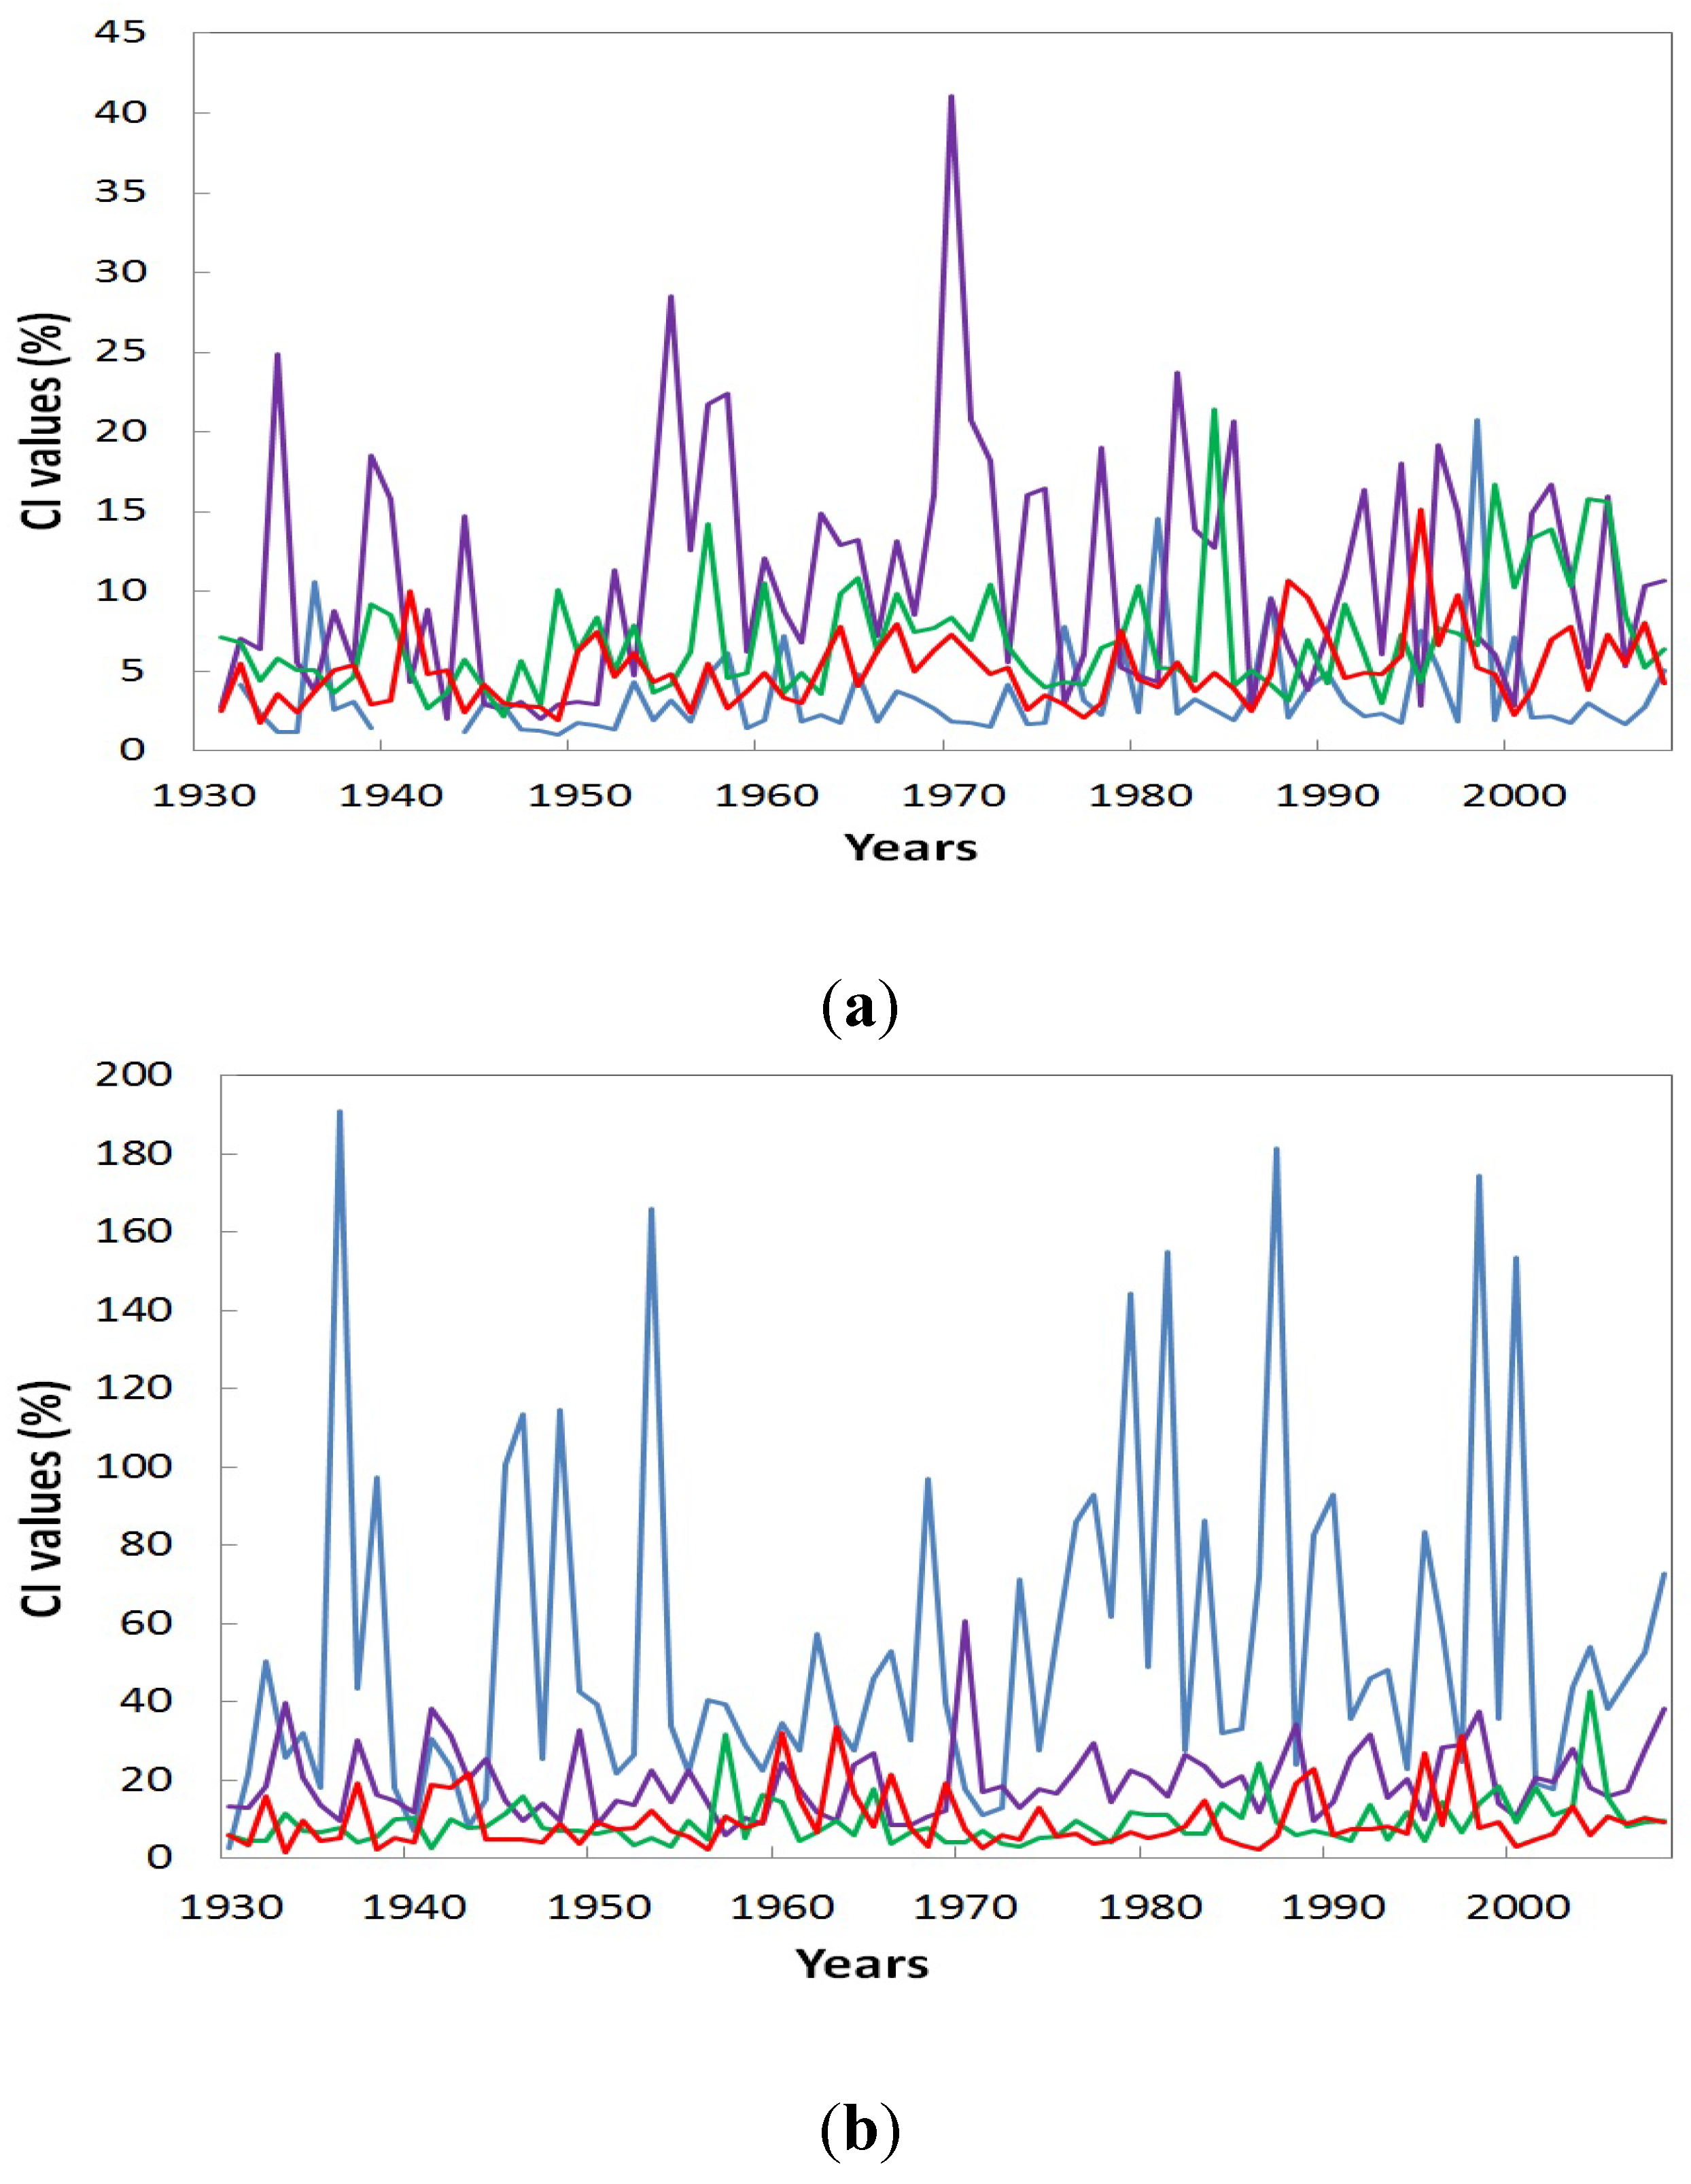
Table 2. For CI, breaks in mean values are observed for winter and summer in both watersheds. For summer, the timing of this break is the same for the two watersheds (1993–1994), while for winter, the break in mean values took place roughly 30 years later in the agricultural watershed than in the forested watershed. In this latter watershed, aside from breaks for winter and summer, another break in mean values is observed for fall in 1983–1985. All breaks in means values are sharp for both watersheds. CI values are significantly larger in both watersheds after these breaks (
Figure 2).
Table 2.
Analysis of the temporal variability of two flow indices in the two watersheds using the Lombard test (1930–2008).
Table 2.
Analysis of the temporal variability of two flow indices in the two watersheds using the Lombard test (1930–2008).
| Seasons | CI | CV |
|---|
| L’Assomption Watershed | Matawin Watershed | L’Assomption Watershed | Matawin Watershed |
|---|
| Sn | T1/T2 | Sn | T1/T2 | Sn | T1/T2 | Sn | T1/T2 |
|---|
| Winter | 0.0601 | 1970/71 | 0.0613 | 1945/46 | 0.0499 | 1972/73 | 0.0248 | - |
| Spring | 0.0386 | - | 0.0211 | - | 0.0065 | - | 0.0400 | - |
| Summer | 0.0633 | 1993/94 | 0.0620 | 1993/94 | 0.1019 | 1993/94 | 0.0620 | 1993/94 |
| Fall | 0.0116 | - | 0.0833 | 1983/85 | 0.0044 | - | 0.0419 | 1984/85 |
Figure 2.
Temporal variability of the CI index in the Matawin River forested watershed (a) and the L’Assomption River agricultural watershed; (b) for the four seasons. Winter: blue curve; Spring: pink curve; Summer: green curve; fall: red curve.
Figure 2.
Temporal variability of the CI index in the Matawin River forested watershed (a) and the L’Assomption River agricultural watershed; (b) for the four seasons. Winter: blue curve; Spring: pink curve; Summer: green curve; fall: red curve.
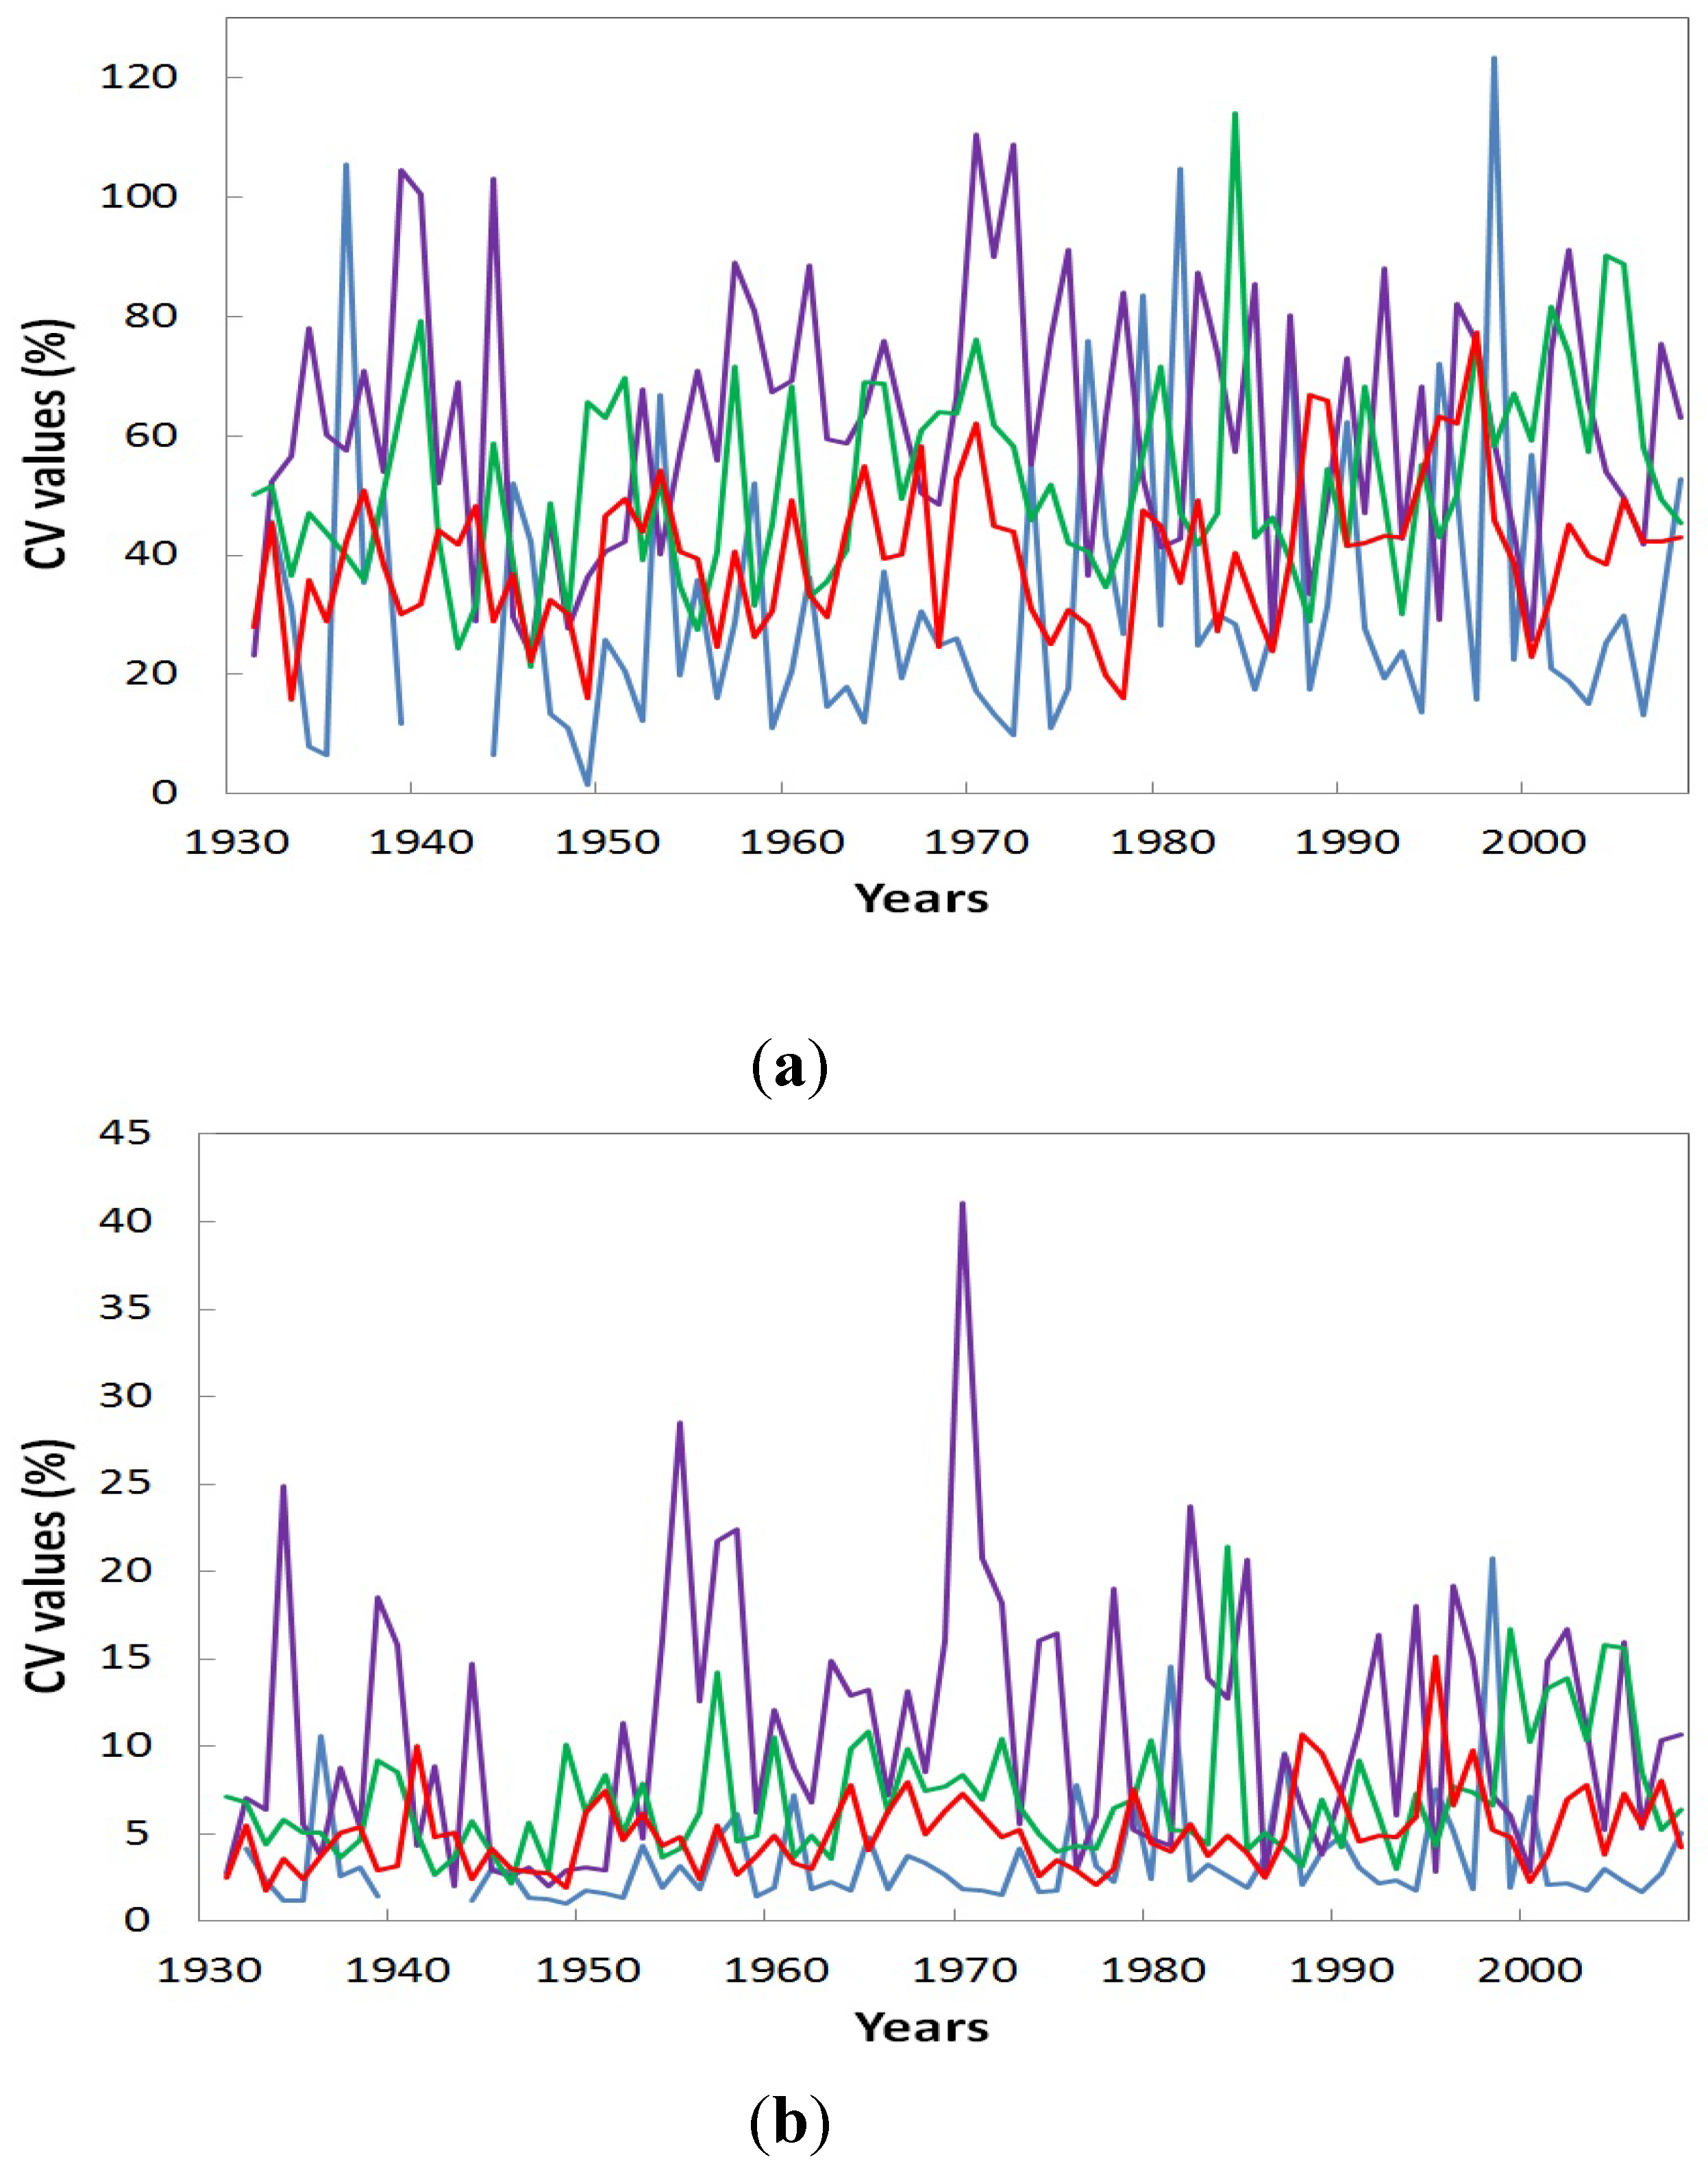
The same trend as for CI is observed for CV values, with breaks in mean values of CV observed for the same seasons as for CI in both watersheds, except for winter in the forested watershed. Moreover, the timing of these breaks is nearly the same as that for breaks in CI values. These breaks are sharp and CV values increase significantly after the breaks (
Figure 3).
Figure 3.
Temporal variability of the CV index in the Matawin River forested watershed (a) and the L’Assomption River agricultural watershed; (b) for the four seasons. Winter: blue curve; Spring: pink curve; Summer: green curve; fall: red curve.
Figure 3.
Temporal variability of the CV index in the Matawin River forested watershed (a) and the L’Assomption River agricultural watershed; (b) for the four seasons. Winter: blue curve; Spring: pink curve; Summer: green curve; fall: red curve.
These results generally support the previous conclusions regarding the spatial variability of the two indices. Thus, for summer, the two watersheds behave similarly, reflecting the synchronous nature of the breaks in mean values. Differences between the two watersheds are observed for fall and winter, two seasons that show a large difference in runoff between the two watersheds as a result of soil being exposed in the agricultural watershed. In any case, CV and CI values increase significantly after the breaks in both watersheds. In other words, variations in streamflow increase significantly over time in both watersheds. In the agricultural watershed, this increase may be related to increasing rainfall [
18,
22], while in the forested watershed, only summer rainfall has increased significantly. In addition, minimum temperatures have also increased significantly in the four seasons [
18].
3.3. Relationship between Climate Variables and Flow Rate Change Indices
Coefficient of correlation values are shown in
Table 3. In winter, the indices for both watersheds are positively correlated to maximum temperature and total rainfall, two factors that influence runoff during that season. In the Matawin River forested watershed, CV is also correlated with minimum temperature. For springtime, the CI index for the agricultural watershed is not correlated with any climate variable, whereas CV is positively correlated with maximum and minimum temperatures. In the forested watershed, the two indices are negatively correlated with minimum temperature. For summer, neither index is correlated with any climate variable in either watershed. For fall, the two indices are positively correlated with total rainfall in both watersheds, and are also positively correlated with total precipitation, but only in the forested watershed. It is quite likely that snow cover in the agricultural watershed does not stay on the ground very long in the fall as a result of higher temperatures than in the forested watershed. In addition, [
18] have shown that fall temperatures are much more strongly affected by site-specific conditions.
This analysis indicates that the difference between the two watersheds is observed in the spring, when the watersheds show opposite correlations. No climate variable can account for these opposite correlations because, in both watersheds, daily minimum temperatures increase significantly over time. The difference in land use between the two watersheds seems to be the factor that accounts for these opposite correlations. In the forested watershed, an increase in spring minimum temperature is related to a decrease in flow variations (lower values of the two flow rate change indices), due to sustained snowmelt promoting sustained runoff. This results in a decrease in flow variations between days. This processes is thought to be dampened in the agricultural watershed, likely as a result of the rapid and transient nature of snowmelt-generated runoff.
4. Conclusions
Flow rate change is a major component of the flow regime due to its effect on fluvial ecosystem function and evolution. Few studies have looked at the natural and human factors that affect its spatial and temporal variability, however. In this study, we compared the values of two indices (the coefficient of variation and the coefficient of immoderation) in an agricultural and a forested watershed. The influence of agriculture produces higher values of the two indices in the agricultural watershed than in the forested watershed due to higher runoff in the former than in the latter. The difference in index values between the two watersheds is greater for winter and lower for summer. As far as the temporal variability of these two indices is concerned, the Lombard analysis revealed breaks in mean values for winter and summer in both watersheds. The timing of these breaks is nearly similar for summer only. Breaks in mean values are also observed for fall in the forested watershed. Values of both indices increase significantly after these breaks. It follows that flow variations increase over time in both watersheds, likely as a result of higher rainfall and temperature. Finally, in both watersheds, the two flow rate change indices are correlated with the same climate variables. However, for springtime, the sign of this correlation is opposite for the two watersheds. This study shows that agriculture increases flow variations in all four seasons, but its impact is dampened in summer as a result of the presence of crops, which slow runoff.
Table 3.
Coefficients of correlation calculated between climate variables and seasonal daily flow variability indices.
Table 3.
Coefficients of correlation calculated between climate variables and seasonal daily flow variability indices.
| Variables | Winter | Springs | Summer | Fall |
|---|
| L’Assomption | Matawin | L’Assomption | Matawin | L’Assomption | Matawin | L’Assomption | Matawin |
|---|
| CI | CV | CI | CV | CI | CV | CI | CV | CI | CV | CI | CV | CI | CV | CI | CV |
|---|
| Tmax | 0.304 | 0.270 | 0.367 | 0.364 | 0.194 | 0.276 | −0.099 | −0.130 | 0.052 | 0.105 | 0.125 | 0.070 | 0.030 | −0.064 | −0.025 | 0.031 |
| Tmin | 0.72 | 0.160 | 0.205 | 0.272 | 0.205 | 0.292 | −0.287 | −0.338 | 0.129 | 0.204 | 0.0.023 | 0.018 | −0.051 | −0.046 | 0.008 | 0.007 |
| Tme | 0.222 | 0.200 | 0.313 | 0.294 | 0.255 | 0.345 | −0.099 | −0.130 | 0.124 | 0.169 | 0.084 | 0.048 | −0.044 | −0.060 | −0.038 | −0.040 |
| TSF | −0.158 | −0.158 | −0.171 | −0.191 | 0.152 | 0.072 | 0.024 | 0.200 | - | - | - | - | −0.080 | −0.183 | 0.034 | −0.082 |
| TRN | 0.533 | 0.533 | 0.413 | 0.546 | −0.218 | −0.199 | −0.038 | −0.161 | 0.160 | 0.160 | 0.134 | 0.063 | 0.243 | 0.319 | 0.416 | 0.295 |
| TP | 0.219 | 0.219 | 0.101 | 15.4 | 0.183 | 0.175 | −0.032 | −0.107 | 0.160 | 0.160 | 0.134 | 0.063 | 0.155 | 0.160 | 0.353 | 0.232 |
Acknowledgments
The authors would like to acknowledge financial support from the Natural Sciences and Engineering Research Council of Canada and from the RIVE research center at Université du Québec à Trois-Rivières.
Author Contributions
Ali Assani, Francis Delisle and Raphaëlle Landry conducted data analyses, participated in writing all sections of the manuscript and to the elaboration of figures. Muma Mushombe contributed to writing of the results and discussion sections.
Conflicts of Interest
The authors declare no conflict of interest.
References
- Ritcher, B.D.; Baumgartner, J.V.; Braun, D.P.; Powell, J. A spatial assessment of hydrologic alteration within a river network. Regul. Rivers Res. Manag. 1996, 14, 329–340. [Google Scholar]
- Poff, N.L.; Allan, J.D.; Bain, M.B.; Karr, J.R.; Prestegaard, K.L.; Richter, B.D.; Sparks, R.E.; Stromberg, J.C. The natural flow regime. Bioscience 1997, 47, 769–784. [Google Scholar] [CrossRef]
- Beche, L.A.; McElravy, E.P.; Resh, V.H. Long-term seasonal variation in the biological traits of benthic-macroinvertebrates in two Mediterranean-climate streams in California, USA. Freshw. Biol. 2006, 51, 56–75. [Google Scholar] [CrossRef]
- Cushman, R.M. Review of ecological effects of rapidly varying flows downstream from hydroelectric facilities. N. Am. J. Fish. Manag. 1985, 5, 330–339. [Google Scholar] [CrossRef]
- Enders, E.C.; Scruton, D.A.; Clarke, K.D. The “Natural flow paradigm” and Atlantic salmon-moving from concept to practice. Rivers Res. Appl. 2009, 25, 2–15. [Google Scholar] [CrossRef]
- Hudon, C. Impact of water level fluctuations on St. Lawrence River aquatic vegetation. Can. J. Fish. Aquat. Sci. 1997, 54, 2853–2865. [Google Scholar] [CrossRef]
- Merritt, D.M.; Scott, M.L.; Poff, N.L.; Auble, G.T.; Lytle, D.A. Theory, methods and tools for determining environmental flows for riparian vegetation : Riparian vegetation-flow response guilds. Freshw. Biol. 2010, 55, 206–225. [Google Scholar] [CrossRef]
- Nilsson, C.; Svedmark, M. Basic principles and ecological consequences of changing water regimes: Riparian plant communities. Environ. Manag. 2002, 30, 468–480. [Google Scholar] [CrossRef]
- Petts, G.E. Impounded Rivers: Perspective for Ecological Management; John Wiley & Sons: New York, NY, USA, 1984. [Google Scholar]
- Poff, N.L.; Zimmerman, K.H. Ecological responses to altered flow regimes: A literature review to inform the science and management of environmental flows. Freshw. Biol. 2010, 55, 194–205. [Google Scholar] [CrossRef]
- Riis, T.; Hawes, I. Relationships between water level fluctuations and vegetation diversity in shallow water of New Zealand lakes. Aquat. Bot. 2002, 74, 133–148. [Google Scholar] [CrossRef]
- Richter, B.D.; Richter, H.E. Prescribing flood regimes to sustain riparian ecosystems along meandering rivers. Conserv. Biol. 2000, 14, 1467–1478. [Google Scholar] [CrossRef]
- Assani, A.A.; Simard, É.; Gravel, É.; Ibrahim, G.; Campeau, S. The impact of “Man-Made Hydrological drought” on plant species abundance in the low-flow channel downstream from the Matawin dam, Quebec. Water 2013, 5, 875–892. [Google Scholar] [CrossRef]
- Larned, S.T.; Datry, T.; Arscott, D.B.; Tockner, K. Emerging concepts in temporary-river ecology. Freshw. Biol. 2010, 55, 717–738. [Google Scholar] [CrossRef]
- Assani, A.A.; Quéssy, J.-F.; Mesfioui, M.; Matteau, M. An example of application: The ecological “natural flow regime” paradigm in hydroclimatology. Adv. Water Resour. 2010, 33, 537–545. [Google Scholar] [CrossRef]
- Mazouz, R.; Assani, A.A.; Quessy, J.-F.; Légaré, G. Comparison of the interannual variability of spring heavy floods characteristics of tributaries of the St. Lawrence River in Quebec (Canada). Adv. Water Resour. 2012, 35, 110–120. [Google Scholar] [CrossRef]
- Mazouz, R.; Assani, A.A.; Rodríguez, M.A. Application of redundancy analysis to hydroclimatology: A case study of spring heavy floods in southern Québec (Canada). J. Hydrol. 2013, 496, 187–194. [Google Scholar] [CrossRef]
- Assani, A.A.; Landry, R.; Kinnard, C.; Azouaoui, O.; Demers, C.; Lacasse, K. Comparison of the Spatiotemporal Variability of Temperature, Precipitation, and Maximum Daily Spring Flows in Two Watersheds in Quebec Characterized by Different Land Use. Available online: http://www.hindawi.com/journals/amete/aa/238029/ (accessed on 20 November 2015).
- Lavigne, M.-P.; Rousseau, A.N.; Turcotte, R.; Laroche, A.-M.; Fortin, J.-P.; Villeneuve, J.-P. Validation and use of a semidistributed hydrological modelling system to predict short-term effects of clear-cutting on a watershed hydrological regime. Earth Interact. 2004, 8, 1–19. [Google Scholar] [CrossRef]
- Muma, M.; Assani, A.A.; Landry, R.; Quessy, J.-F.; Mesfoui, M. Effects of the change from forest to agriculture land use on the spatial variability of summer extreme daily flow characteristics in Southern Quebec (Canada). J. Hydrol. 2011, 407, 153–163. [Google Scholar] [CrossRef]
- Quilbé, R.; Rousseau, A.N.; Moquet, J.-S.; Savary, S.; Ricard, S.; Garbouj, M.S. Hydrological response of watershed to historical land use evolution and future land use scenarios under climate change. Hydrol. Earth Syst. Sciences 2008, 12, 101–110. [Google Scholar] [CrossRef]
- Sylvain, J.-M.; Assani, A.; Landry, R.; Quessy, J.-F.; Kinnard, C. Comparison of the spatio-temporal variability of annual minimum daily extreme flow characteristics as a function of land use and dam management mode in Quebec, Canada. Water 2015, 7, 1232–1245. [Google Scholar] [CrossRef]
- Environnement Canada. Water Survey of Canada. Available online: https://www.ec.gc.ca/rhc-wsc/default.asp? (accessed on 5 May 2013).
- Assani, A.A.; Landry, R.; Labrèche, M.; Frenette, J.-J.; Gratton, D. Temporal variability of monthly daily extreme water levels in the St. Lawrence river at the Sorel station from 1912 to 2010. Water 2014, 6, 196–212. [Google Scholar] [CrossRef]
- Lombard, F. Rank tests for changepoint problems. Biometrika 1987, 74, 615–624. [Google Scholar] [CrossRef]
- Quessy, J.-F.; Favre, A.-C.; Saïd, M.; Champagne, M. Statistical inference in Lombard’s smooth-change model. Environmetrics 2011, 22, 882–893. [Google Scholar] [CrossRef]
© 2015 by the authors; licensee MDPI, Basel, Switzerland. This article is an open access article distributed under the terms and conditions of the Creative Commons Attribution license (http://creativecommons.org/licenses/by/4.0/).


