The authors wish to make the following corrections to this paper [1]:
We discovered a calculation error in our CO2 flux data reported in our published manuscript [1]. As a result of the calculation error, the values reported for CO2-C flux from our laboratory incubation experiment were underestimated by a factor of 3.90. Further, our corrected data indicate that CO2-C fluxes for type and concentration of wildfire-produced pyrogenic carbon at T10 follow the same trends as the other time points, whereas, due to a graphing error, we had previously ascribed the different T10 response to the initial disturbance of setting up the incubations. Here, we present a corrected figure to replace Figure 3 in the original manuscript. We have compared the results of the statistical analysis of the original dataset to the results of analysis of the corrected dataset, and we found that the conclusions of our study do not differ between the original and the corrected datasets. We present a corrected Table 2 with the correct F and p-values. The corrected Table 2 shows that there are no changes to the conclusions stated in our original manuscript.
The authors apologize for any inconvenience caused to the readers by these changes. We will update the article and the original version will remain available on the article webpage.
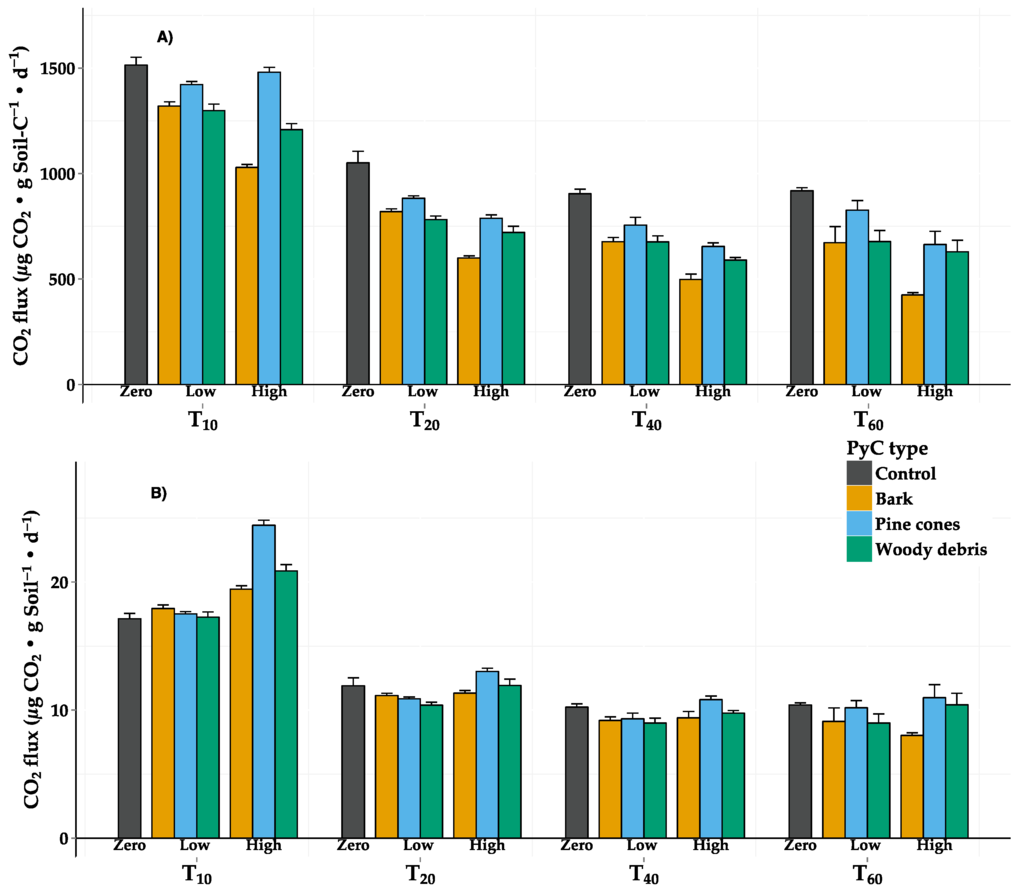
Figure 3.
Corrected figure: CO2 flux, in terms of (A) g soil C per day and (B) g soil per day, of soils incubated with charred bark (yellow), charred pine cones (blue), or charred woody debris (green) at zero (black, control), low (0.1%), or high (1.0%) PyC concentrations. The CO2 concentrations were measured on days 10, 20, 40, and 60 (T10, T20, T40, T60, respectively). The error bars represent one standard error.

Table 2.
Corrected table of F-statistics and p-values for ANOVAs of soil respiration for treatment, time, and treatment × time for the corrected dataset. All PyC types and concentrations fall under treatment.
| Main Effect | F Value | p Value | |
|---|---|---|---|
| μg CO2 g soil-C−1 day−1 | Treatment | 56.28 | <0.0001 |
| Time | 1179.68 | <0.0001 | |
| Treatment × Time | 4.07 | <0.0001 | |
| μg CO2 g soil−1 day−1 | Treatment | 14.80 | <0.0001 |
| Time | 1546.33 | <0.0001 | |
| Treatment × Time | 14.55 | <0.0001 |
Reference
- Michelotti, L.A.; Miesel, J.R. Source material and concentration of wildfire-produced pyrogenic carbon influence post-fire soil nutrient dynamics. Forests 2015, 6, 1325–1342. [Google Scholar] [CrossRef]
© 2015 by the authors; licensee MDPI, Basel, Switzerland. This article is an open access article distributed under the terms and conditions of the Creative Commons Attribution license (http://creativecommons.org/licenses/by/4.0/).