Soil Carbon Stocks in Two Hybrid Poplar-Hay Crop Systems in Southern Quebec, Canada


Abstract
:1. Introduction
2. Experimental Section
2.1. Site Description
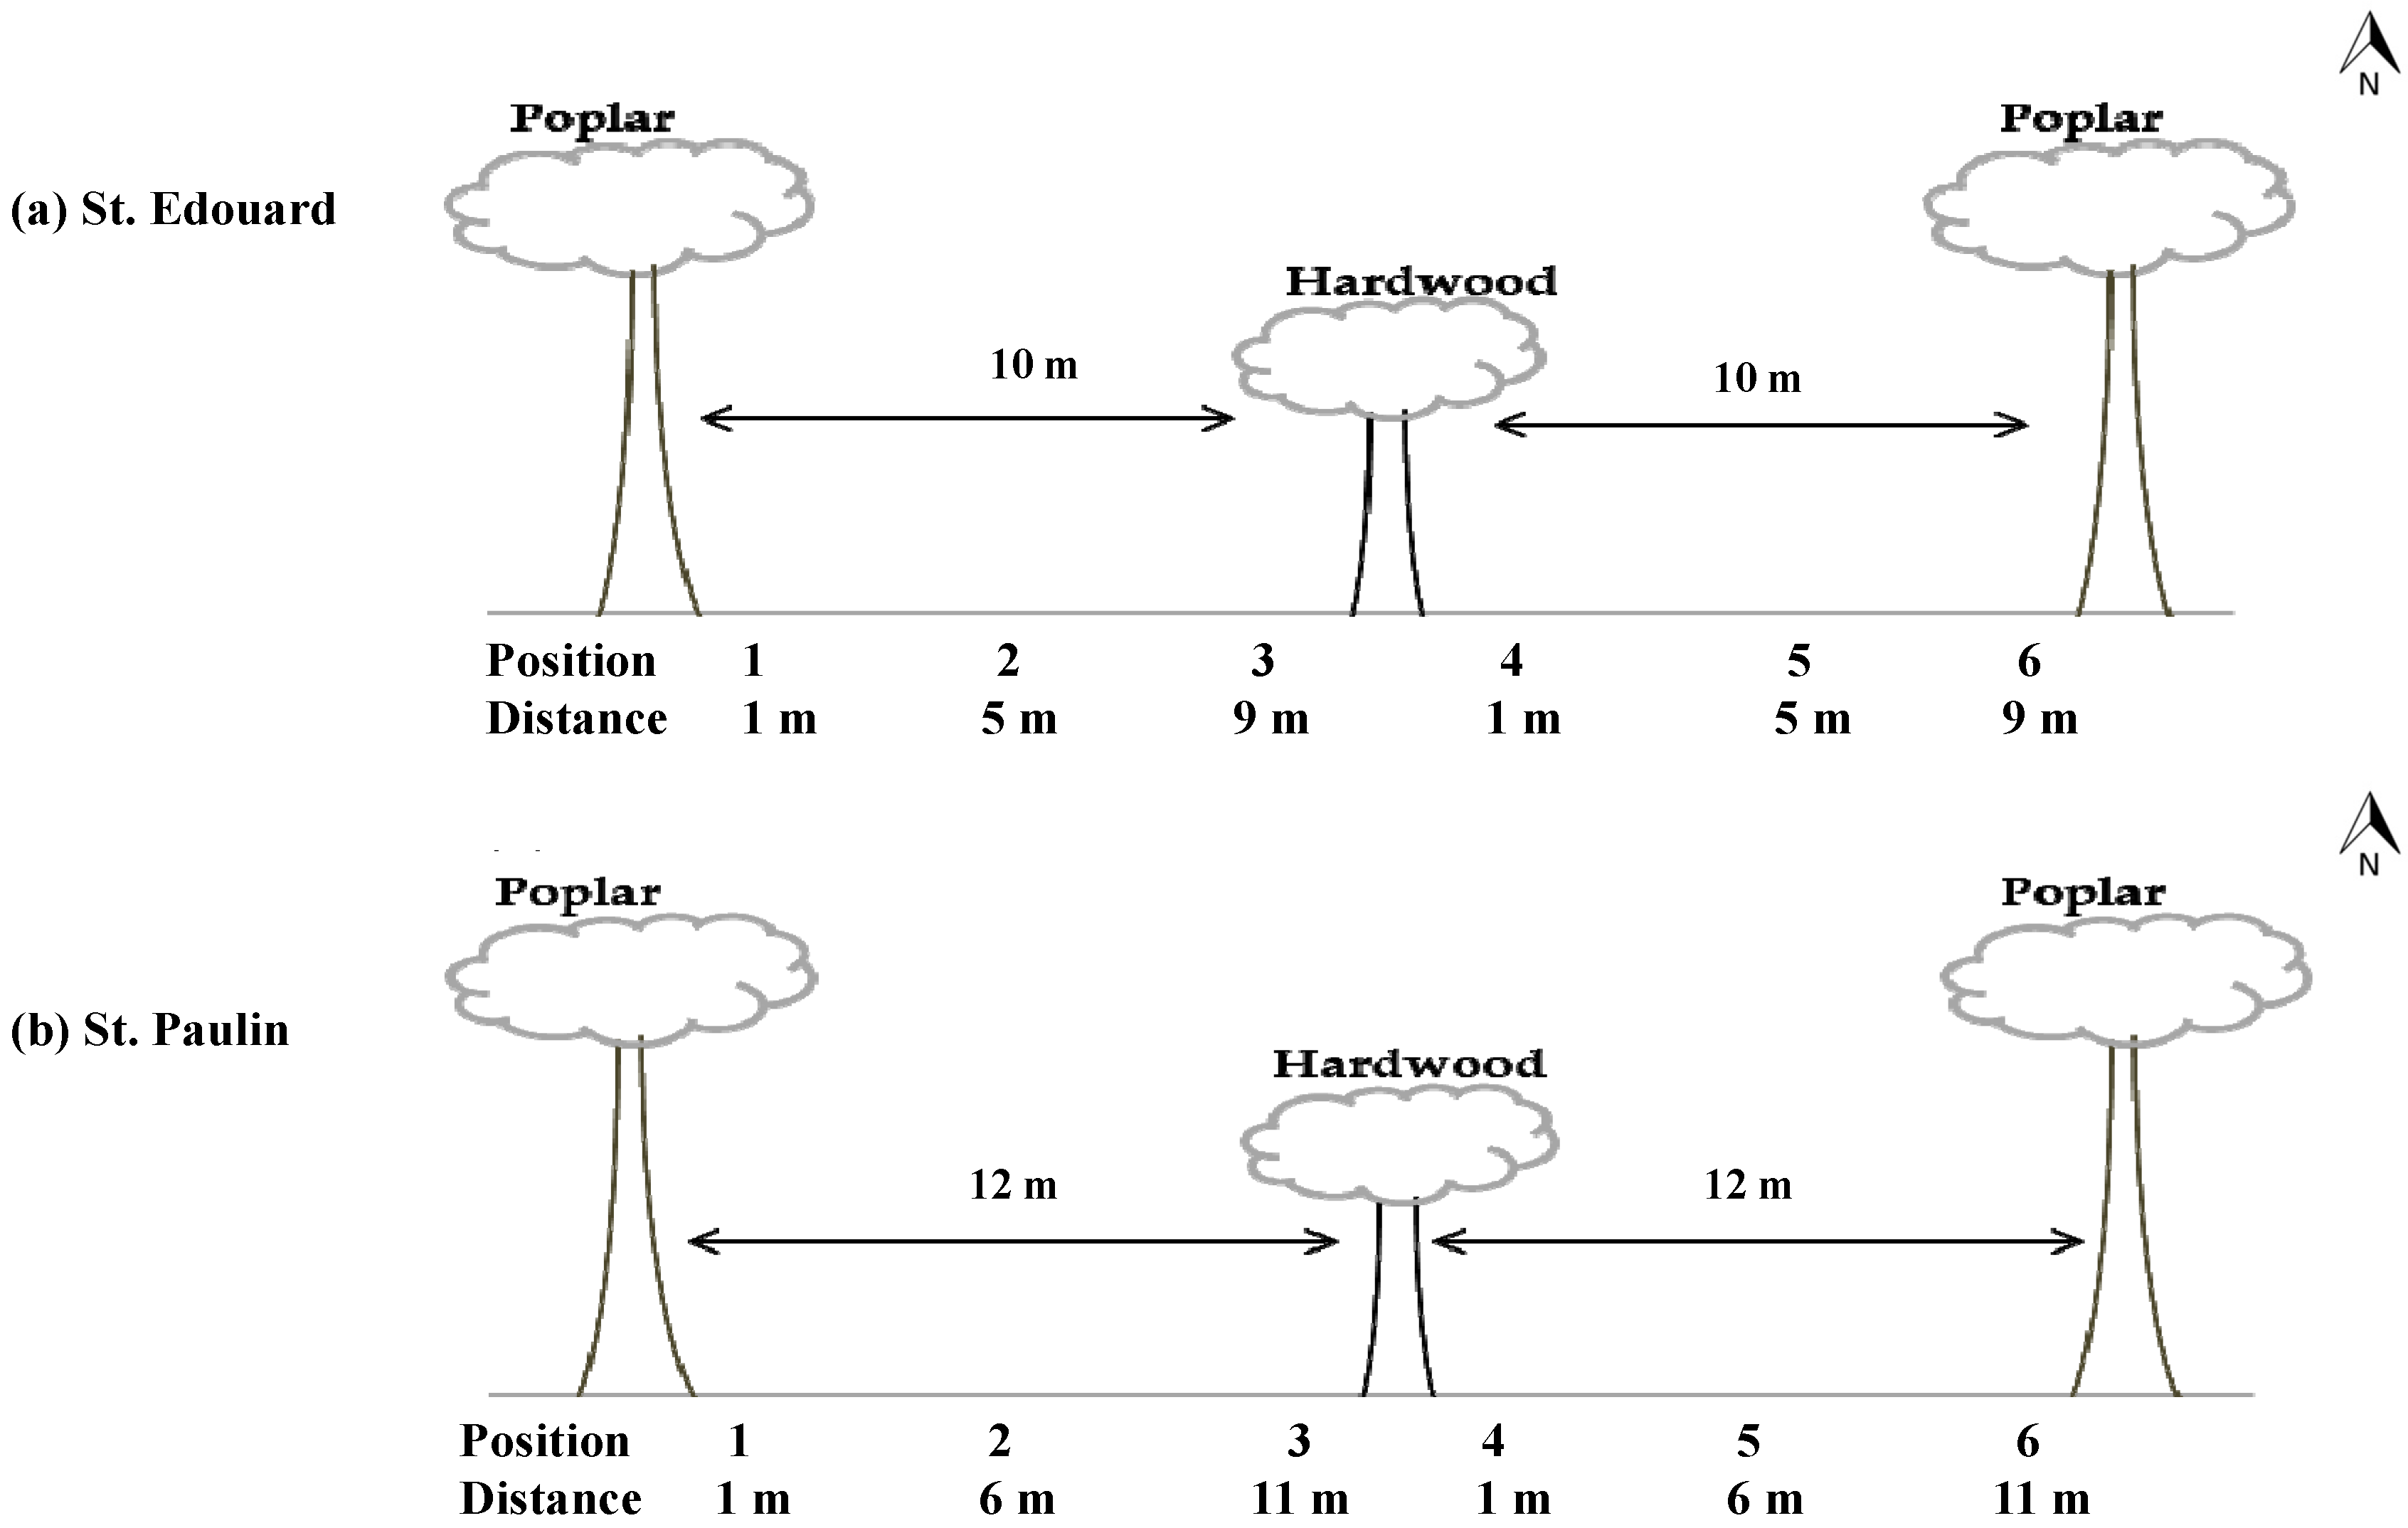
2.2. Experimental Design

| St. Paulin | St. Edouard | |
|---|---|---|
| Soil characteristics | Loamy sand (79% sand, 5% clay, 16% silt) 1; pH water 6.2 (5.2–6.8) 1; classified as Dystric Brunisol 2 | Loamy sand (86% sand, 2% clay, 12% silt) 1; pH water 6.3 (5.3–6.8) 1; classified as Humo-Ferric Podzol 2 |
| Climate | Mean annual precipitation: 1113 mm yr−1 | Mean annual precipitation: 1079 mm yr−1 |
| Poplar species | DN3333 (P. deltoides × P. nigra, cv. Stormont, Ontario, Canada) DN3570 4 (P. deltoides × P. nigra, no cv. name, Belgium) | DN3333 (P. deltoides × P. nigra, cv. Stormont, Ontario, Canada) DN3570 4 (P. deltoides × P. nigra, no cv. name, Belgium) |
| Hardwood species | Quercus rubra L. and Prunus serotina Ehrh. | Quercus rubra L. and Fraxinus americana L. |
| Tree density | 314 trees ha−1 | 500 trees ha−1 |


2.3. Field Operations for St. Paulin
2.4. Field Operations for St. Edouard
2.5. Soil Sampling and Analysis
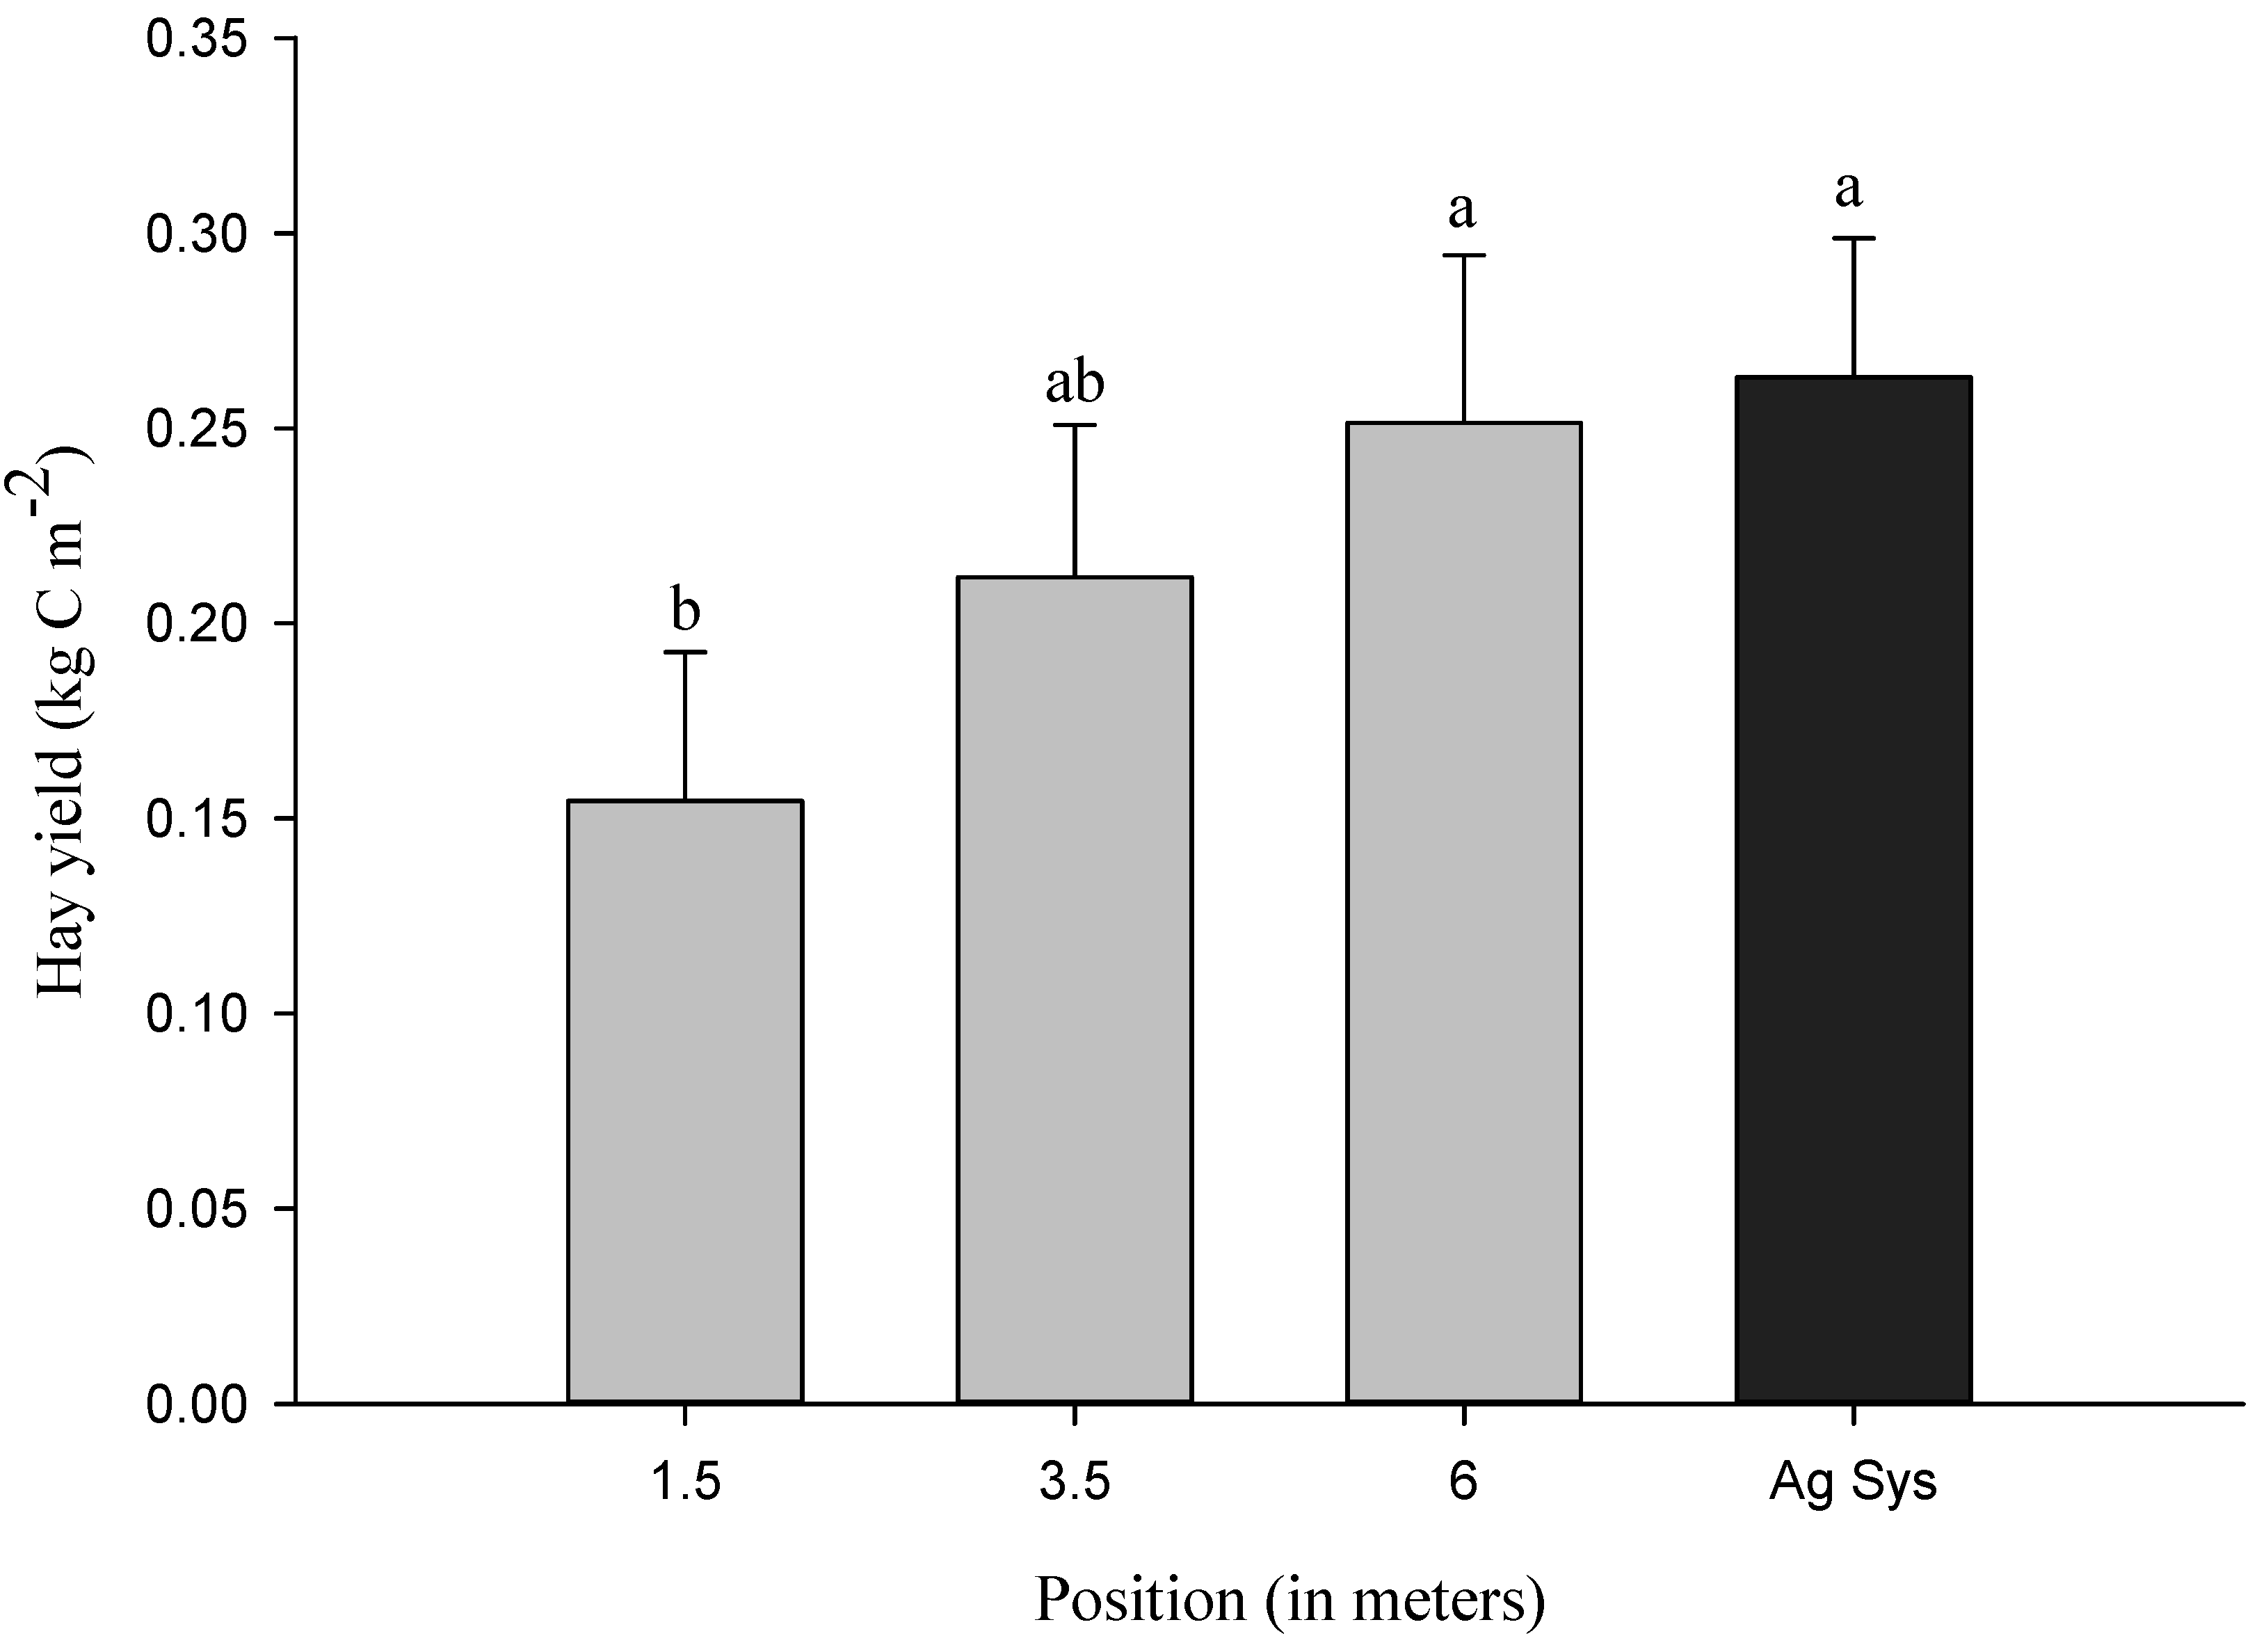
2.6. Yield
2.7. Litterfall
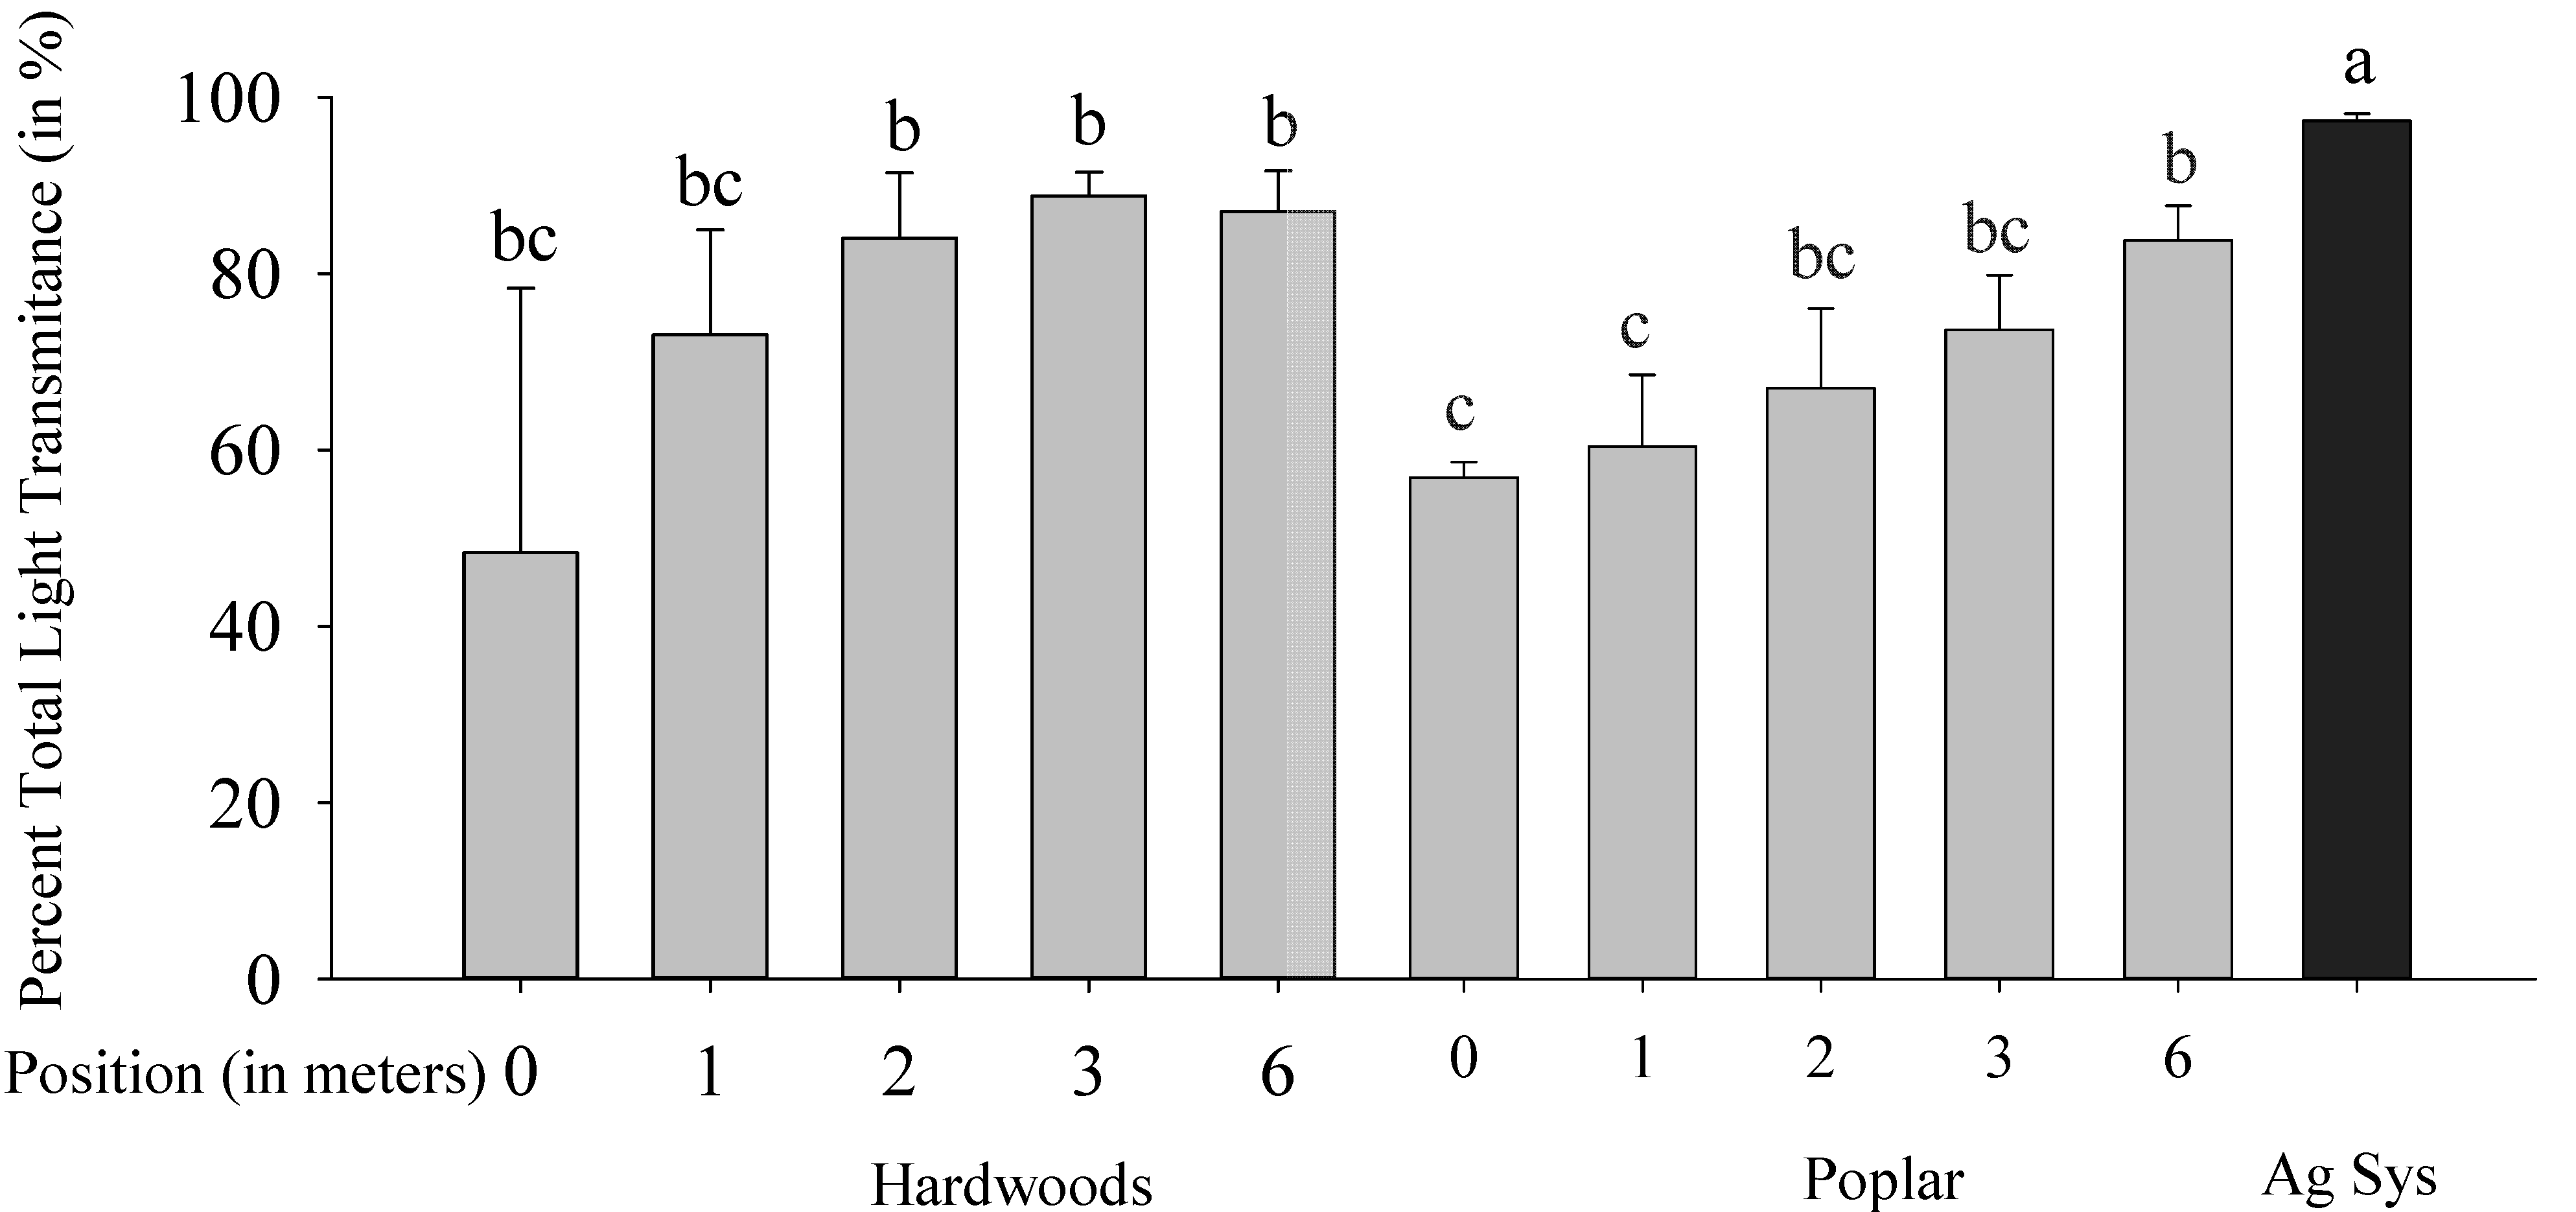
2.8. Percent Total Light Transmittance (PTLT)
2.9. Statistical Analyses
3. Results and Discussion
Soil C and N Stocks
| St. Edouard | Position 1 | |||||||
|---|---|---|---|---|---|---|---|---|
| TBI System | Ag Sys | Contrast 3 (p-Values) | ||||||
| 1 | 2 | 3 | 4 | 5 | 6 | 7 | TBI vs. Ag Sys | |
| 0–5 | 1.19 ± 0.13 b 2 | 1.50 ± 0.04 ab | 2.21 ± 0.34 ab | 2.31 ± 0.66 a | 1.74 ± 0.17 ab | 2.24 ± 0.35 a | 1.94 ± 0.35 ab | 0.55 |
| 5–20 | 3.20 ± 0.79 a | 4.76 ± 1.30 a | 5.84 ± 1.40 a | 5.33 ± 1.60 a | 4.23 ± 1.50 a | 4.10 ± 1.60 a | 6.25 ± 0.87 a | 0.08 |
| 20–30 | 1.86 ± 1.10 a | 1.65 ± 0.54 a | 2.23 ± 0.34 a | 2.43 ± 0.80 a | 1.85 ± 0.16 a | 2.70 ± 0.51 a | 3.13 ± 0.23 a | 0.001 |
| 0–30 | 6.24 ± 0.67 a | 7.90 ± 0.64 a | 10.28 ± 0.68 a | 10.07 ± 1.00 a | 7.82 ± 0.62 a | 9.04 ± 0.82 a | 11.32 ± 0.48 a | 0.01 |
| St. Edouard | Position 1 | |||||||
|---|---|---|---|---|---|---|---|---|
| TBI System | Ag Sys | Contrast 3 (p-Values) | ||||||
| 1 | 2 | 3 | 4 | 5 | 6 | 7 | TBI vs. Ag Sys | |
| 0–5 | 0.11 ± 0.05 b 2 | 0.16 ± 0.01 ab | 0.28 ± 0.00 ab | 0.38 ± 0.23 a | 0.21 ± 0.03 ab | 0.27 ± 0.05 ab | 0.24 ± 0.05 ab | 0.82 |
| 5–20 | 0.26 ± 0.11 a | 0.47 ± 0.25 a | 0.65 ± 0.21 a | 0.58 ± 0.12 a | 0.41 ± 0.27 a | 0.41 ± 0.28 a | 0.73 ± 0.08 a | 0.07 |
| 20–30 | 0.07 ± 0.11 a | 0.08 ± 0.10 a | 0.20 ± 0.09 a | 0.22 ± 0.14 a | 0.15 ± 0.04 a | 0.29 ± 0.15 a | 0.29 ± 0.07 a | 0.22 |
| 0–30 | 0.43 ± 0.09 a | 0.72 ± 0.12 a | 1.10 ± 0.10 a | 1.20 ± 0.16 a | 0.77 ± 0.12 a | 0.97 ± 0.16 a | 1.30 ± 0.07 a | 0.02 |
| St. Paulin | Position 1 | |||||||
|---|---|---|---|---|---|---|---|---|
| TBI System | Ag Sys | Contrast 3 (p-Values) | ||||||
| 1 | 2 | 3 | 4 | 5 | 6 | 7 | TBI vs. Ag Sys | |
| 0–5 | 1.70 ± 0.49 a 2 | 1.56 ± 0.49 a | 1.69 ± 0.57 a | 1.73 ± 0.02 a | 1.69 ± 0.96 a | 1.52 ± 0.11 a | 1.84 ± 0.45 a | 0.56 |
| 5–20 | 4.98 ± 1.20 a | 3.71 ± 1.30 a | 4.47 ± 0.99 a | 3.46 ± 0.55 a | 3.43 ± 1.20 a | 3.77 ± 0.60 a | 5.10 ± 1.10 a | 0.10 |
| 20–30 | 2.36 ± 1.20 a | 2.91 ± 0.57 a | 2.46 ± 0.28 a | 2.71 ± 0.86 a | 2.62 ± 1.10 a | 3.03 ± 0.09 a | 3.18 ± 0.78 a | 0.23 |
| 0–30 | 9.04 ± 0.98 a | 8.18 ± 0.80 a | 10.28± 0.68 a | 7.90 ± 0.48 a | 7.73 ± 1.10 a | 8.32 ± 0.27 a | 10.10 ± 0.79 a | 0.15 |
| St. Paulin | Position 1 | |||||||
|---|---|---|---|---|---|---|---|---|
| TBI System | Ag Sys | Contrast 3 (p-Values) | ||||||
| 1 | 2 | 3 | 4 | 5 | 6 | 7 | TBI vs. Ag Sys | |
| 0–5 | 0.22 ± 0.09 a 2 | 0.20 + 0.10 a | 0.22 + 0.11 a | 0.23 + 0.02 a | 0.21 + 0.20 a | 0.19 + 0.03 a | 0.25 + 0.10 a | 0.52 |
| 5–20 | 0.65 + 0.27 a | 0.38 + 0.28 a | 0.55 + 0.19 a | 0.33 + 0.13 a | 0.34 + 0.26 a | 0.42 + 0.10 a | 0.66 + 0.24 a | 0.10 |
| 20–30 | 0.24+ 0.22 a | 0.34 + 0.09 a | 0.26 + 0.06 a | 0.31 + 0.15 a | 0.27 + 0.23 a | 0.36 + 0.04 a | 0.40 + 0.16 a | 0.26 |
| 0–30 | 1.10 + 0.19 a | 0.92 + 0.16 a | 1.00 + 0.12 a | 0.87 + 0.10 a | 0.82 + 0.23 a | 0.97 + 0.06 a | 1.30 + 0.17 a | 0.13 |
| Position 1 | |||||||
|---|---|---|---|---|---|---|---|
| TBI System | Ag Sys | ||||||
| 1 | 2 | 3 | 4 | 5 | 6 | 7 | |
| St. Paulin | 0.003 ± 0.004 a 2 | 0.002 ± 0.001 a | 0.004 ± 0.004 a | 0.003 ± 0.001 a | 0.002 ± 0.001 a | 0.001 ± 0.002 a | 0.004 ± 0.005 a |
| St. Edouard | 0.028 ± 0.020 ab | 0.006 ± 0.004 b | 0.019 ± 0.011 ab | 0.015 ± 0.010 ab | 0.007 ± 0.011 ab | 0.038 ± 0.037 a | 0.008 ± 0.006 ab |

4. Conclusions
Acknowledgments
Author Contributions
Conflicts of Interest
References
- Environment Canada. National Inventory Report 1990–2011: Greenhouse Gas Sources and Sinks in Canada Executive Summary. 2010. Available online: http://www.ec.gc.ca/Publications/default.asp?lang=En&xml=A07ADAA2-E349-481A-860F-9E2064F34822 (accessed on 10 July 2013). [Google Scholar]
- Montagnini, F.; Nair, P. Carbon sequestration: An Underexploited Environmental Benefit of Agroforestry Systems. Agroforest. Syst. 2004, 61, 281–295. [Google Scholar]
- Stanturf, J.; Portwood, C. Economics of Afforestation with Eastern Cottonwood (Populus deltoids) on Agricultural Land in the Lower Mississippi Alluvial Valley. In Proceedings of the Tenth Biennial Southern Silvicultural Research Conference, Shreveport, LA, USA, 16–18 February 1999.
- Udawatta, R.; Jose, S. Agroforestry Strategies to Sequester Carbon in Temperate North America. Agroforest. Syst. 2012, 86, 225–242. [Google Scholar] [CrossRef]
- Rivest, D.; Cogliastro, A.; Vanasse, A.; Olivier, A. Production of Soybean Associated with Different Hybrid Poplar Clones in a Tree-based Intercropping System in Southwestern Quebec, Canada. Agr. Ecosyst. Environ. 2009, 131, 51–60. [Google Scholar] [CrossRef]
- Evers, A.; Bambrick, A.; Lacombe, S.; Dougherty, M.; Peichl, M.; Gordon, A.; Thevathasan, N.; Whalen, J.; Bradley, R. Potential Greenhouse Gas Mitigation through Temperate Tree-based Intercropping Systems. Open Agric. J. 2010, 4, 49–57. [Google Scholar] [CrossRef]
- Thevathasan, N.; Gordon, A.; Bradley, R.; Cogliastro, A.; Folkard, P.; Grant, R.; Kort, J.; Liggins, L.; Njenga, F.; Olivier, A.; et al. Agroforestry Research and Development in Canada: The Way Forward. Adv. Agroforst. 2012, 9, 247–283. [Google Scholar]
- Rivest, D.; Lorente, M.; Olivier, A.; Messier, C. Soil Biochemical Properties and Microbial Resilience in Agroforestry Systems: Effects on Wheat Growth under Controlled Drought and Flooding Conditions. Sci. Tot. Environ. 2013, 463, 51–60. [Google Scholar] [CrossRef]
- Bambrick, A.; Whalen, J.; Bradley, R.; Cogliastro, A.; Gordon, A.; Olivier, A.; Thevathasan, N. Spatial Heterogeneity of Soil Organic Carbon in Tree-based Intercropping Systems in Quebec and Ontario, Canada. Agroforest. Syst. 2010, 79, 343–353. [Google Scholar] [CrossRef]
- Mungai, N.; Motavalli, P.; Kremer, R.; Nelson, K. Spatial Variation of Soil Enzyme Activities and Microbial Diversity in Temperate Alley Cropping Systems. Biol. Fert. Soils 2005, 42, 129–136. [Google Scholar] [CrossRef]
- Jose, S.; Gillespie, A.; Seifert, J.; Mengel, D.; Pope, P. Defining Competition Vectors in a Temperate Alley Cropping System in the Midwestern USA. 3. Competition for Nitrogen and Litter Decomposition Dynamics. Agroforest. Syst. 2000, 48, 61–77. [Google Scholar]
- Soil Classification Working Group. The Canadian System of Soil Classification, 3rd ed.; NRC Research Press: Ottawa, ON, Canada, 1998. [Google Scholar]
- Warren, L.; Sweet, C. Caring for Alberta’s Rural Landscape: Manure and Pasture Management for Horse Owners; Alberta Agriculture, Food and Rural Development, Her Majesty the Queen in Right of Alberta: Alberta, Canada, 2003.
- Centre de Référence en Agriculture et Agroalimentaire du Québec (CRAAQ). Guide de Référence en Fertilisation, 2nd ed.; Centre de Référence en Agriculture et Agroalimentaire du Québec: Ste Foy, QC, Canada, 2010. [Google Scholar]
- Delate, K.; Holzmueller, E.; Frederick, D.; Mize, C.; Brummer, C. Tree Establishment and Growth using Forage Ground Covers in an Alley–cropped System in Midwestern USA. Agroforest. Syst. 2005, 65, 43–52. [Google Scholar] [CrossRef]
- Gap Light Analyzer (GLA), Version 2.0. Imaging Software to Extract Canopy Structure and Gap Light Transmission Indices from True-Colour Fisheye Photographs, Users Manual and Program Documentation. Simon Fraser University: Burnaby, BC, Canada, 1999.
- Bouttier, L.; Paquette, A.; Messier, C.; Rivest, D.; Olivier, A.; Cogliastro, A. Vertical Root Separation and Light Interception in a Temperate Tree-based Intercropping System of Eastern Canada. Agroforest. Syst. 2014. [Google Scholar] [CrossRef]
- Poirier, V.; Angers, D.; Rochette, P.; Chantigny, M.; Ziadi, N.; Tremblay, G.; Fortin, J. Interactive Effects of Tillage and Fertilization on Soil Carbon Profiles. Soil Sci. Soc. Am. J. 2009, 73, 255–261. [Google Scholar] [CrossRef]
© 2014 by the authors; licensee MDPI, Basel, Switzerland. This article is an open access article distributed under the terms and conditions of the Creative Commons Attribution license (http://creativecommons.org/licenses/by/3.0/).
Share and Cite
Winans, K.; Whalen, J.K.; Cogliastro, A.; Rivest, D.; Ribaudo, L. Soil Carbon Stocks in Two Hybrid Poplar-Hay Crop Systems in Southern Quebec, Canada. Forests 2014, 5, 1952-1966. https://doi.org/10.3390/f5081952
Winans K, Whalen JK, Cogliastro A, Rivest D, Ribaudo L. Soil Carbon Stocks in Two Hybrid Poplar-Hay Crop Systems in Southern Quebec, Canada. Forests. 2014; 5(8):1952-1966. https://doi.org/10.3390/f5081952
Chicago/Turabian StyleWinans, Kiara, Joann K. Whalen, Alain Cogliastro, David Rivest, and Lisa Ribaudo. 2014. "Soil Carbon Stocks in Two Hybrid Poplar-Hay Crop Systems in Southern Quebec, Canada" Forests 5, no. 8: 1952-1966. https://doi.org/10.3390/f5081952
APA StyleWinans, K., Whalen, J. K., Cogliastro, A., Rivest, D., & Ribaudo, L. (2014). Soil Carbon Stocks in Two Hybrid Poplar-Hay Crop Systems in Southern Quebec, Canada. Forests, 5(8), 1952-1966. https://doi.org/10.3390/f5081952