Contrasting Hydraulic Strategies during Dry Soil Conditions in Quercus rubra and Acer rubrum in a Sandy Site in Michigan

 ,
,
Abstract
:1. Introduction
2. Experimental Section
2.1. Study Site
2.2. Meteorological Data
2.3. Soil Moisture Measurements
2.4. Leaf Water Potential Measurements
2.5. Statistical Analysis
3. Results and Discussion
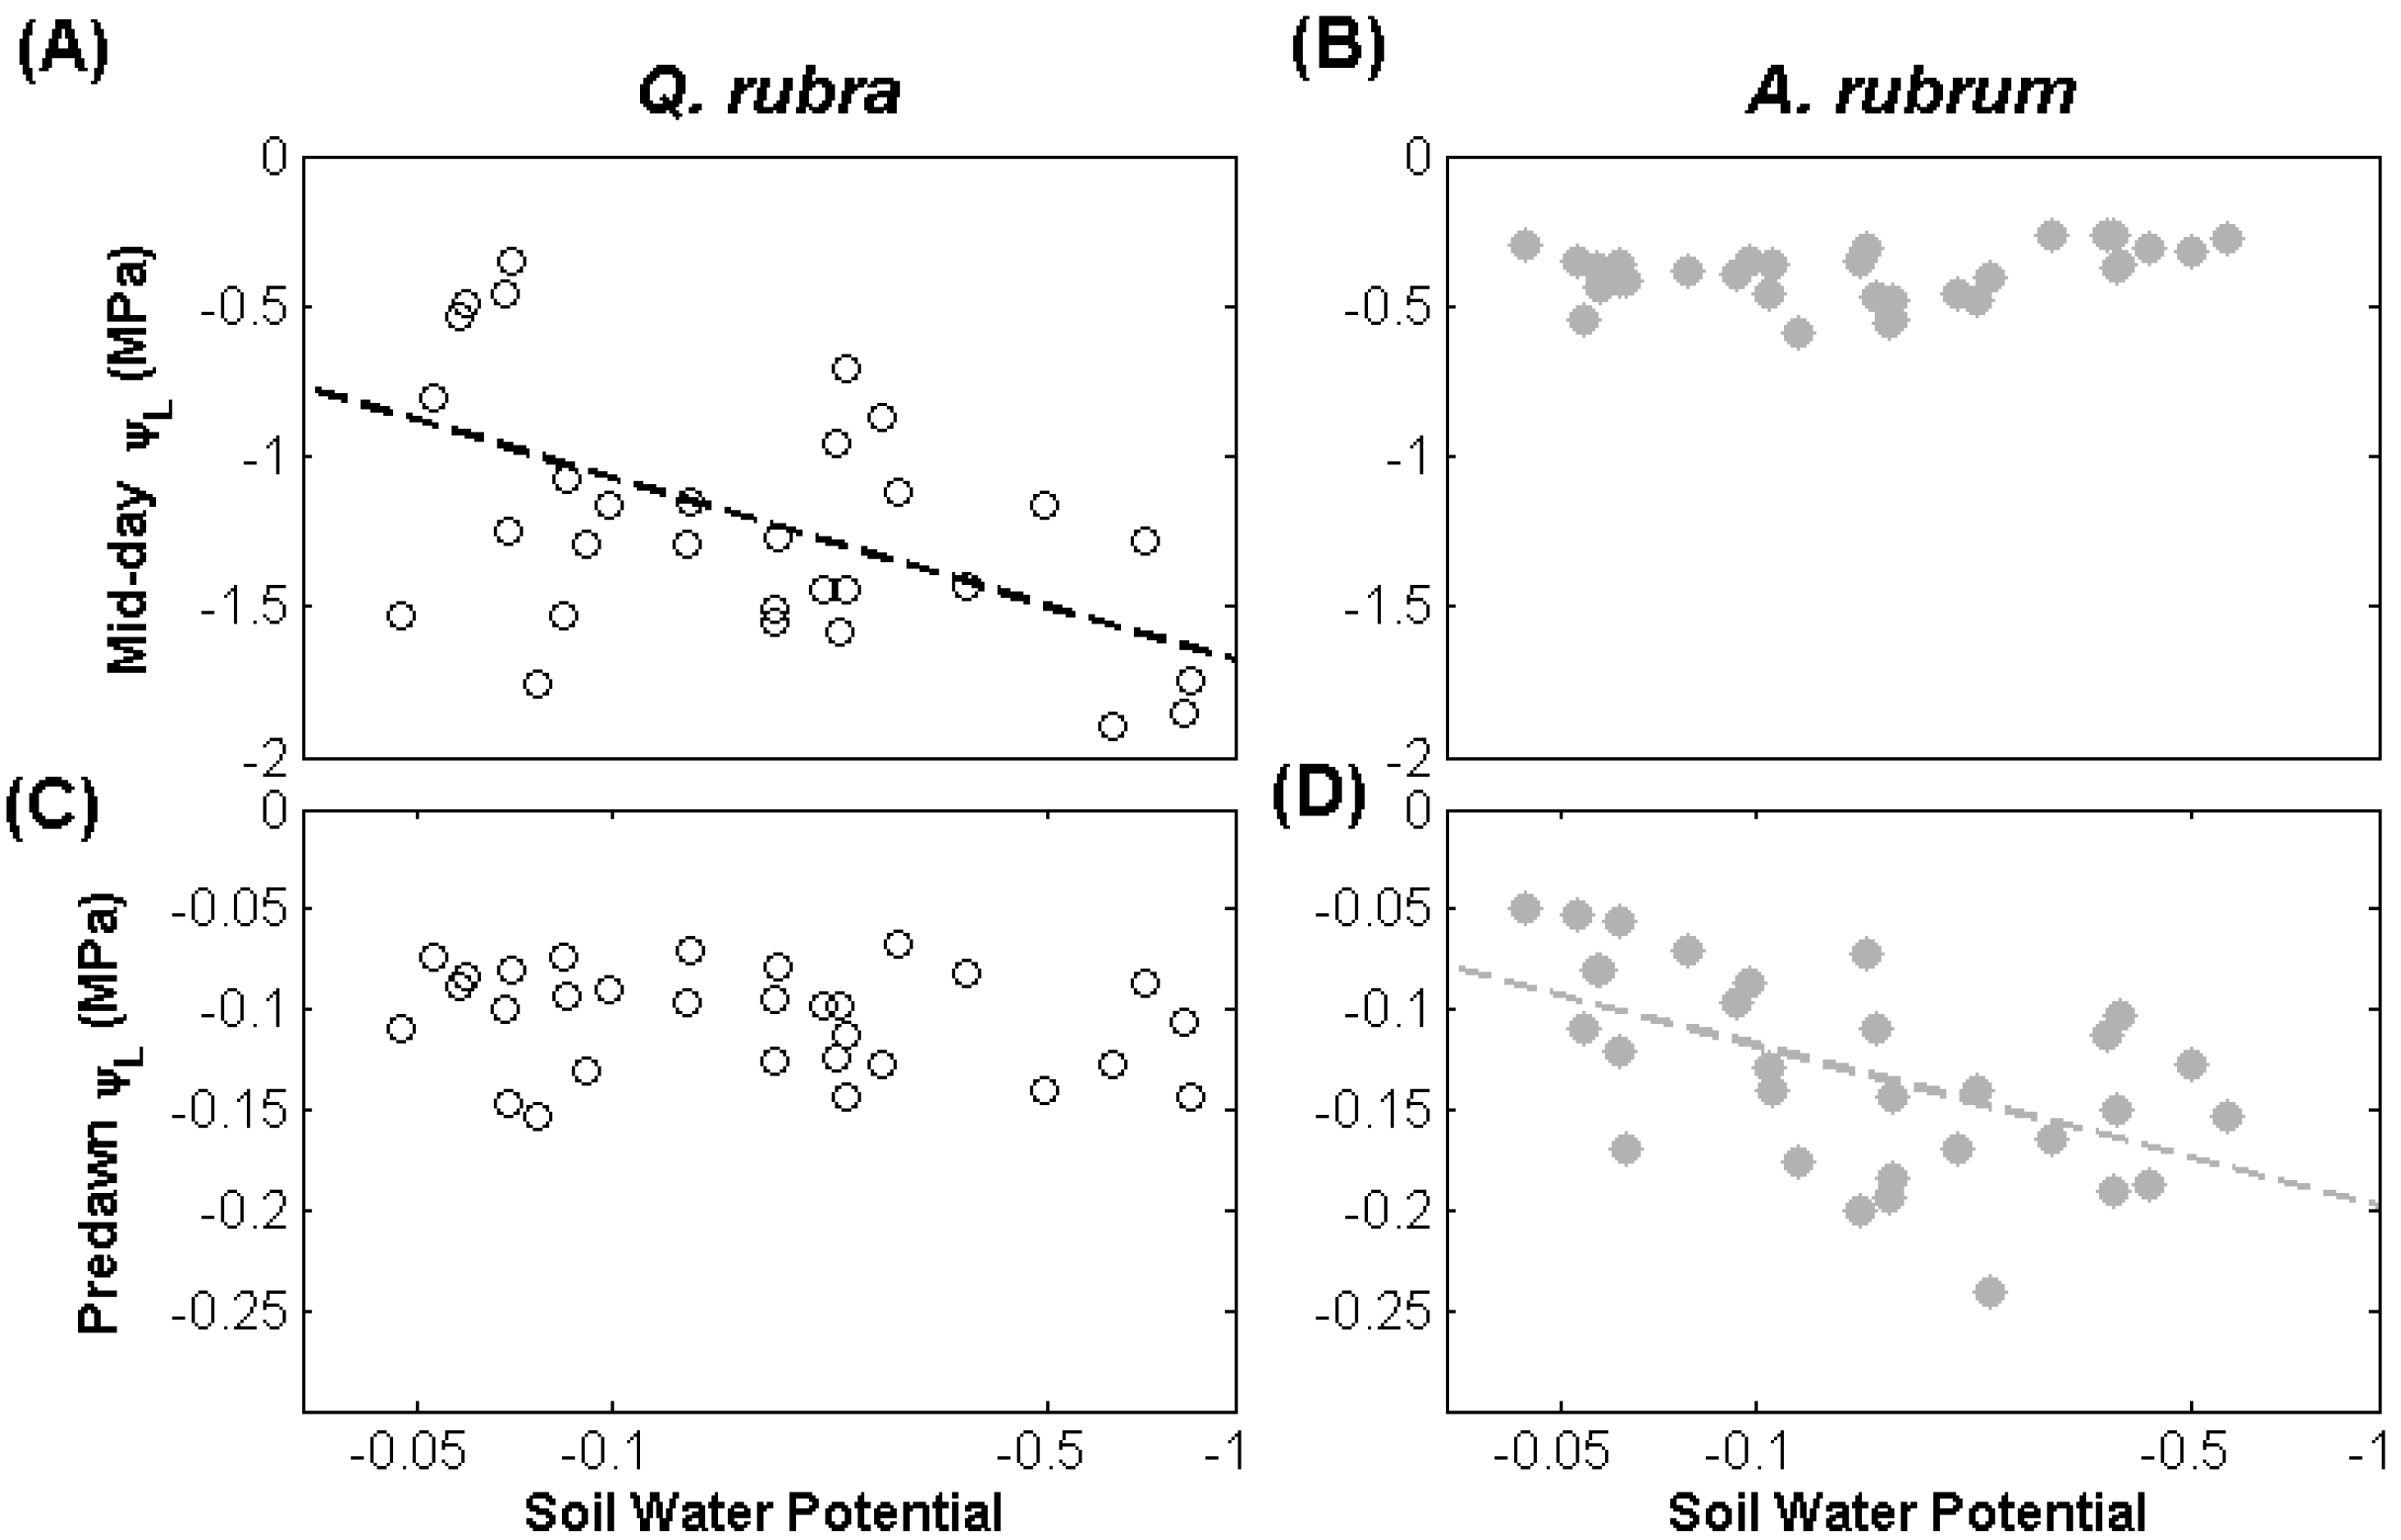
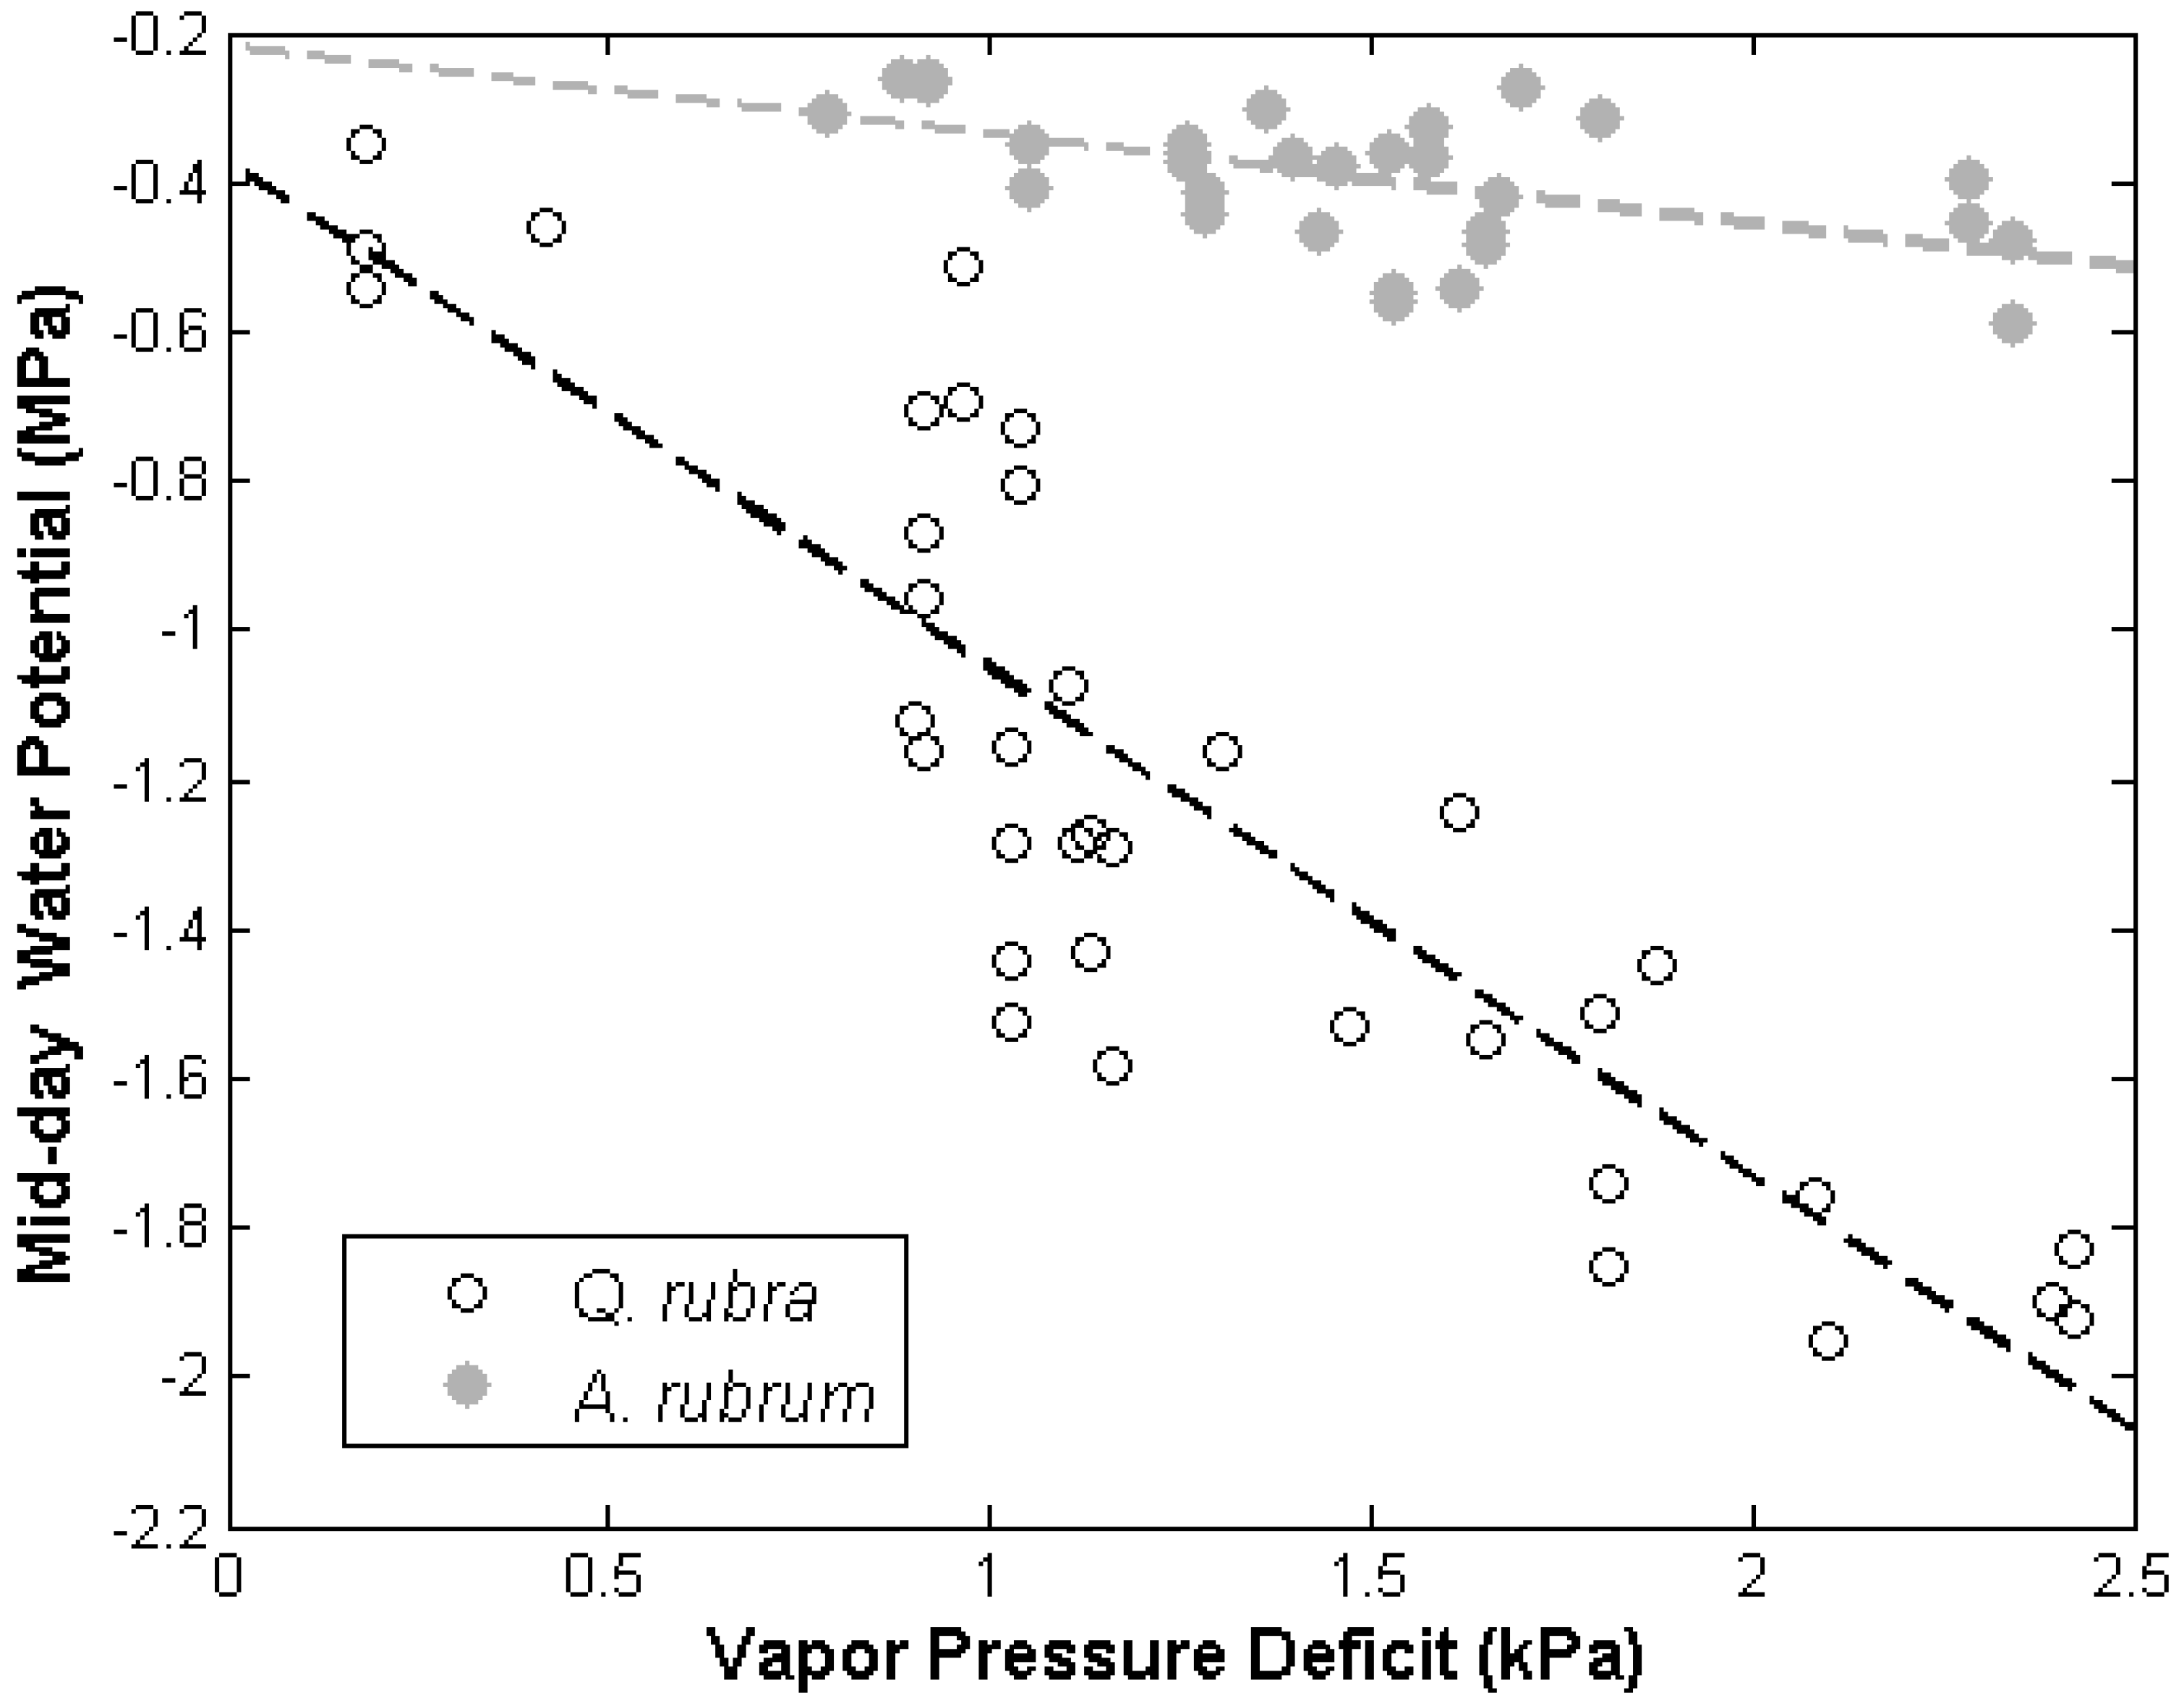
3.1. Leaf Water Potential

| VPD, SM combinations | |||||
|---|---|---|---|---|---|
| VPD measurements height | 46 m | 46 m | 3 m | 3 m | |
| SM integration depth | 0–30 cm | 0–60 cm | 0–30 cm | 0–60 cm | |
| Effects on minimum daily leaf water potential | Species | <0.001 | 0.009 | <0.001 | 0.012 |
| SM | 0.638 (NS) | 0.461 (NS) | 0.128 (NS) | 0.180 (NS) | |
| VPD | 0.873 (NS) | 0.448 (NS) | 0.157 (NS) | 0.129 (NS) | |
| Species × SM | 0.001 | 0.027 | 0.003 | 0.041 | |
| Species × VPD | <0.001 | <0.001 | <0.001 | <0.001 | |
| SM × VPD | 0.434 (NS) | 0.244 (NS) | 0.037 | 0.052 (NS) | |

3.2. Discussion
4. Conclusions
Acknowledgments
Conflicts of Interest
References
- Bates, B.; Kundzewicz, Z.W.; Wu, S.; Palutikof, J. Climate Change and Water. Technical Paper of the Intergovernmental Panel on Climate Change; IPCC Secretariat: Geneva, Switzerland, 2008; p. 210. [Google Scholar]
- Bovard, B.D.; Curtis, P.S.; Vogel, C.S.; Su, H.B.; Schmid, H.P. Environmental controls on sap flow in a northern hardwood forest. Tree Physiol. 2005, 25, 31–38. [Google Scholar] [CrossRef]
- Perry, D.A.; Oren, R.; Hart, S.C. Forest Ecosystems; The Johns Hopkins University Press: Baltimore, MD, USA, 2008; p. 632. [Google Scholar]
- Lambers, H.; Chapin, F.S.; Pons, T.L. Plant Physiological Ecology, 2nd ed.; Springer: New York, NY, USA, 2008; p. 640. [Google Scholar]
- Bradford, K.J.; Hsiao, T.C. Physiological Responses to Moderate Water Stress. In Physiological Plant Ecology; Lange, O.L., Nobel, P.S., Osmond, C.B., Zieler, H., Eds.; Springer-Verlag: New York, NY, USA, 1982; pp. 263–324. [Google Scholar]
- Sperry, J.S. Relationship of xylem embolism to xylem pressure potential, stomatal closure, and shoot morphology in the palm Rhapis excelsa. Plant Physiol. 1986, 80, 110–116. [Google Scholar] [CrossRef]
- Sperry, J.S.; Tyree, M.T. Mechanism of water stress-induced xylem embolism. Plant Physiol. 1988, 88, 581–587. [Google Scholar] [CrossRef]
- Sperry, J.S. Hydraulic constraints on plant gas exchange. Agric. For. Meteorol. 2000, 104, 13–23. [Google Scholar] [CrossRef]
- Bush, S.E.; Pataki, D.E.; Hultine, K.R.; West, A.G.; Sperry, J.S.; Ehleringer, J.R. Wood anatomy constrains stomatal responses to atmospheric vapor pressure deficit in irrigated, urban trees. Oecologia 2008, 156, 13–20. [Google Scholar] [CrossRef]
- Litvak, E.; McCarthy, H.R.; Pataki, D.E. Transpiration sensitivity of urban trees in a semi-arid climate is constrained by xylem vulnerability to cavitation. Tree Physiol. 2012, 32, 373–388. [Google Scholar] [CrossRef]
- Sperry, J.S.; Hacke, U.G.; Oren, R.; Comstock, J.P. Water deficits and hydraulic limits to leaf water supply. Plant Cell Environ. 2002, 25, 251–263. [Google Scholar] [CrossRef]
- Bond, B.J.; Kavanagh, K.L. Stomatal behavior of four woody species in relation to leaf-specific hydraulic conductance and threshold water potential. Tree Physiol. 1999, 19, 503–510. [Google Scholar] [CrossRef]
- Oren, R.; Pataki, D.E. Transpiration in response to variation in microclimate and soil moisture in southeastern deciduous forests. Oecologia 2001, 127, 549–559. [Google Scholar] [CrossRef]
- Ford, C.R.; Hubbard, R.M.; Vose, J.M. Quantifying structural and physiological controls on variation in canopy transpiration among planted pine and hardwood species in the southern Appalachians. Ecohydrology 2011, 4, 183–195. [Google Scholar] [CrossRef]
- Larcher, W. Physiological Plant Ecology: Ecophysiology and Stress Physiology of Functional Groups; Springer-Verlag: Berlin, Germany, 1997; p. 513. [Google Scholar]
- Pallardy, S.G.; Rhoads, J.L. Mophological adaptations to drought in seedlings of deciduous angiosperms. Can. J. For. Res. 1993, 23, 1766–1774. [Google Scholar] [CrossRef]
- Hacke, U.G.; Sperry, J.S.; Pockman, W.T.; Davis, S.D.; McCulloch, K.A. Trends in wood density and structure are linked to prevention of xylem implosion by negative pressure. Oecologia 2001, 126, 457–461. [Google Scholar] [CrossRef]
- Taneda, H.; Sperry, J.S. A case-study of water transport in co-occurring ring- vs. diffuse-porous trees: Contrasts in water-status, conducting capacity, cavitation and vessel refilling. Tree Physiol. 2008, 28, 1641–1651. [Google Scholar] [CrossRef]
- Maherali, H.; Moura, C.F.; Caldeira, M.C.; Willson, C.J.; Jackson, R.B. Functional coordination between leaf gas exchange and vulnerability to xylem cavitation in temperate forest trees. Plant Cell Environ. 2006, 29, 571–583. [Google Scholar] [CrossRef]
- Tyree, M.T.; Zimmermann, M.H. Xylem Structure and the Ascent of Sap. Springer: Berlin, Germany, 2002; p. 279. [Google Scholar]
- Meinzer, F.C.; Woodruff, D.R.; Eissenstat, D.M.; Lin, H.S.; Adams, T.S.; McCulloh, K.A. Above- and belowground controls on water use by trees of different wood types in an eastern US deciduous forest. Tree Physiol. 2013, 33, 345–356. [Google Scholar] [CrossRef]
- Ivanov, V.Y.; Hutyra, L.R.; Wofsy, S.C.; Munger, J.W.; Saleska, S.R.; de Oliveira, R.C.; de Camargo, P.B. Root niche separation can explain avoidance of seasonal drought stress and vulnerability of overstory trees to extended drought in a mature Amazonian forest. Water Resour. Res. 2012, 48. [Google Scholar] [CrossRef]
- Nave, L.; Gough, C.M.; Maurer, K.; Bohrer, G.; Hardiman, B.S.; Le Moine, J.; Munoz, A.; Nadelhoffer, K.J.; Sparks, J.P.; Strahm, B.; et al. Disturbance and the resilience of coupled carbon and nitrogen cycling in a north temperate forest. J. Geophys. Res. 2011, 116. [Google Scholar] [CrossRef]
- Gough, C.M.; Hardiman, B.S.; Nave, L.E.; Bohrer, G.; Maurer, K.D.; Vogel, C.S.; Nadelhoffer, K.J.; Curtis, P.S. Sustained carbon uptake and storage following moderate disturbance in a Great Lakes forest. Ecol. Appl. 2013, 23, 1202–1215. [Google Scholar] [CrossRef]
- He, L.; Ivanov, V.Y.; Bohrer, G.; Thomsen, J.E.; Vogel, C.S.; Moghaddam, M. Temporal dynamics of soil moisture in a northern temperate mixed successional forest after a prescribed intermediate disturbance. Agric. For. Meteorol. 2013, 180, 22–33. [Google Scholar] [CrossRef]
- Schmid, H.P.; Su, H.B.; Vogel, C.S.; Curtis, P.S. Ecosystem-Atmosphere exchange of carbon dioxide over a mixed hardwood forest in northern lower Michigan. J. Geophys. Res. 2003, 108. [Google Scholar] [CrossRef]
- Pressley, S.; Lamb, B.; Westberg, H.; Flaherty, J.; Chen, J.; Vogel, C. Long-Term isoprene flux measurements above a northern hardwood forest. J. Geophys. Res. 2005, 110. [Google Scholar] [CrossRef]
- Sutterley, T. Personal communication. University of Michigan Biological Station: Pellston, MI, USA, 2010. [Google Scholar]
- Maurer, K.D.; Hardiman, B.S.; Vogel, C.S.; Bohrer, G. Canopy-Structure effects on surface roughness parameters: Observations in a Great Lakes mixed-deciduous forest. Agric. For. Meteorol. 2013, 177, 24–34. [Google Scholar] [CrossRef]
- Van Genuchten, M.T. A closed-form equation for predicting the hydraulic conductivity of unsaturated soils. Soil Sci. Soc. Am. J. 1980, 44, 892–898. [Google Scholar] [CrossRef]
- He, L.; Ivanov, V.Y.; Bohrer, G.; Maurer, K.D.; Vogel, C.S.; Moghaddam, M. Effects of fine-scale soil moisture and canopy heterogeneity on energy and water fluxes in a northern temperate mixed forest. Agric. For. Meteorol. 2014, 184, 243–256. [Google Scholar] [CrossRef]
- Bréda, N.; Granier, A.; Barataud, F.; Moyne, C. Soil-Water dynamics in an oak stand. I. Soil-Moisture, water potentials and water-uptake by roots. Plant Soil 1995, 172, 17–27. [Google Scholar] [CrossRef]
- Jackson, R.B.; Moore, L.A.; Hoffmann, W.A.; Pockman, W.T.; Linder, C.R. Ecosystem rooting depth determined with caves and DNA. Proc. Natl. Acad. Sci. USA 1999, 96, 11387–11392. [Google Scholar] [CrossRef]
- Barnes, B.V.; Wagner, W.H. Michigan Trees, Revised and Updated: A Guide to the Trees of the Great Lakes Region; University of Michigan Press: Ann Arbor, MI, USA, 2004; p. 456. [Google Scholar]
- Cubera, E.; Moreno, G. Effect of single Quercus ilex trees upon spatial and seasonal changes in soil water content in dehesas of central western Spain. Ann. For. Sci. 2007, 64, 355–364. [Google Scholar] [CrossRef]
- Elfving, D.C.; Hall, A.E.; Kaufmann, M.R. Interpreting leaf water potential measurements with a model of soil-plant-atmosphere continuum. Physiol. Plant. 1972, 27, 161–170. [Google Scholar] [CrossRef]
- Turner, N.C.; Schulze, E.D.; Gollan, T. The responses of stomata and leaf gas exchange to vapour pressure deficits and soil water content. 1. Species comparisons at high soil water contents. Oecologia 1984, 63, 338–342. [Google Scholar] [CrossRef]
- McDowell, N.; Pockman, W.T.; Allen, C.D.; Breshears, D.D.; Cobb, N.; Kolb, T.; Plaut, J.; Sperry, J.; West, A.; Williams, D.G.; et al. Mechanisms of plant survival and mortality during drought: Why do some plants survive while others succumb to drought? New Phytol. 2008, 178, 719–739. [Google Scholar] [CrossRef]
- Ni, B.-R.; Pallardy, S.G. Response of liquid flow resistance to soil drying in seedlings of four deciduous angiosperms. Oecologia 1990, 84, 260–264. [Google Scholar]
- Cruiziat, P.; Cochard, H.; Améglio, T. Hydraulic architecture of trees: Main concepts and results. Ann. For. Sci. 2002, 59, 723–752. [Google Scholar] [CrossRef]
- Manzoni, S.; Vico, G.; Katul, G.G.; Palmroth, S.; Jackson, R.B.; Porporato, A. Hydraulic limits on maximum plant transpiration and the emergence of the safety-efficiency tradeoff. New Phytol. 2013, 198, 169–178. [Google Scholar] [CrossRef]
- Whitehead, D.; Edwards, W.R.N.; Jarvis, P.G. Conducting sapwood area, foliage area, and permeability in mature trees of Picea sitchensis and Pinus contorta. Can. J. For. Res. 1984, 14, 940–947. [Google Scholar] [CrossRef]
- Magnani, F.; Mencuccini, M.; Grace, J. Age-Related decline in stand productivity: The role of structural acclimation under hydraulic constraints. Plant Cell Environ. 2000, 23, 251–263. [Google Scholar] [CrossRef]
- Bohrer, G.; Mourad, H.; Laursen, T.A.; Drewry, D.; Avissar, R.; Poggi, D.; Oren, R.; Katul, G.G. Finite-Element Tree Crown Hydrodynamics model (FETCH) using porous media flow within branching elements—A new representation of tree hydrodynamics. Water Resour. Res. 2005, 41. [Google Scholar] [CrossRef]
- Zeppel, M.; Macinnis-Ng, C.; Palmer, A.; Taylor, D.; Whitley, R.; Fuentes, S.; Yunusa, I.; Williams, M.; Eamus, D. An analysis of the sensitivity of sap flux to soil and plant variables assessed for an Australian woodland using a soil-plant-atmosphere model. Funct. Plant Biol. 2008, 35, 509–520. [Google Scholar] [CrossRef]
- Janott, M.; Gayler, S.; Gessler, A.; Javaux, M.; Klier, C.; Priesack, E. A one-dimensional model of water flow in soil-plant systems based on plant architecture. Plant Soil 2011, 341, 233–256. [Google Scholar] [CrossRef]
© 2013 by the authors; licensee MDPI, Basel, Switzerland. This article is an open access article distributed under the terms and conditions of the Creative Commons Attribution license (http://creativecommons.org/licenses/by/3.0/).
Share and Cite
Thomsen, J.E.; Bohrer, G.; Matheny, A.M.; Ivanov, V.Y.; He, L.; Renninger, H.J.; Schäfer, K.V.R. Contrasting Hydraulic Strategies during Dry Soil Conditions in Quercus rubra and Acer rubrum in a Sandy Site in Michigan. Forests 2013, 4, 1106-1120. https://doi.org/10.3390/f4041106
Thomsen JE, Bohrer G, Matheny AM, Ivanov VY, He L, Renninger HJ, Schäfer KVR. Contrasting Hydraulic Strategies during Dry Soil Conditions in Quercus rubra and Acer rubrum in a Sandy Site in Michigan. Forests. 2013; 4(4):1106-1120. https://doi.org/10.3390/f4041106
Chicago/Turabian StyleThomsen, Julia E., Gil Bohrer, Ashley M. Matheny, Valeriy Y. Ivanov, Lingli He, Heidi J. Renninger, and Karina V. R. Schäfer. 2013. "Contrasting Hydraulic Strategies during Dry Soil Conditions in Quercus rubra and Acer rubrum in a Sandy Site in Michigan" Forests 4, no. 4: 1106-1120. https://doi.org/10.3390/f4041106
APA StyleThomsen, J. E., Bohrer, G., Matheny, A. M., Ivanov, V. Y., He, L., Renninger, H. J., & Schäfer, K. V. R. (2013). Contrasting Hydraulic Strategies during Dry Soil Conditions in Quercus rubra and Acer rubrum in a Sandy Site in Michigan. Forests, 4(4), 1106-1120. https://doi.org/10.3390/f4041106