Modeling Young Stand Development towards the Old-Growth Reference Condition in Evergreen Mixed-Conifer Stands at Headwaters Forest Reserve, California

Abstract
:1. Introduction
2. Methods
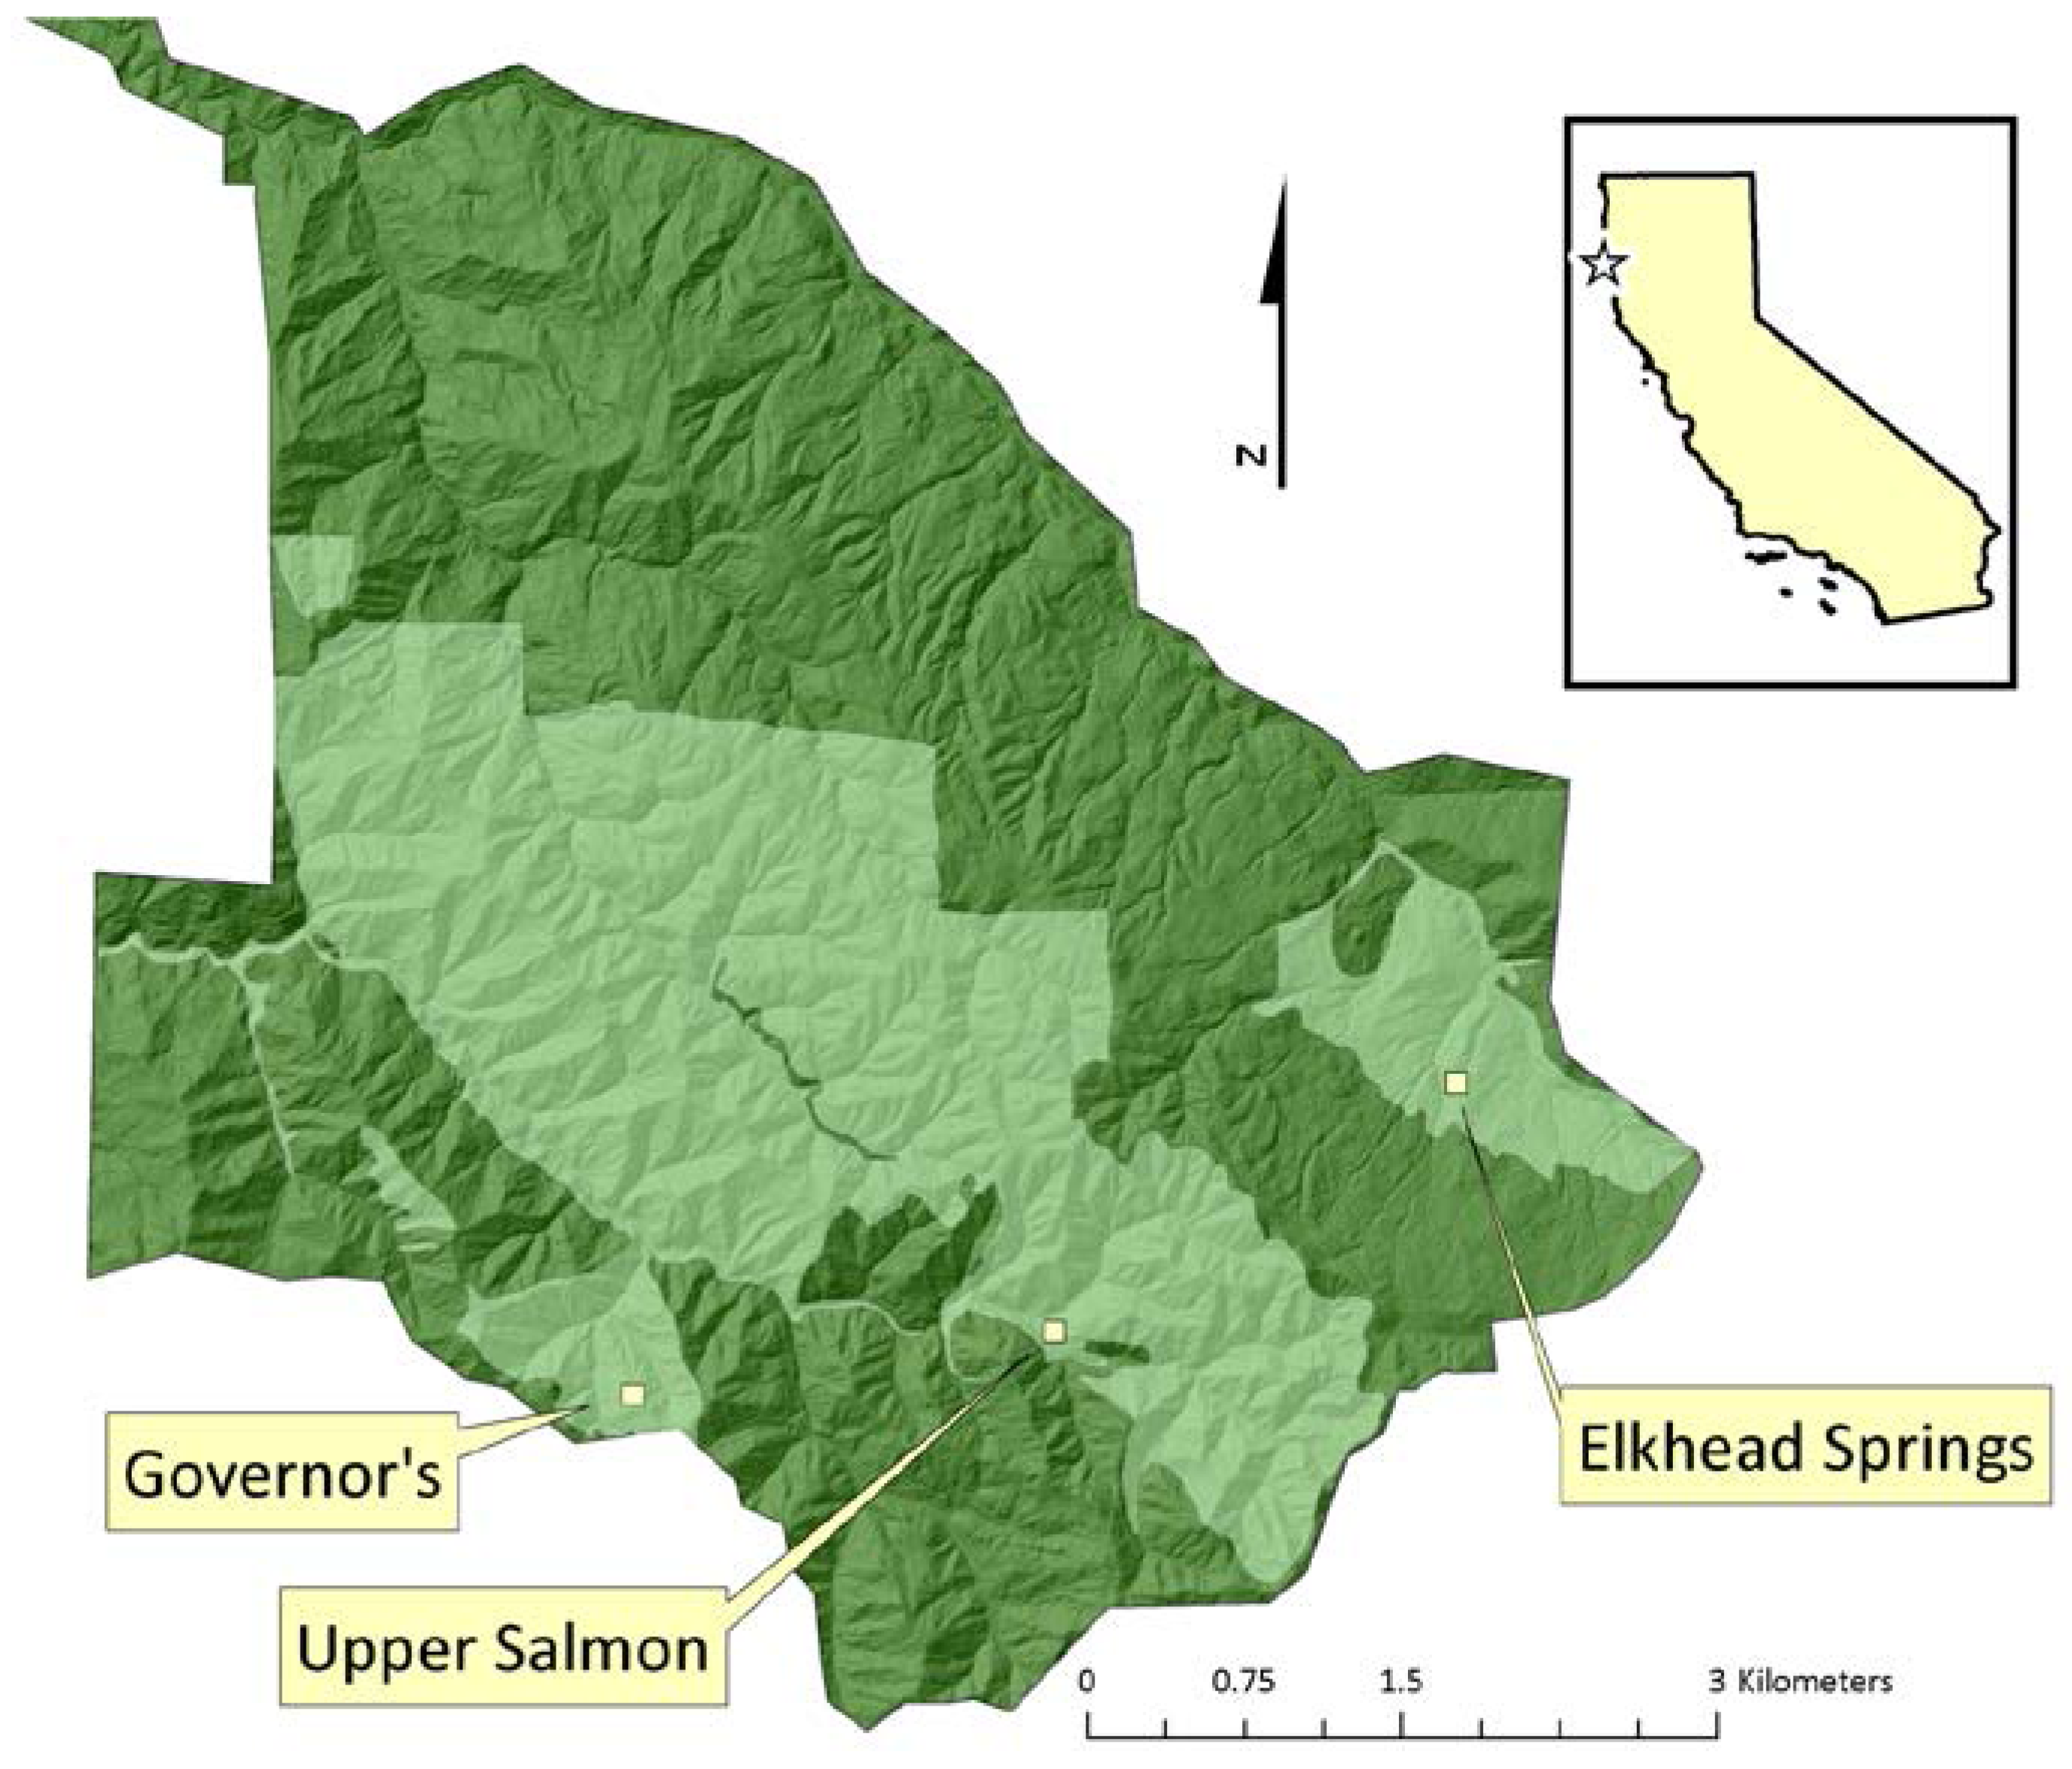
2.1. Study Site

2.2. Old-Growth Reference Plots
2.3. Retrospective Growth Analysis in Harvested Stands
- Species (redwood or Douglas-fir);
- Size class (dbh ranges of 10–20 cm, 20–40 cm, 40–60 cm, 60–100 cm, and >100 cm);
- Competition (basal area ranges of 0–30 m2 ha−1, 30–60 m2 ha−1, and >60 m2 ha−1), and;
- Adjacent old-growth reference plot (Governor’s, Upper Salmon, and Elkhead Springs).


2.4. Simulating Growth towards the Reference Condition

| 2005 Mean Dbh (cm) | 2005 Density (stems ha−1) | 2011 Regeneration Density (stems ha−1) | |
|---|---|---|---|
| Redwood | 19.6 | 195 | 280 |
| Douglas-fir | 12.7 | 275 | 480 |
| Hardwood | 20.6 | 80 | - |
3. Results and Discussion
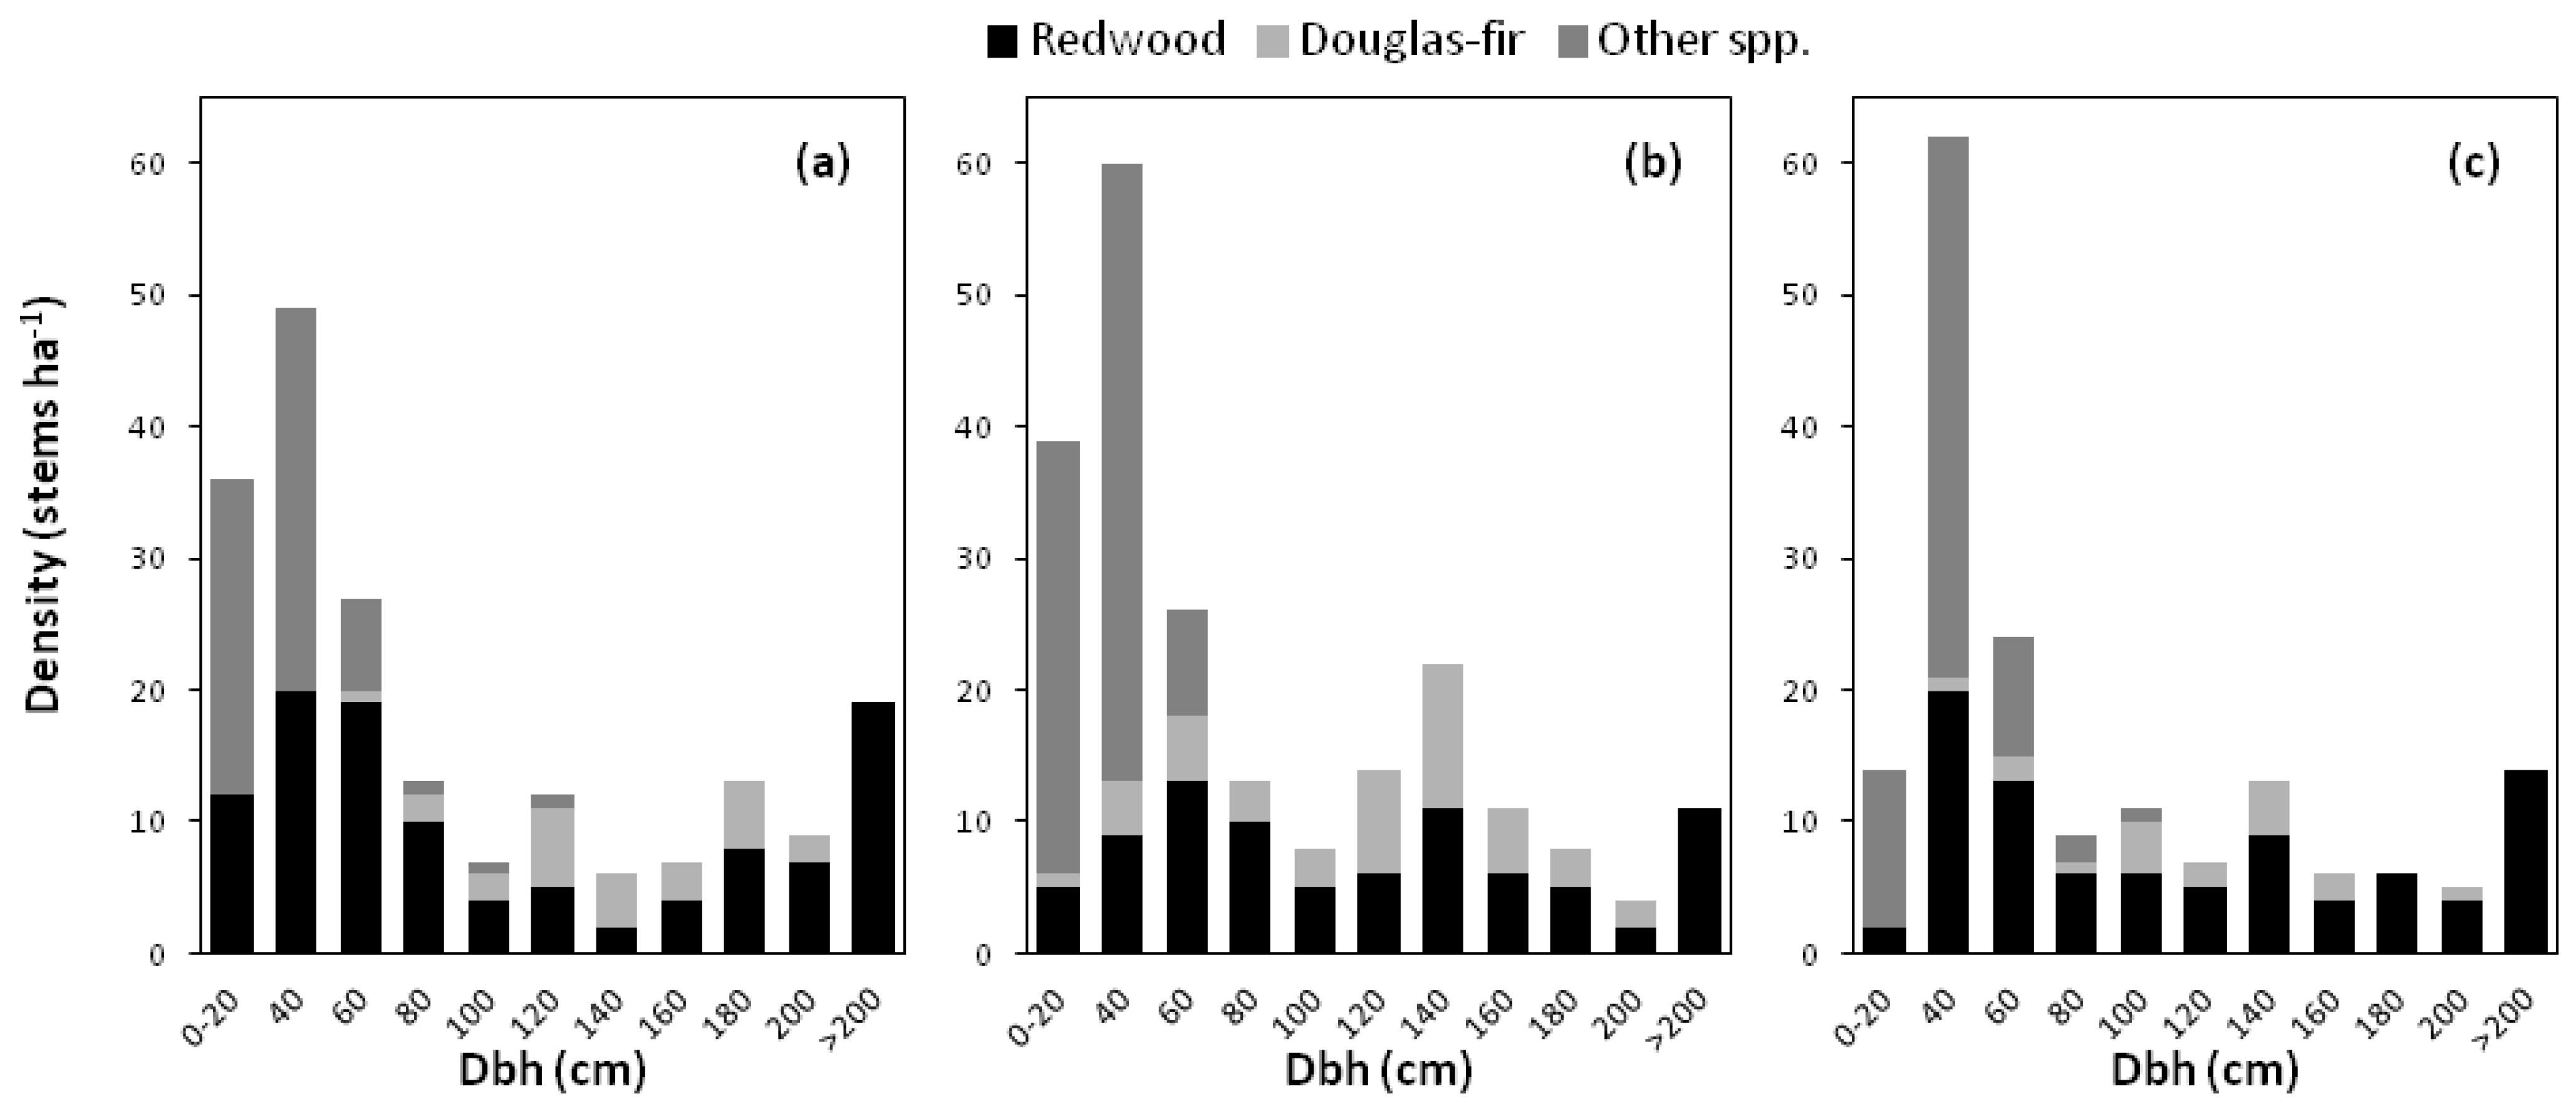
3.1. Old-Growth Reference Conditions
| Site and species | Density (stems ha−1) | SDI | Mean Dbh (cm) | Max. Dbh (cm) | Crown Ratio | Max. Ht. (m) | ||||
|---|---|---|---|---|---|---|---|---|---|---|
| u | o | u | o | u | o | u | o | |||
| Governor’s Grove | ||||||||||
| Redwood | 74 | 36 | 336 | 1108 | 55.4 | 207.9 | 305.3 | 0.52 | 0.59 | 79.7 |
| Douglas-fir | 4 | 21 | 34 | 336 | 88.9 | 138.8 | 192.0 | 0.39 | 0.47 | 80.0 |
| Grand fir | 44 | 1 | 67 | 9 | 29.9 | 101.0 | 101.0 | 0.39 | 0.53 | 63.7 |
| Tanoak | 18 | 0 | 16 | 0 | 22.8 | - | 36.0 | |||
| Total | 140 | 58 | 453 | 1454 | 44.2 | 181.0 | ||||
| Salmon Pass | ||||||||||
| Redwood | 51 | 32 | 345 | 750 | 71.3 | 172.4 | 350.2 | 0.51 | 0.54 | 77.1 |
| Douglas-fir | 16 | 29 | 68 | 438 | 57.2 | 134.2 | 191.3 | 0.50 | 0.56 | 81.0 |
| Tanoak | 86 | 0 | 86 | 0 | 24.1 | - | 58.6 | |||
| California bay | 2 | 0 | 7 | 0 | 52.4 | - | 55.3 | |||
| Total | 155 | 61 | 504 | 1188 | 43.4 | 154.2 | ||||
| Elkhead Springs | ||||||||||
| Redwood | 55 | 34 | 248 | 920 | 58.7 | 190.6 | 347.5 | 0.47 | 0.62 | 84.1 |
| Douglas-fir | 3 | 14 | 9 | 171 | 49.2 | 116.4 | 192.1 | 0.36 | 0.52 | 74.8 |
| Tanoak | 65 | 0 | 102 | 0 | 31.3 | - | 84.6 | |||
| Total | 123 | 48 | 359 | 1091 | 44.0 | 169.0 | ||||
| Governor’s | Upper Salmon | Elkhead Springs | ||||
|---|---|---|---|---|---|---|
| Count | % Redwood | Count | % Redwood | Count | % Redwood | |
| Large snags | 3 | 100 | 2 | 50 | 7 | 57 |
| Small snags | 18 | 17 | 6 | 50 | 9 | 56 |
| Basal stem cavities | 14 | 93 | 11 | 100 | 3 | 100 |
| Reiterations | 5 | 100 | 4 | 100 | 2 | 100 |
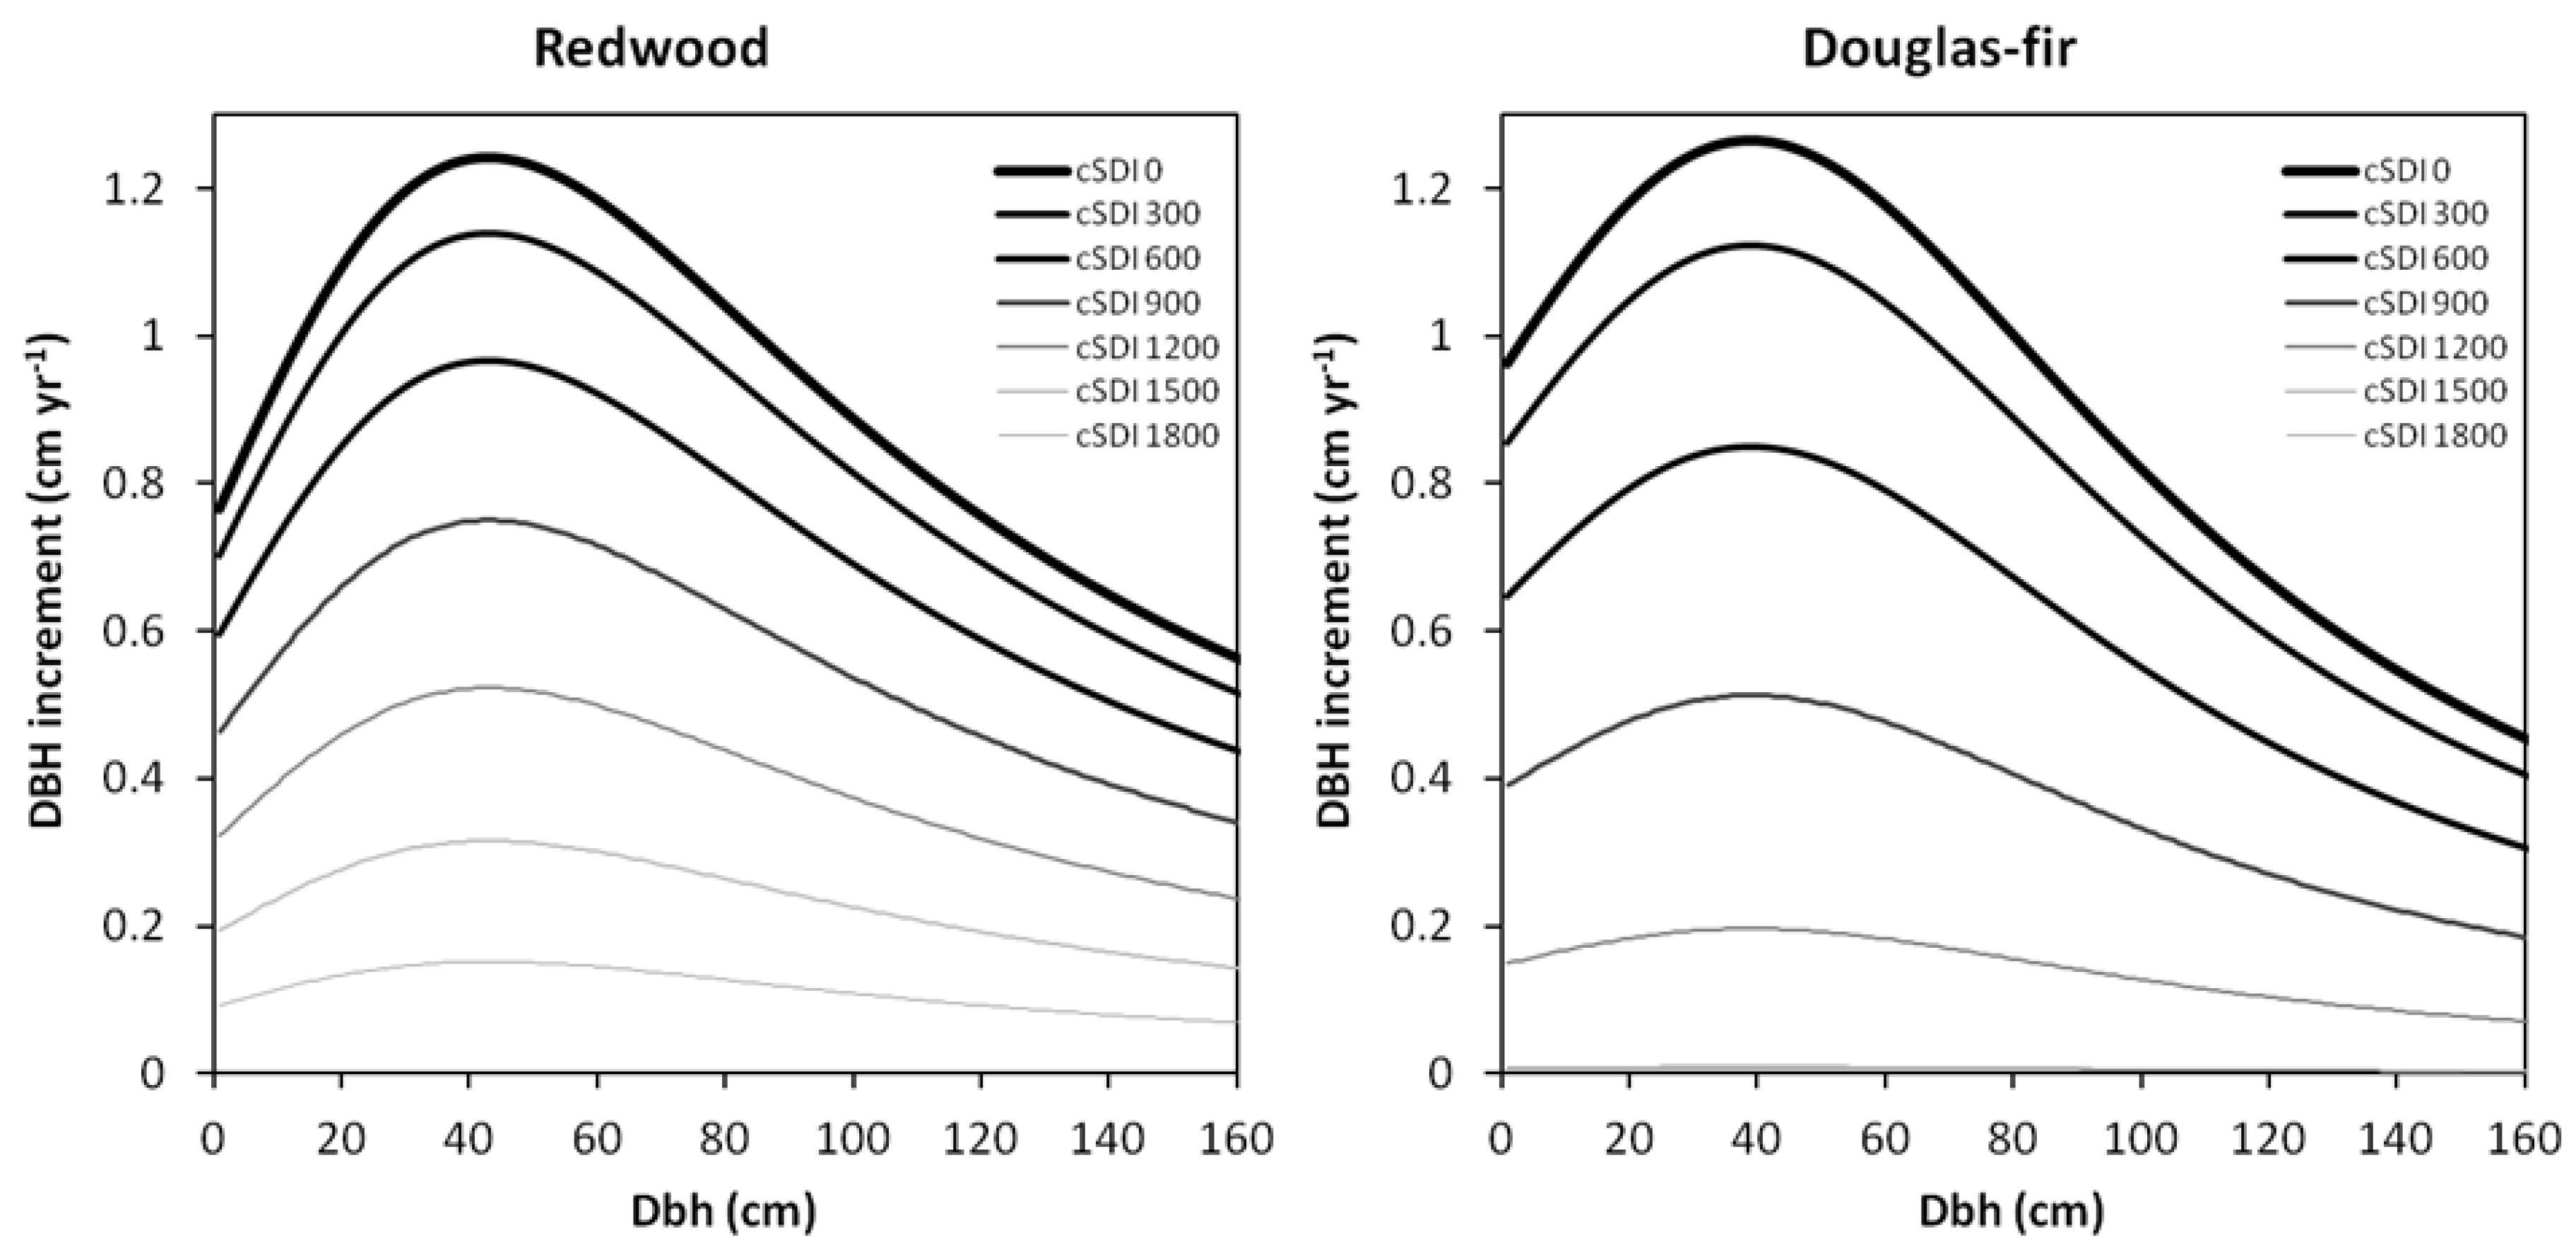
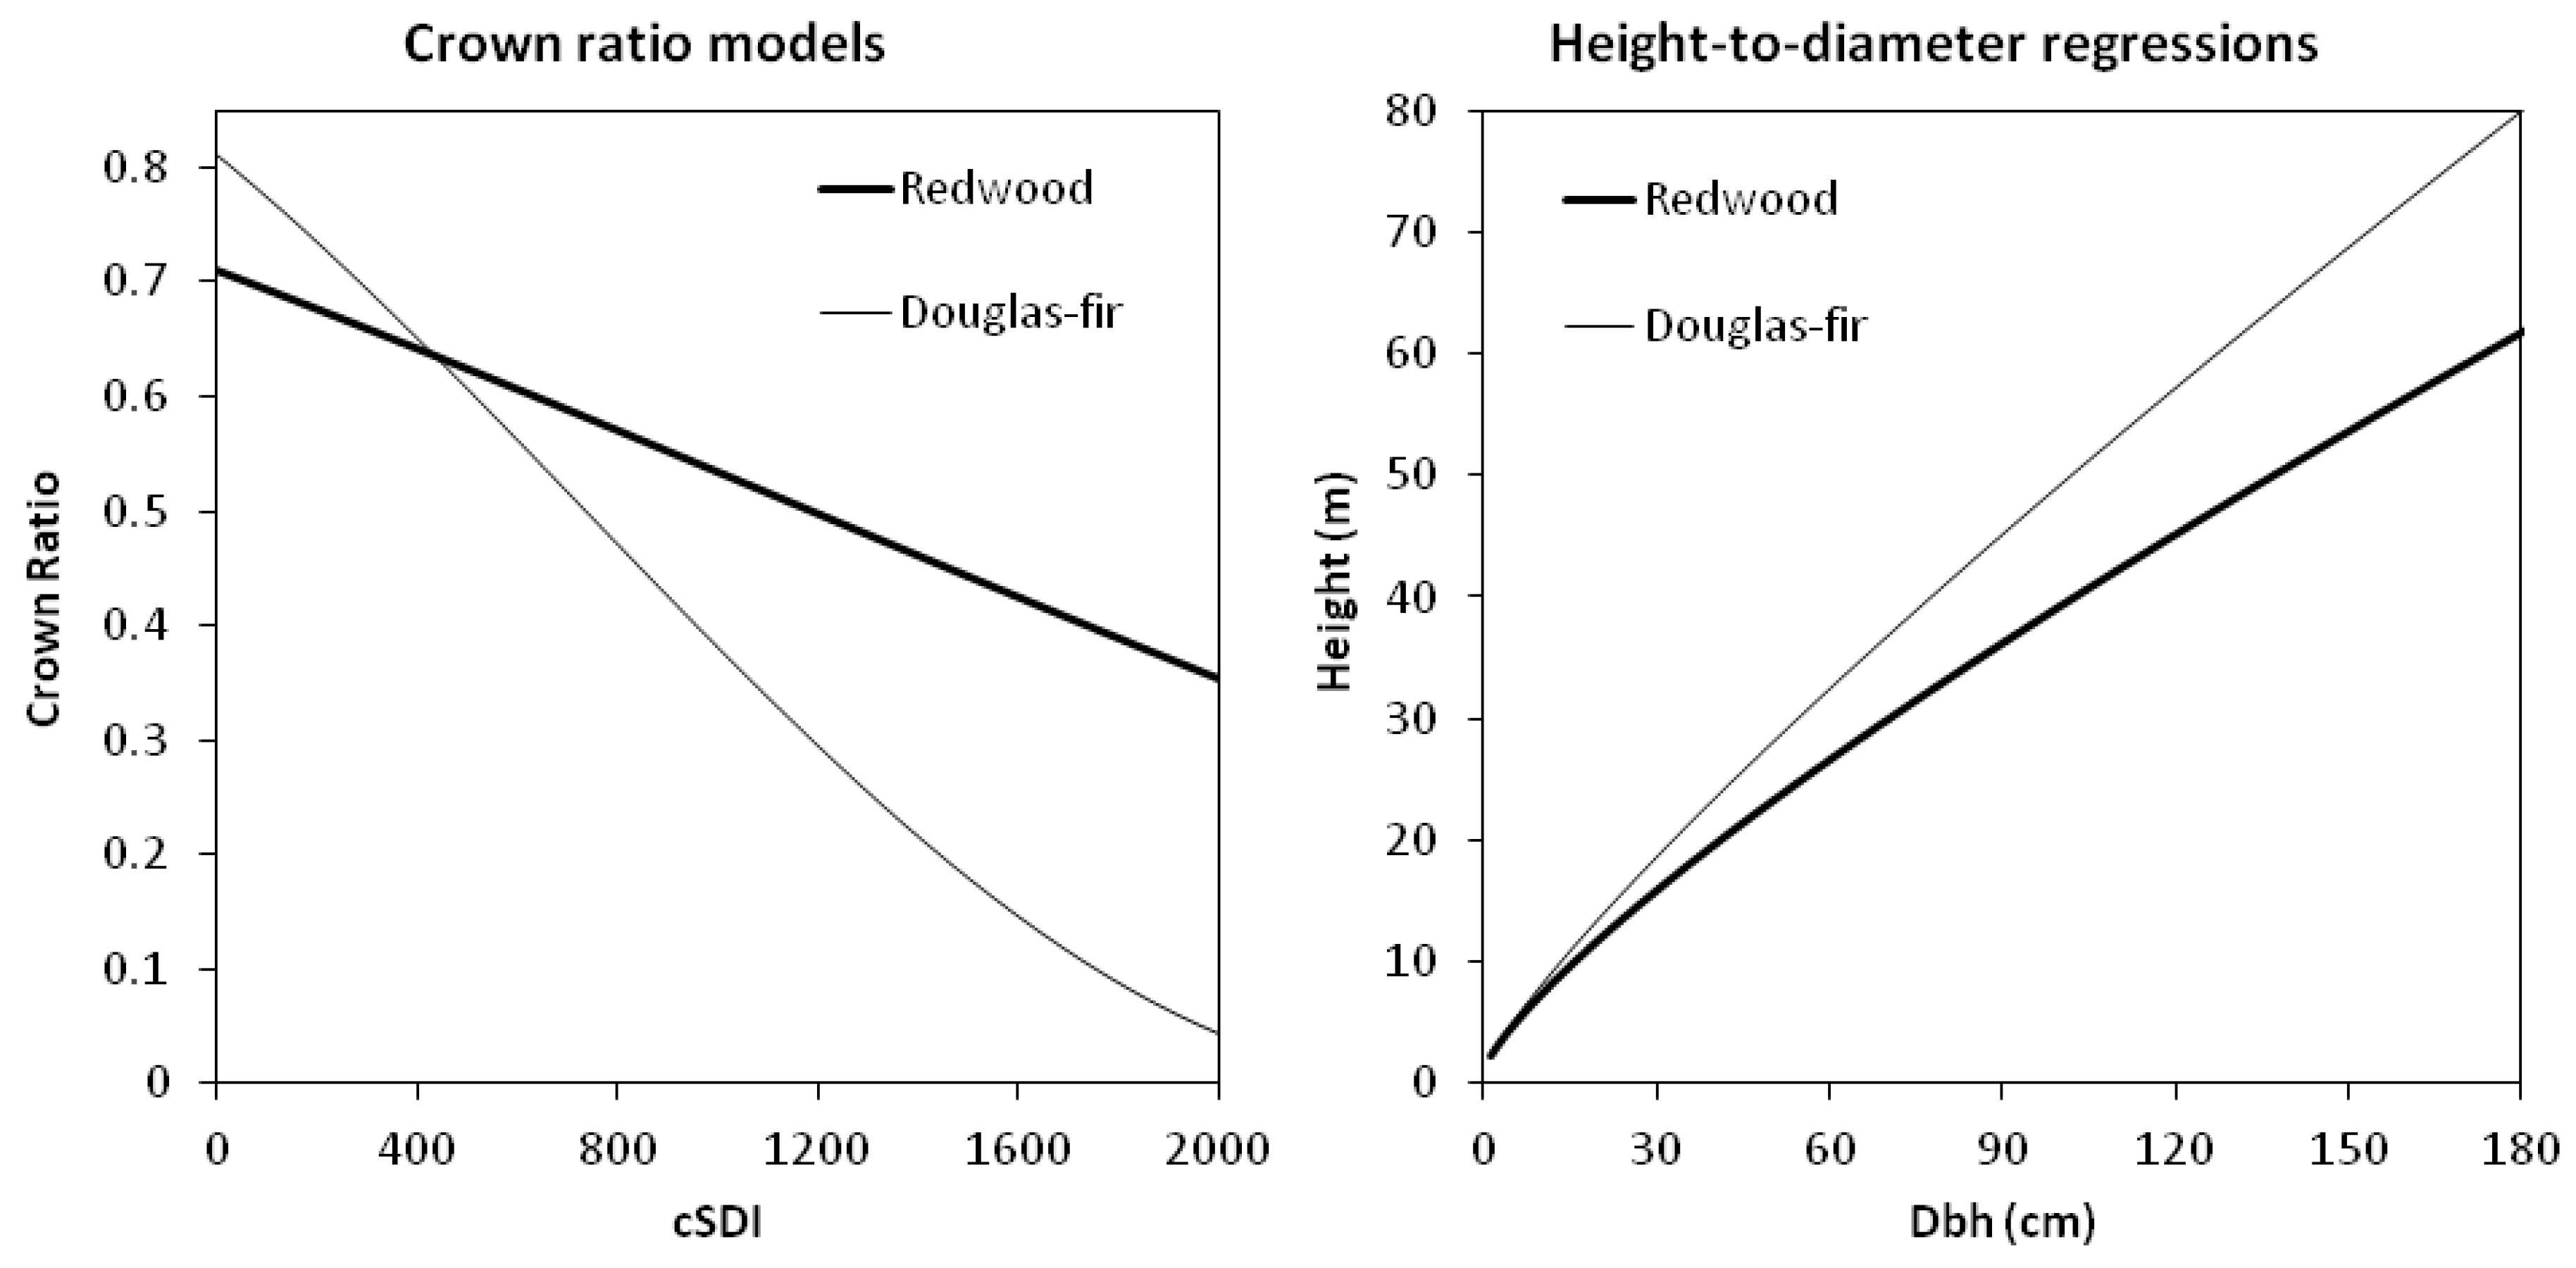
3.2. Tree Growth in Harvested Stands
| Variable | Mean | Std. Dev. | Min. | Max. |
|---|---|---|---|---|
| Redwood (n = 174) | ||||
| Dbh (cm) | 47.17 | 44.23 | 10.20 | 283.10 |
| Height (m) | 21.96 | 14.29 | 4.39 | 72.36 |
| Crown ratio | 0.59 | 0.14 | 0.15 | 0.88 |
| DBHI (cm year−1) | 0.78 | 0.40 | 0.08 | 1.64 |
| BAI (cm2 year−1) | 53.66 | 40.63 | 1.47 | 159.91 |
| Redwood ratio (stems per plot) | 0.76 | 0.20 | 0.25 | 1.00 |
| SDI | 940.52 | 463.09 | 175.19 | 2161.29 |
| cSDI | 683.57 | 415.32 | 119.35 | 2123.17 |
| Douglas-fir (n = 156) | ||||
| Dbh (cm) | 47.26 | 34.21 | 11.20 | 177.00 |
| Height (m) | 26.18 | 14.62 | 7.07 | 75.11 |
| Crown ratio | 0.58 | 0.20 | 0.12 | 0.92 |
| DBHI (cm year−1) | 0.77 | 0.40 | 0.08 | 1.66 |
| BAI (cm2 year−1) | 54.10 | 36.30 | 1.45 | 134.70 |
| Redwood ratio (stems per plot) | 0.44 | 0.27 | 0.00 | 0.89 |
| SDI | 800.00 | 368.72 | 196.36 | 1951.47 |
| cSDI | 568.67 | 323.21 | 123.11 | 1951.47 |
| Parameter | Estimate | Std. Error | t value | Pr (>|t|) | |
|---|---|---|---|---|---|
| Redwood (n = 174) | a | 110.223 | 27.931 | 3.946 | 0.000 |
| b | −1.665 | 0.579 | −2.874 | 0.005 | |
| c | 0.012 | 0.003 | 4.039 | 0.000 | |
| e | 0.605 | 0.124 | 4.879 | 0.000 | |
| Douglas-fir (n = 156) | a | 1850.000 | 585.600 | 3.159 | 0.002 |
| b | −14.740 | 4.758 | −3.098 | 0.002 | |
| c | 0.033 | 0.097 | 3.349 | 0.001 | |
| e | 0.304 | 0.107 | 2.851 | 0.005 | |
| f | 0.650 | 0.106 | 6.123 | 0.000 |
3.3. Simulating Restoration Prescriptions
- (i)
- Overstory tree size and density: 32–36 redwood trees ha−1 averaging 170 cm dbh minimum, and 14–29 Douglas-fir trees ha−1 averaging 120 cm dbh minimum;
- (ii)
- Understory tree size and density: 51–74 redwood trees ha−1 with a mean of 56 cm dbh, and 3–16 Douglas-fir trees ha−1 with a mean dbh of 50 cm;
- (iii)
- Crown ratio: 54%–62% for redwood and 47%–56% for Douglas-fir overstory trees (Table 2); and;
- (iv)
- Snag densities: 2–7 large snags ha−1 (Table 3).
4. Conclusions
Acknowledgments
Conflict of Interest
References
- Stephenson, N.L. Reference conditions for giant sequoia forest restoration: Structure, process, and precision. Ecol. Appl. 1999, 9, 1253–1265. [Google Scholar] [CrossRef]
- Moore, M.M.; Covington, W.W.; Fulé, P.Z. Reference conditions and ecological restoration: A southwestern ponderosa pine perspective. Ecol. Appl. 1999, 9, 1266–1277. [Google Scholar] [CrossRef]
- White, P.S.; Walker, J.L. Approximating nature’s variation: Selecting and using reference information in restoration ecology. Restor. Ecol. 1997, 5, 338–349. [Google Scholar] [CrossRef]
- Dagley, C.M. Spatial pattern of coast redwood in three alluvial flat old-growth forests in northern California. For. Sci. 2008, 54, 294–302. [Google Scholar]
- Dagley, C.M.; Berrill, J.-P. Reference Conditions for Old-Growth Redwood Restoration on Alluvial Flats. In Proceedings of Coast Redwood Forests in a Changing California: A Symposium for Scientists and Managers; Pacific Southwest Research Station, Forest Service, US Department of Agriculture: Albany, CA, USA, 2012. [Google Scholar]
- Van Mantgem, P.J.; Stuart, J.D. Structure and Dynamics of an Upland Old-Growth Forest at Redwood National Park, California. In Proceedings of Coast Redwood Forests in a Changing California: A Symposium for Scientists and Managers; Pacific Southwest Research Station, Forest Service, US Department of Agriculture: Albany, CA, USA, 2012. [Google Scholar]
- Fritschle, J.A. Identification of old-growth forest reference ecosystems using historic land surveys, Redwood National Park, California. Restor. Ecol. 2012, 20, 679–687. [Google Scholar] [CrossRef]
- Lorimer, C.G.; Porter, D.J.; Madej, M.A.; Stuart, J.D.; Veirs, S.D.; Norman, S.P.; O’Hara, K.L.; Libby, W.J. Presettlement and modern disturbance regimes in coast redwood forests: Implications for the conservation of old-growth stands. For. Ecol. Manag. 2009, 258, 1038–1054. [Google Scholar] [CrossRef]
- Agee, J.K. The landscape ecology of western forest fire regimes. Northwest Sci. 1998, 72, 24–34. [Google Scholar]
- O’Hara, K.L.; Nesmith, J.C.; Leonard, L.; Porter, D.J. Restoration of old forest features in coast redwood forests using early-stage variable-density thinning. Restor. Ecol. 2010, 18, 125–135. [Google Scholar] [CrossRef]
- Helms, J.A. The Dictionary of Forestry; The Society of American Foresters: Bethesda, MD, USA, 1998; p. 210. [Google Scholar]
- Reineke, L.H. Perfecting a stand-density index for even-aged forests. J. Agric. Res. 1933, 46, 627–638. [Google Scholar]
- Shaw, J.D. Application of stand density index to irregularly structured stands. West. J. Appl. For. 2000, 15, 40–42. [Google Scholar]
- Berrill, J.-P.; Dagley, C.M. Geographic patterns and stand variables influencing growth and vigor of Populus tremuloides in the Sierra Nevada (USA). ISRN For. 2012, 2012. [Google Scholar] [CrossRef]
- US Department of the Interior Bureau of Land Management and California Department of Fish and Wildlife, Headwaters Forest Reserve Proposed Resource Management Plan and Final EIS/EIR; Environmental Impact Statement: Arcata, CA, USA, 2003.
- Long, J.N.; Daniel, T.W. Assessment of growing stock in uneven-aged stands. West. J. Appl. For. 1990, 5, 93–96. [Google Scholar]
- Berrill, J.-P.; Jeffress, J.L.; Engle, J.M. Coast Redwood Live Crown and Sapwood Dynamics. In Proceedings of Coast Redwood Forests in a Changing California: A Symposium for Scientists and Managers; Pacific Southwest Research Station, Forest Service, US Department of Agriculture: Albany, CA, USA, 2012. [Google Scholar]
- Eng, H. Tree Height Estimation in Redwood/Douglas-fir Stands in Mendocino County. In Proceedings of Coast Redwood Forests in a Changing California: A Symposium for Scientists and Managers; Pacific Southwest Research Station, Forest Service, US Department of Agriculture: Albany, CA, USA, 2012. [Google Scholar]
- Hermann, R.K.; Lavender, D.P. Douglas-Fir. In Silvics of North America: 1 Conifers; Burns, R.M., Honkala, B.H., Eds.; US Department of Agriculture, Forest Service: Albany, CA, USA, 1990. [Google Scholar]
- Spies, T.A.; Franklin, J.F. The Structure of Natural Young, Mature, and Old-Growth Douglas-Fir Forests Oregon and Washington. In Wildlife and Vegetation of Unmanaged Douglas-Fir Forests; Pacific Southwest Research Station, Forest Service, US Department of Agriculture: Albany, CA, USA, 1991; pp. 91–109. [Google Scholar]
- Berrill, J.-P.; O’Hara, K.L. Patterns of leaf area and growing space efficiency in young even-aged and multiaged coast redwood stands. Can. J. For. Res. 2007, 37, 617–626. [Google Scholar] [CrossRef]
© 2013 by the authors; licensee MDPI, Basel, Switzerland. This article is an open access article distributed under the terms and conditions of the Creative Commons Attribution license (http://creativecommons.org/licenses/by/3.0/).
Share and Cite
Berrill, J.-P.; Beal, C.B.; LaFever, D.H.; Dagley, C.M. Modeling Young Stand Development towards the Old-Growth Reference Condition in Evergreen Mixed-Conifer Stands at Headwaters Forest Reserve, California. Forests 2013, 4, 455-470. https://doi.org/10.3390/f4020455
Berrill J-P, Beal CB, LaFever DH, Dagley CM. Modeling Young Stand Development towards the Old-Growth Reference Condition in Evergreen Mixed-Conifer Stands at Headwaters Forest Reserve, California. Forests. 2013; 4(2):455-470. https://doi.org/10.3390/f4020455
Chicago/Turabian StyleBerrill, John-Pascal, Christopher B. Beal, David H. LaFever, and Christa M. Dagley. 2013. "Modeling Young Stand Development towards the Old-Growth Reference Condition in Evergreen Mixed-Conifer Stands at Headwaters Forest Reserve, California" Forests 4, no. 2: 455-470. https://doi.org/10.3390/f4020455
APA StyleBerrill, J.-P., Beal, C. B., LaFever, D. H., & Dagley, C. M. (2013). Modeling Young Stand Development towards the Old-Growth Reference Condition in Evergreen Mixed-Conifer Stands at Headwaters Forest Reserve, California. Forests, 4(2), 455-470. https://doi.org/10.3390/f4020455