1. Introduction
This research sought to establish the water vapour diffusion resistivity of
Eucalyptus nitens, an Australian plantation-grown hardwood that is becoming increasingly important in construction. In Tasmania,
E. nitens is the dominant hardwood plantation species within a hardwood plantation estate of approximately 233,900 ha [
1,
2]. These plantations were originally established mainly for pulpwood production, and most of the resources have traditionally been managed for that purpose rather than for higher-value products [
3]. However, growing interest in higher-value uses of plantation hardwood has increased the need for reliable species-specific physical properties. This includes water vapour diffusion resistivity values for hygrothermal simulation, to support the use of plantation-grown
E. nitens in construction and engineered timber applications.
The global shift toward sustainable construction has established timber-based materials as central to low-carbon energy-efficient building design. Both solid wood and engineered-wood products (EWPs) including cross-laminated timber (CLT), glulam, and laminated veneer lumber (LVL) are increasingly valued for their renewable origin, low embodied carbon, and suitability for prefabrication and modern construction methods. At the same time, their hygroscopic character presents ongoing challenges, as exposure to high moisture levels can trigger mould growth, structural deterioration, and reduced indoor air quality [
4,
5,
6]. A clear understanding of moisture transport in these materials is, therefore, critical to ensuring building durability, safeguarding occupant health, and maintaining the long-term performance of timber-based envelopes. International comparisons, particularly with European softwoods such as spruce and pine, show that water vapour diffusion resistivity (µ-values) can vary significantly between species. This highlights the need to establish reliable, locally relevant datasets for Australian-grown species to improve the accuracy of hygrothermal simulations used in design.
Since the early 20th century, researchers have studied the role of building materials and indoor climate in moisture-related failures. By the mid-century, condensation risk within walls was estimated using static models [
7,
8]. In the 1970s to 1980s, energy-efficiency measures led to tighter building envelopes but also heightened concern about condensation and moisture accumulation [
9]. In the 1990s, advances in computational modelling supported the development of more sophisticated transient hygrothermal simulation tools for coupled heat and moisture transfer in building components [
10]. During the same period, mould growth modelling also developed further, including the work of Hukka and Viitanen on wooden materials [
10]. This was later followed by computer-based calculation methods regarding moisture and biodeterioration risk assessments of building materials and structures [
11,
12]. In 2009, the World Health Organisation (WHO) reinforced the significance of this issue by recommending that buildings be free from visible or hidden mould because of the associated health risks [
13].
To manage interstitial and component borne moisture, transient or dynamic hygrothermal simulation is now widely recognised as the base-line risk management method for assessing the flows of heat and moisture through building envelope components, during the building design process and for forensic analysis. The calculated heat and moisture conditions are then post-processed by companion software to predict potential mould growth risks. These computer modelling-based approaches depend on accurate material property data—including density, thermal conductivity, water absorption, and water vapour diffusion resistivity [
14,
15]. Water vapour diffusion resistivity is a fundamental material property that defines a material’s ability to permit or resist the transmission of water vapour and is determined through laboratory testing [
16,
17,
18]. However, while computer simulation tools are globally applied, their databases often lack robust input values for timber products. For data that does exist, they are typically derived from testing at a single relative humidity, failing to reflect the dynamic building envelope behaviour observed under real environmental conditions [
19,
20]. This limitation can lead to under- or over-estimation of moisture accumulation, condensation risk, and mould growth potential, particularly in climates with large seasonal relative humidity (RH) variations, such as those experienced in many parts of Australia. Furthermore, previous studies have shown that hygrothermally relevant physical properties of many Australian construction materials are either outdated or not available at all [
21]. More specifically, water vapour diffusion resistivity values are non-existent for most Australian construction materials [
22]. With the inclusion of hygrothermal assessment expectations in the 2019 National Construction Code [
23,
24], addressing this knowledge gap is critical to enabling accurate modelling and ensuring moisture-safe design in Australian buildings.
Timber’s sensitivity to moisture stems from its hygroscopic nature. As a natural material, wood continuously exchanges moisture with its surroundings, absorbing vapour in humid conditions and releasing it in drier conditions. These exchanges drive dimensional changes such as swelling and shrinkage, which can offer hygrothermal buffering but can also compromise structural stability [
25,
26]. Uneven or rapid drying, especially when the surface dries more quickly than the core, can result in internal stress, leading to microcracks or structural damage [
27,
28]. Understanding this behaviour is critical in both solid timber and EWPs like CLT, where long-term durability and mechanical integrity are essential.
Although international research has continued to assess moisture transport in solid wood and EW products, species-specific data for Australian-grown hardwoods and softwoods has not been undertaken [
29] This gap in knowledge reduces confidence in hygrothermal simulation inputs and limits the development of moisture-safe design strategies for that incorporate E-nitens solid wood framing. Determining these values is, therefore, an important step toward improving hygrothermal computer-based modelling reliability and supporting moisture-resilient timber design [
30].
This paper focuses on solid wood
Eucalyptus nitens and experimentally determines its water vapour diffusion resistivity under controlled conditions (23 °C, 50% RH) using the gravimetric cup method with both wet-cup and dry-cup tests. The results provide the first water vapour diffusion resistivity dataset for this species by applying the gravimetric wet- and dry-cup testing methodologies described within, ISO 12572 and ASTM E96/E96M [
15,
31]. The study provides an initial empirical dataset for this species under moderate-humidity conditions and adds to the international materials database to better inform the hygrothermal modelling of timber-based envelope systems.
2. Background
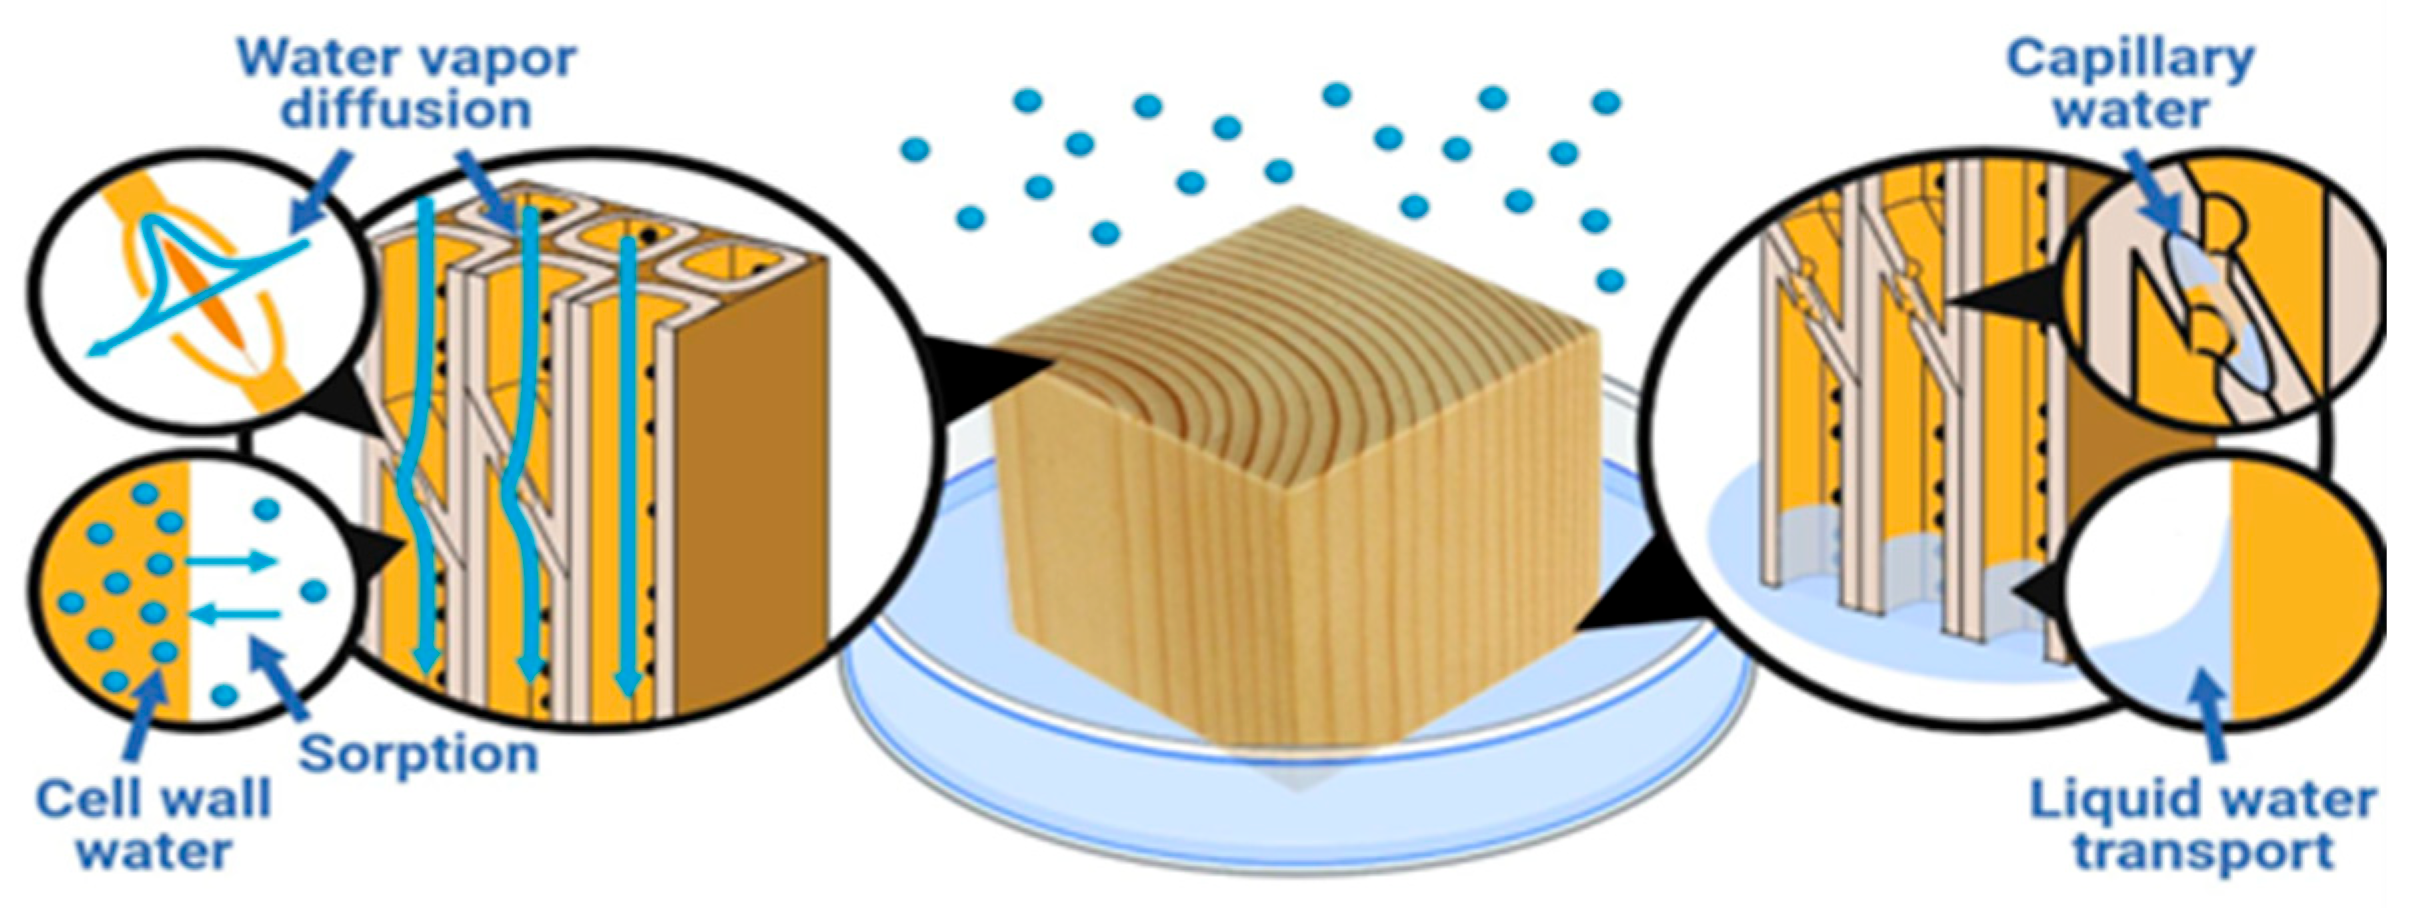
Solid wood is a hygroscopic and anisotropic material, and its moisture behaviour has direct implications for durability and hygrothermal performance in timber buildings. Water movement in wood occurs through coupled processes: vapour diffusion, sorption within the cell wall, and (when relevant) capillary transport in void spaces. The relative contribution of these mechanisms depends on the moisture state of the wood and its internal structure, which varies by species, density, and anatomical features [
32,
33,
34]. Water vapour diffusion resistivity (µ-value) is a key property used in hygrothermal analysis as it quantifies a material’s resistance to vapour flow. Because timber is anisotropic, its vapour diffusion depends on grain direction, species, and processing [
35,
36]. In solid wood, density, anatomical features, and the fibre saturation point (FSP) are important factors. Dense hardwoods such as
Eucalyptus nitens usually have lower permeability than lighter softwoods like pine [
32,
33]. This behaviour can be explained by moisture transport mechanisms at the microscopic level, where vapour diffusion, sorption, and capillary transport occur simultaneously (
Figure 1).
In practice, moisture in wood occurs as bound water, held within cell wall polymers, and free water, located in cell lumina and voids. Vapour diffusion and sorption are linked to bound water, whereas capillary suction governs free water movement [
25,
32]. The anisotropic structure of wood further influences these processes. Diffusion is highly directional and fastest along the grain, where values can be one to two orders of magnitude greater than in the radial or tangential directions [
25,
32]. This strong anisotropy explains the wide range of µ-values reported for the same species, depending on fibre orientation, density, and sample preparation [
37,
38].
Despite the importance of these properties, the species-specific µ-value data for Australian plantation-grown timbers have relied on international datasets. In practice, Australian users of computer-based hygrothermal simulation tools have often relied on international sources and databases, such as the ASHRAE Handbook of Fundamentals, which reports µ-values for softwood and hardwood species (e.g., spruce, pine, and fir) [
39]. While these values provide a useful starting point, they may not be directly applicable to denser Australian plantation hardwoods such as
Eucalyptus nitens, which could exhibit substantially different moisture transport behaviour. The lack of locally measured data, therefore, represents a significant knowledge gap, reducing the reliability of hygrothermal simulations and increasing the risk of moisture-related failures in Australian construction [
40,
41,
42]. To highlight the significant differences in species-specific water vapour diffusion resistivity properties,
Table 1 summarises representative international µ-values for common timber- and wood-based products.
Water vapour diffusion resistivity is also highly sensitive to environmental relative humidity (RH). µ-values are not fixed properties; rather, they change depending on moisture exposure conditions [
30,
35]. At low RH (30%), timber typically shows high resistance to vapour diffusion, whilst at higher RH levels (80%), moisture absorption causes cell wall swelling, which reduces resistivity and accelerates vapour flow through the material [
45]. This linear response causes timber to act as a vapour barrier under dry conditions but as a vapour conductor under humid conditions, which has major implications for reliable hygrothermal modelling. Various laboratory methods exist to measure water vapour diffusion resistivity, though their applicability to timber varies. These methodologies, including their limitations and relevance to timber applications, have been discussed in detail in a previous publication [
29].
The gravimetric cup method, described in ISO 12572 and ASTM E96/E96M, is the most widely applied technique for porous building materials [
17,
46,
47,
48]. In this method, a specimen is sealed between two environments with different RH levels, and the weight change is monitored over time. The wet-cup method uses distilled water or saturated salt solutions to maintain high RH (typically 93%–100%), while the dry-cup method uses desiccants to maintain low RH (0%–10%). Testing is typically performed at 23 ± 0.5 °C and RH 50% under steady conditions. Although widely used, the conventional gravimetric method is limited by its reliance on a single RH condition, which does not represent the range of humidity variations in real buildings. To address this limitation, the enhanced gravimetric method was developed. This refined approach enables testing under different relative humidity conditions. The resulting water vapour diffusion resistivity data are more representative of actual service conditions and are, therefore, more appropriate for use in hygrothermal simulations, particularly when evaluating the moisture performance of hygroscopic and anisotropic materials such as timber [
30].
In this study, as the first stage in a broader study, the basic gravimetric cup method was applied to measure the water vapour diffusion resistivity of solid wood Eucalyptus nitens at 23 °C and 50% RH using both wet-cup and dry-cup configurations. The results provide the first empirical dataset for this species at moderate humidity, offering reliable input values for hygrothermal simulations and informing the design of moisture-safe, durable, and energy-efficient timber buildings in Australia. Further research will apply enhanced gravimetric methods and measure water vapour diffusion resistivity under different RH conditions.
3. Methodology
The research methodology undertaken here applies and builds on the methods and processes established in previous research that included round-robin water vapour diffusion resistivity experiments completed between Germany and Australia. That research assessed the relative humidity-dependent water vapour diffusion properties of pliable building membranes [
30,
49].
3.1. Test Room Environment
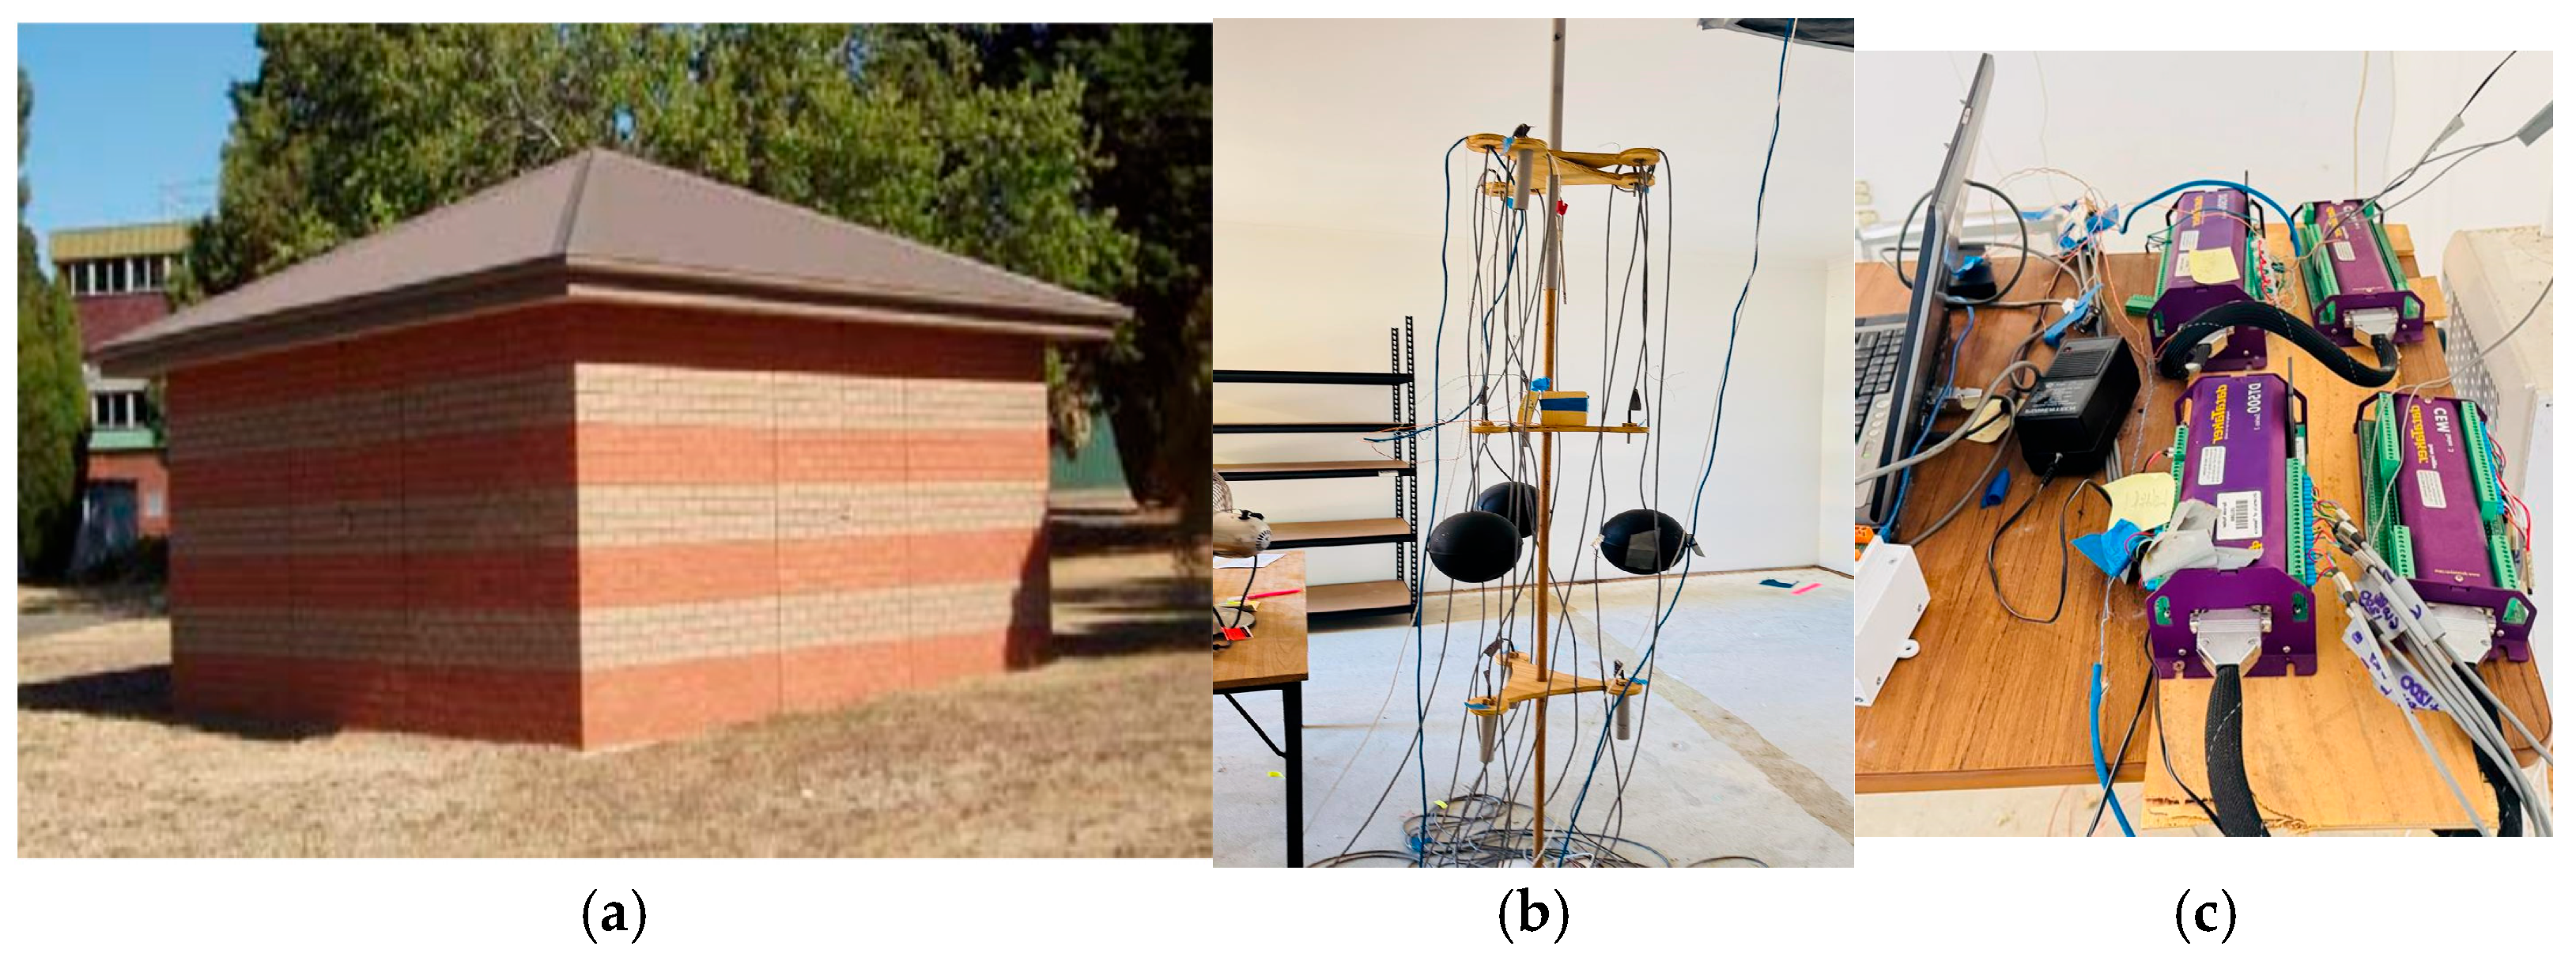
All experimental procedures were conducted in a hygrothermally controlled test room located within a concrete slab-on-ground test building at the University of Tasmania’s Newnham campus (
Figure 2a). This facility was selected because it has previously been used in hygrothermal research and is known to maintain stable indoor conditions [
21,
22].
Environmental conditions were controlled at 23 ± 1.5 °C and a relative humidity of 50% ± 3%. Equipment included a Daikin split-system air-conditioner (Daikin Industries Ltd., Osaka, Japan), and a Breville Smart Dry™ dehumidifier (Breville Group Ltd., Sydney, Australia; manufactured in China). These were connected to a DataTaker DT500 data-logger (Thermo Fisher Scientific Australia Pty Ltd., Scoresby, Australia) with programmable relays for automatic climate control. Temperature sensors were installed at three heights (600, 1200, and 1800 mm), and three RH sensors were installed at a height of 1200 mm on a centrally placed vertical support pole to ensure consistent environmental conditions, as shown in
Figure 2b. An electric fan was used to ensure consistent circulation of air and moisture within the test room.
The experiment commenced in the second week of August 2025 and concluded in the first week of October 2025, with conditions maintained continuously throughout this period to ensure stable, representative environmental exposure for the specimens.
Table 2 summarises the sensors and environmental control equipment used in the experiment.
3.2. Monitoring and Controlling Environmental Conditions
The DataTaker DT500 data-logger was used to monitor, control and acquire data about the environmental conditions in the test room (
Figure 2c). The system was programmed to continuously monitor conditions in the room, and to record air temperature and relative humidity (RH) every 10 min, providing a continuous record of the indoor climate during the eight-week test period. The continuous monitoring allowed for the automated operation of the Daikin air-conditioner, DEVANT mechanical humidifier and Breville Smart Dry™ dehumidifier through data-logger-controlled relays linked to power outlets.
The control logic compared the measured values with the target set points of 23 °C and 50% RH and automatically switched each device on or off to keep the room within an acceptable temperature and relative humidity range. For humidity, the humidifier was activated when RH fell to about 47%, and the dehumidifier was switched on when RH rose above about 53%. In a similar way, the air-conditioner provided heating or cooling whenever the measured air temperature moved outside the specified band around 23 °C.
Alarm functions were included in the data-logger programming so that any persistent deviation from the set points triggered an automatic response until the conditions returned to the required range. This arrangement, combining regular data logging with relay-based control, provided stable and continuous hygrothermal conditions in the test room, which is essential for obtaining reliable gravimetric cup measurements.
3.3. Calibration of the Environmental Instruments
Before the experiments commenced, all environmental monitoring instruments were calibrated to minimise measurement uncertainty. The PT100 Class A RTD temperature sensors were calibrated using a Thermoline L+M temperature calibration bath (Thermocline Scientific Equipment Pty Ltd., Wetherill Park, NSW, Australia) at reference temperatures spanning the expected test range (20–23 °C), and at standard test temperatures (0 °C and 100 °C), with readings compared against the device’s certified reference thermometer. To check for offset and temperature-dependent drift, an additional two-point verification was performed at approximately 0 °C and 100 °C, confirming stable sensor behaviour across a wider temperature span. All PT100 probes complied with the Class A tolerance of ±0.15 °C within the operating range relevant to this study.
The Vaisala HMW40U two-wire relative humidity sensors were verified against a certified reference probe under controlled conditions. The calibration results confirmed that the sensors remained within the manufacturer’s stated accuracy of ±3% RH over the range relevant to this study. In addition, all channels on the DataTaker DT500 data-logger were checked for correct wiring, grounding and signal stability.
Following in-room sensor calibration, a short trial run was conducted with full heating, cooling and humidity control operating. This test confirmed that the sensors produced stable readings and that the relay logic correctly activated the air-conditioner, humidifier and dehumidifier in response to deviations from the set points. These procedures reduced the risk of systematic error and provided confidence that the recorded environmental data accurately represented the actual test conditions inside the room.
3.4. Preparing Samples
More than twenty circular specimens of solid
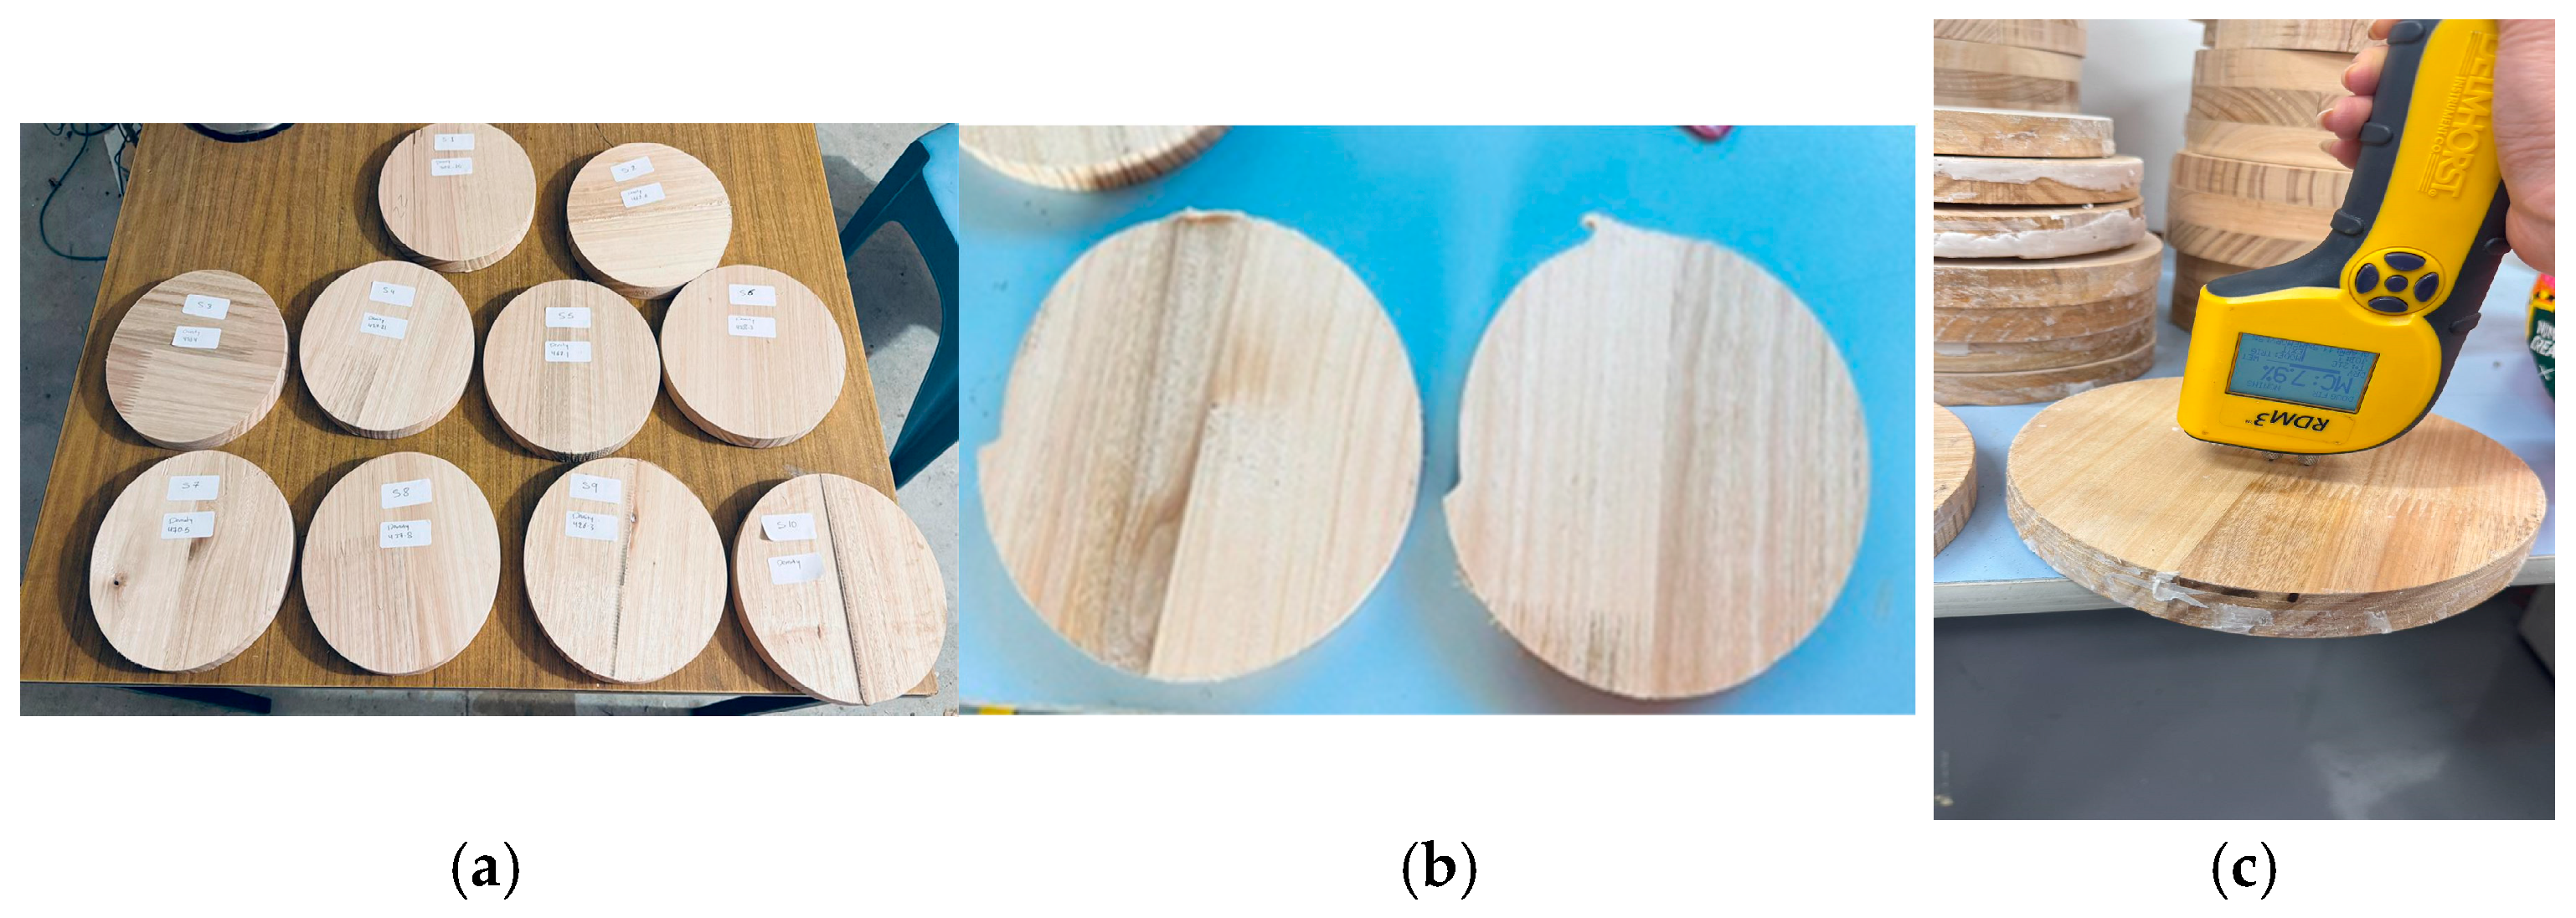
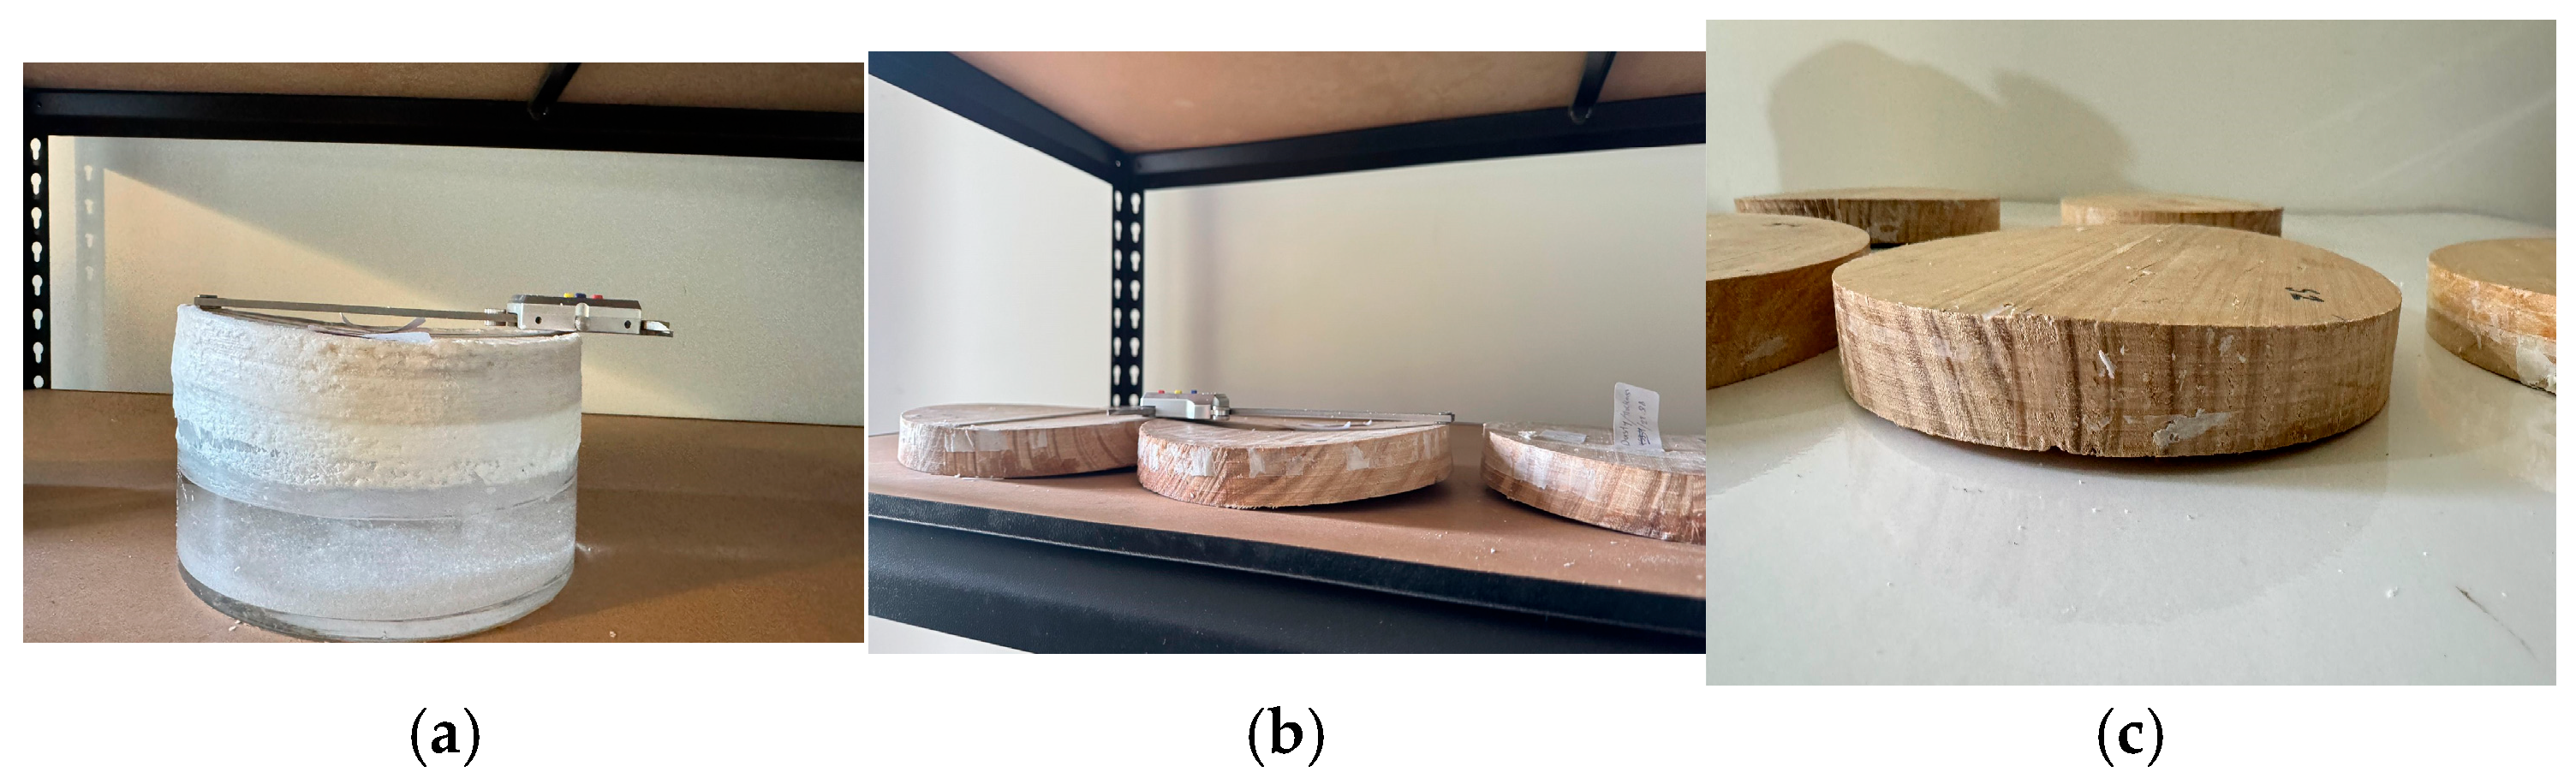
Eucalyptus nitens with a diameter of 200 mm, a thickness of approximately 25 mm, and varying densities were prepared using a CNC router (SCM Australia Pty Ltd., Eastern Creek, Australia) (
Figure 3a). The specimens were cut from solid boards (90 mm × 23 mm × 6000 mm) supplied by an industry partner. The material was plantation-grown
Eucalyptus nitens aged 26–28 years, obtained from thinned and pruned plantations, and comprised a mixture of quarter-sawn and transitional boards produced using standard sawmill practices. In the cup test configuration, vapour transport occurred through the specimen thickness and was, therefore, measured perpendicular to the longitudinal grain direction.
The detailed cutting and machining procedure is described in [
29]; only a brief overview is provided here. During the initial preparation stage, several challenges were encountered, including splitting, edge chipping, and surface tear-out. These issues arose before any experimental conditioning occurred and were associated with the anatomical characteristics of
Eucalyptus nitens, particularly its relatively high density, large vessel elements, and locally irregular grain orientation. As a result, some specimens were not used, and some required additional sanding and reworking. Several practical strategies were subsequently implemented to minimise splitting and chipping; these strategies are discussed further in
Section 4 (
Figure 3b).
Before testing, the specimens were visually checked to exclude pieces with obvious defects such as cracks, or other irregularities that could affect the water vapour diffusion measurements [
17]. Thickness and density were recorded for all specimens. The final ten discs were selected to ensure a range of densities, from lowest to highest, in test sample weight.
To ensure the samples had an appropriate commencing moisture content, they were pre-conditioned in a climate of 23 °C and 50% RH which corresponds to the conditions of the experiment and a typical indoor service environment, where timber would be expected to reach an equilibrium moisture content of approximately 11–13% [
27,
36], as show in
Figure 3c. After pre-conditioning, all specimens were inspected for surface quality, grain deviation and visible defects such as knots, checks or cracks to confirm that they remained suitable for vapour diffusion testing and were ready for the next parameter (23 °C, 50% RH).
3.5. Wet-Cup and Dry-Cup Setup
In this research, ten circular specimens of
Eucalyptus nitens solid wood were prepared for testing—five for the wet-cup method and five for the dry-cup method. Due to the natural variability of solid wood, the ten test specimens were selected from a larger group to represent a range of densities. The selected specimens ranged in mass from 426.1 g to 494.38 g, with corresponding to densities from approximately 589 to 676 kg/m
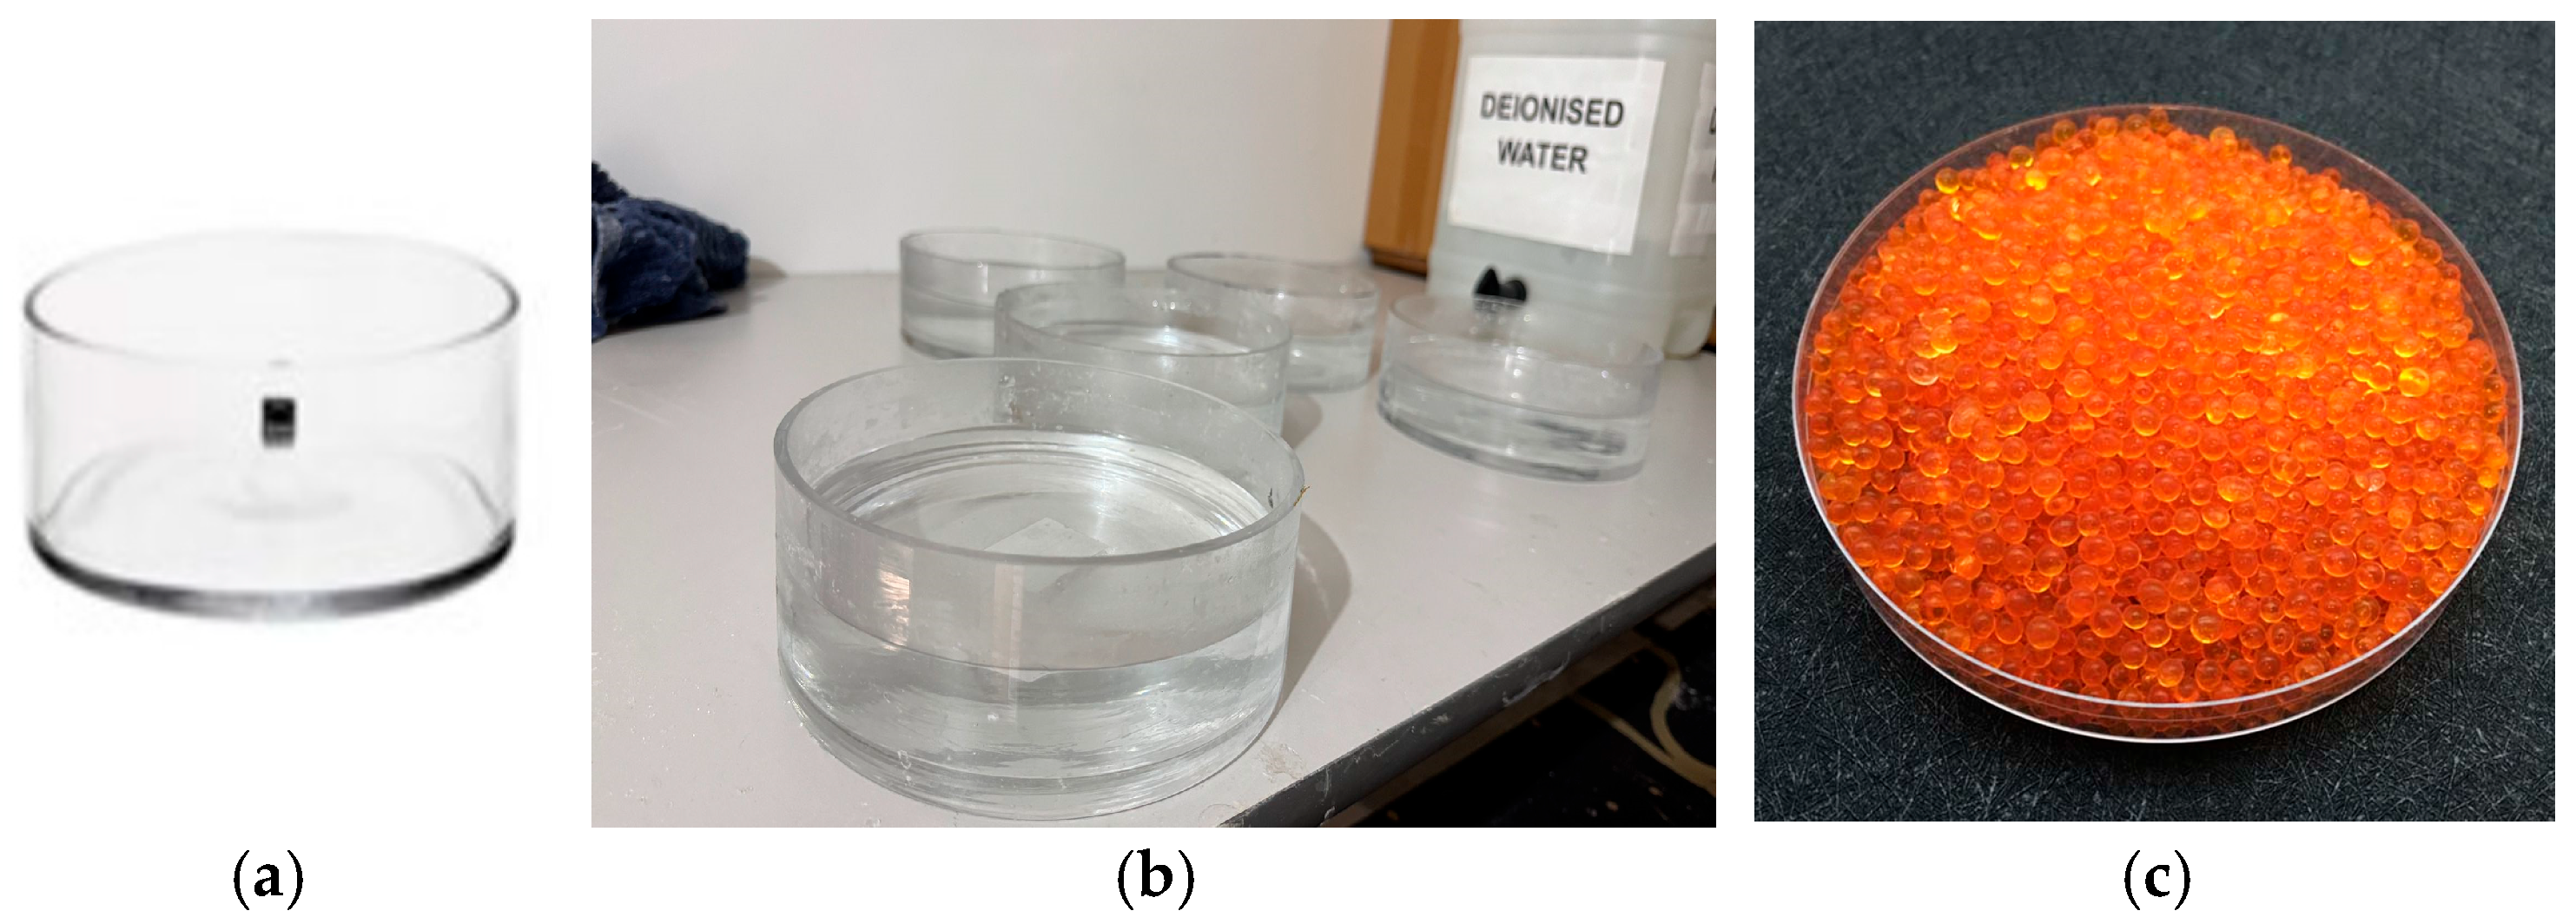
3. The tests were conducted using cylindrical dishes with a diameter of 200 mm and a depth of 60 mm, as shown in
Figure 4a. A specimen diameter of 200 mm was selected to match the diameter of the cylindrical test dishes used in this study and to provide a representative exposed test area for vapour diffusion measurements. This specimen size was also selected to maintain consistency with a comparable international dataset used by collaborating researchers from the Fraunhofer Institute of Building Physics, allowing for a more direct comparison of results. In the wet-cup method, a saturated solution of ammonium dihydrogen phosphate was placed inside each dish to establish an internal relative humidity of approximately 93% (
Figure 4b). Conversely, the dry-cup method employed silica gel beads to maintain a relative humidity of approximately 3% within the dish (
Figure 4c). A vertical air gap of 20 mm was consistently maintained between the surface of the chemical solution and the underside of the timber specimen to ensure uniform vapour diffusion conditions.
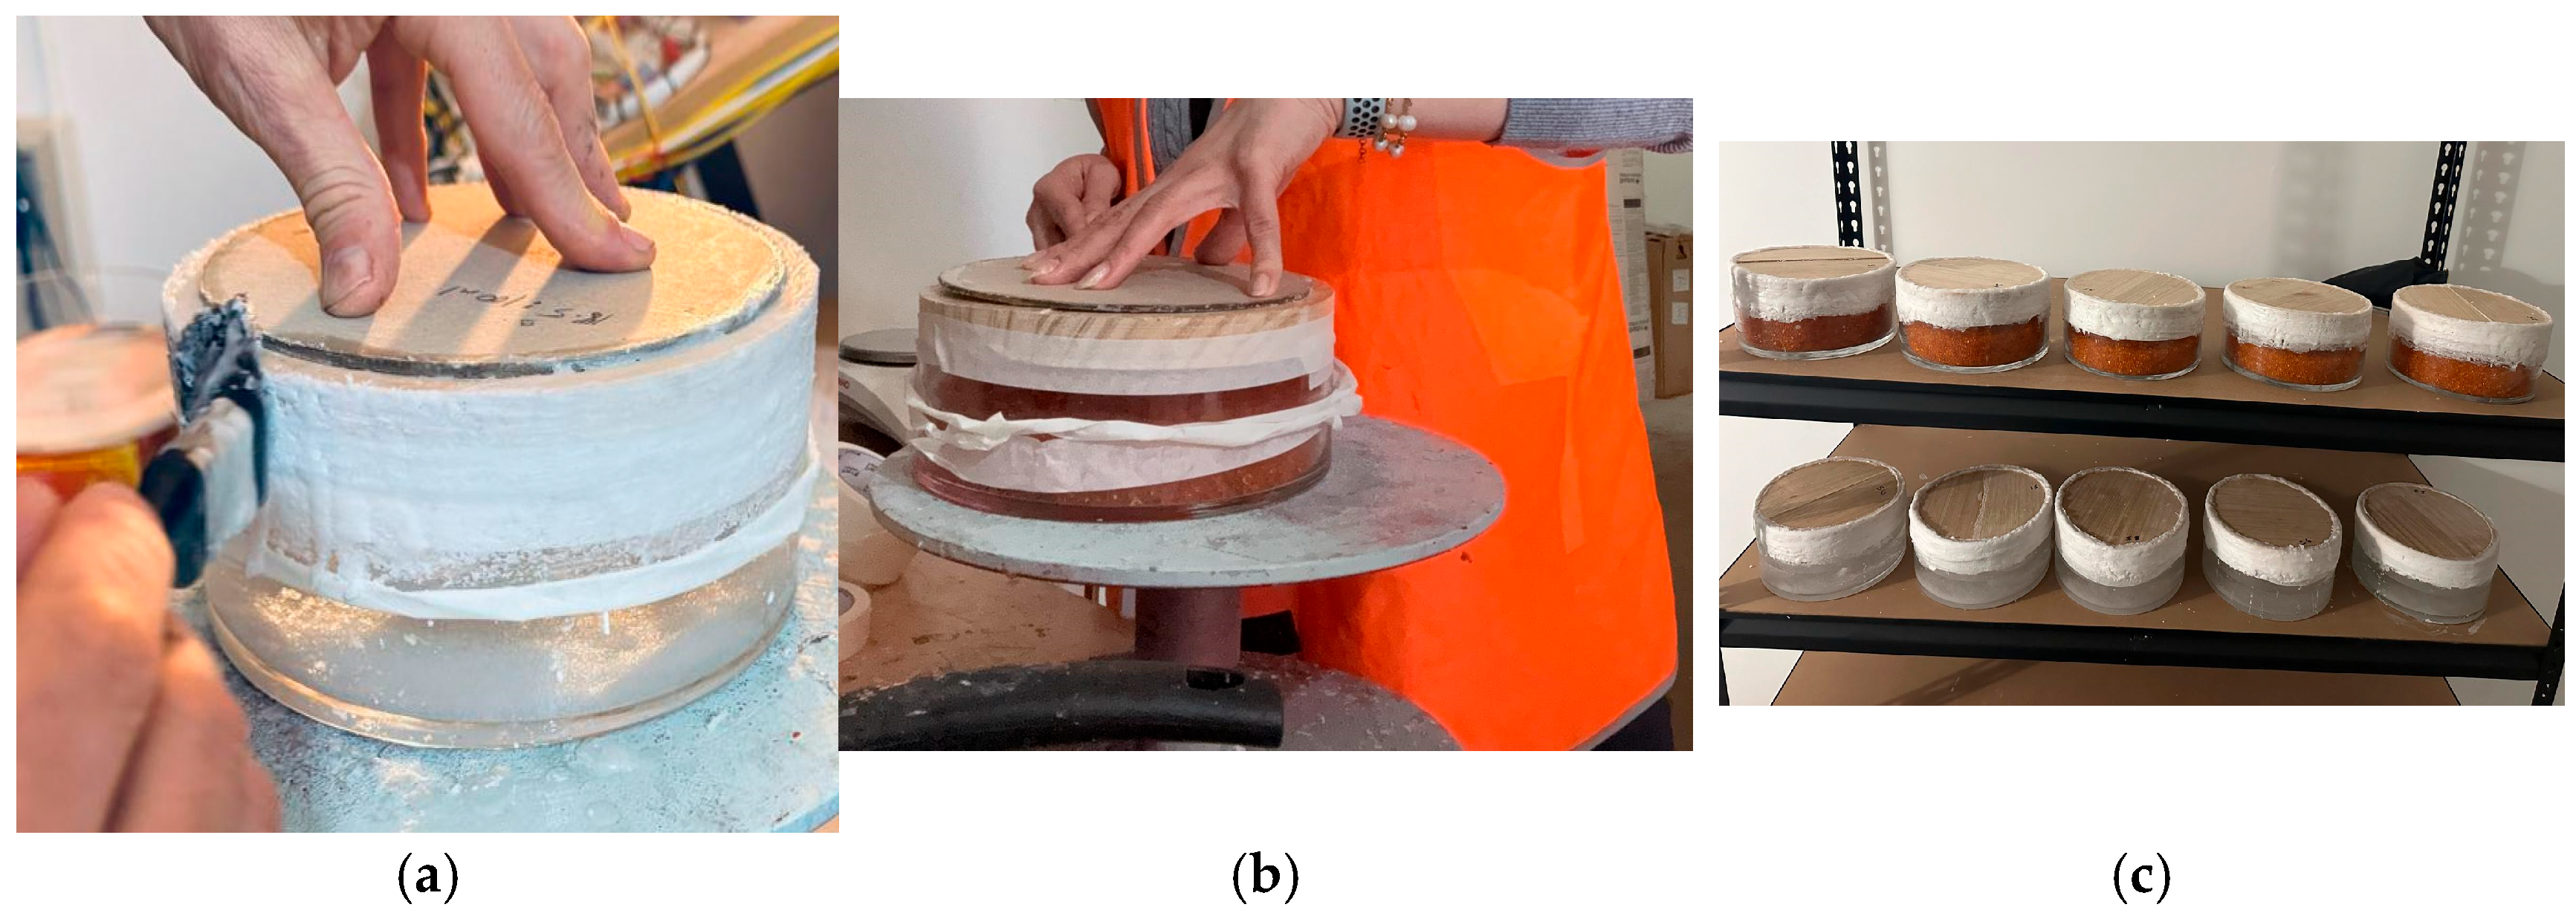
Each specimen was secured to the top edge of the dish using a flexible sealant. The interface between the specimen and the dish was reinforced with paper tape and sealed with paraffin wax to eliminate the potential for air leakage and moisture bypass, as illustrated in
Figure 5a,b. This process applied internationally accepted methods and processes that ensure airtightness of the test dish construction [
31,
50]. During testing, the specimen–dish interfaces were visually monitored for any changes in the exterior wax seal which could indicate air-seal failure. Where a change in the outer wax seal was identified, the interface was removed and resealed before testing continued. Immediately after sealing, the initial mass of each test assembly was recorded using an analytical balance with ±0.01 g accuracy. During the first day, mass measurements were taken every two hours to capture the early transient response; thereafter, all assemblies were weighed once every 24 h. This daily weighing regime was used both to track moisture uptake or loss and to determine when steady vapour flow had been reached. In accordance with the stabilisation criterion adopted from EN ISO 12572:2016 [
50], steady state was considered to occur when three consecutive daily mass measurements for a given specimen showed less than 5% variation in their mass change rate. Vapour flux and diffusion parameters were calculated only from measurements taken after steady state had been confirmed.
All test dish assemblies were stored on shelves within the hygrothermally controlled test room described in
Section 3.1 (
Figure 5c), where ambient conditions were maintained at 23 °C (+/−1.5 °C) and 50% (+/−3%) RH. The procedure was repeated for four experimental trials to ensure the consistency and reproducibility of the results.
3.6. Preparing Chemical Materials for Cup Methods
The dry-cup and wet-cup method required the use of chemicals to create a low-humidity and high-humidity environment inside the dishes. Silica gel was placed in the dry cups to achieve an internal relative humidity (RH) of approximately 3%. For wet-cup testing, a high-humidity environment of about 93% RH at 23 °C was created using a saturated solution of ammonium dihydrogen phosphate (NH4H2PO4). This salt was selected because EN ISO 12572 specifically recommends ammonium dihydrogen phosphate for producing a stable RH of approximately 93% at 23 °C, making it an appropriate and standardised choice for hygrothermal testing.
Proper preparation of this solution is essential to maintain a stable RH. The solubility of NH
4H
2PO
4 in distilled water at 23 °C is approximately 380 g/L [
51]; however, to ensure full saturation and visible crystal formation—a practical indicator of saturation—a slightly higher concentration is recommended. Following laboratory protocols from the Fraunhofer Institute for Building Physics (IBP) [
52], a concentration of 500 g of NH
4H
2PO
4 per litre of distilled water was used. High-purity analytical-grade salt (≥99.0%), such as Ammonium dihydrogen phosphate was selected to avoid impurities that could affect the chemical equilibrium or RH stability.
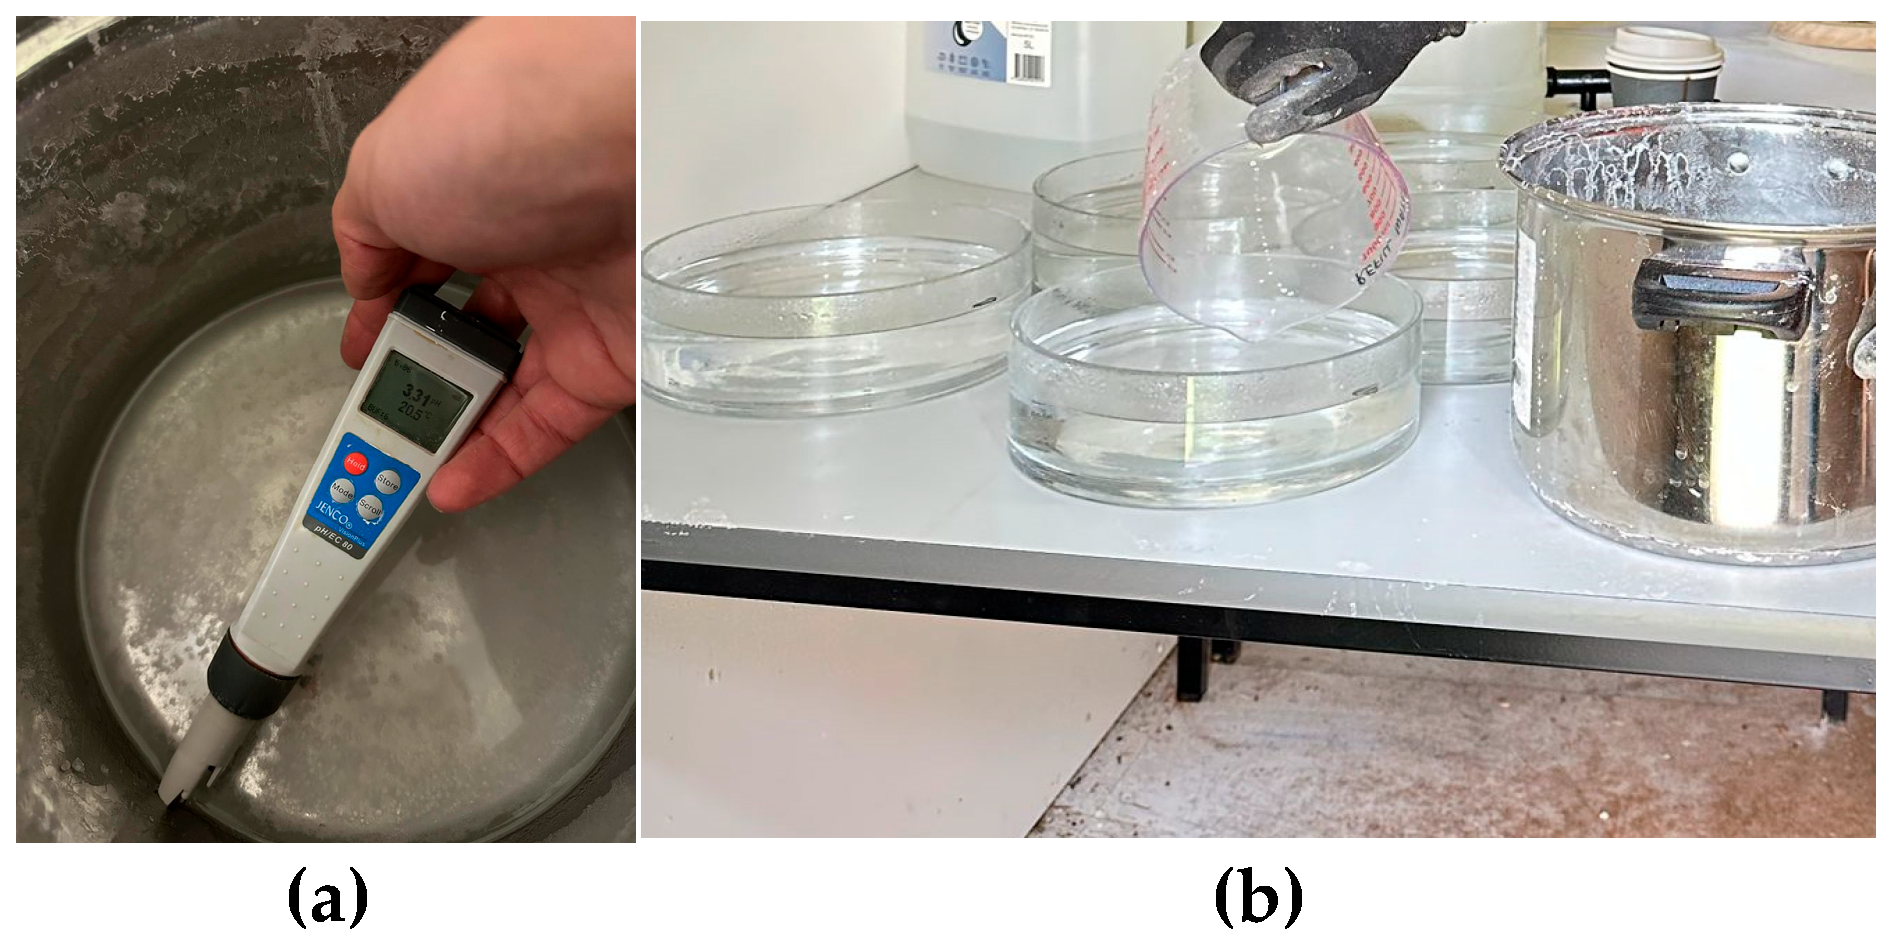
The solution was prepared by carefully weighing the required mass of salt and adding it to a measured volume of distilled water. The mixture was then heated on a hot plate while being stirred until the onset of boiling was observed (
Figure 6a). After heating, the solution was allowed to cool naturally to room temperature before being poured into the glass dishes to a depth of 40 mm (
Figure 6b). The presence of undissolved salt or visible crystal formation confirmed that full saturation had been achieved. Because the RH generated by saturated salt solutions is temperature-dependent, maintaining a stable temperature of 23 °C was essential to keep the RH close to 93%, as specified in ISO 12572 and documented by Greenspan (1977) [
53].Consistent environmental conditions were, therefore, maintained throughout the experiment to ensure reliable and repeatable results.
3.7. Mathematical Equation and Water Vapour Diffusion Resistivity Calculation
The water vapour diffusion resistivity of solid
Eucalyptus nitens specimens was calculated in accordance with EN ISO 12572 (2016) using gravimetric mass change data. The water vapour flux through the material was determined using
where g is the water vapour flux,
G is the slope of the linear regression line representing the rate of mass change over time (kg/s), and
A is the average exposed surface area of the specimen (m
2).
The water vapour permeance was then calculated as
where
Δpv is the difference in water vapour pressure between the two sides of the specmen, calculated from
where
θ is the temperature in °C and
φ is the relative humidity expressed as a fraction. In this study, the test room air was maintained at 23 °C and 50% RH, so
, while
for the wet-cup interior and
for the dry-cup interior.
The water vapour resistance
Z of the specimen was taken as the inverse of permeance:
The water vapour permeability δ, which is the intrinsic property of the material, was then calculated as
where
d is the average thickness of the specimen (m), measured using a micrometre screw gauge.
In this study, water vapour permeability (δ) was calculated from gravimetric experiments. However, this is further modified to the water vapour diffusion-resistivity factor (µ), for suitability in the hygrothermal simulation software.
The water vapour permeability of air
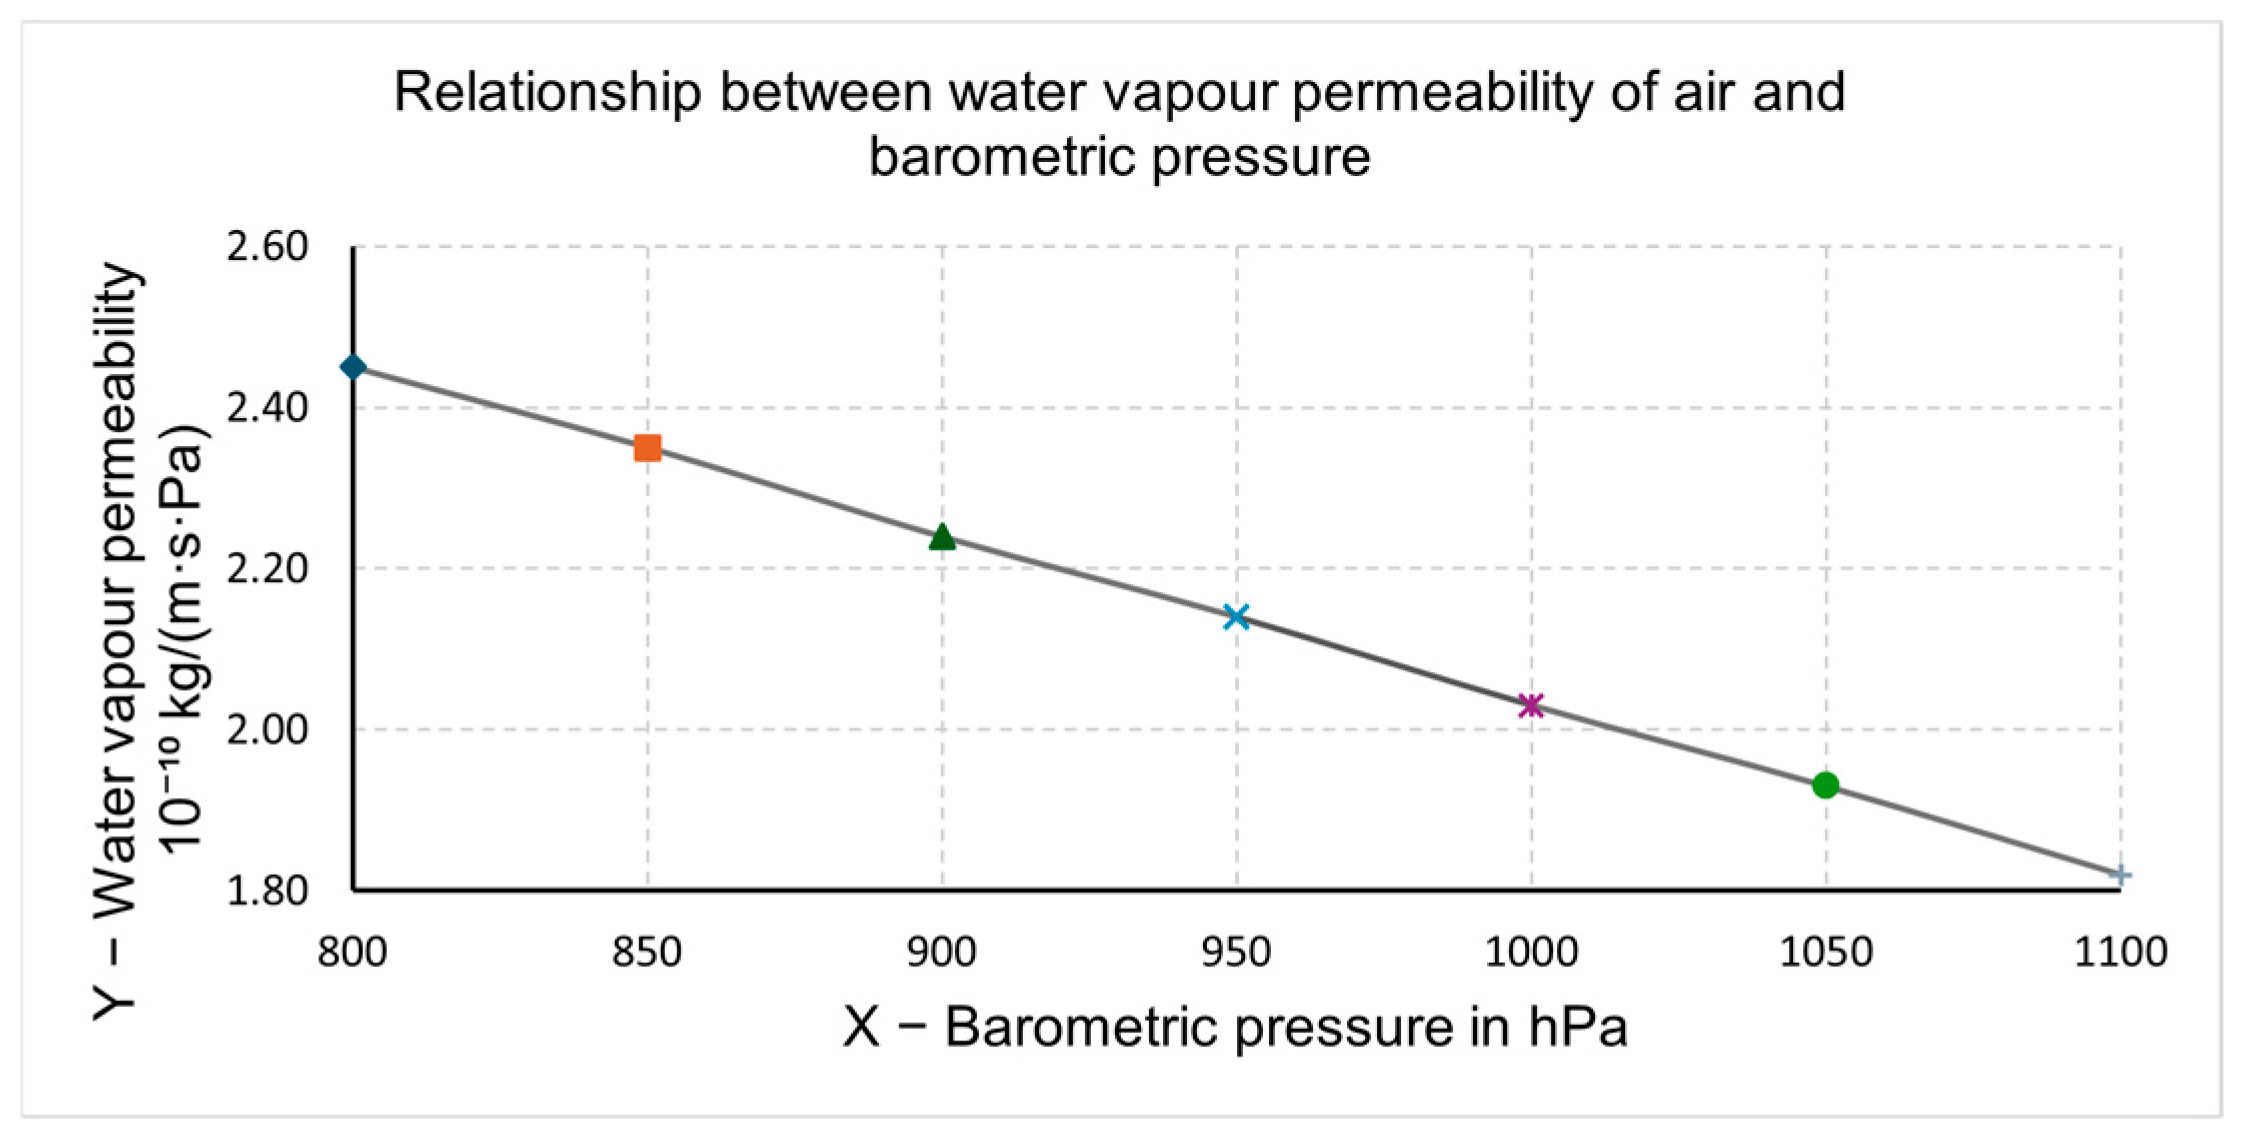
at 23 °C and 50% RH was determined from ISO 12572 (2016) by extrapolating the relationship between water vapour permeability and barometric pressure, as illustrated in
Figure 7. Once
was obtained, the water vapour diffusion resistivity
was calculated as
The water vapour permeability of air at 23 °C was determined by extrapolation from
Figure 7, as specified in ISO 12572 (2016) [
50]. The figure relates water vapour permeability of air (
δa) to the mean barometric pressure at the test site during the measurement period. Once
was obtained, the water vapour diffusion-equivalent air-layer thickness (
) was calculated as
which represents the thickness of a stationary layer of air at 23 °C that provides the same resistance to water vapour diffusion as the tested
Eucalyptus nitens specimen.
3.8. Statistical Analysis
For the 50% RH condition, wet-cup and dry-cup results were analysed separately, with five specimens tested in each cup configuration. Results are reported as mean ± standard deviation (SD). Minimum, maximum, and coefficient of variation (CV) were also calculated to describe the spread of the measured values. The standard deviation was calculated from the individual specimen values using the sample standard deviation equation:
where
is the individual specimen value,
is the sample mean, and
is the number of specimens in each cup configuration. The coefficient of variation was calculated as
These statistics were used to characterise the variability of the tested specimens under the selected condition and to improve the transparency of the reported results.
4. Results
4.1. Test Room Performance
This section presents the temperature and relative humidity performance of the hygrothermal control system in the test room during the water vapour diffusion experiments. The room was operated with a target indoor climate of 23 °C and 50% relative humidity (RH). Prior to the start of the experiment, t, the room required approximately 72 h to stabilise at the desired temperature and humidity conditions. Once equilibrium was achieved, the climatic conditions remained stable for the remainder of the eight-week monitoring period.
Temperature was measured using the four PT100 Class A sensors described in
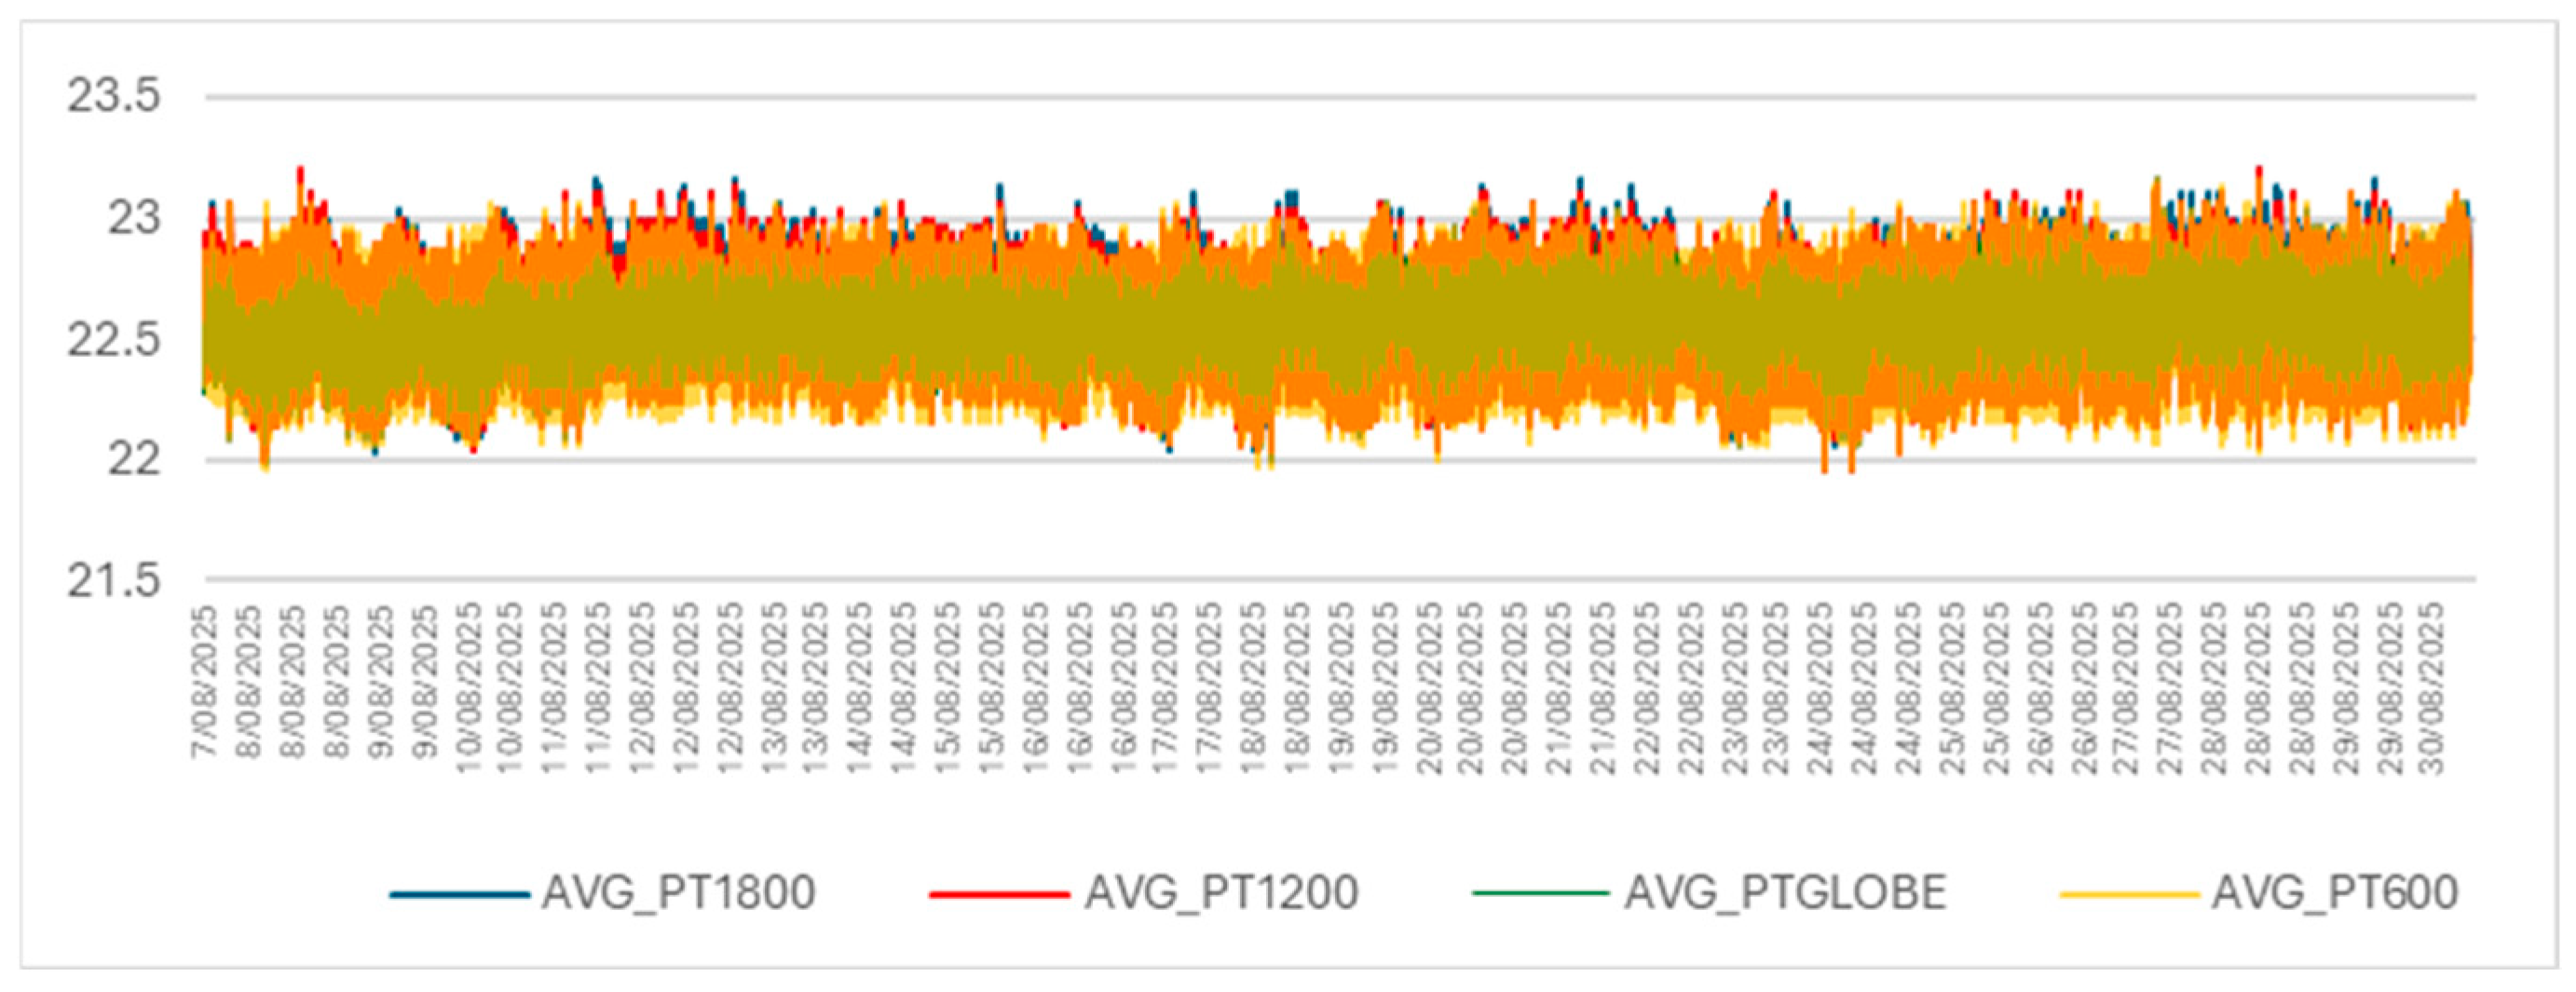
Section 3.1. Throughout the monitoring period, the PT100-1800, PT100-1200, PT100-600 and PT100-1200GLOBE sensors (the latter measuring means radiant temperature at 1200 mm) recorded mean temperatures of 22.58 °C, 22.53 °C, 22.47 °C and 22.51 °C, respectively, with an overall average of 22.52 °C. The small differences between sensors and the narrow fluctuation band (approximately 23 °C ± 1 °C) indicate that the test room maintained a uniform and well-controlled thermal environment.
Figure 8 shows the time-series temperature profile for the duration of the tests.
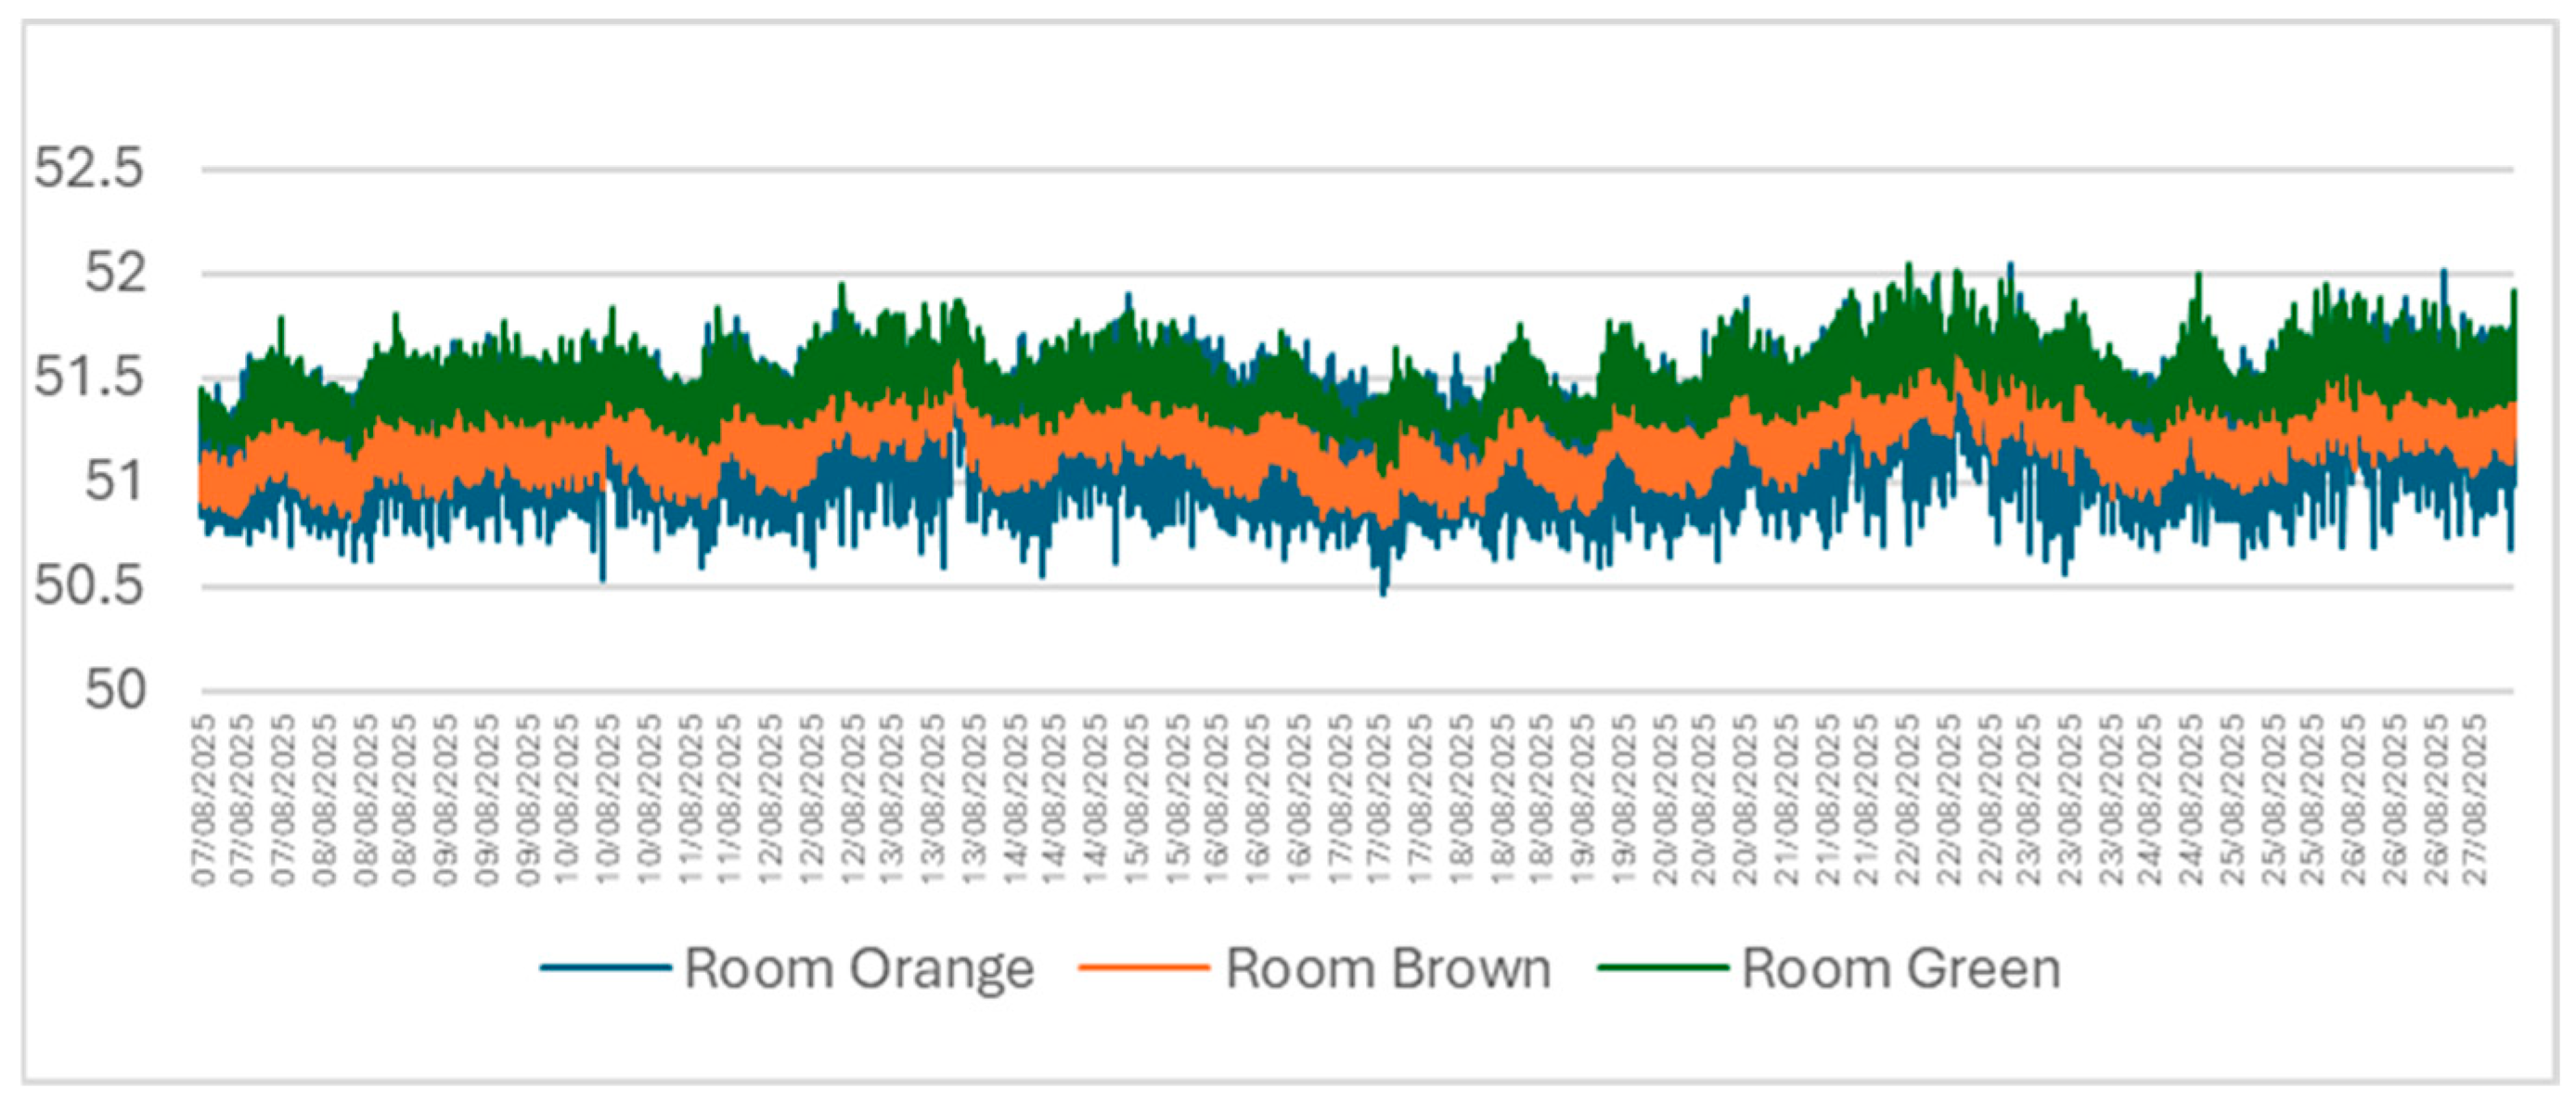
Relative humidity was monitored using the three Vaisala HMW40U sensors installed at 1200 mm, labelled roomorange, roombrown and roomgreen. These sensors recorded mean RH values of 49.8%, 50.8%, 50.5%, respectively, corresponding to an overall average of approximately 50.3%. Aside from minor short-term fluctuations, RH was maintained within the intended control band of 50% ± 3%. The combination of relay-controlled humidification/dehumidification and distributed sensor feedback ensured spatially uniform moisture conditions within the room.
Figure 9 shows the corresponding RH time-series for the same monitoring period. The first part of the graph shows relative humidity values whilst the room interior was being stabilised, prior to the samples being inserted.
Overall, the temperature and humidity records confirm that the test room provided a consistent and well-controlled hygrothermal environment, suitable for precise gravimetric water vapour diffusion testing of the Eucalyptus nitens specimens.
4.2. Challenges with Preparing Samples
During the initial preparation stage, several Eucalyptus nitens specimens exhibited splitting, edge chipping and surface tear-out during CNC routing of the circular discs. These defects were primarily associated with the high density, coarse grain and locally irregular fibre orientation of the wood species, which together increase cutting forces and promote fibre rupture at the tool–wood interface.
Previous studies on dense hardwood have shown that careful control of machining conditions can substantially improve surface quality and dimensional stability. Recommended measures include pre-conditioning the timber to a controlled moisture content (typically 11–14%) prior to machining, selecting straight end mills to limit tear-out in coarse-grained species, and using relatively high spindle speeds with moderate feed rates to reduce cutting forces and surface roughness [
50,
54,
55,
56,
57,
58].
In response to the challenges described in
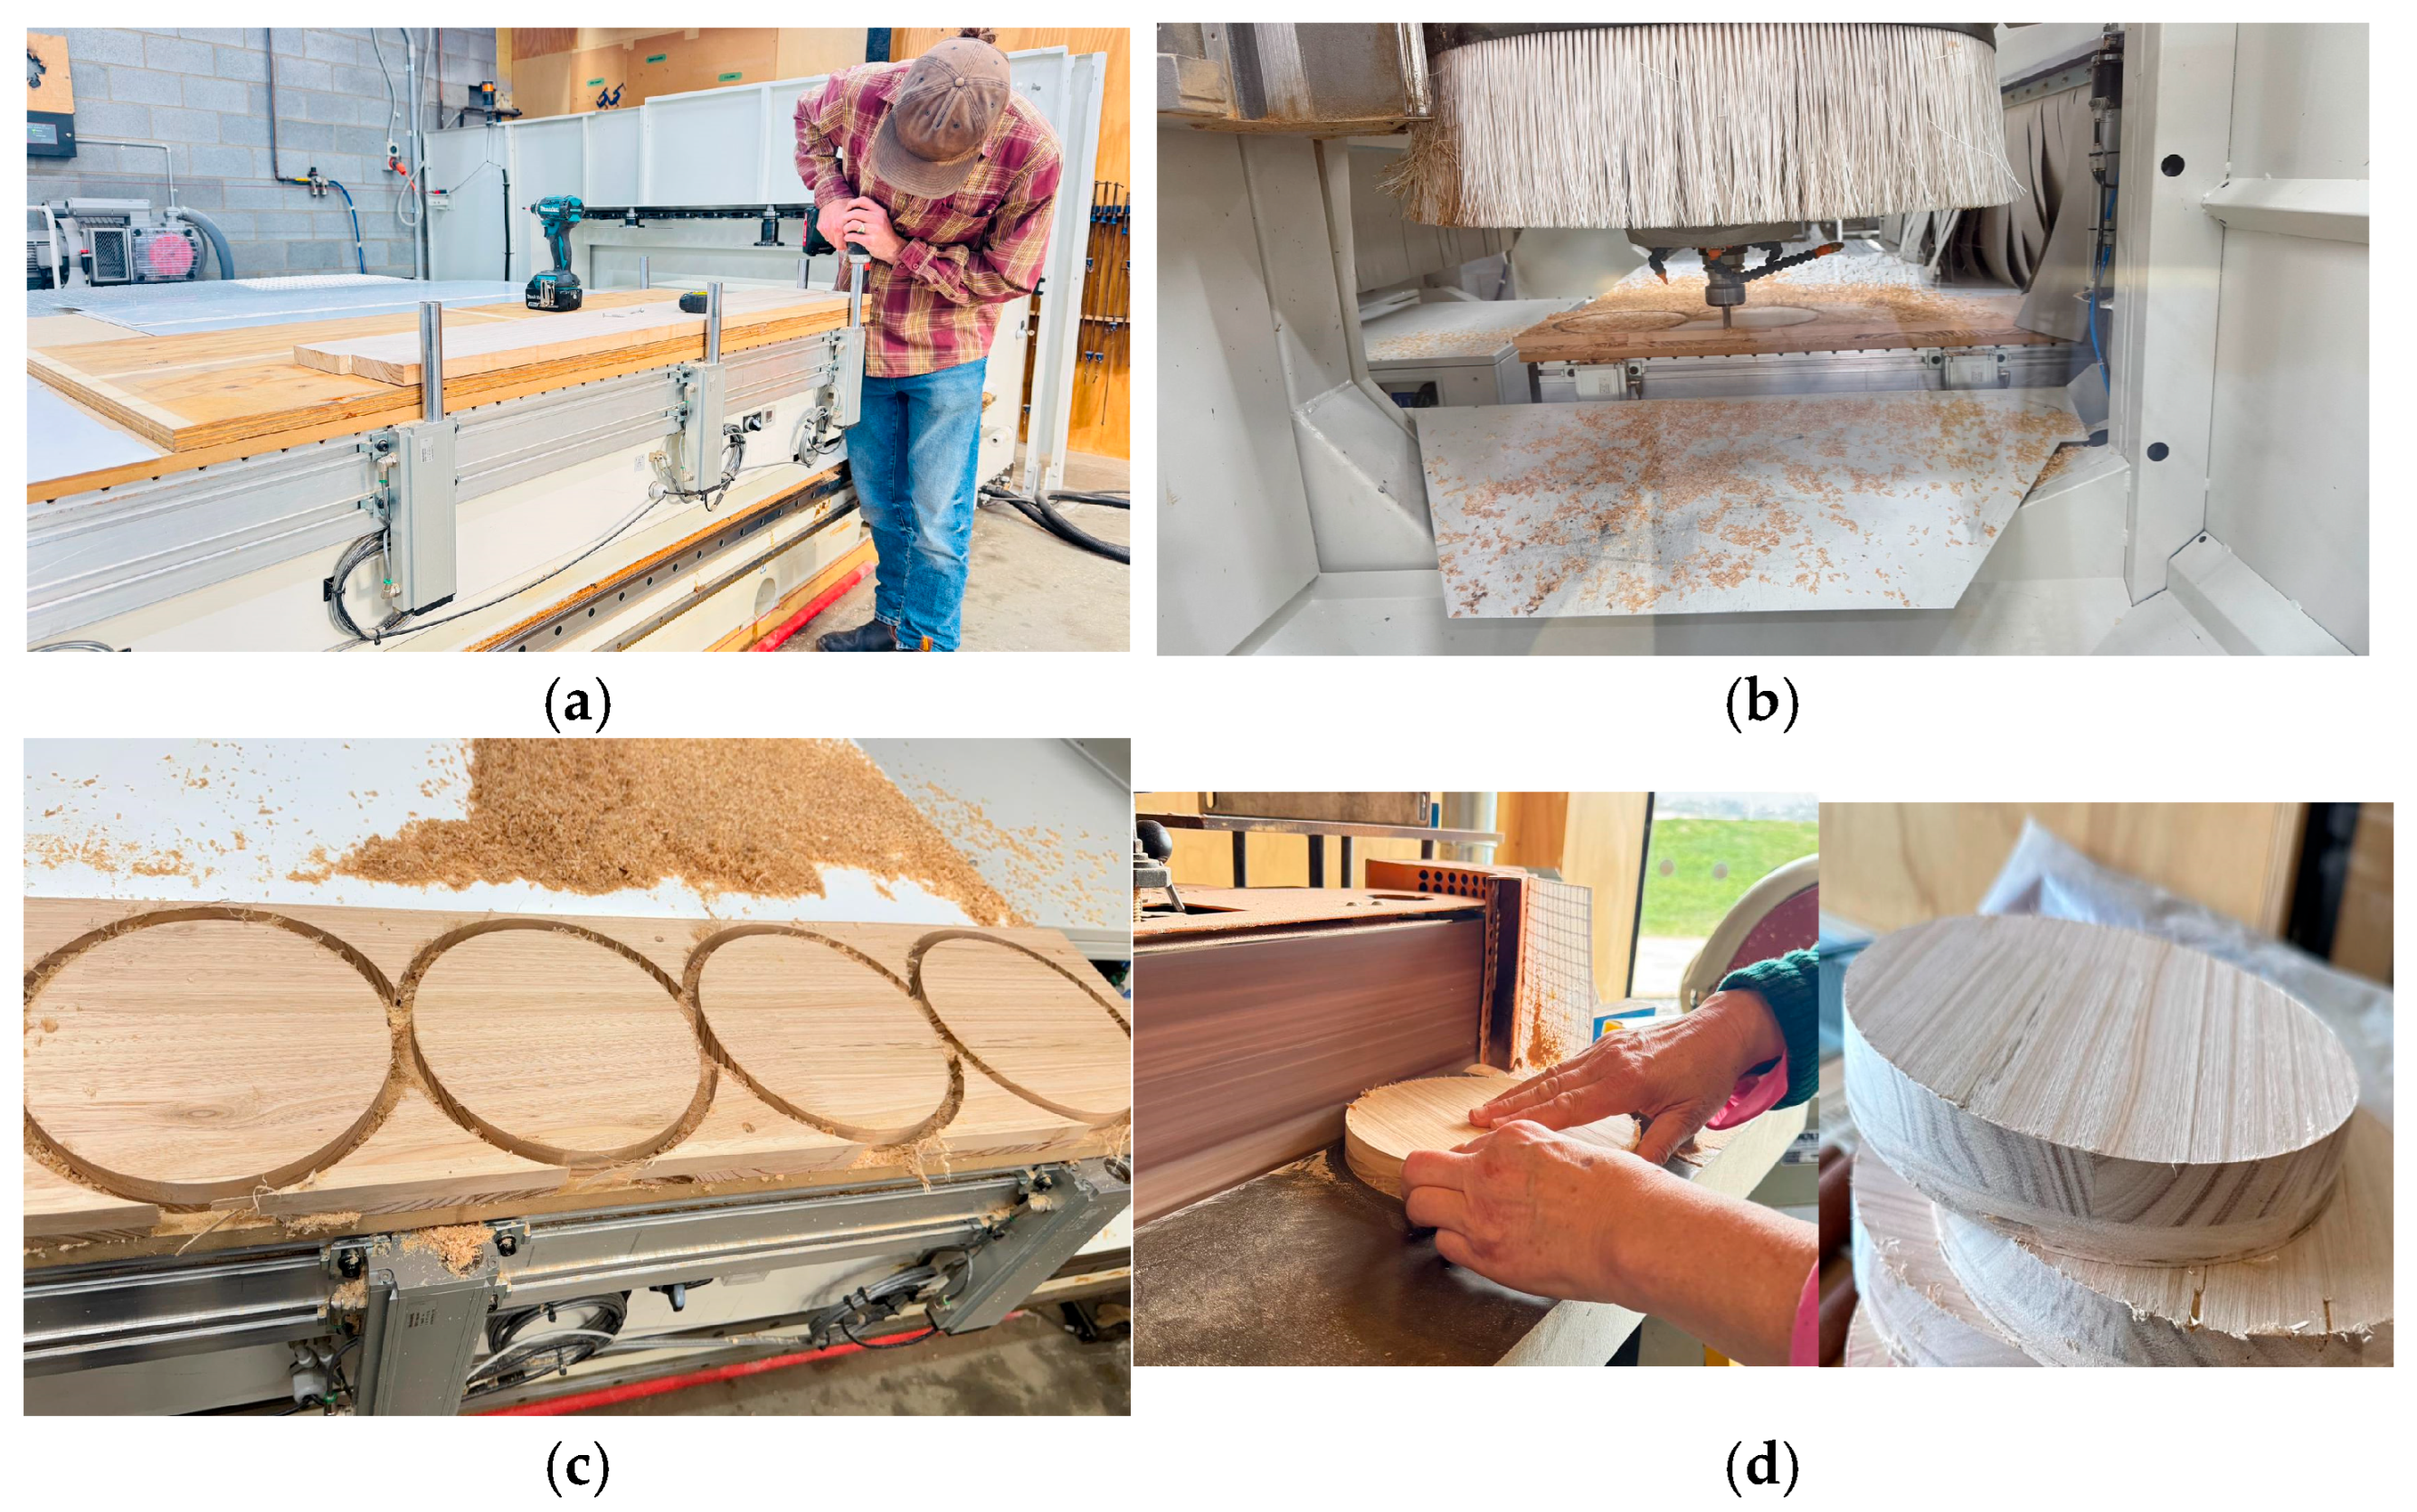
Section 3.4, several practical strategies were implemented in the present study to improve precision cutting and minimise defects. The timber stock was rigidly fixed to a CNC vacuum bed to prevent movement during cutting of circular samples from the solid boards and to ensure a uniform reference plane (
Figure 10a). A 12.6 mm up-cut rougher/finisher bit was operated at a spindle speed of 16,000 rpm and a feed rate of approximately 2.5–3.0 m/min (
Figure 10b). These values were found to balance cutting efficiency with reduced cutting forces per revolution. Circular specimens were produced in 7 mm depth increments, with a final pass extending 0.1 mm into the bed to ensure a clean, continuous edge (
Figure 10c). Micro-links were used to hold each disc in place during the final pass, reducing displacement and limiting tear-out, particularly at the completion of the circular tool path. Following cutting, all specimens were carefully sanded to remove residual machining marks, to break sharp arises and to obtain a smooth, continuous edge suitable for sealing with tape and wax (
Figure 10d). These combined strategies—board conditioning, appropriate tool selection, moisture conditioning, parameter optimisation, and secure fixing—were followed when cutting the remaining solid
Eucalyptus nitens samples, ensuring improved dimensional accuracy and consistency across all test materials.
4.3. Practical Challenges and Hygroscopic Response at 23 °C and 50% RH
The densities of the wet-cup and dry-cup specimens were recorded immediately before sealing and after completion of the 50% RH tests. For the wet-cup series, the mean density increased from 628 kg/m3 to 654 kg/m3, an average rise of approximately 4%. This increase reflects moisture uptake from the high-humidity cup interior (93% RH). In contrast, the mean density of the dry-cup specimens decreased from 623 kg/m3 to 616 kg/m3, corresponding to a reduction of about 1%, consistent with an overall loss of moisture toward the desiccant inside the cups (~3% RH). These density changes are in line with the expected hygroscopic behaviour of Eucalyptus nitens under opposing vapour pressure gradients.
In the wet-cup configuration, specimens were exposed to a humidity gradient of 93% RH inside the cup and 50% RH in the test room. Water vapour diffused outward from the test dish toward the drier room environment, producing a gradual and nearly linear decrease in mass across all samples. The mass change rate became stable after approximately 38 days and then remained within ±5% variation over a further ten days, satisfying the steady-state criterion described in
Section 3.5.
During this exposure period, several specimens developed concave surface cupping, particularly those with higher moisture uptake (S3 and S10), as illustrated in (
Figure 11a,b). The cupping resulted from differential moisture adsorption within the test sample due to contact with the humid air inside the cup. As noted in
Section 3.5, the daily measuring regime allowed for the regular inspection of the wax seal, to ensure no air or moisture bypass occurred. This behaviour is typical for dense hardwoods such as
Eucalyptus nitens when subjected to one-sided moisture gradients. Once steady-state was confirmed, the tests were terminated to prevent additional physical distortion that could influence the permeability estimates.
Based on the steady-state mass change data, the mean calculated parameters for the wet-cup specimens were
Permeance (W): from 2.56 to 3.31 with a mean of 2.90 × 10⁻¹⁰ kg·s−1·m−2·Pa−1
Permeability (δ): from 5.77 to 7.92, with a mean of 6.64 × 10⁻¹² kg·s−1·m−1·Pa−1
Water vapour diffusion resistivity(μ): from 24.25 to 33.29, with a mean of 29.50 ± 4.49
Equivalent air-layer thickness (Sd): from 0.58 to 0.75 with a mean of 0.67 m
The coefficient of variation for the wet-cup µ-values was 15.21%.
These values show that at 50% RH and 23 °C, the wet-cup configuration allows relatively high vapour transport through E. nitens compared with the much more resistive dry-cup condition described below.
In the dry-cup configuration, specimens were exposed to a humidity gradient from 50% RH in the test room to approximately 3% RH inside the test cup. Water vapour moved inward from the room environment toward the desiccant, resulting in a slower diffusion rate than in the wet-cup tests. The mass of all specimens decreased progressively and stabilised after about 40 days; in the final phase of the test, daily mass changes also met the same steady-state criterion, confirming that equilibrium vapour flow had been reached. All dry-cup specimens exhibited convex “reverse cupping”, bending in the opposite direction to the wet-cup samples. This behaviour arose because the upper surface facing the desiccant lost moisture and shrank, whereas the lower surface, exposed to the 50% RH chamber, absorbed moisture and expanded, as illustrated in
Figure 11. The regular observation was able to identify when the wax seal may become compromised. Data from that period was excluded, and the wax was resealed prior to recommencing measurements of changes in mass. The magnitude of this deformation remained small and did not affect the consistency of the mass change measurements.
For the dry-cup specimens at steady state, the mean diffusion parameters were
Permeance (W): from 3.11 to 4.76 with a mean of 3.99 × 10⁻¹¹ kg·s−1·m−2·Pa−1
Permeability (δ): from 7.02 to 10.8 with a mean of 9.07 × 10⁻¹³ kg·s−1·m−1·Pa−1
Water vapour diffusion resistivity(μ): from 143.62 to 233.52, with a mean of 195.59 ± 36.30
Equivalent air-layer thickness (): from 4.16 to 6.17 with a mean of 4.94 m.
The coefficient of variation for the dry-cup µ-values was 18.56%.
These results indicate that the measured vapour diffusion resistance of the tested Eucalyptus nitens specimens was higher under dry-cup conditions than under wet-cup conditions.
Given the natural variability of wood, the measured values should be interpreted as an initial empirical dataset rather than definitive population parameters for all solid wood
Eucalyptus nitens. To better describe the spread of the measurements,
Table 3 includes descriptive statistics including mean, standard deviation, minimum, maximum, and coefficient of variation for each cup condition. The complete set of individual specimen values for both configurations is presented in
Table 3.
5. Discussion
This research sought to establish experimentally determined water vapour diffusion resistivity properties for plantation-grown Eucalyptus nitens solid wood boards applying the methodology described in ISO 12572 and ASTM E96/E96M at 23 °C and 50% RH using both wet-cup and dry-cup configurations of the gravimetric cup method. A pronounced contrast was observed between outward (wet-cup) and inward (dry-cup) vapour flow. Under wet-cup conditions (93% → 50% RH), E. nitens exhibited relatively high permeance and a moderate water vapour diffusion resistivity factor (µ 29.5, ~0.67 m), indicating that the material can support outward drying when the more humid side faces the cup interior. Under dry-cup conditions (50% →~3% RH), mean permeance decreased by approximately six to seven times relative to the wet-cup configuration and µ increased to approximately (range ~144–234; ~4.47 m). This demonstrates that the same material behaves as a comparatively vapour-resistant layer when subjected to a strong drying gradient towards a very dry interior. These results confirm that vapour transport in E. nitens is strongly direction-dependent and that separate wet-cup and dry-cup µ-values are required to characterise its behaviour under different moisture-loading scenarios.
The marked difference between wet-cup and dry-cup µ-values indicates that the measured vapour diffusion behaviour of solid wood Eucalyptus nitens was strongly influenced by the imposed boundary conditions and associated specimen moisture state. Under wet-cup testing, the specimen was exposed to a high internal RH and lower external RH, whereas under dry-cup testing, it was exposed to a much stronger drying gradient toward the desiccant. These different moisture conditions affect the moisture state of the wood and, therefore, the measured vapour transport properties. The wet-cup and dry-cup difference should, therefore, be interpreted primarily as moisture-condition-dependent behaviour under the two test configurations, rather than as evidence of directional diffusion behaviour. This may highlight a limitation in these internationally accepted dry-cup test methods, as rarely do such low relative humidity conditions exist in a building envelope.
The hygroscopic response observed during testing is consistent with this direction-dependent behaviour. Wet-cup specimens absorbed moisture from the 93% RH cup interior, while dry-cup specimens lost moisture towards the desiccant. These one-sided moisture exchanges produced distinct deformation patterns: concave cupping in wet-cup specimens and convex “reverse cupping” in dry-cup specimens. Although the deformations remained moderate and did not prevent the attainment of steady-state mass change, they have practical implications for the gravimetric testing of dense hardwoods, as excessive curvature can compromise sealing at the cup rim and modify the effective diffusion path. In this study, simple mechanical restraint was applied during the pre-conditioning stage by placing concrete blocks on the specimens. (They were not used during vapour diffusion testing.) This approach reduced curvature and helped maintain an adequate rim seal, indicating that deformation in high-density species can be effectively managed using straightforward pre-conditioning measures.
The experimental process demonstrated that specimen preparation is a critical factor when determining diffusion properties for solid wood products. Producing 200 mm circular discs with uniform thickness and acceptable surface quality required adjustments to CNC machining parameters and careful selection and finishing of specimens to minimise splitting, edge damage and surface tear-out. These observations highlight the importance of carefully optimising cutting and preparation procedures for dense hardwoods such as E. nitens to minimise machining-induced defects and ensure reliable diffusion measurements.
When compared with international reference data (
Table 1), the measured µ-values place
E. nitens are in a clear but distinct position within the broader group of structural wood products. At 50% RH, the wet-cup value (µ ~30) is towards the more vapour-permeable end of the range, usually reported for solid timber and plywood, while the dry-cup value (µ ~217) sits in the upper range commonly reported for dense softwoods and OSB-type panels. International sources such as the ASHRAE Handbook of Fundamentals and DIN EN ISO 10456 provide generic µ-values for timber- and wood-based materials, but Australian plantation hardwoods, including
E. nitens, are not yet represented with species-specific data. The measurements reported in this study, therefore, help to fill this gap and provide more appropriate input values for hygrothermal simulations and moisture-risk assessments in Australian timber envelopes.
Due to research resource constraints, this research examined only five samples for the wet-cup configuration and five samples for the dry-cup configuration. As noted in the methodology, these specimens were selected based on their density from a larger group of samples cut from boards provided by an industry collaborator. To improve the transparency of the reported results, descriptive statistics including mean, standard deviation, minimum, maximum, and coefficient of variation are now presented in
Table 3. A dedicated airtightness verification test was not performed for the cup assemblies, and this remains an important limitation of the present study. This research identified a range of water vapour diffusion resistivity results, and these findings should be verified through a broader testing programme.
Overall, the findings show that the vapour diffusion behaviour of plantation-grown Eucalyptus nitens is highly sensitive to the moisture conditions imposed during testing. The strong contrast between wet-cup and dry-cup results highlights the importance of reporting both values when characterising timber materials for hygrothermal analysis. At the same time, the study demonstrates the need for careful specimen preparation, deformation control and sealing procedures when applying the gravimetric cup method to hardwoods. These outcomes provide a useful basis for further testing and support the development of more reliable, species-specific material data for Australian timber construction.
6. Conclusions
This study measured the water vapour diffusion-resistance factor (µ) of plantation-grown Eucalyptus nitens solid wood using the wet-cup and dry-cup gravimetric methods at 23 °C and 50% RH. The results showed a clear difference between the two test setups. The wet-cup specimens had higher vapour permeance and a lower diffusion-resistance factor, while the dry-cup specimens showed lower permeance and behaved as a more vapour-resistant material.
The results provide early species-specific data for Eucalyptus nitens, which is an Australian plantation-grown hardwood that is not commonly included in international hygrothermal material databases. This is important because using generic timber values may not fully represent the behaviour of this material. The values measured in this study can therefore help improve hygrothermal simulations and moisture-risk assessments for Australian timber building envelopes.
The experimental work also showed that the gravimetric cup method can be sensitive when applied to hardwood specimens. Preparing the circular samples, maintaining good surface quality, controlling deformation and achieving a reliable seal around the cup were all important during the testing process. The use of mechanical restraint during pre-conditioning helped reduce cupping before the vapour diffusion tests were carried out.
Future research will extend the gravimetric measurements to additional test room relative humidity levels (e.g., 35%, 65% and 75% RH) and to engineered E. nitens products, including cross-laminated timber with one and two glue layers. These extended datasets will enable RH-dependent material functions to be implemented for both solid wood and CLT, providing a stronger basis for moisture-safe, energy-efficient timber construction in the Australian context and supporting the further development of performance-based hygrothermal design. The data from this research also needs to be applied within hygrothermal computer-based simulations (i.e., WUFI) to establish if there are significant differences in hygrothermal simulation results when the lower, upper and average equivalent air-layer thickness values are applied.