Article

Retrospective Analysis of a Large-Scale Gypsy Moth Outbreak in Hungary Combining Multi-Source Satellite and In Situ Data

1
Department of Forest Ecology and Silviculture, Forest Research Institute, University of Sopron, Várkerület 30/A, 9600 Sárvár, Hungary
2
Department of Forest Protection, Forest Research Institute, University of Sopron, Hegyalja út 18, 3232 Mátrafüred, Hungary
3
Department of Geophysics and Space Science, Institute of Geography and Earth Sciences, ELTE Eötvös Loránd University, Pázmány P. st. 1/A, 1117 Budapest, Hungary
4
Institute for Electrophysics/SpaceLab, Óbuda University, Szőlő u. 4, 1034 Budapest, Hungary
*
Author to whom correspondence should be addressed.
Forests 2025, 16(9), 1472; https://doi.org/10.3390/f16091472
Submission received: 23 July 2025 / Revised: 24 August 2025 / Accepted: 26 August 2025 / Published: 17 September 2025
(This article belongs to the Section Forest Health)

Abstract

Gypsy (or spongy) moth (Lymantria dispar) outbreaks have imposed significant threats to European forests for centuries. While traditional field-based research has provided detailed insights, it remains time-consuming, labour-intensive, and spatially limited. With the advancement of Earth observation satellite technology, forest monitoring has become more efficient and flexible. This study examined the impact of the most extensive gypsy moth outbreak (2003–2006) on the forest dynamics in Hungary using Moderate Resolution Imaging Spectroradiometer (MODIS)-derived indices: the Normalised Difference Vegetation Index (NDVI), Standardised NDVI (Z NDVI), and Leaf Area Index (LAI). Our results show that while the gypsy moth population in Hungary peaked in 2004, based on light trap data, and in 2005, according to field damage reports, the most severe defoliation occurred in 2005 and 2006, as detected by satellite-based decreases in the NDVI and LAI. MODIS-based vegetation indices proved effective in quantifying the extent and severity of defoliation, showing temporal and spatial patterns that aligned with ground observations. The LAI and NDVI metrics also captured varying degrees of defoliation and partial recovery. These findings underscore the value of integrating satellite data with field observations to improve early warning systems and enhance the forecasting and management of gypsy moth outbreaks.

1. Introduction

Gypsy moth (Lymantria dispar) (also called spongy moth) outbreaks can cause severe defoliation and even tree mortality in forests [1,2,3,4]. The caterpillars consume vast amounts of foliage, severely defoliating deciduous trees such as oak, beech, poplar, and many other broadleaved species and even coniferous tree species [2]. Repeated defoliation weakens trees, reduces their growth, and makes them more susceptible to other pests and diseases. This damage threatens the ecological balance of forests and affects timber production and the recreational value of forested areas. While controlling gypsy moth outbreaks is challenging, biological and chemical control measures can help mitigate their impact [5,6]. However, chemical control should be restricted to unavoidable situations since their undesired side effects may sometimes exceed their benefits.
Light traps are suitable for collecting data about gypsy moth gradations [7,8,9]. In Hungary, the Forest Research Institute of the University of Sopron has been operating a forestry light trap network since the early 1960s. More than 20 light traps have been used in the period of 2003–2006, some of which are in the outbreak focal points of gypsy moth outbreaks. Light trap data are considered to have predictive potential in forecasting outbreaks of several forest-defoliating lepidopteran species such as the gypsy moth [3,4,10,11,12], geometrids [13], the browntail moth (Euproctis chrysorrhoea) [14], and the lackey moth (Malacosoma neustria) [15]. The extent of the field damage reported by forest owners and managers has shown good correlation with light trap catches, proving the prediction potential of light trap data [16]. To our knowledge, no similar forestry light trap networks with nationwide coverage and several decades of operation exist in Europe. The long time series can be used to analyse diversity trends and changes in abundance of single species or species groups, among other purposes [8]. It is also suitable to use to detect the impacts of climate change-driven population fluctuations [11].
An effective approach to monitoring biotic agents is the use of remote sensing. Satellite imagery has been successfully applied to detect gypsy moth infestations in the United States of America. Vegetation indices provide valuable information on the greenness of vegetation, which is closely linked to foliar development and the overall condition of vegetation [17]. These indices can be derived from satellite-based remote sensing observations, serving as a powerful tool for studying the state of vegetation and overall ecosystem productivity at large spatial scales with high accuracy [18,19].
De Beurs and Townsend [20] found that the data of the Moderate Resolution Imaging Spectroradiometer (MODIS) could effectively estimate gypsy moth defoliation in deciduous forests using the Normalised Difference Infrared Index (NDII), Enhanced Vegetation Index (EVI), and Normalised Difference Vegetation Index (NDVI). Their study showed that the NDII, especially for bands 6 and 7 of the MODIS sensor, were the most effective in detecting defoliation [21]. They validated the MODIS-based defoliation patterns using Landsat imagery. Another US study by Spruce et al. [21] found that MODIS-derived NDVI and LAI (Leaf Area Index) time series data could effectively detect gypsy moth defoliation in forests. Their study assessed the accuracy of NDVI data in identifying defoliation patterns and patch sizes. The results indicated that defoliation patches larger than 0.63 km2 could be reliably detected using daily non-composited MODIS data. The study by Latifovic et al. [22] investigated the impact of gypsy moth defoliation on the carbon balance of a temperate deciduous forest in North America.
Near-real-time methods were suggested by Olsson [23] using satellite time series, with which one can effectively monitor the impact of insect defoliation on forest carbon balance. His research focused on developing techniques to detect changes in vegetation indices over time to track defoliation events as they occurred. The study demonstrated that satellite-based monitoring allows for timely assessments of insect damage and provides insights into how outbreaks influence forest carbon sequestration.
The efficiency of remote sensing in monitoring the damage caused by gypsy moths was proved early by Csóka and Nádor in Hungary [24]. The researchers analysed satellite data to detect defoliation patterns, which are indicative of pest infestations, and combined this with ground-truthing to validate the findings. Their approach demonstrated that satellite imagery could effectively map large-scale forest damage and provide a cost-effective method for monitoring pest outbreaks, improving early detection and pest management strategies. In Hungary, the Remote Sensing-based Forest Monitoring System (TEMRE) has also been used to monitor forest disturbances [25] based on MODIS and Sentinel products (URL: http://www.temre.hu, accessed on 28 August 2025).
Despite the significant impact of the biotic damage caused by gypsy moths and the necessity for monitoring, there is limited research utilising a combination of light traps, field observations, and remote sensing techniques.
In the present study, we aim to use NDVI, Z NDVI, and LAI, all derived from measurements from MODIS sensors, to investigate the damage caused to forests during the largest gypsy moth outbreak in Hungary. This study explores the following four questions to addressing this gap:
  • How effectively can MODIS-based NDVI and Z NDVI detect and quantify the level of defoliation caused by the gypsy moth, and what is the agreement between observed defoliation and NDVI and Z NDVI anomalies?
  • How have the NDVI and LAI of different tree species changed in areas affected by gypsy moth gradation?
  • How do field damage reports correlate with satellite data?
  • How does the light trap catch data correlate with satellite data, and could it predict the gypsy moth gradation?

2. Materials and Methods

2.1. Gypsy Moth

The caterpillar of the gypsy moth (or spongy moth) (Lymantria dispar) can cause severe and large-scale defoliation during its outbreaks [1,2,3,4,5,6,10,11,12]. The moth is native to Europe, Asia, and Africa, and was accidentally introduced to North America as well. The species is polyphagous, but in Central Europe, the oak species (Quercus spp.) are the main hosts, which feed on the leaves, causing defoliation. Biological and chemical controls are available; however, they are rarely applied at present [26]. Other species can be hosts like poplars (Populus spp.), hornbeams (Carpinus spp.), or beeches (Fagus spp.).

2.2. Study Area

The study area encompasses Hungary in Central Europe with diverse landscapes, including extensive forested regions that play a critical ecological and economic role. Hungary’s total forest cover is approximately 22% of its land area, dominated by deciduous species such as pedunculate oak (Quercus robur), sessile oak (Quercus petraea), Turkey oak (Quercus cerris), European beech (Fagus sylvatica), European hornbeam (Carpinus betulus), and Black locust (Robinia pseudoacacia), alongside coniferous species like Scots pine (Pinus sylvestris) and Norway spruce (Picea abies). These forests are distributed across various ecological zones, including the Northern Mountains, Transdanubian Hills (including Bakony Mountains), and Great Hungarian Plain, each characterised by distinct climatic and topographic conditions.

2.3. Field Datasets

2.3.1. Field Damage Reports

Field damage reports cover biotic forest damage since 1961, where defoliation caused by gypsy moth in Hungary was detectable in the mid-2000s, especially between 2003 and 2006 (Figure 1). The data has been collected differently since 2012 due to modernisation.
Forest owners and managers of forests larger than 100 hectares were obliged to report any forest damage observed in their forests, and the reported damage data are summarised by ten regions (Figure 2) and given in hectares.
A field observation-based database was used for validation purposes for the year 2005, which was characterised by a particularly heavy infestation of gypsy moth in the Bakony Mountains (Bakonyerdő Ltd.). This database included the maximum degree of infestation in 2005 on the forest subcompartment level (for 11,169 subcompartments) with five categories (negligible, weak, moderate, strong, and extreme). The registration of damage in this level of detail was not obligatory in 2005, but from 2012 it became obligatory, which is why we only have this dataset for a single year, unlike the satellite image series and light trap catches.

2.3.2. Light Traps

Standardised “Jermy-type” light traps equipped with 125 W mercury bulbs operate nightly from sunset to sunrise between March 1 and late December, a practice that continues today. A total of 22 traps are monitored daily, with the catch emptied each morning. The captured macrolepidopteran species are identified at the Department of Forest Protection, Forest Research Institute. Data are shown for the gradation period (2003–2006). Since gypsy moth females are flightless, the traps capture only males. The recorded numbers of male gypsy moths caught between 2003 and 2006 are presented in Table 1. The sharp decline in gypsy moth populations from 2004 to 2006 was because of the initial outbreak in 2003, and the infestation reaching its culmination in 2004 resulted in a still high moth population in 2005, but the gradation collapsed in 2006. The collapse has natural reasons such as less available foliage and anthropogenic ones like chitin synthesis inhibitors sprayed from helicopters on 37,000 hectares [4].

2.4. Land Cover Dataset

Remote-sensing-based analysis was performed for forested pixels identified using the species and habitat type information from the Ecosystem Map of Hungary developed within the NÖSZTÉP project [27,28]. This map (hereafter referred to as the NÖSZTÉP dataset) distinguishes 56 ecosystem categories (Level 3) at a 20 m spatial resolution and covers the entire territory of Hungary. Resampling the dataset to the MODIS grid yielded values representing the actual shares (in per cent) of each ecosystem category for every MODIS pixel [29]. Forested pixels were defined as those where the combined share of broadleaf species exceeded 90%. The research was conducted on the following species: pedunculate oak, sessile oak, Turkey oak, European beech, and poplars, including both domestic and introduced species.

2.5. Remote Sensing Data

2.5.1. NDVI Datasets

To detect forest areas defoliated by the gypsy moth outbreaks, we used NDVI derived (NDVI derived from the observations of the MODIS sensor on board satellite Terra) [30,31]. We used the Collection 6.1 surface reflectance product at 250 m (MOD09Q1) [32], downloaded from NASA’s LP DAAC archive for the period 2000–2024 [33]. The datasets have a nominal 8-day temporal resolution, created through a strict compositing process that selects the best-quality daily observations within each 8 days, where the exact dates of the measurements are provided [34]. The NDVI is calculated as (Equation (1)):
NDVI = (RNIRRRED)/(RNIR + RRED)
where RNIR and RRED are the surface reflectance data of Band-1 and Band-2 of the MODIS sensor at 250 m.

2.5.2. Detecting Defoliated Pixels

NDVI was calculated from quality-filtered and smoothed surface reflectance data according to Kern et al. [29]. The quality-checked and gap-filled datasets were resampled to daily resolution using linear interpolation, considering the actual acquisition dates. Then, the Savitzky–Golay filter [35] was also applied with a 30-day window and a second-degree polynomial to produce smoothed daily datasets. From these, a regular 8-day-resolution NDVI dataset was reconstructed, consisting of 46 data points per year.
Defoliated pixels were identified based on the decline on the NDVI curve at a yearly level. We use Day of Year (DOY) here, and this decline (NDVIdecline) was calculated as the difference between the mid-summer minimum NDVI (NDVImin, during DOY 145–200) and the early summer maximum NDVI (NDVImax, during DOY 121–177). The selected early summer period typically corresponds to the peak defoliation period caused by the gypsy moth. Pixels were detected as potentially defoliated if the calculated decline (NDVIminNDVImax) was less than −0.07. To reduce the likelihood of false positives caused by weather effects or forest management, an additional criterion was introduced. Namely, NDVI during the late summer (DOY 178–264, after the defoliation period) had to increase and reach a high value (not lower than NDVImax − 0.04), reflecting secondary greening. To filter out residual noise, we also required that the calculated NDVImin was not a single low value, but was present at least for three consecutive dates, meaning at least 24 days. The onset of the decline, as calendar date of the actual year (DOY), was estimated at pixel-level as the first date when the NDVI started to decline after reaching the early spring local maximum.

2.5.3. Leaf Area Index (LAI) Datasets

The MCD15A2H MODIS LAI product was used to estimate leaf area per unit ground surface area, a critical parameter for understanding canopy structure, photosynthetic capacity, and energy balance [27]. LAI data is particularly valuable for analysing forest dynamics, as it provides insights into forest density and growth patterns. The LAI was derived from MODIS bands 1–7 and provides global 8-day composites at 500 m resolution; the LAI (2) dataset complements the NDVI by offering structural information of vegetation canopy and biomass distribution for the period 2000–2024, where α and β are biome-specific coefficients:
LAI = α × NDVI + β

2.5.4. Z NDVI Classification

The Z NDVI is a modified version of the NDVI that accounts for variations in environmental conditions, seasonal changes, and differences in sensor calibration. Since NDVI values fluctuate over time, capturing vegetation conditions at a specific moment rather than deviations from long-term trends, we used the Standardised NDVI (NDVI Z) (3), calculated as follows [36]:
NDVI Z = (NDVI − NDVI_mean))/NDVI_std
where NDVI is the median composite for the growing season of the given year, NDVI mean is the mean NDVI for the 2003–2006 period, and NDVI std is the standard deviation for the same period. Negative NDVI Z values indicate vegetation degradation, while positive values indicate recovery.
The Z NDVI rasters from 2000 to 2024 were filtered to include pixels with at least 75% forest cover, and the cloud-affected pixels were removed using MODIS quality assurance flags. For clearer interpretation [36], the filtered rasters were reclassified into five categories, assigning each pixel to one of five classes:
  • Z NDVI < −2: severe forest damage;
  • Z NDVI < −1: moderate forest damage;
  • Z NDVI < 0: neutral state;
  • Z NDVI < 1: regeneration;
  • Z NDVI > 2: strong regeneration.
This classification simplified the representation of vegetation conditions and allowed for consistent comparison across rasters. After the reclassification, statistical analysis was performed to calculate the unique raster values and their distribution to show where a health decline was in the forest state according to the satellite observations. The creation and classification of Z NDVI was made in the Google Earth Engine [37] cloud platform, which is a very strong and flexible geospatial tool for Earth analysis.

2.5.5. Validation with Field Data

A field observation-based dataset for the year 2005 in the Bakony Mountains was used for validation purposes. First, we assigned the subcompartment data to the MODIS grid. The matching was performed based on the forest subcompartment occupying the majority of the MODIS pixel area. We calculated the percentage of occupations for every MODIS pixel. For validation, we decided to use those MODIS pixels that were more than 50% covered by a specific subcompartment, which resulted in 5672 pixels. The NDVI drop data of the potentially defoliated pixels was assigned to these MODIS pixels containing the observations. We calculated for all observed infestation categories the number of pixels with potentially detected defoliation and how the potentially detected pixels are distributed between each infection category using two thresholds (NDVI drop of –0.07 and –0.15). Finally, for all MODIS pixels that were detected as potentially defoliated, the distribution of NDVI drops was presented for all observed infestation categories. The significance of differences among the infestation categories was tested by one-way ANOVA (p > 0.95).

3. Results

3.1. Field Damage

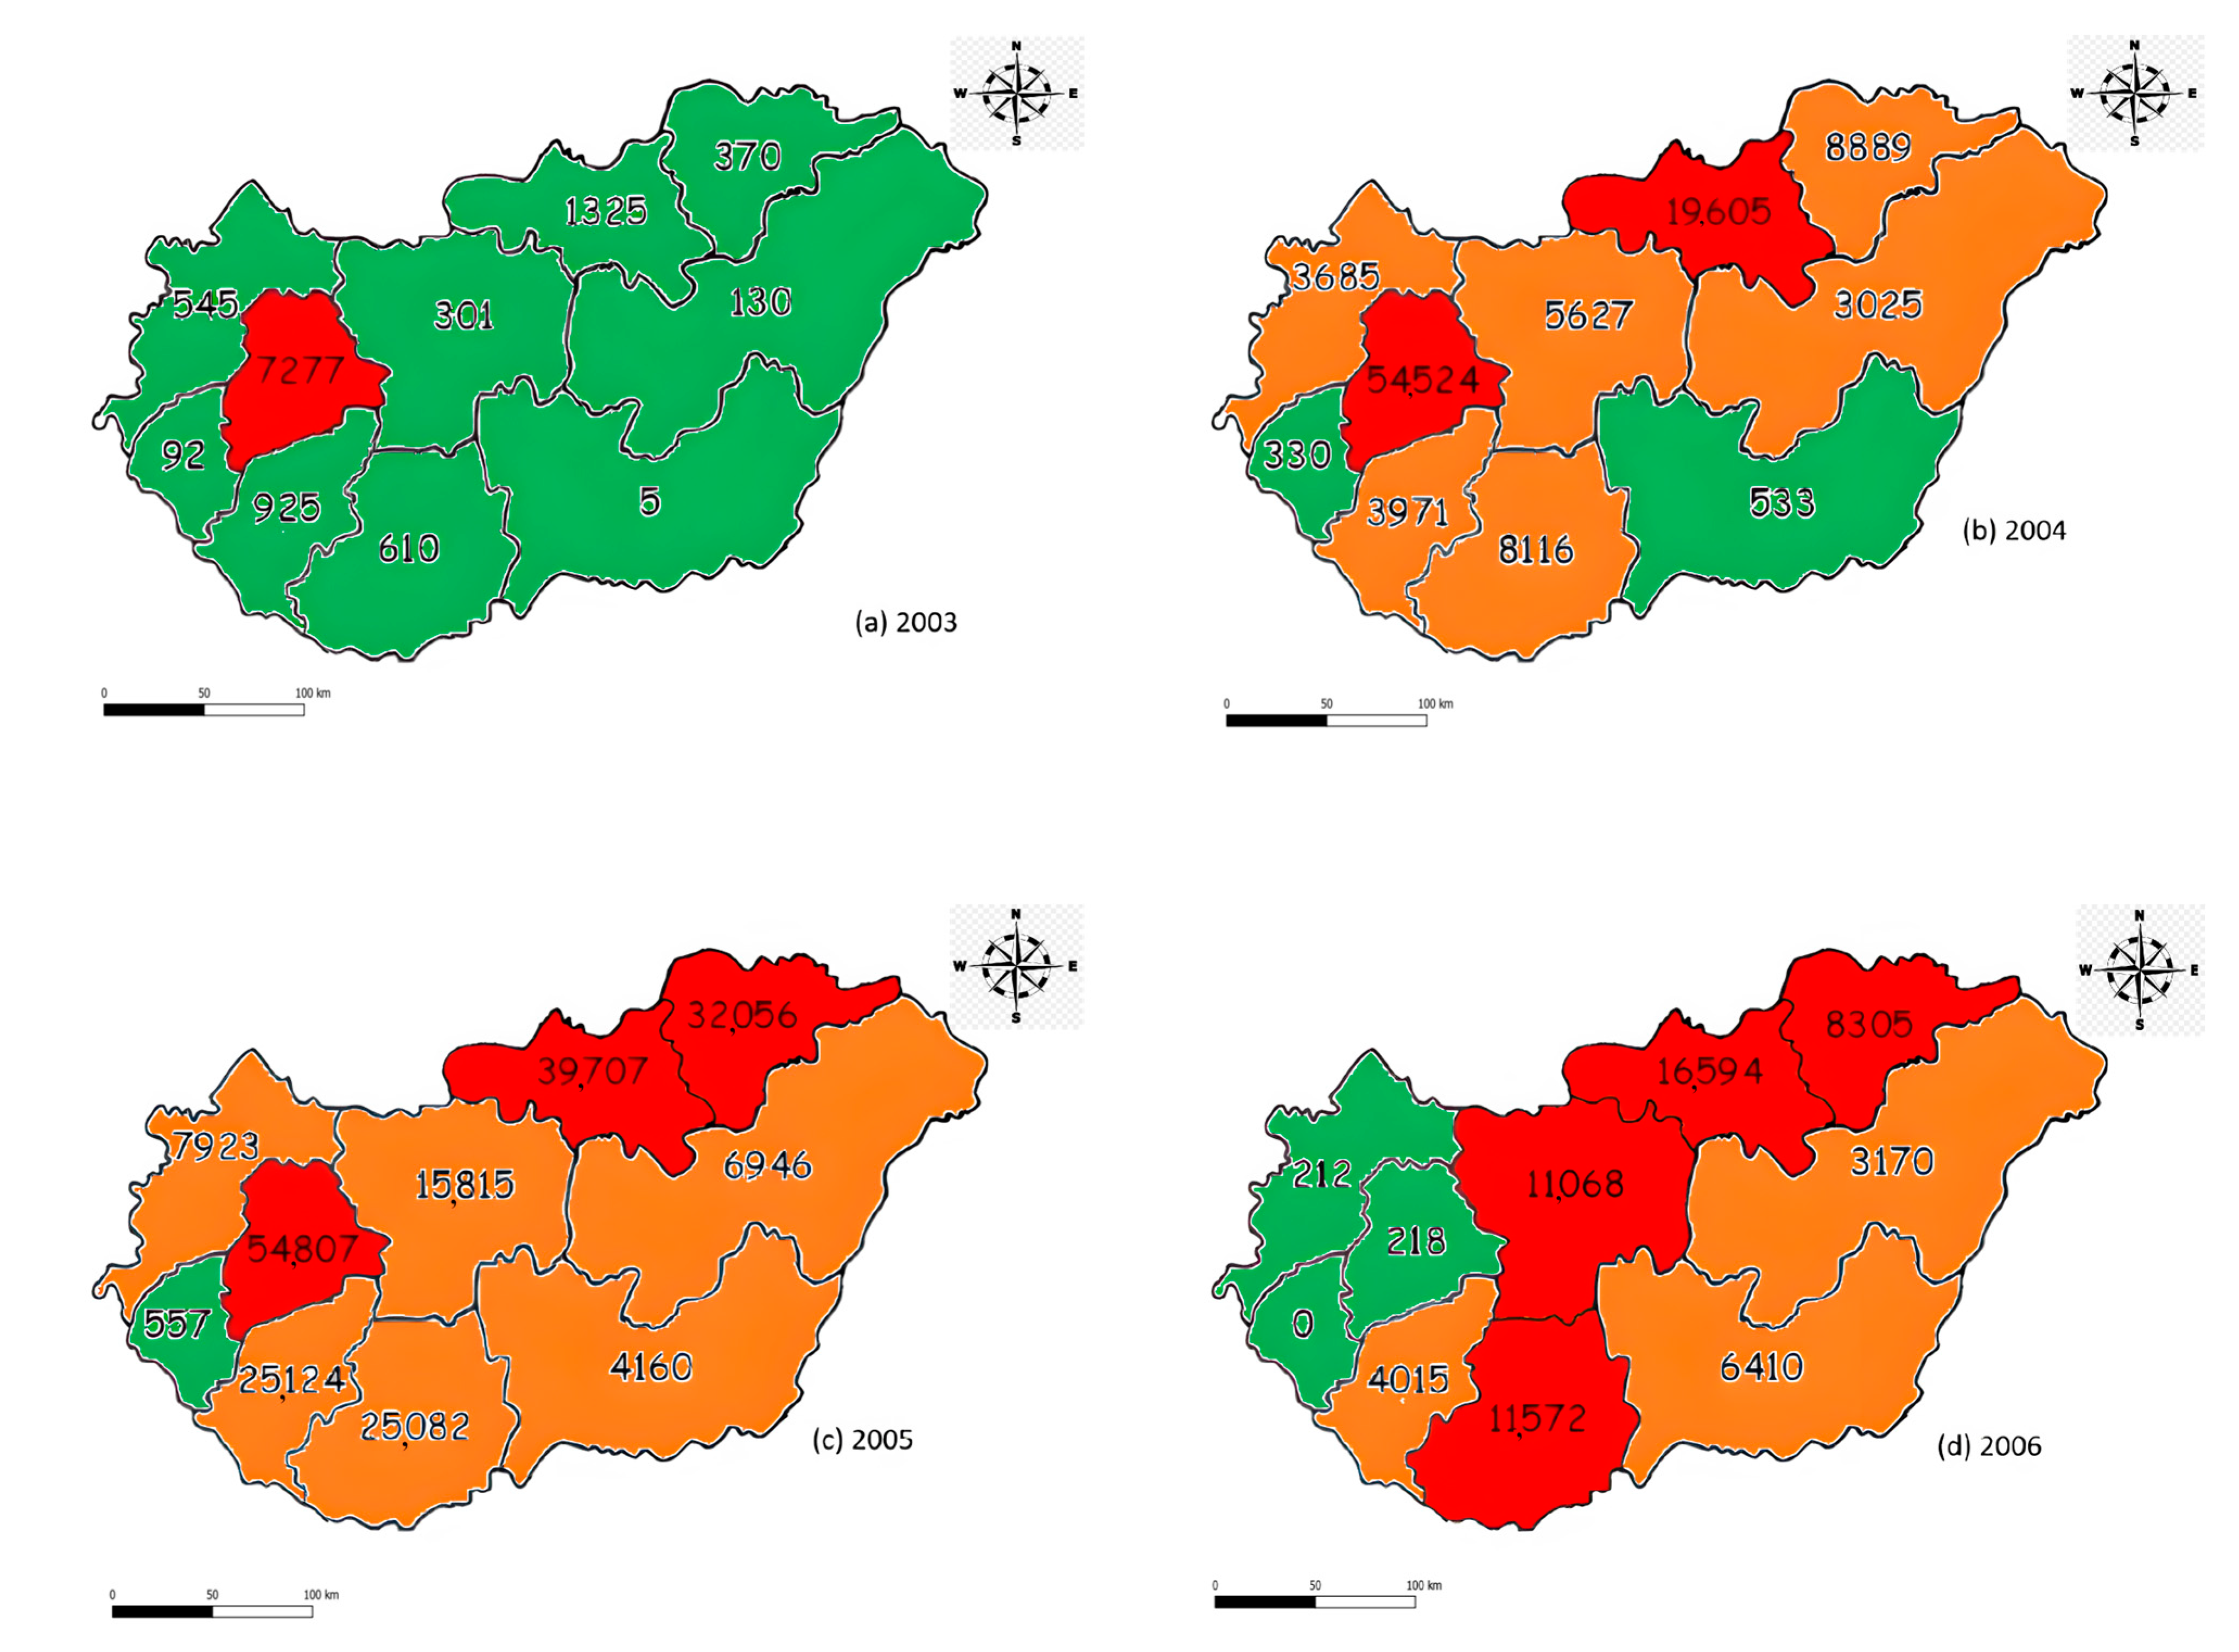
The year 2004, according to the light traps, was marked by extremely high catch numbers, especially in Egyházaskesző (near the Bakony Mountains) with 14,623 moths (Figure 1 and Figure 2, Table 1). Bakonybél followed with 3929, and Felsőtárkány with 2208 in 2005, showing that in 2004 a widespread outbreak occurred, where the peak shifted eastwards in subsequent years. Egyházaskesző stands out as having the highest number of catches overall, not just for 2004 but also for 2003. Bakonybél and Felsőtárkány also had sustained high activity. In summary, 2004 was the peak year for moth gradation from the point of the light traps, and 2005 from the point of the total defoliated area. The countrywide peak year from the point of damaged area was 2005, with more than 212 thousand hectares. The main focus of the damage area between 2004 and 2005 moved from the Bakony Mountains to other regions, while in 2006 the damaged area declined significantly almost everywhere, followed by the collapse of the gradation.

3.2. Detected Defoliated Pixels

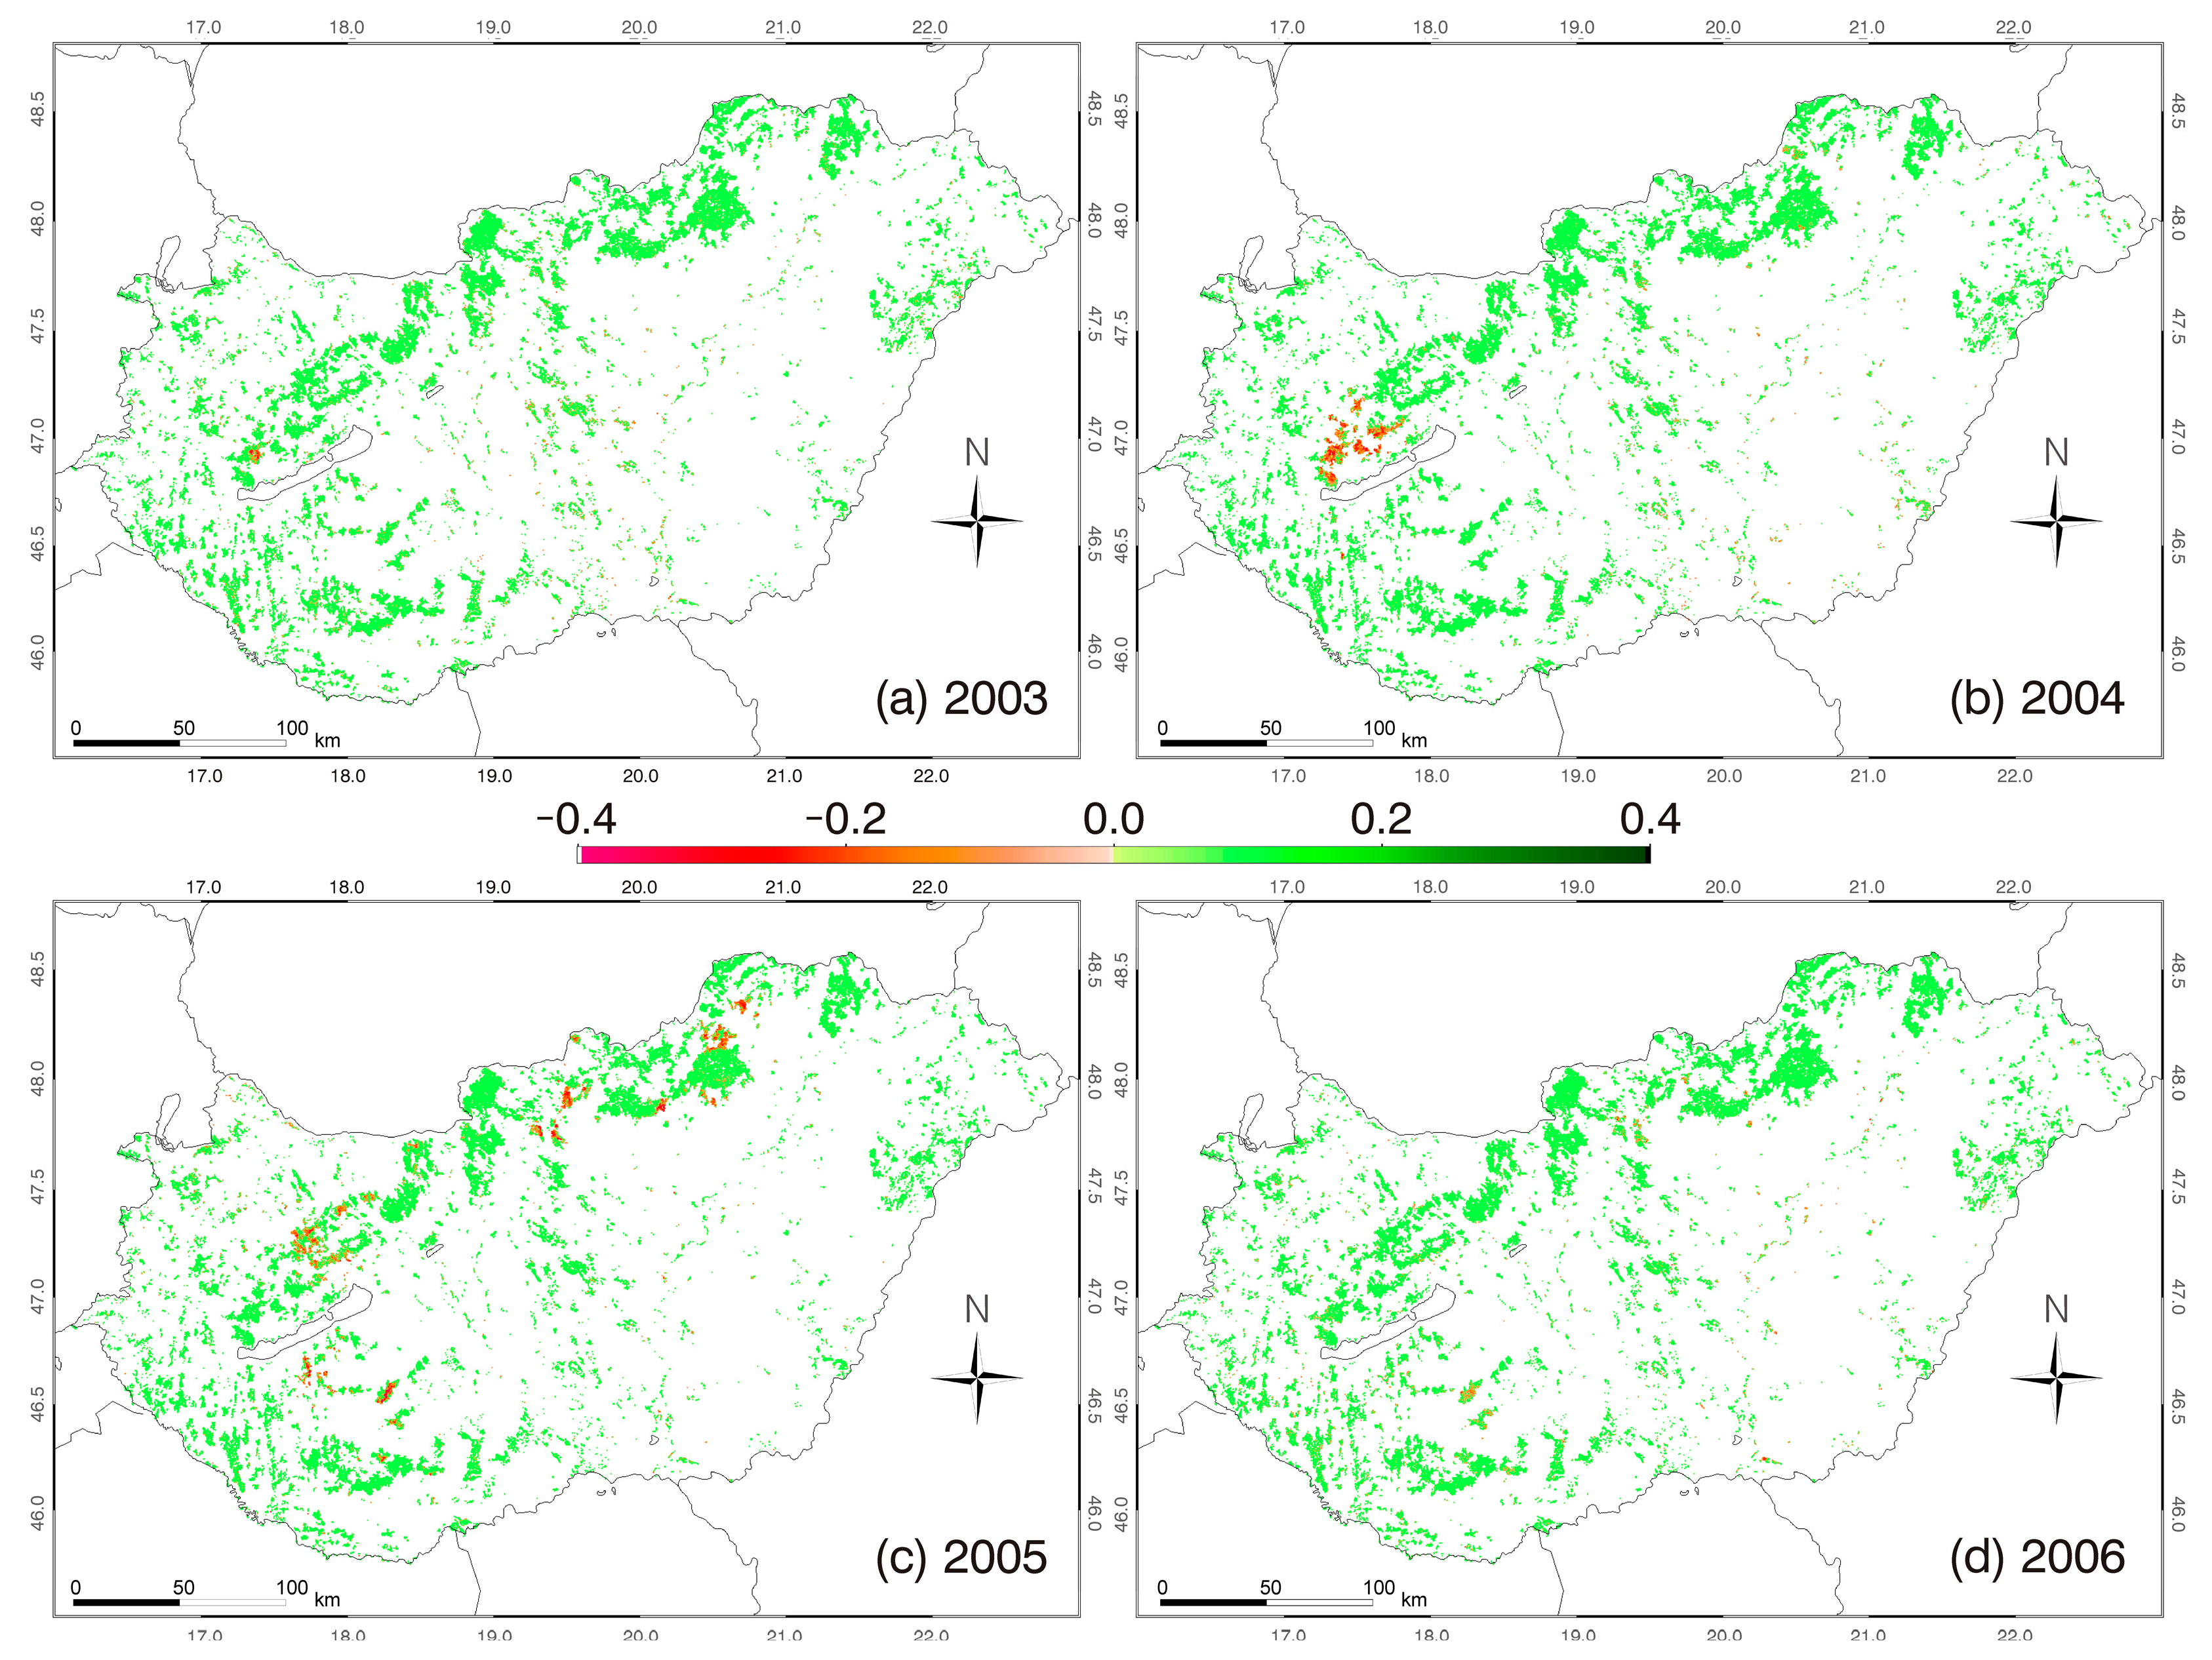
Figure 3 shows the maps of the identified defoliated forests based on the calculated MODIS NDVI decline (NDVIdecline) during the period 2003–2006, the peak years of the infestation. The outbreaks exhibited a clear propagation pattern from the Bakony Mountains towards the northeast, with the majority of defoliation events occurring in this region in 2004 and 2005.
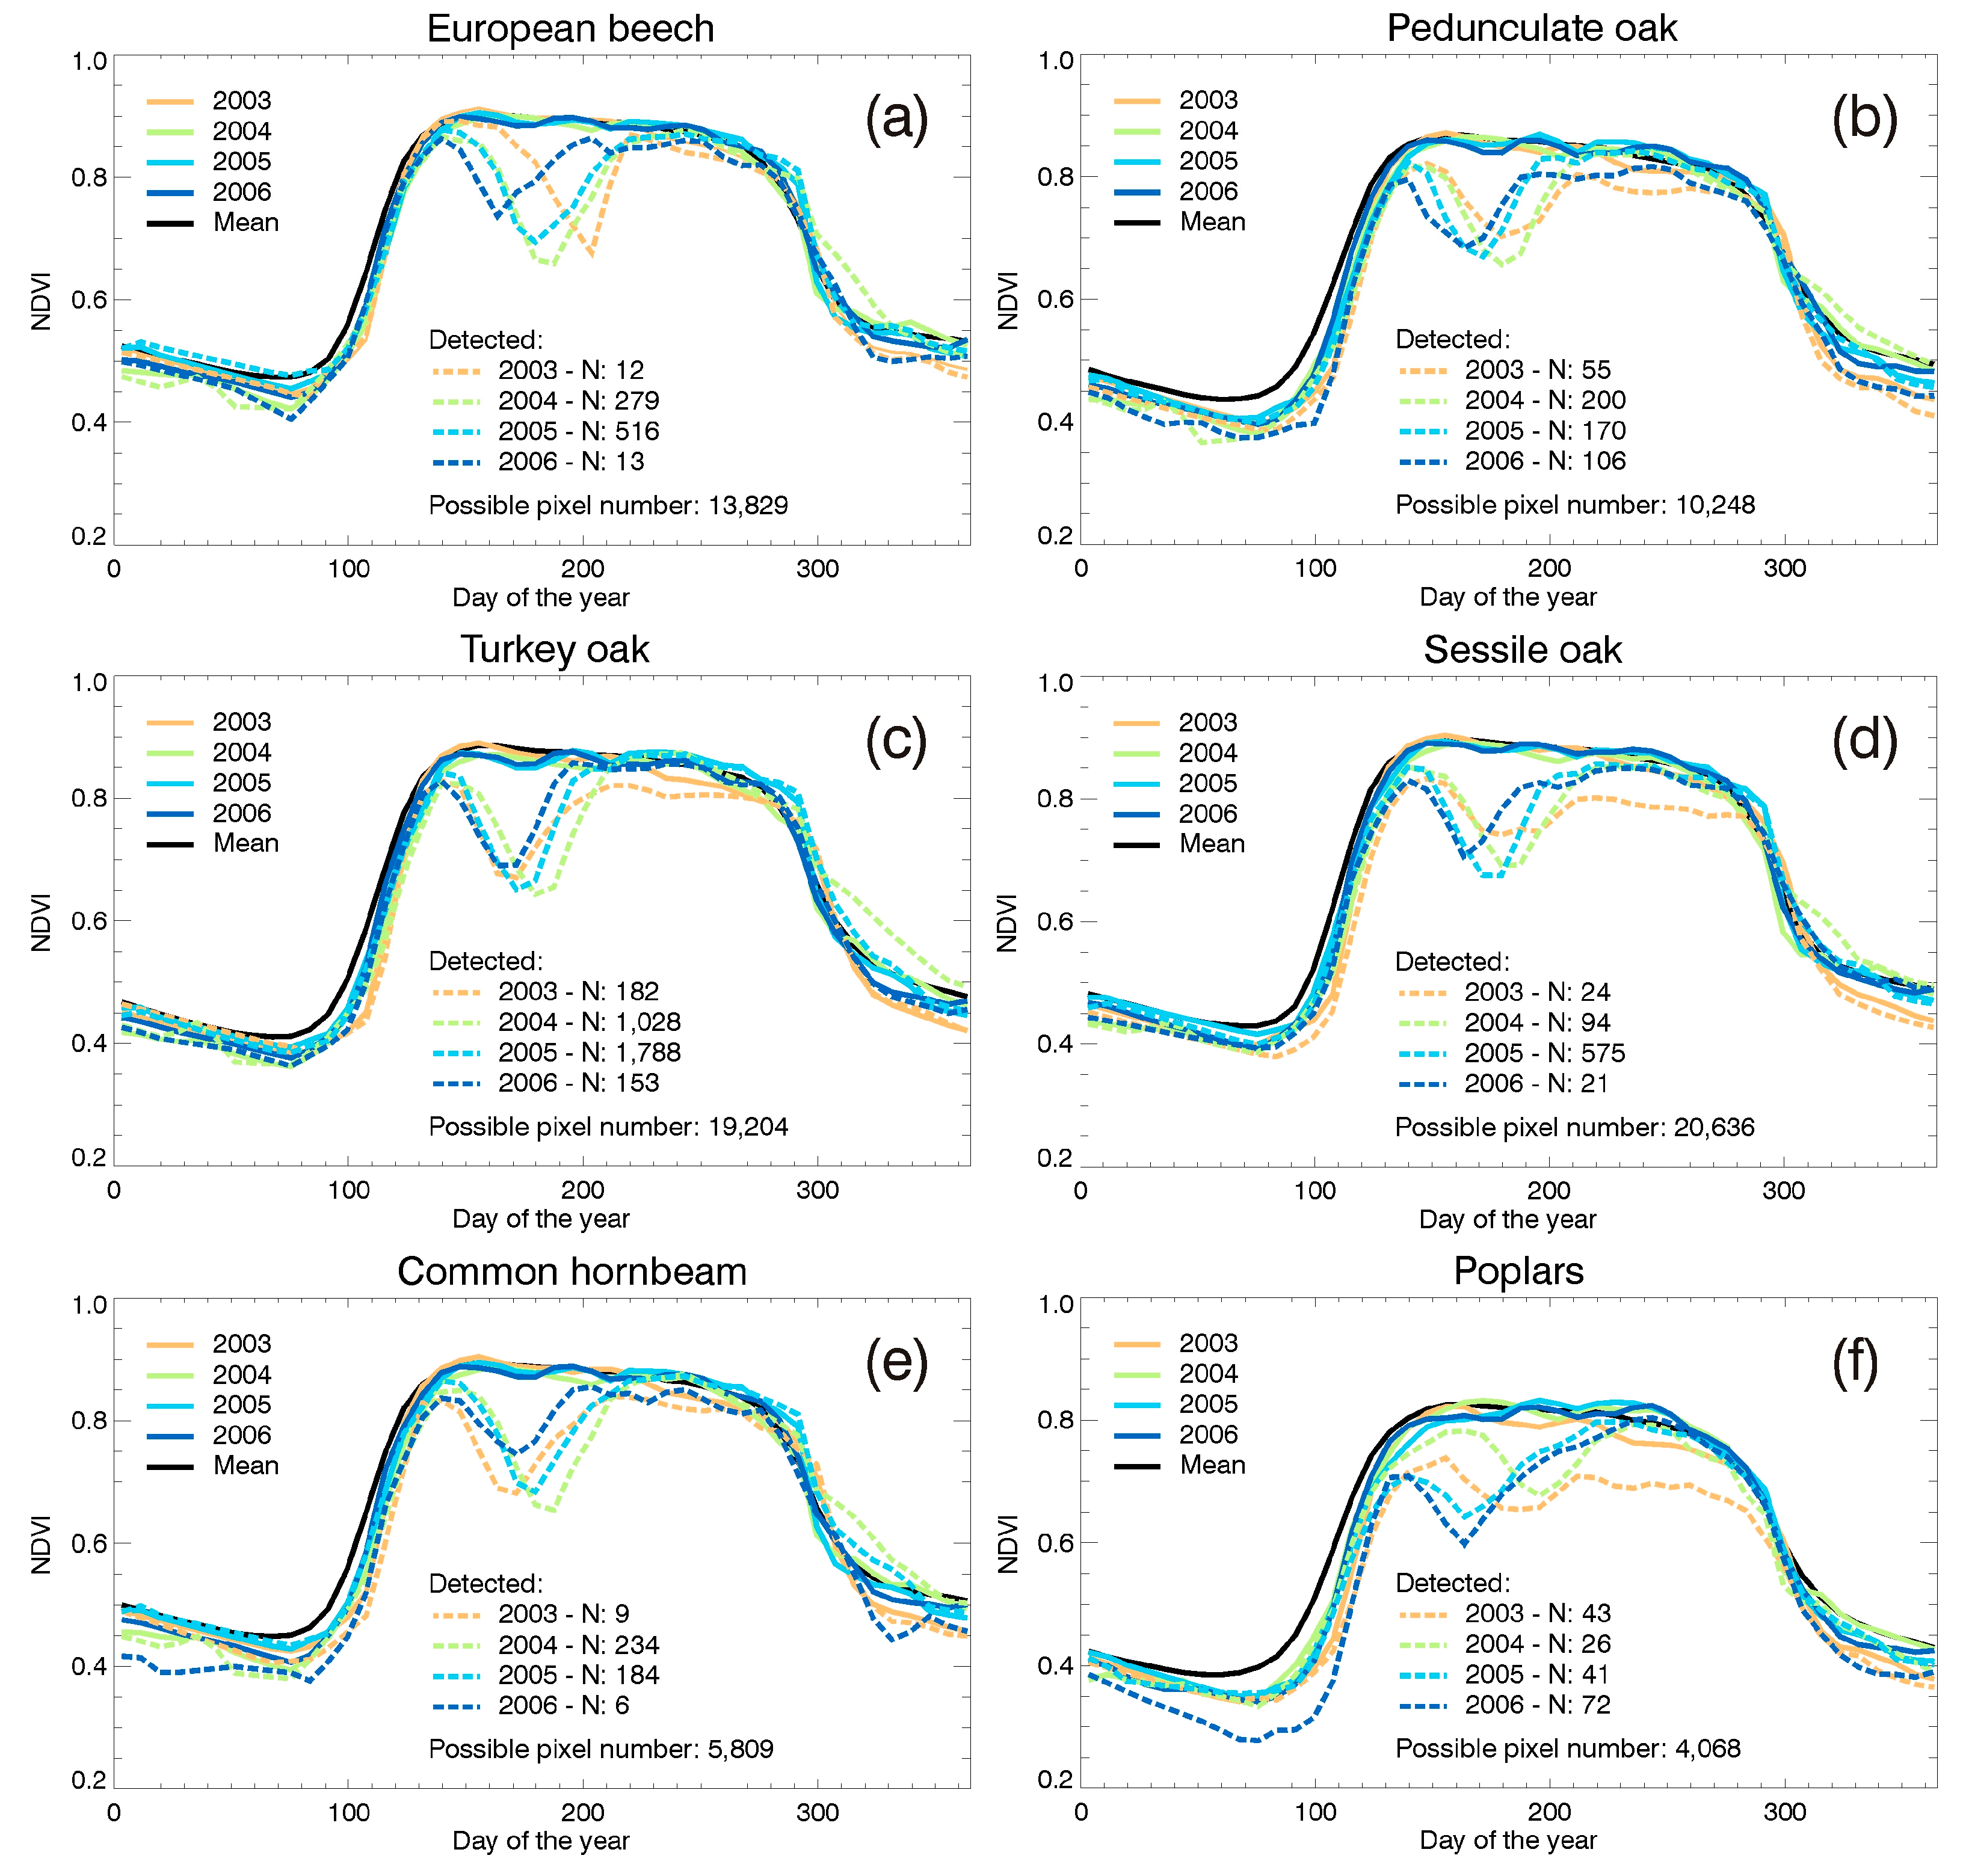
The species-specific numbers of the detected defoliated MODIS pixels (at 250 m resolution) varied between years, depending on the dominant tree species in the forest stands where the outbreaks occurred (Figure 4). The detected pixels were primarily associated with forest compartments dominated by Turkey oak, sessile oak, and beech, although pedunculate oak, common hornbeam, and poplars were also affected. The number of detected pixels was highest for Turkey oak in each year from 2003 to 2006, representing yearly 1.0%, 5.4%, 9.3%, and 0.8% of the investigated Turkey oak pixels, respectively. It should be noted that only MODIS pixels with at least 90% broadleaved forest cover and at least 75% share of the dominant species were included in the analysis (see Section 2.4). This represents approximately 19% of Hungary’s total forest area, with a specific focus on larger and more homogeneous forest stands. The annual mean NDVI curves of the detected pixels revealed broadly similar patterns of gypsy moth-induced NDVI decline across the main species, although the magnitude and timing varied between years (Figure 4). In contrast, the mean NDVI curves of the undetected pixels showed no or only slight indications of defoliation, suggesting a low number of false negatives. The impact of the extreme summer drought in 2003 was also clearly visible in the NDVI profiles of the oak species and poplars.
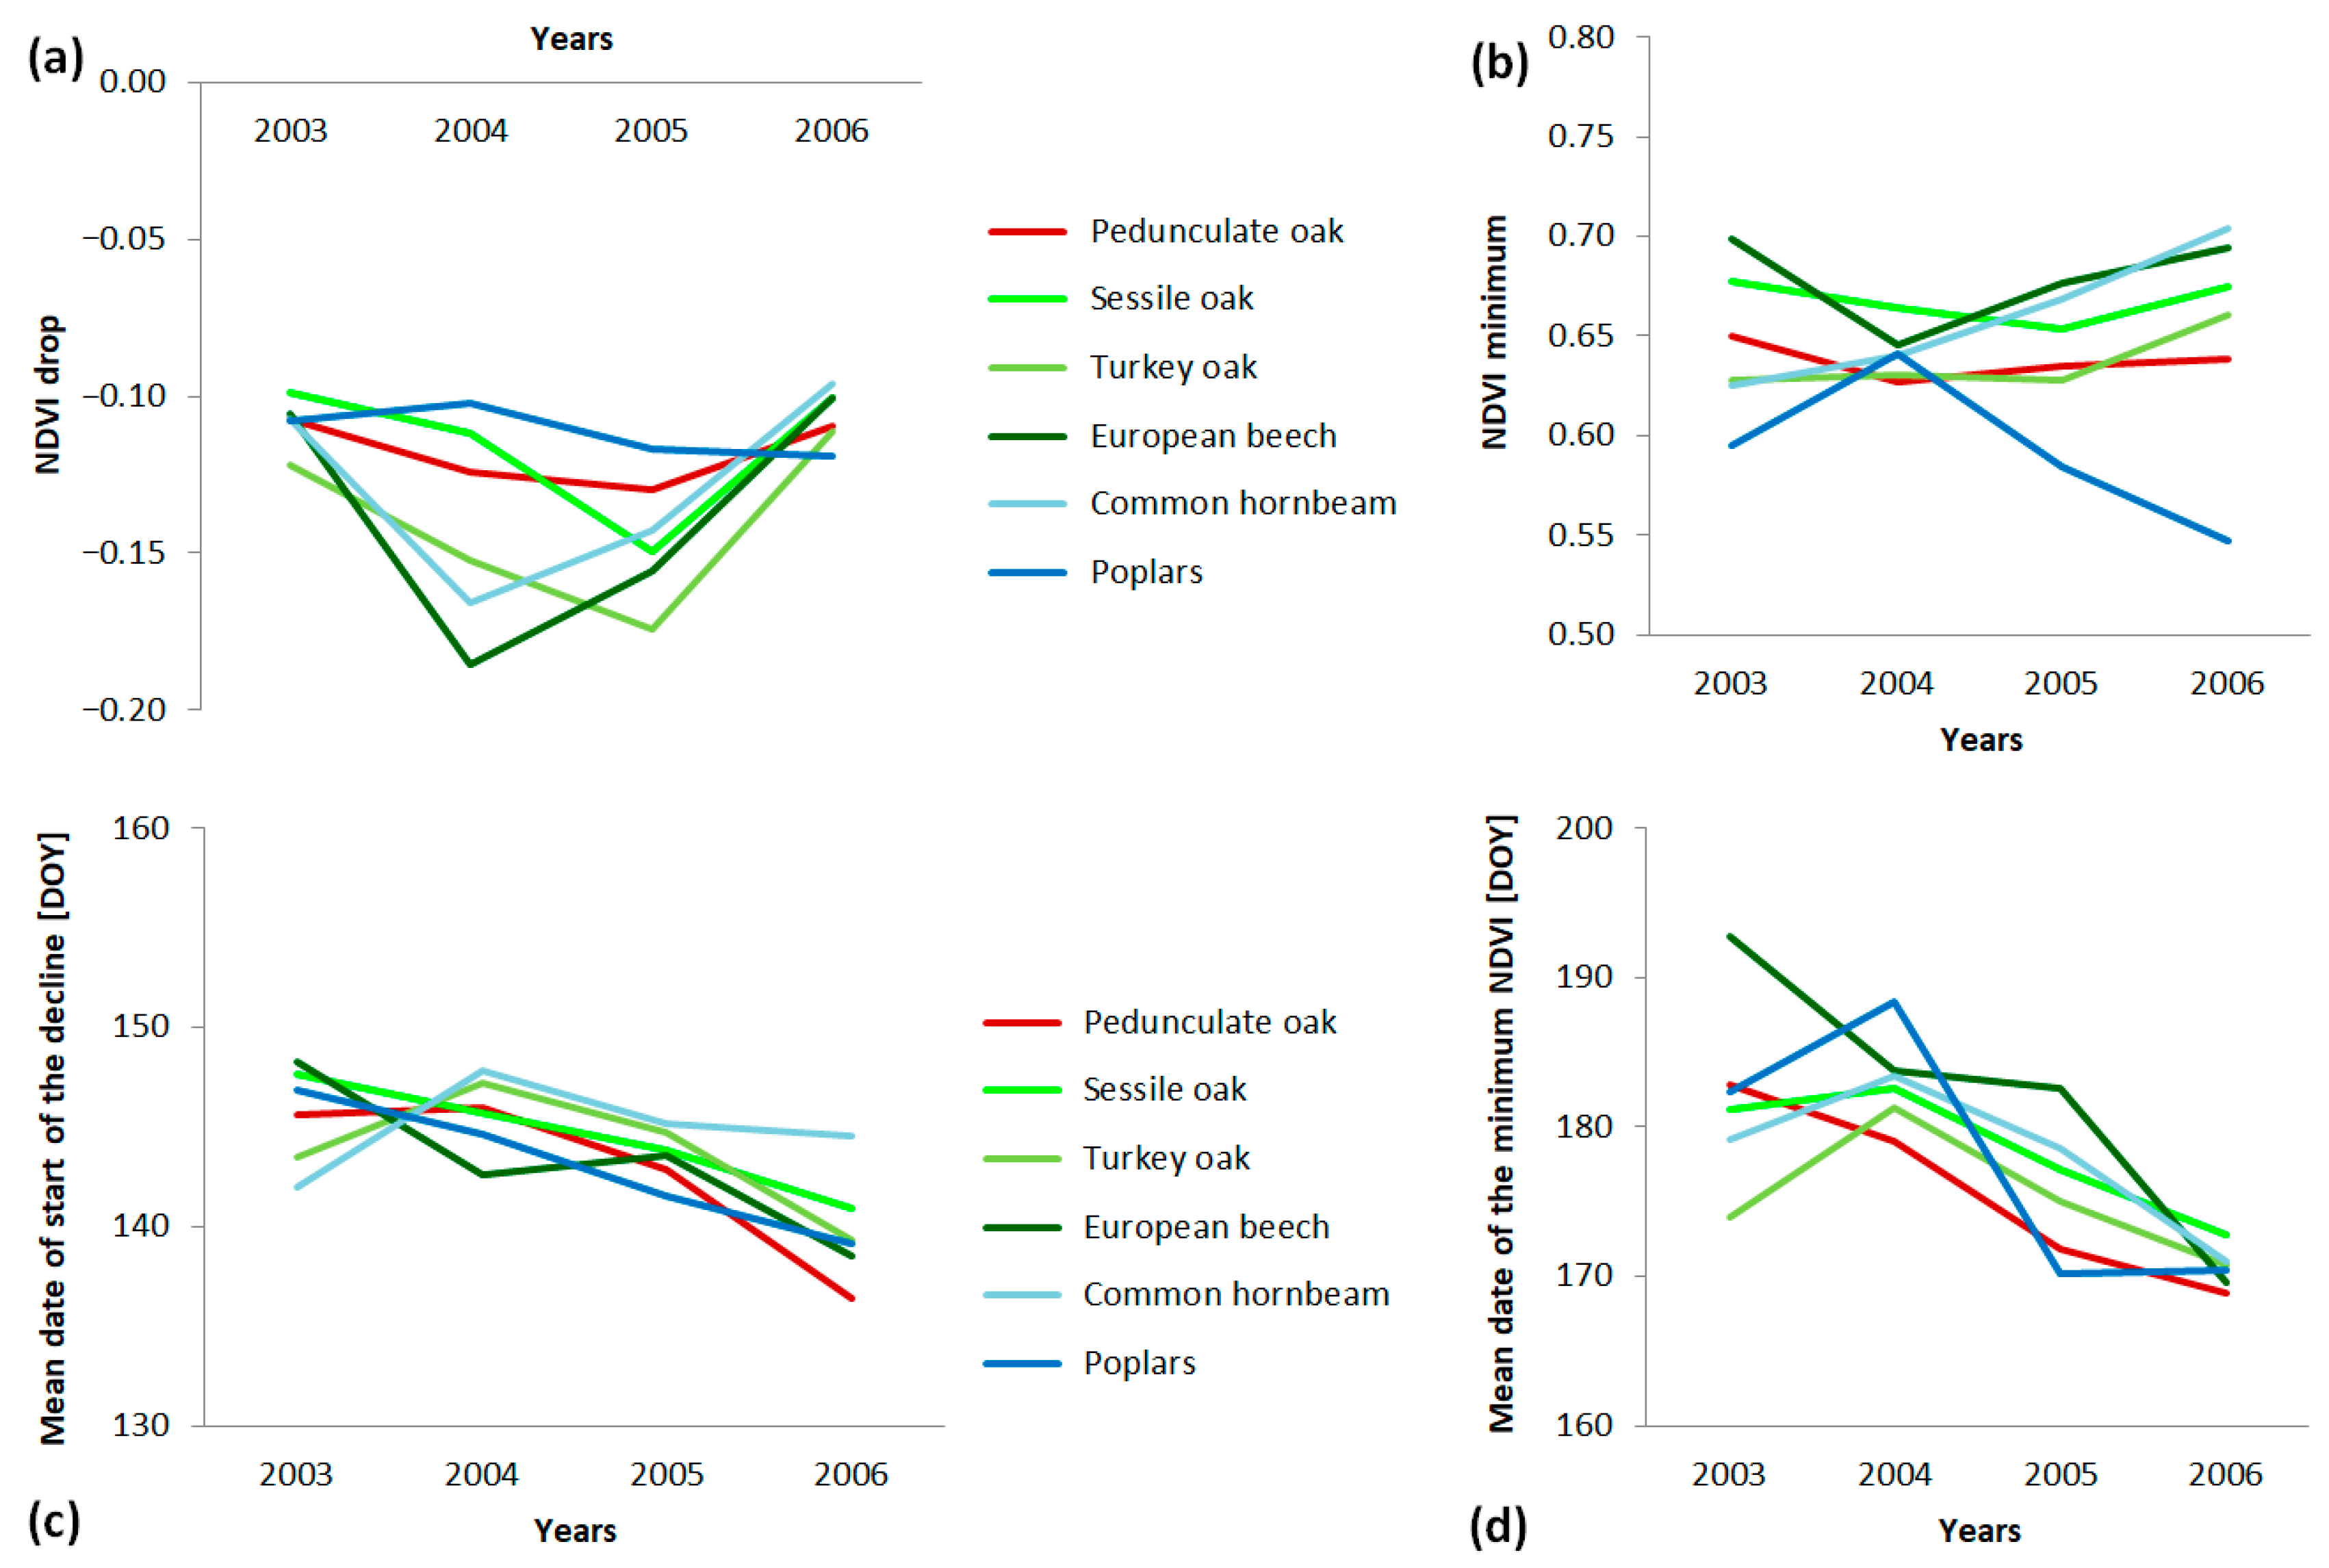
The species-specific mean NDVI drop of the detected pixels during the period 2003–2006 (Figure 5a) indicates the largest decreases during the peak years, for European beech in 2004 and for Turkey oak in 2005, with values of –0.19 and –0.17, respectively. The overall mean NDVI drop across the period 2003–2006 was smallest (i.e., highest in absolute terms) for beech and Turkey oak stands (–0.14 for both), while poplars showed the least pronounced decrease (–0.11). Considering the species-specific mean NDVI minimum of the detected pixels (Figure 5b), pedunculate oak stands exhibited the smallest and poplars the highest temporal variability across years. The highest mean NDVI was associated with beech stands (0.68) and the lowest with poplars (0.59). As poplars showed the smallest absolute drop and beeches the largest, these values clearly reflect the species-specific mean phenology, with the highest maximum NDVI during the growing season for beech and the lowest for poplars. However, the onset of decline and the timing of the mean NDVI were more strongly year-dependent, reflecting the actual weather conditions (Figure 5c,d). The earliest onsets occurred in 2006 (DOY 140) and the latest in 2004 (DOY 146), both in the second part of May, while the minimum NDVI was reached earliest in 2006 (DOY 171) and latest in 2004 (DOY 179), in all years in the second part of June.
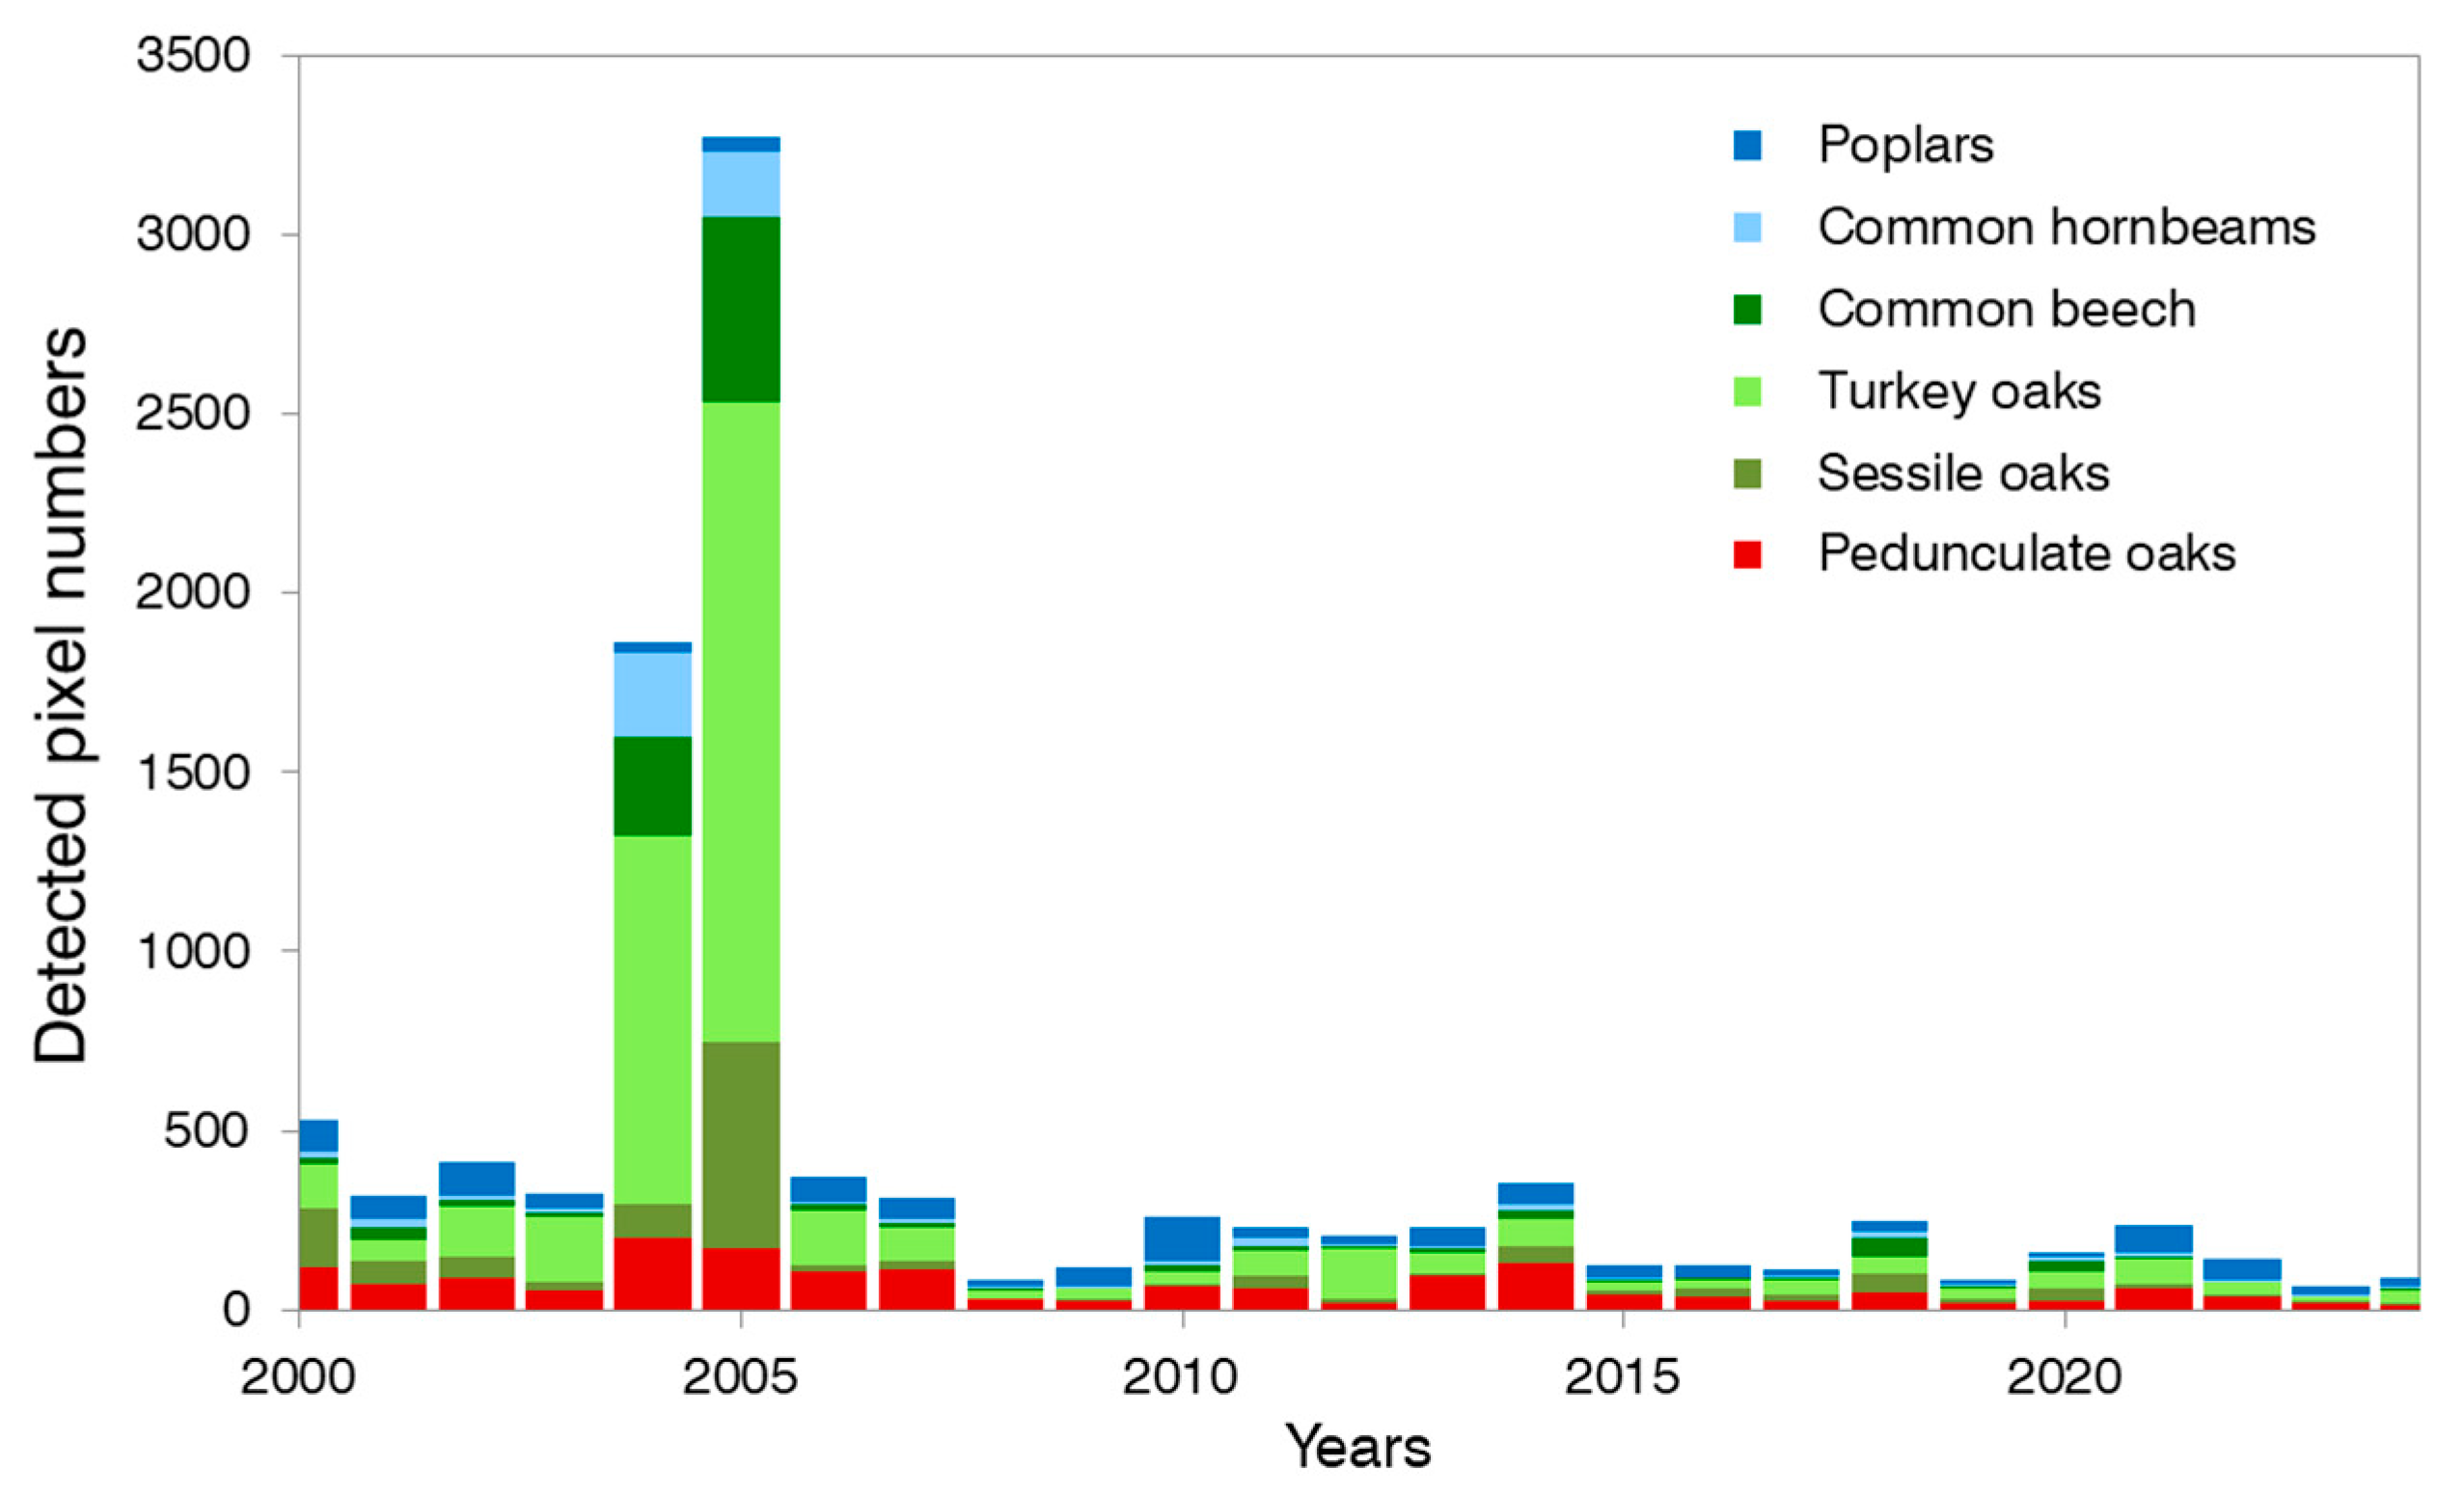
The yearly numbers of the detected defoliated MODIS pixels (at 250 m) during the period 2000–2024 (Figure 6) show no similar high peaks after 2005, in agreement with the light trap and field damage reports (Figure 1, Table 1). It is important to note that our method captures only the most severe defoliation events in order to minimise potential misclassification. The low number of detected pixels (especially in lowland poplar and pedunculate oak stands) in every year can be considered residual noise, as the investigated pixels were not entirely forested and may also contain other land cover types. Nevertheless, the notably higher number of defoliated Turkey oak pixels in 2012 clearly reflects the last significant gypsy moth outbreak attempt in Hungary, in agreement with the field damage reports.

3.3. Z NDVI Patterns

The analysis of the Z NDVI derived from MODIS data revealed significant temporal and spatial patterns in forest vegetation dynamics, particularly in the occurrence of negative (−2, −1) and positive (1 and 2) Z NDVI values of different years (Table 2). Between 2003 and 2006, the categorised Z NDVI values revealed temporal shifts in forest health in connection with the gypsy moth gradation. In May 2003, the pixels in positive categories increased to nearly 47%, indicating active vegetation growth, but 10% of pixels showed severe and 15% moderate defoliation. The gradation intensified in 2004 when 34% of pixels were in the damage class by late April and mid-May. The peak of defoliation was in 2005, with the highest negative anomalies, when 6% of pixels were severely damaged and 18% moderately, thus 24% in total by May. In 2006, a spike in damage during April saw the moderate stress category reach 67.9%. Despite this, positive anomalies increased in May, suggesting partial recovery, but later defoliation peaked again in June, with moderate damage at 14% and severe damage at 4%. Overall, these patterns highlight 2005 and 2006 as the years of most intense defoliation before the gypsy moth gradation collapsed in 2007.

3.4. Leaf Area Index Changes

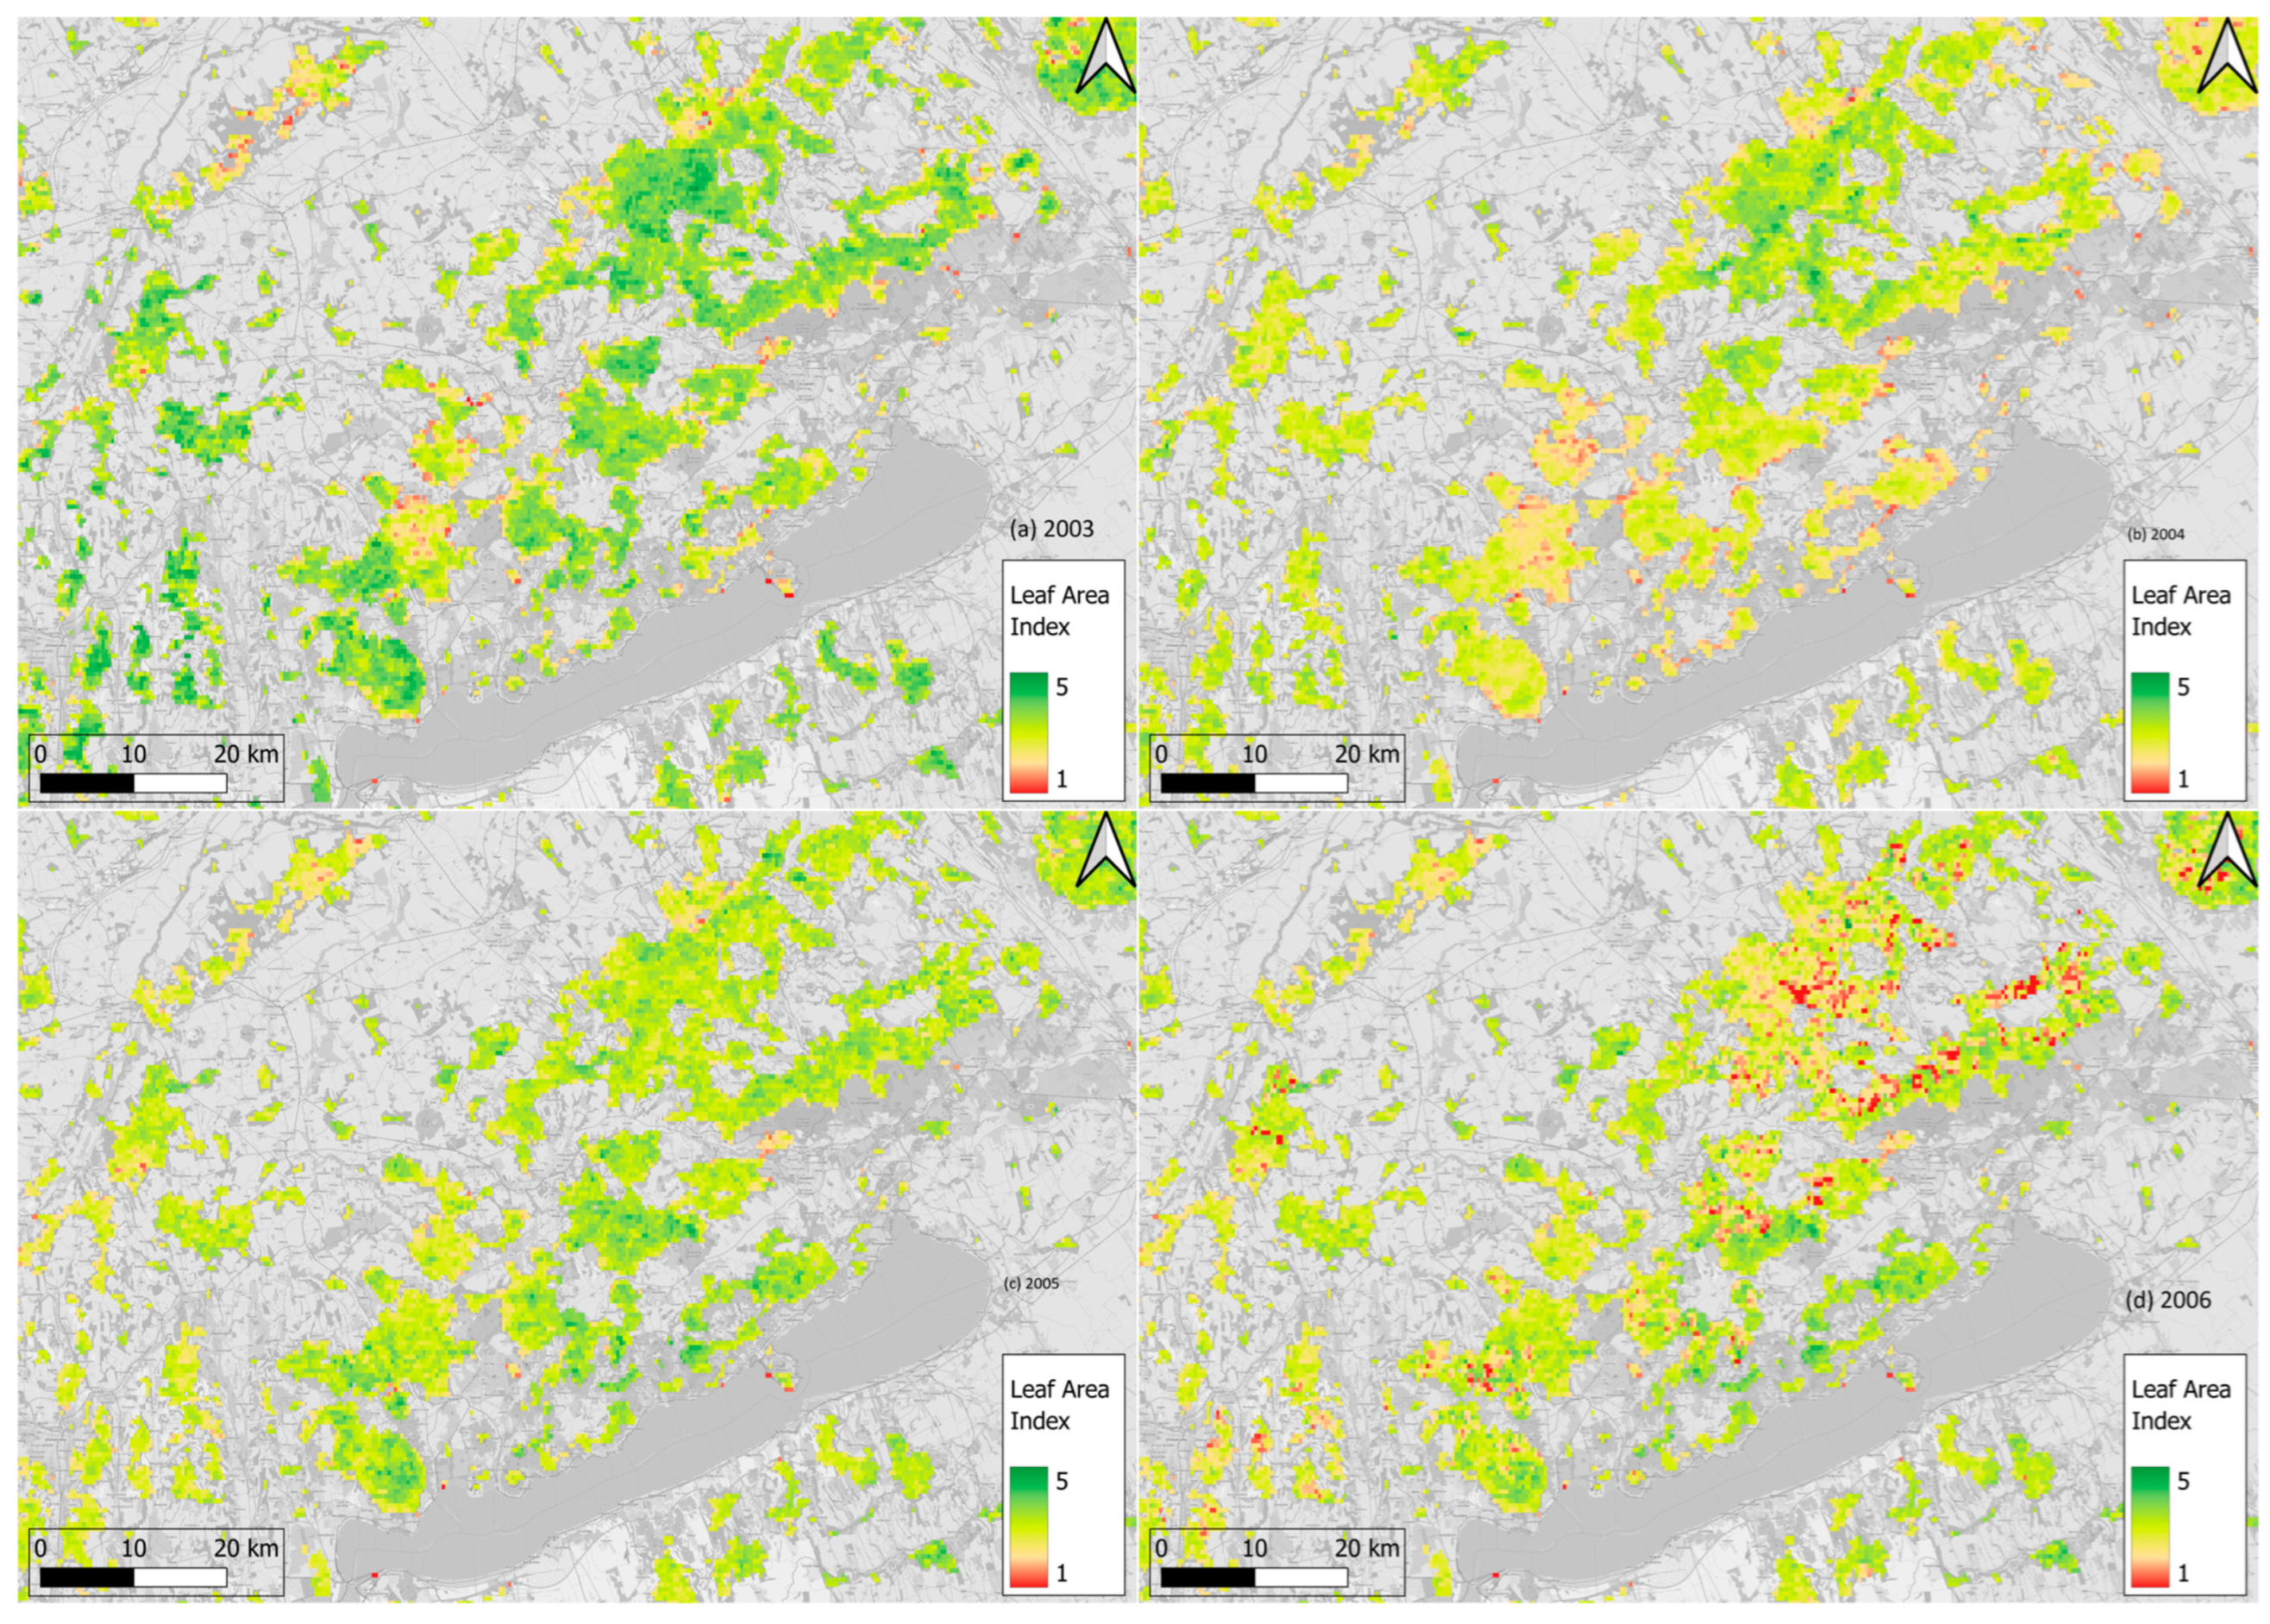
LAI maps of the Bakony Mountains (Figure 7) show an initial gradation in 2003, spreading over larger areas in 2004 and across the country in 2005, reaching a peak in 2006.
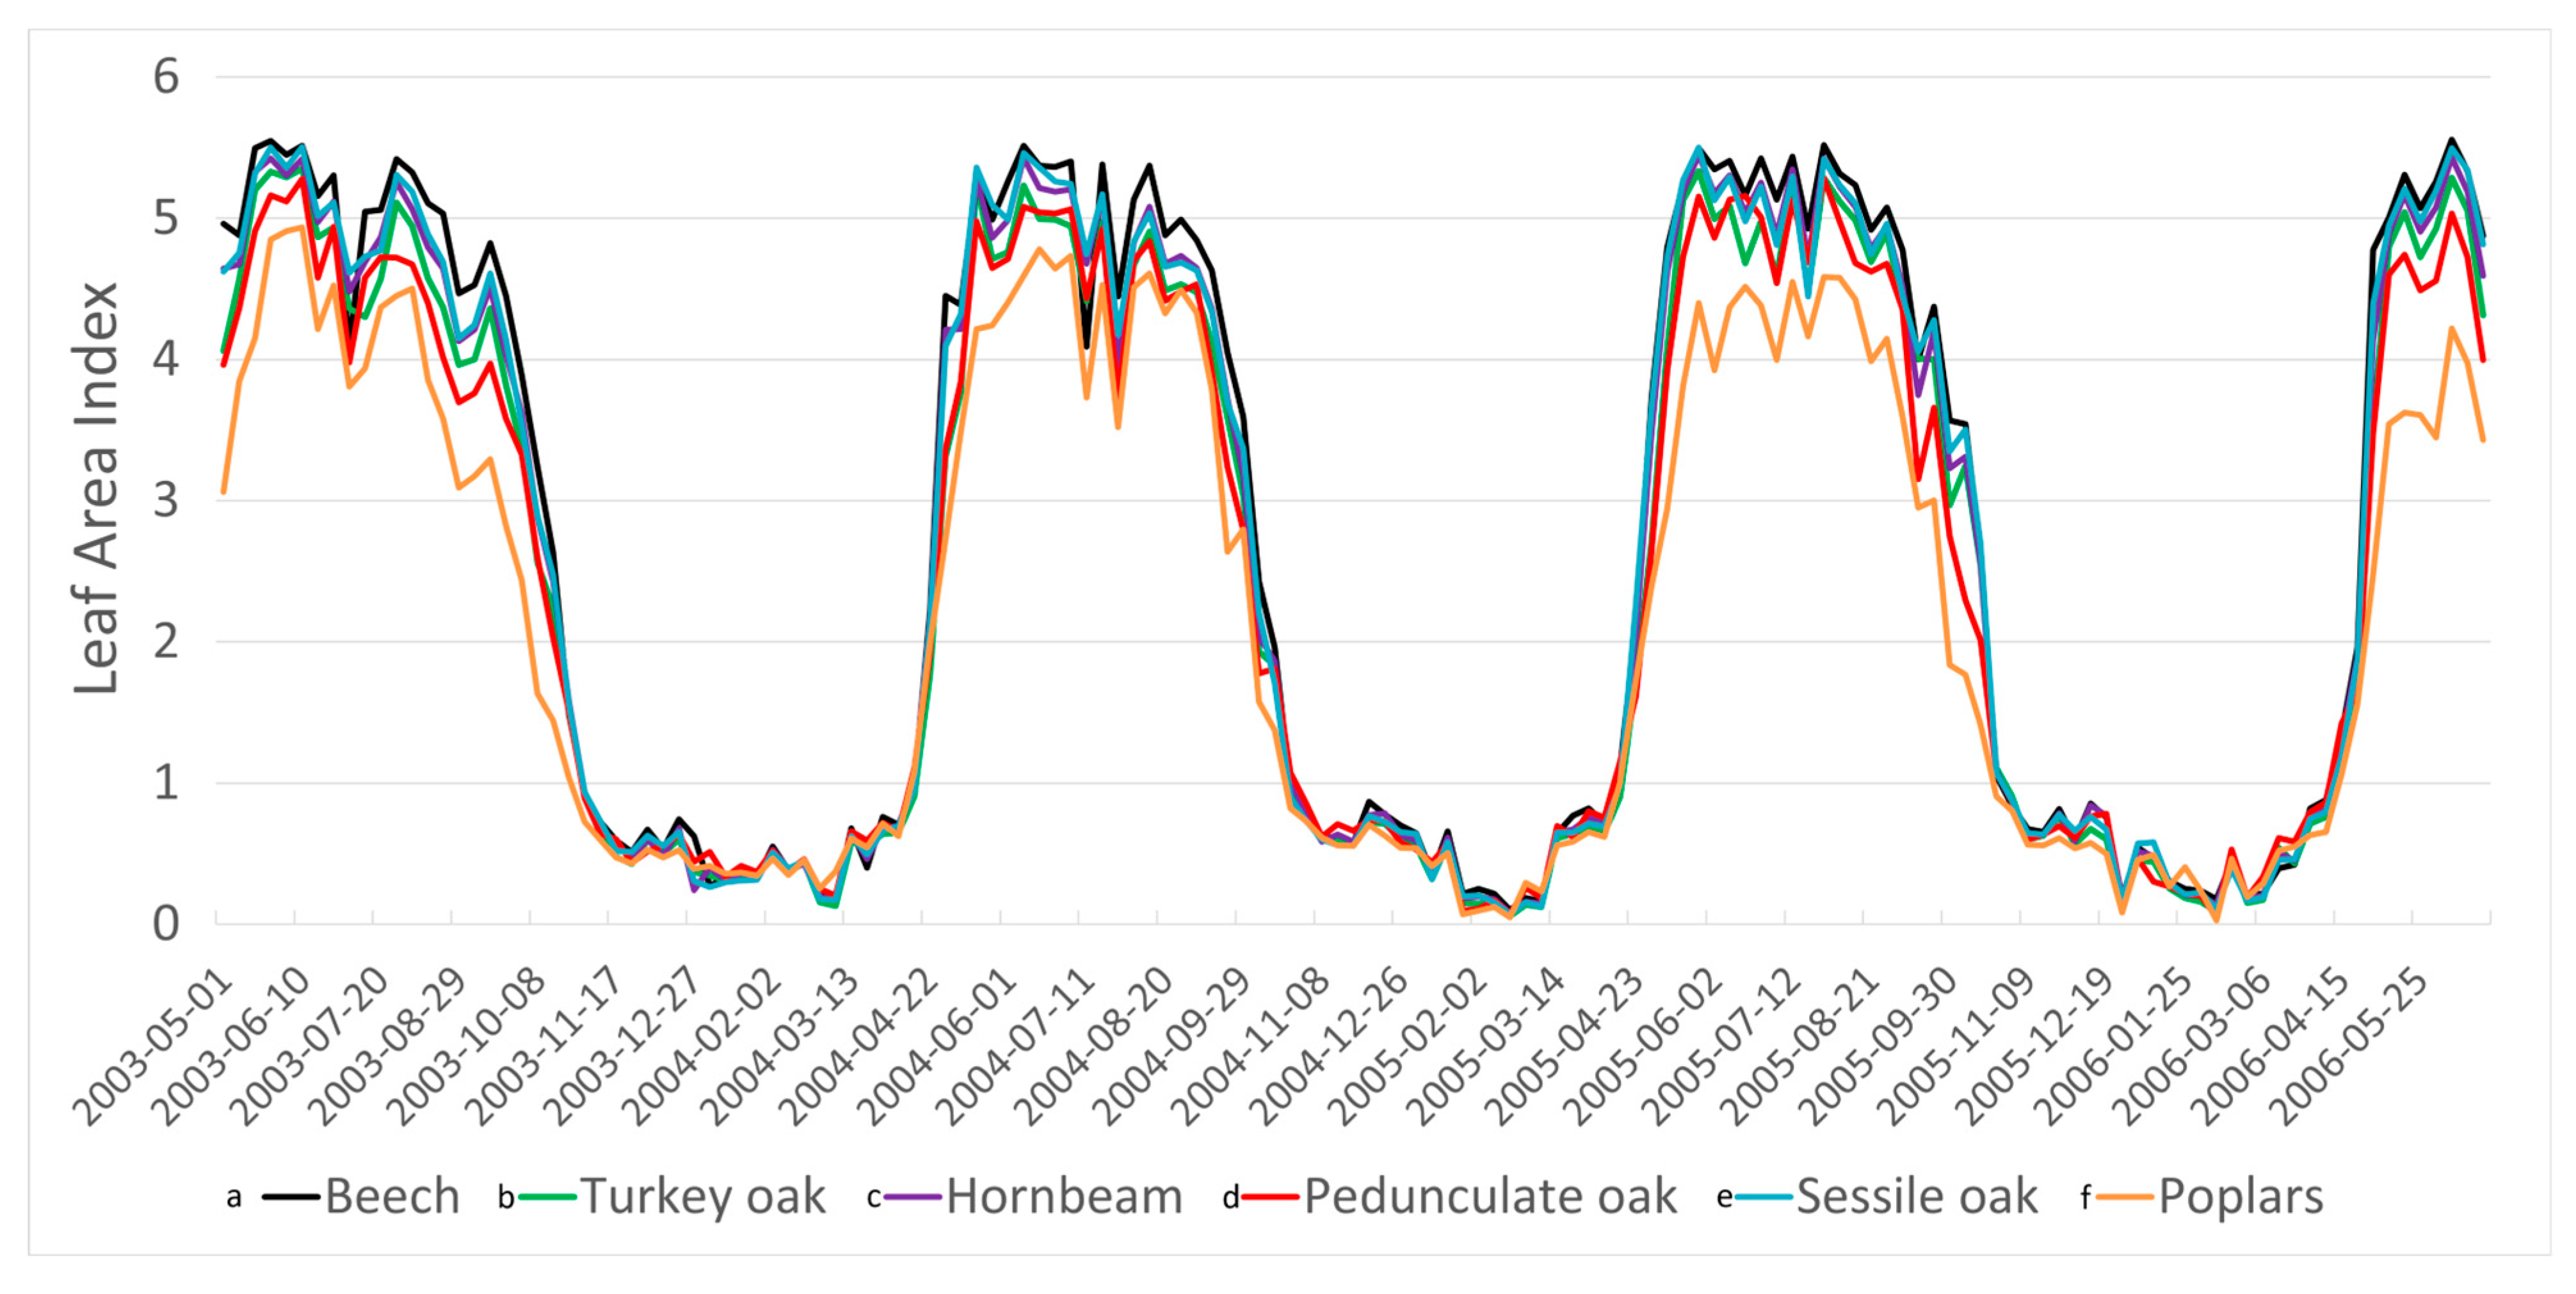
LAI charts of tree species (Figure 8) show the progression of gypsy moth gradation. In 2003, a sharp drop was noted in mid-June (–0.7), following a smaller decline in late May (–0.05). The year 2004 showed a moderate decrease in mid-May (–0.3), with a minimal change in mid-June (–0.04). In 2005, both late May and mid-June periods showed similar, severe declines (–0.3 and –0.2, respectively), while 2006 presented a drop of –0.3 in both mid-May and mid-June. These observations suggest that the outbreak of beetles affected forest health in all the years studied, before the gradation collapsed in 2007. Pedunculate oak and Turkey oak showed breaks in 2004, 2005, and 2006, while sessile oak did so in 2004 and 2005 and beech in 2004. Hornbeam suffered damage mostly in 2003, and poplars in 2005.

3.5. Validation Using Field Observations

Field observations showed no significant damage from the gypsy moth in about half of the MODIS pixels in 2005 (Table 3). The observations contained five classes: extreme, strong, moderate, weak, and negligible damage.
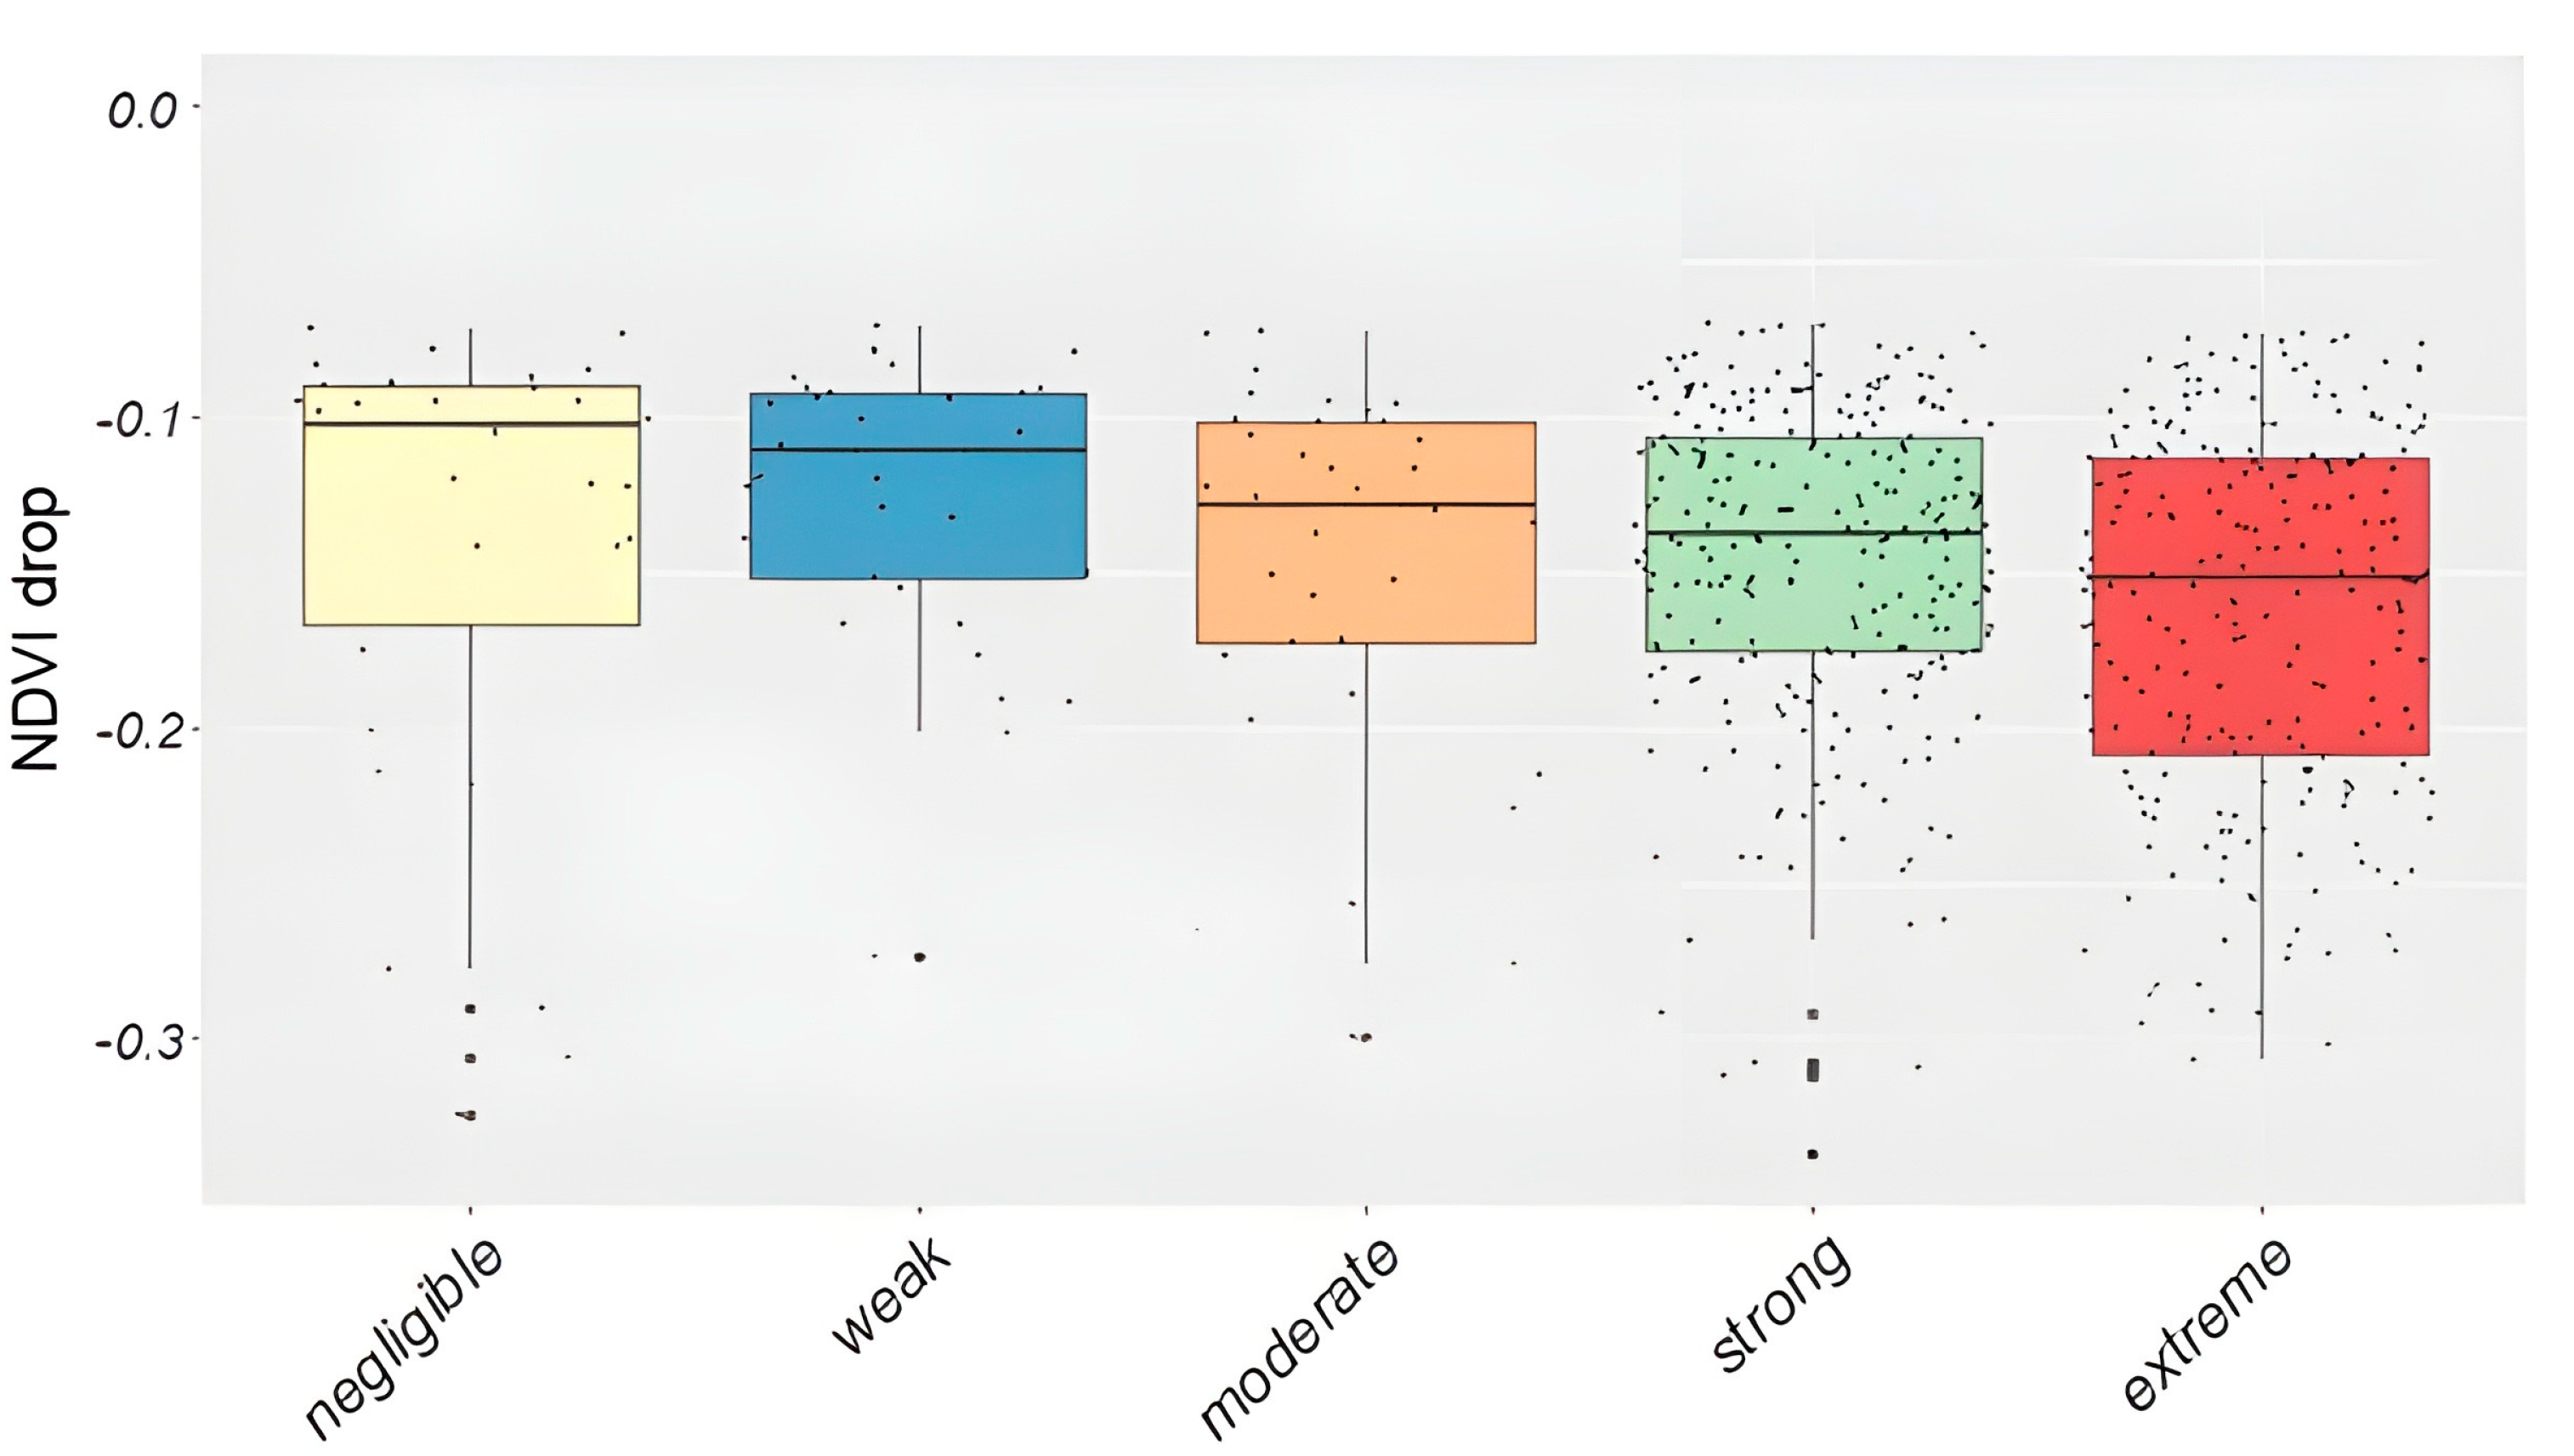
In addition to pixels with weak damage (17.1%), there was also a significant proportion of pixels showing extreme (11.8%) and strong infestation (13.1%). Altogether, 613 and 269 pixels were found to be potentially defoliated by gypsy moth, with an NDVI drop of –0.07 and –0.15, respectively. The majority of the potentially defoliated pixels fell into the extreme and strong categories of observations with higher percentage values according to the stricter threshold value of –0.15 (Table 3). The distribution of NDVI drops in the observed infestation categories showed large variations (Figure 9).
Altogether, 613 pixels were available for this analysis, most of them falling into the strong and extreme categories. As expected, the NDVI drop value became increasingly negative as the damage category became more severe. We found significant differences (p > 0.95) between the weak and the extreme and between the weak and strong infestation categories.

4. Discussion

4.1. Effectiveness of Combined Remote Sensing and Field Observations

We found that satellite imagery and field observations from light traps and the damage registration system have aligned with each other, both highlighting the gradation of gypsy moth and the severe forest damage caused by its defoliation. Although 2004 marked the peak of the gypsy moth infestation, with light trap catches reaching a dramatic high value of 21,415 individuals (Figure 1), the most severe defoliation occurred slightly later, in 2005 and 2006 (Figure 2 and Figure 3). Results from all three datasets —the light traps, NDVI, and LAI—showed strong agreement in capturing the progression of gradation (Figure 3, Figure 4, Figure 5 and Figure 6). Light trap data indicated sharp population growth in 2004 compared to 2003 (21,415 vs. 925 catches) and a substantial decline in the following years (9317 in 2005 and only 1288 in 2006), confirming 2004 as the population peak. However, defoliation was most intense after this peak: Z NDVI data showed the strongest negative anomalies and canopy stress in 2005, while LAI measurements also recorded deeper and more consistent declines during those years (Figure 7 and Figure 8). These patterns suggest that while the moth population culminated in 2004, the cumulative damage to forest vegetation, as measured by defoliation and canopy stress, reached its maximum in 2005 and 2006, just before the collapse of the gradation in 2007.
Considering the number of the detected pure pixels (at 250 m) with the most severe defoliation, the peak years were 2004 and 2005 (Figure 4, Figure 5 and Figure 6). Field observations from 2005 in the Bakony Mountains showed agreement with the NDVI drop and the number of detected pixels, as shown in Figure 9 and Table 3. Moreover, the extent and severity of defoliation events are strongly influenced by local meteorological conditions, the phenological stage of trees, and pest population dynamics. The spatial distribution of each species is also heterogeneous across the country, occurring in large continuous stands in some regions and in small, scattered patches in others, which affects the detectability of defoliation at the MODIS resolution. Consequently, both the number and spatial distribution of detected pixels vary considerably among years and regions. The presented mean onset and dates of minimum NDVI decline for different species and years (Figure 5) highlight the strong year-(weather)-dependency.
The alignment between NDVI and Z NDVI anomalies and observed field damage demonstrated agreement (Figure 1, Figure 2 and Figure 9, and Table 3), as satellite data not only detected the timing and severity of defoliation but also reflected partial recovery patterns, indicating its sensitivity to both stress and regrowth phases. De Beurs et al. [20] also highlighted the efficiency of vegetation and water indices (NDVI, Enhanced Vegetation Index, Normalised Difference Water Index, and Normalised Difference Infrared Index) in mapping defoliation by moths, as estimated from field data.
We tested if the NDVI and LAI of different tree species changed in areas affected by gypsy moth gradation. The NDVI data revealed increasing proportions of pixels with negative values during peak defoliation years (Figure 6), while LAI measurements recorded declines up to –0.3 in 2005 and 2006 (Figure 8). These patterns suggest that the outbreak broadly affected tree canopy density and leaf area, likely impacting more vulnerable species, such as pendulate oak and Turkey oak, while poplars and hornbeam were less affected at the beginning of the outbreak. This is due to the preference of the moth and also to drought, by which hornbeam stands at higher altitudes were less affected. The LAI decline was 10–15% in our case; however, in Canada, even higher (14–24%) LAI reduction was reported by Hussain et al. [38]. At the end of the gradation, in 2006, poplars were also damaged, and the initial maximum of LAI decreased from 5 to 4.
There is a strong agreement between field damage reports and satellite-derived indicators (NDVI and LAI) (Figure 9). Field reports identified 2004 as the peak year of gypsy moth gradation, consistent with the highest light trap numbers and extensive forest damage (~212,000 ha). However, satellite data (based on Z NDVI and LAI metrics) showed that the worst canopy defoliation occurred slightly later, in 2005 and 2006 (Table 2), indicating that satellite imagery captured the cumulative stress more clearly than ground-based moth population metrics alone. The reason behind this could be the regeneration of the canopy, which occurs over periods of 8–16 days, corresponding to the temporal resolution of the satellite. Both the foliage recovery and the delay between the occurrence of damage and its acquisition were mentioned by Pasquarella et al. [39].
Finally, we also investigated how light trap catch data correlates with satellite data, and it could predict the gypsy moth gradation. We found that light traps strongly agree with satellite data also in terms of identifying the peak of the gypsy moth population in 2004. However, while the highest moth catches occurred that year (21,415), the satellite indicators (NDVI and LAI) showed that maximum defoliation and canopy stress followed in 2005–2006. This suggests that light trap data is valuable for predicting the onset of a gradation, acting as an early warning, while satellite data is more effective at tracking the progression of defoliation across time and space; however, specifically, early warning satellite-based solutions can be already found [40,41,42].
Larger gradations did not take place since 2006, due to the entomopathogenic Japanese fungus Entomophaga maimaiga, which was introduced to Bulgaria and Serbia [43,44] and naturally spread to Hungary. The species has been proven to be an effective biological control agent against gypsy moth.

4.2. Limitations of the Moderate Spatial Resolution

The relatively coarse spatial resolution of the MODIS sensor poses significant challenges in detecting gypsy moth defoliation, particularly in heterogeneous forest landscapes. At this scale, individual defoliated patches may be smaller than a single pixel, leading to the underestimation or omission of affected areas (Figure 3, Figure 4, Figure 5 and Figure 6). Furthermore, mixed-pixel effects can introduce uncertainty, as a single MODIS pixel may contain a blend of healthy and defoliated vegetation, diluting the spectral signal of defoliation. This limitation is especially critical in fragmented forests, where defoliation occurs in patchy distributions rather than large, contiguous areas. However, several other studies proved that MODIS is an appropriate sensor for insect-caused forest disturbance detection in forests due to its high temporal resolution [22,23,24,45,46,47].
Our NDVI-based detection method identifies only pixels with stronger NDVI decline, corresponding to more severe defoliation, or defoliation in a larger share within the MODIS pixel. In 2004 and 2005, larger and more homogeneous forests in mountainous areas were primarily affected by gypsy moth defoliation, while in 2006 it reached smaller, patchily structured forests more, resulting in lower number of detected pixels (Figure 4 and Figure 6). This is also supported by the light trap catches (Table 1), which were 21,415, 9317, and 1288 for 2004–2006, respectively, showing a much lower value in 2006.
While the observed signal in the dataset indicates vegetation changes, it is important to recognise that gypsy moth defoliation is not the sole potential cause. Other forest pests or abiotic factors (such as drought, heatwaves, or storm damage) can also drive significant declines in vegetation indices, independent of insect outbreaks. In addition, several observational (geometry, atmospheric state, etc.) and processing effects (resampling artefacts) can also result in noise on the dataset.
However, since this study focuses on the summer period, the likelihood of extreme weather events confounding the signal is reduced. This strengthens the assumption that biotic factors, such as insect herbivory, primarily drive the observed vegetation decline.
Another important limitation to consider is the accuracy of the forestry data used in this study, particularly regarding forest cover fraction and species composition within each MODIS pixel. While these datasets provide valuable contextual information, they often originate from sources with varying levels of spatial and temporal resolution, potentially introducing uncertainties and noise (Figure 6). Forest management (e.g., thinning or harvesting) during the past 25 years can also result in false detection.
The application of high-resolution satellite imagery could be the solution. Technical advances have made it possible to use datasets such as Landsat of NASA or Sentinel-2 of the European Space Agency [48]. A recent study by Mori et al. [49] showed that combining Sentinel-2 satellite imagery with nonlinear time series modelling improved the monitoring and prediction of gypsy moth outbreaks in mountainous landscapes. Their approach analysed temporal patterns in vegetation indices derived from Sentinel-2 to detect defoliation, and they demonstrated accurate detection of gradations and enhanced the ability to predict future forest disturbance events. Sentinel-2 has also been used in Hungary for forest disturbance monitoring purposes [49]. In several European studies, the Sentinels were also utilised for both biotic and abiotic forest damage monitoring [50,51,52,53,54,55,56].
In addition to the Sentinels, the Landsat archive provides a wide range of options for forest monitoring [57,58]. The novel European Forest Disturbance Atlas [59], based on Landsat and Google Earth Engine, also indicated insect-made damage in Hungary, both in the Bakony Mountains and in the Northern Mountains, which were affected by the gypsy moth outbreaks.

5. Conclusions

Although several factors can influence vegetation state assessment by satellite datasets, the defoliation caused by gypsy moth could be successfully detected by our methods. Despite some uncertainties due to limitations in forest data accuracy and spatial resolution, the combination of satellite imagery and field data of light traps and the damage registration system was suitable for detecting gypsy moth outbreaks, highlighting the effectiveness of advanced remote sensing techniques and long-term site monitoring. For future research, the integration of high-resolution imagery (primary Sentinel-2) presents a very promising way to enhance detection and the precision of predicting insect gradations, offering improved monitoring capabilities for satellite-based forest monitoring. Later, an invasive species, the oak lace bug (Corythucha arcuata), caused significant damage in Hungarian forests [29]; thus, its monitoring is well-justified, especially since its spread is rapid across Europe [60].

Author Contributions

G.C. conceived the topic of the manuscript. T.M., A.K. and N.M. performed satellite data processing and GIS analysis. All authors edited the manuscript. G.C. and A.H. wrote the entomological and field data sections, while T.M., A.K. and N.M. wrote about remote sensing. T.M., A.K. and N.M. all performed statistical analyses. Eventually, all authors corrected and revised the manuscript. All authors have read and agreed to the published version of the manuscript.

Funding

This article was produced in the frame of the project TKP2021-NKTA-43, which has been implemented with support provided by the Ministry of Culture and Innovation of Hungary from the National Research, Development and Innovation Fund, financed under the TKP2021-NKTA funding scheme. The research was funded by the Ministry of Culture and Innovation, National Research Development and Innovation Fund, under the University Research Fellowship Programme. The research has been supported by the Hungarian National Scientific Research Fund (NKFIH FK-146600) and the TKP2021-NVA-29 project of the Hungarian National Research, Development and Innovation Fund, with support provided by the Ministry of Culture and Innovation of Hungary. This work has been implemented by the National Multidisciplinary Laboratory for Climate Change (RRF-2.3.1-21-2022-00014) project within the framework of Hungary’s National Recovery and Resilience Plan, supported by the Recovery and Resilience Facility of the European Union. The project 2024-2.1.1-EKÖP-2024-00007 was implemented with the support of the Ministry of Culture and Innovation from the National Research Development and Innovation Fund, under the funding of the EKÖP-24-4-II call for proposals. Project no. EGF/232/2024 has been implemented with the support provided by the Hungarian Ministry of Energy from the “Energy and Climate Policy Modernization System” budgetary allocation, financed by the Hungarian Ministry of Agriculture under the professional framework of “Forest Restoration, Forests in Climate Change” funding scheme.

Data Availability Statement

The datasets presented in this article are not readily available because they are the property of the Ministry of Agriculture and Bakonyerdő Forestry Private Limited Company. Requests to access the datasets should be directed to the Ministry of Agriculture.

Acknowledgments

We all thank Bakonyerdő Forestry Plc. for the field damage data of the Bakony Mountains.

Conflicts of Interest

The authors declare no conflicts of interest.

Abbreviations

The following abbreviations are used in this manuscript:
DOYDay of Year
ESAEuropean Space Agency
EVIEnhanced Vegetation Index
LAILeaf Area Index
MODISModerate Resolution Imaging Spectroradiometer
NASANational Aeronautics and Space Administration
NDIINormalised Difference Infrared Index
NDVINormalised Difference Vegetation Index
Z NDVIStandardised Difference Vegetation Index

References

  1. Johnson, D.M.; Liebhold, A.M.; Bjorsnstad, O.N. Geographical variation in periodicity of gypsy moth outbreaks. Ecography 2006, 29, 367–374. [Google Scholar] [CrossRef]
  2. Castedo-Dorado, F.; Lago-Parra, G.; Lombardero, M.J.; Otero-Traba, M.A.; Pérez-Otero, J.F. European gypsy moth (Lymantria dispar dispar L.) completes development and defoliates exotic radiata pine plantations in Spain. New Zealand J. For. Sci. 2016, 46, 18. [Google Scholar] [CrossRef]
  3. Markóné Nagy, K. A Gyapjaslepke (Lymantria dispar L.) Tömegszaporodásának Elemzése, Valamint Táplálkozásbiológiai Vizsgálatok Gyapjaslepkével és Apácalepkével (Lymantria monacha L.). Ph.D. Thesis, Roth Gyula Doctoral School of Forestry and Wildlife Management, University of West Hungary, Sopron, Hungary, 2013. Available online: http://doktori.uni-sopron.hu/id/eprint/411/19/disszertacio(12).TextMark.pdf (accessed on 14 August 2025).
  4. Csóka, G.; Hirka, A. A gyapjaslepke (Lymantria dispar L.) legutóbbi tömegszaporodása Magyarországon. Növényvédelem 2009, 45, 196–201. [Google Scholar]
  5. Hajek, A.E.; Elkinton, J.S.; Humber, R.A.; May, B.; Walsh, S.R.A.; Silver, J.C. Entomophaga maimaiga sp. nov., a fungal pathogen of gypsy moth (Lymantria dispar) in North America and Japan. J. Invertebr. Pathol. 1990, 55, 357–370. [Google Scholar]
  6. Reardon, R.C.; Hajek, A.E.; Podgwaite, J.D.; Maddox, J.V. Control of gypsy moth, Lymantria dispar (L.), with the nuclear polyhedrosis virus product Gypchek. J. Pest Sci. 1996, 46, 103–110. [Google Scholar]
  7. Rhainds, M. Mass Trapping Lepidopteran Pests with Light Traps, with Focus on Tortricid Forest Pests: What If? Insects 2024, 15, 267. [Google Scholar] [CrossRef] [PubMed]
  8. Bjerge, K.; Nielsen, J.B.; Sepstrup, M.V.; Helsing-Nielsen, F.; Høye, T.T. An Automated Light Trap to Monitor Moths (Lepidoptera) Using Computer Vision-Based Tracking and Deep Learning. Sensors 2021, 21, 343. [Google Scholar] [CrossRef]
  9. Komatsu, M.; Kurihara, K.; Saito, S.; Domae, M.; Masuya, N.; Shimura, Y.; Kajiyama, S.; Kanda, Y.; Sugizaki, K.; Ebina, K.; et al. Management of flying insects on expressways through an academic–industrial collaboration: Evaluation of the effect of light wavelengths and meteorological factors on insect attraction. Zool. Lett. 2020, 6, 15. [Google Scholar] [CrossRef]
  10. Zúbrik, M.; Kunca, A.; Kulfan, J.; Rell, S.; Nikolov, C.; Galko, J.; Vakula, J.; Gubka, A.; Leontovyč, R.; Konôpka, B.; et al. Occurrence of gypsy moth (Lymantria dispar L.) in the Slovak Republic and its outbreaks during 1945–2020. Cent. Eur. For. J. 2021, 67, 3–13. [Google Scholar] [CrossRef]
  11. Leskó, K.; Szentkirályi, F.; Kádár, F. Gyapjaslepke (Lymantria dispar L.) populációinak fluctuációs mintázatai 1963–1993 közötti időszakban Magyarországon. Erd. Kut. 1994, 84, 163–176. [Google Scholar]
  12. McManus, M.; Csóka, G. History and Impact of Gypsy Moth in North America and Comparison to the Recent Outbreaks in Europe. Acta Silv. Lignaria Hung. 2007, 3, 47–64. [Google Scholar] [CrossRef]
  13. Leskó, K.; Szentkirályi, F.; Kádár, F. Araszoló lepkefajok fluktuáció-mintázatának elemzése hosszú távú (1961–1997) magyarországi fénycsapdázási és kártételi idősorokon. Erd. Kut. 1998, 88, 319–333. [Google Scholar]
  14. Leskó, K.; Szentkirályi, F.; Kádár, F. Aranyfarú szövőlepke (Euproctis chrysorrhoea L.) magyarországi populációinak hosszútávú fluctuációs mintázatai. Erd. Kut. 1995, 85, 169–184. [Google Scholar]
  15. Leskó, K.; Szentkirályi, F.; Kádár, F. A gyűrűsszövő (Malacosoma neustria L.) hosszú távú (1962–1996) populációingadozásai Magyarországon. Erd. Kut. 1997, 86–87, 207–220. [Google Scholar]
  16. Valtonen, A.; Hirka, A.; Szőcs, L.; Ayres, M.P.; Roininen, H.; Csóka, G. Long-term species loss and homogenization of moth communities in Central-Europe. J. Anim. Ecol. 2017, 86, 730–738. [Google Scholar] [CrossRef]
  17. Zeng, L.; Wardlow, B.D.; Xiang, D.; Hu, S.; Li, D. A review of vegetation phenological metrics extraction using time-series, multispectral satellite data. Remote Sens. Environ. 2020, 237, 11511. [Google Scholar] [CrossRef]
  18. Xue, J.; Su, B. Significant Remote Sensing Vegetation Indices: A Review of Developments and Applications. J. Sens. 2017, 2017, 1353691. [Google Scholar] [CrossRef]
  19. Berra, E.F.; Gaulton, R. Remote sensing of temperate and boreal forest phenology: A review of progress, challenges and opportunities in the intercomparison of in-situ and satellite phenological metrics. For. Ecol. Manag. 2021, 480, 118663. [Google Scholar] [CrossRef]
  20. De Beurs, K.M.; Townsend, P.A. Estimating the effect of gypsy moth defoliation using MODIS. Remote Sens. Environ. 2008, 112, 3983–3990. [Google Scholar] [CrossRef]
  21. Spruce, J.P.; Sader, S.; Ryan, R.E.; Smoot, J.; Kuper, P.; Ross, K.; Prados, D.; Russell, J.; Gasser, G.; McKellip, R.; et al. Assessment of MODIS NDVI time series data products for detecting forest defoliation by gypsy moth outbreaks. Remote Sens. Environ. 2011, 115, 427–437. [Google Scholar] [CrossRef]
  22. Latifovic, L.; Arain, M.A. The impact of spongy moth (Lymantria dispar dispar) defoliation on the carbon balance of a temperate deciduous forest in North America. Agric. For. Meteorol. 2024, 354, 110076. [Google Scholar] [CrossRef]
  23. Olsson, P.-O. Monitoring Insect Defoliation in Forests with Time-Series of Satellite-Based Remote Sensing Data—Near Real-Time Methods and Impact on the Carbon Balance. Ph.D. Thesis, Department of Physical Geography and Ecosystem Science, Lund University, Lund, Sweden, 2016. [Google Scholar]
  24. Csóka, G.; Nádor, G. A gyapjaslepke kártétel monitorozása távérzékeléssel Veszprém, Somogy, és Nógrád megye területén 2005-ben. Agrofórum 2006, 17, 4–10. [Google Scholar]
  25. Somogyi, Z.; Koltay, A.; Molnár, T.; Móricz, N. Forest health monitoring system in Hungary based on MODIS products. In Az Elmélet és a Gyakorlat Találkozása a Térinformatikában IX: Theory Meets Practice in GIS; Molnár, V.E., Ed.; Debreceni Egyetem: Debrecen, Hungary, 2018; ISBN 978-963-318-723-4. [Google Scholar]
  26. Klapwijk, M.J.; Csóka, G.; Hirka, A.; Björkman, C. Forest insects and climate change: Long-term trends in herbivore damage. Ecol. Evol. 2013, 3, 4183–4196. [Google Scholar] [CrossRef]
  27. Tanács, E.; Belényesi, M.; Lehoczki, R.; Pataki, R.; Petrik, O.; Standovár, T.; Pásztor, L.; Laborczi, A.; Szatmári, G.; Molnár, Z.; et al. A national, high-resolution ecosystem basemap: Methodology, validation, and possible uses. Term. Közl. 2019, 25, 34–58. [Google Scholar] [CrossRef]
  28. NÖSZTÉP Ecosystem Map of Hungary. Available online: https://alapterkep.termeszetem.hu/ (accessed on 14 May 2025).
  29. Kern, A.; Marjanović, H.; Csóka, G.; Móricz, N.; Pernek, M.; Hirka, A.; Matošević, D.; Paulin, M.; Kovač, G. Detecting the oak lace bug infestation in oak forests using MODIS and meteorological data. Agric. For. Meteorol. 2021, 306, 108436. [Google Scholar] [CrossRef]
  30. Rouse, J.W.; Haas, R.H.; Scheel, J.A.; Deering, D.W. Monitoring Vegetation Systems in the Great Plains with ERTS. In Proceedings of the 3rd Earth Resource Technology Satellite (ERTS) Symposium, Washington, DC, USA, 10–14 December 1973; Volume 1, pp. 48–62. [Google Scholar]
  31. Justice, C.O.; Vermote, E.; Townshend, J.R.G.; Defries, R.; Roy, D.P.; Hall, D.K.; Salomonson, V.V.; Privette, J.L.; Riggs, G.; Strahler, A.; et al. The Moderate Resolution Imaging Spectroradiometer (MODIS): Land remote sensing for global change research. IEEE Trans. Geosci. Remote Sens. 1998, 36, 1228–1249. [Google Scholar] [CrossRef]
  32. Vermote, E. MODIS/Terra Surface Reflectance 8-Day L3 Global 250m SIN Grid V061. NASA EOSDIS Land Processes Distributed Active Archive Center. 2021. Available online: https://www.earthdata.nasa.gov/data/catalog/lpcloud-mod09q1-061 (accessed on 1 February 2025).
  33. LP DAAC (Land Processes Distributed Active Archive Center). MOD09A1, Collection 6.1. NASA EOSDIS Land Processes DAAC, USGS Earth Resources Observation and Science (EROS) Center, Sioux Falls, South Dakota. Available online: https://lpdaac.usgs.gov (accessed on 1 February 2025).
  34. Myneni, R.; Knyazikhin, Y.; Park, T. MODIS/Terra+Aqua Leaf Area Index/FPAR 8-Day L4 Global 500 m SIN Grid V061. NASA EOSDIS Land Processes Distributed Active Archive Center. 2021. Available online: https://www.earthdata.nasa.gov/data/catalog/lpcloud-mcd15a2h-061 (accessed on 11 May 2025).
  35. Chen, J.; Jönsson, P.; Tamura, M.; Gu, Z.; Matsushita, B.; Eklundh, L. A simple method for reconstructing a high-quality NDVI time-series data set based on the Savitzky–Golay filter. Remote Sens. Environ. 2004, 91, 332–344. [Google Scholar] [CrossRef]
  36. Peters, A.J.; Walter-Shea, E.A.; Viña, A.; Hayes, M.; Svoboda, M.D. Drought Monitoring with NDVI-Based Standardized Vegetation Index. Photogramm. Eng. Remote Sens. 2002, 68, 72–75. [Google Scholar]
  37. Gorelick, N.; Hancher, M.; Dixon, M.; Ilyushchenko, S.; Thau, D.; Moore, R. Google Earth Engine: Planetary-Scale Geospatial Analysis for Everyone. Remote Sens. Environ. 2017, 202, 18–27. [Google Scholar] [CrossRef]
  38. Hussain, N.; Gonsamo, A.; Wang, S.; Peng, Y.; Chhetri, S.G.; Chen, J.M.; Arain, M.A. Assessment of spongy moth infestation impacts on forest productivity and carbon loss using the Sentinel-2 satellite remote sensing and eddy covariance flux data. Ecol. Process. 2024, 13, 37. [Google Scholar] [CrossRef]
  39. Pasquarella, V.J.; Bradley, B.A.; Woodcock, C.E.; Pontius, J.A. Three decades of gypsy moth defoliation mapped using Landsat time series data. Remote Sens. Ecol. Conserv. 2021, 7, 293–305. [Google Scholar] [CrossRef]
  40. Wittich, D.; Rottensteiner, F.; Voelsen, M.; Heipke, C.; Müller, S. Deep Learning for the Detection of Early Signs for Forest Damage Based on Satellite Imagery. ISPRS Ann. Photogramm. Remote Sens. Spatial Inf. Sci. 2022, V-2-2022, 307–315. [Google Scholar] [CrossRef]
  41. Kirsch, M.; Wernicke, J.; Datta, P.; Preisach, C. Early Detection of Forest Calamities in Homogeneous Stands—Deep Learning Applied to Bark-Beetle Outbreaks. arXiv 2025, arXiv:2503.12883. [Google Scholar]
  42. Singh, H.; Ang, L.M.; Srivastava, S. Active Wildfire Detection via Satellite Imagery and Machine Learning: An Empirical Investigation of Australian Wildfires. Nat. Hazards 2025, 121, 9777–9800. [Google Scholar] [CrossRef]
  43. Pilarska, D.; McManus, M.; Pilarski, P.; Georgiev, G.; Mirchev, P.; Linde, A. Monitoring the establishment and prevalence of the fungal entomopathogen Entomophaga maimaiga in two Lymantria dispar populations in Bulgaria. J. Pest Sci. 2006, 79, 63–67. [Google Scholar] [CrossRef]
  44. Georgiev, G.; Mirchev, P.; Georgieva, M.; Kechev, M.; Belilov, S.; Matova, M.; Petrova, V.; Mateva, P.; Kirilova, M.; Mutafchiiski, I. Biological control of gypsy moth (Lymantria dispar) by the entomopathogenic fungus Entomophaga maimaiga in Bulgaria in 2021. Silva Balc. 2021, 22, 17–27. [Google Scholar] [CrossRef]
  45. Eklundh, L.; Johansson, T.; Solberg, S. Mapping insect defoliation in Scots pine with MODIS time-series data. Remote Sens. Environ. 2009, 113, 1566–1573. [Google Scholar] [CrossRef]
  46. Spruce, J.P.; Hicke, J.A.; Hargrove, W.W.; Grulke, N.E.; Meddens, A.J.H. Use of MODIS NDVI products to map tree mortality levels in forests affected by mountain pine beetle outbreaks. Forests 2019, 10, 811. [Google Scholar] [CrossRef]
  47. Olsson, P.-O.; Kantola, T.; Lyytikäinen-Saarenmaa, P.; Jönsson, A.M.; Eklundh, L. Development of a method for monitoring of insect induced forest defoliation—Limitation of MODIS data in Fennoscandian forest landscapes. Silva Fenn. 2016, 50, 1495. [Google Scholar] [CrossRef]
  48. European Space Agency (ESA). Sentinel-2 Mission Guide. Available online: https://www.esa.int/Applications/Observing_the_Earth/Copernicus/Sentinel-2 (accessed on 27 March 2025).
  49. Mori, N.; Kawatsu, K.; Noriyuki, S.; Kosilov, A.; Martemyanov, V.; Yamashita, M.; Inoue, M.N. Monitoring and prediction of the spongy moth (Lymantria dispar) outbreaks in mountain landscapes using a combination of Sentinel-2 images and nonlinear time series model. For. Ecol. Manag. 2024, 563, 121975. [Google Scholar] [CrossRef]
  50. Molnár, T.; Király, G. Forest Disturbance Monitoring Using Cloud-Based Sentinel-2 Satellite Imagery and Machine Learning. J. Imaging 2024, 10, 14. [Google Scholar] [CrossRef]
  51. Dalponte, M.; Solano-Correa, Y.T.; Frizzera, L.; Gianelle, D. Mapping a European Spruce Bark Beetle Outbreak Using Sentinel-2 Remote Sensing Data. Remote Sens. 2022, 14, 3135. [Google Scholar] [CrossRef]
  52. Senf, C.; Pflugmacher, D.; Wulder, M.A.; Hostert, P. Harmonizing Landsat and Sentinel-2 Time Series for Large-Area Disturbance Mapping. Remote Sens. Environ. 2021, 264, 112571. [Google Scholar] [CrossRef]
  53. Immitzer, M.; Atzberger, C.; Koukal, T. Early Detection of Bark Beetle Infestation in Norway Spruce (Picea abies) Forests Using Sentinel-2 Time Series. Remote Sens. 2021, 13, 3652. [Google Scholar] [CrossRef]
  54. Näsi, R.; Honkavaara, E.; Lyytikäinen-Saarenmaa, P.; Blomqvist, M.; Litkey, P.; Hakala, T.; Viljanen, N.; Kantola, T.; Tanhuanpää, T.; Holopainen, M. Remote Sensing of Forest Health Using Airborne Hyperspectral and Sentinel-2 Data. Remote Sens. 2018, 10, 470. [Google Scholar] [CrossRef]
  55. Schiller, C.; Költzow, J.; Schwarz, S.; Schiefer, F.; Fassnacht, F.E. Forest Disturbance Detection in Central Europe Using Transformers and Sentinel-2 Time Series. Remote Sens. Environ. 2024, 315, 114475. [Google Scholar]
  56. Assmann, J.J.; Pedersen, P.B.M.; Moeslund, J.E.; Senf, C.; Treier, U.A.; Corcoran, D.; Koma, Z.; Nord-Larsen, T.; Normand, S. Temperate forests of high conservation value are successfully identified by satellite and LiDAR data fusion. Conserv. Sci. Pract. 2025, 7, e13302. [Google Scholar] [CrossRef]
  57. Choi, W.-I.; Kim, E.-S.; Yun, S.-J.; Lim, J.-H.; Kim, Y.-E. Quantification of One-Year Gypsy Moth Defoliation Extent in Wonju, Korea, Using Landsat Satellite Images. Forests 2021, 12, 545. [Google Scholar] [CrossRef]
  58. Bernal, I.; Sánchez-Martínez, L.J.; Zambrano-Martínez, S.; Viejo, J.L. Application of Remote Sensing to the Quantification of Defoliation Caused by Lymantria dispar in “Los Alcornocales” Natural Park (Cádiz, Spain). SHILAP Rev. Lepidopterol. 2023, 51, 419–425. [Google Scholar]
  59. Viana-Soto, A.; Senf, C. The European Forest Disturbance Atlas: A forest disturbance monitoring system using the Landsat archive. Earth Syst. Sci. Data 2025, 17, 2373–2404. [Google Scholar] [CrossRef]
  60. Ciceu, A.; Bălăcenoiu, F.; de Groot, M.; Chakraborty, D.; Avtzis, D.N.; Barta, M.; Blaser, S.; Bracalini, M.; Castagneyrol, B.; Chernova, U.A.; et al. The ongoing range expansion of the invasive oak lace bug across Europe: Current occurrence and potential distribution under climate change. Sci. Total Environ. 2024, 949, 174950. [Google Scholar] [CrossRef] [PubMed]
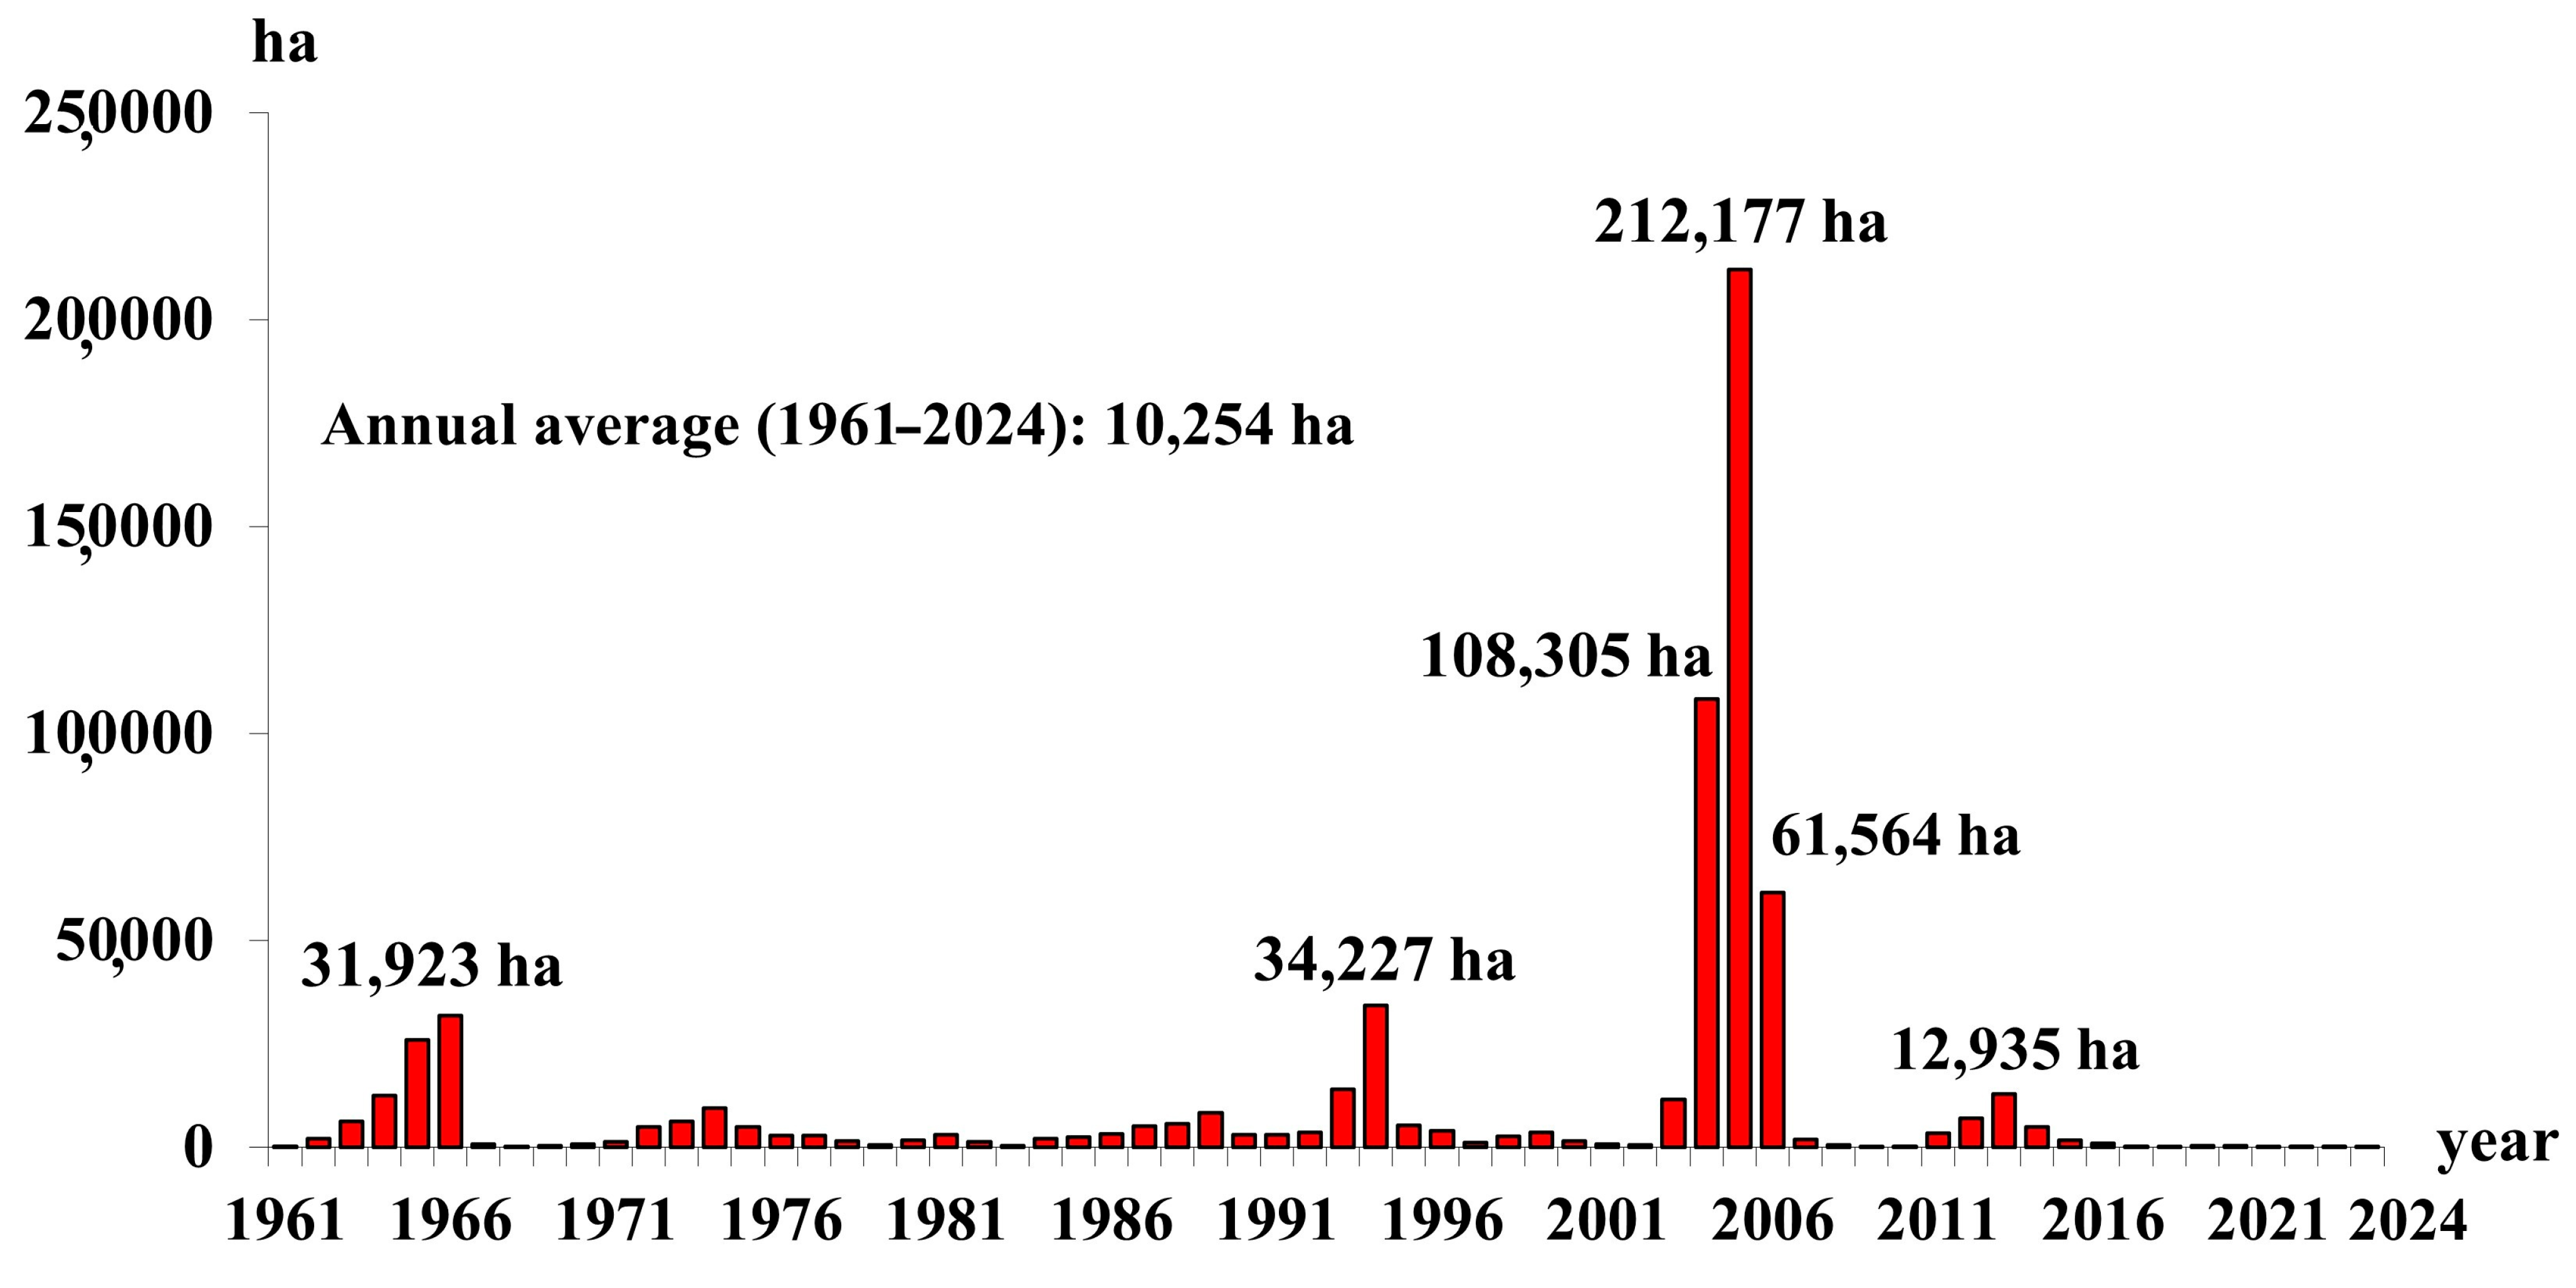
Figure 1. Detected defoliation area [ha] caused by gypsy moth in Hungary between 1961 and 2024. Source: Hungarian Forest Damage Reporting System.
Forests 16 01472 g001
Figure 2. Aggregated annual damage area by gypsy moth in Hungary in 2003 (a), 2004 (b), 2005 (c), and 2006 (d), given in hectares. The most severely damaged forestry units are marked in red according to the moth-induced damage, while the moderate ones are orange and the slightly damaged ones are green. The direction of infestation is also visible by this marking, from SW to NE. Source: Hungarian Forest Damage Reporting System.
Forests 16 01472 g002
Figure 3. Map of the calculated MODIS NDVI decline in Hungary during the period 2003–2006 (ad), showing the detected forests with gypsy moth infestation in red. Forested pixels without detected infestations are indicated by the same green colour.
Forests 16 01472 g003
Figure 4. Species-specific mean NDVI curves for all pixels (solid lines) and for detected defoliated pixels (NDVI drop below −0.15; dashed lines) during the period 2003–2006 in Hungary for (a) European beech, (b) pedunculate oak, (c) Turkey oak, (d) sessile oak, (e) common hornbeam, and (f) poplar-dominated stands. The number of detected and total possible pixels is indicated.
Forests 16 01472 g004
Figure 5. Species-specific yearly mean NDVI drop (a), mean NDVI minimum (b), mean onset of the decline (c), and mean date of the minimum NDVI (d) of detected defoliated MODIS pixels (at 250 m) with at least 0.15 NDVI decline during the period 2003–2006.
Forests 16 01472 g005
Figure 6. Species-specific yearly numbers of detected defoliated MODIS pixels (at 250 m) with at least 0.15 NDVI decline during the period 2000–2024.
Forests 16 01472 g006
Figure 7. LAI maps of the Bakony Mountains in 2003 (a), 2004 (b), 2005 (c), and 2006 (d). Defoliation of forests was visible every year, although in varying extents and severities.
Forests 16 01472 g007
Figure 8. LAI charts of pedunculate oak (a), sessile oak (b), turkey oak (c), beech (d), hornbeam (e), and poplars (f), showing the gradation of gypsy moth with breaks in the curve.
Forests 16 01472 g008
Figure 9. The distribution of NDVI drop values of potentially infested pixels according to the observed categories (negligible, weak, moderate, strong, and extreme). The black lines are the medians, the upper and lower hinges represent the first and the third quartiles (the 25th and 75th percentiles), and the whiskers extend from the hinge to the largest and smallest value that is no more than 1.5 times the interquartile range from the top (bottom) of the box; the large black circles denote the outlying values and the small black circles are the data points.
Forests 16 01472 g009
Table 1. Number of gypsy moths caught by light traps in Hungary during the period 2003–2006.
PlotLatitudeLongitude2003200420052006
Acsád47.3216.72449614326
Bakonybél47.2517.76162392920835
Bugac46.6619.68579257
Diósjenő47.9519.0224269460204
Egyházaskesző47.4217.3227814,62347120
Erdősmecske46.2118.53119939258
Felsőtárkány47.9820.4349361220821
Gyula46.7021.324717517680
Hőgyész46.4818.40337744338
Kapuvár47.6917.0115206737
Kishuta48.4521.464516827
Püspökladány47.3421.09530324846
Répáshuta48.0720.56815354056
Sasrét46.2017.903515829529
Sopron47.6616.5515363419
Sumony45.9517.9150332288138
Szalafő46.8616.3827963212
Szentendre47.6919.0 41971
Szentpéterfölde46.6116.751910210537
Tolna46.4218.8044324024
Vámosatya48.1922.40 223333
Várgesztes47.4718.409022735130
Total 92521,41593171288
Table 2. Health classes derived from Z NDVI for the years 2003–2006. The table shows the percentage of each health class and each period of the year.
DateClass2003200420052006
14 Aprilsevere damage0.220.136.781.28
damage29.948.1722.8921.65
neutral state67.0968.3452.8260.70
regeneration2.7022.4216.2715.88
strong regeneration0.050.931.230.49
30 Aprilsevere damage3.5010.856.789.71
damage23.1934.2422.8967.87
neutral state37.7635.0152.826.09
regeneration32.1818.0216.2714.97
strong regeneration3.371.881.231.36
16 Maysevere damage10.254.666.274.95
damage14.7114.4318.0414.35
neutral state26.3841.9036.683.41
regeneration39.1535.8836.7860.72
strong regeneration9.503.132.2416.56
31 Maysevere damage3.867.245.014.67
damage12.2917.1411.158.34
neutral state33.7537.1732.3425.42
regeneration46.9435.5347.5648.10
strong regeneration3.162.923.9313.47
16 Junesevere damage3.844.696.683.92
damage11.289.168.0113.76
neutral state31.7231.9726.4341.30
regeneration47.8246.5052.4836.77
strong regeneration5.337.686.404.25
2 Julysevere damage5.424.657.272.58
damage15.867.348.047.89
neutral state40.4131.1025.2827.98
regeneration36.6150.0750.2054.00
strong regeneration1.706.839.217.54
18 Julysevere damage6.719.443.190.15
damage17.0423.954.816.54
neutral state36.2440.3215.3732.03
regeneration35.9724.3350.5160.63
strong regeneration4.041.9626.120.65
3 Augustsevere damage4.982.853.177.68
damage15.918.949.3626.86
neutral state37.8331.3426.8859.06
regeneration38.5149.2247.560.39
strong regeneration2.787.6613.036.02
Table 3. Field observation categories of infestation in 2005 and the number (percentage) of potentially defoliated pixels by the gypsy moth.
ObservationOBS Pixel No.MODIS Defoliated Pixels
(Limit: −0.07)
MODIS Defoliated Pixels
(Limit: −0.15)
extreme674242 (39.5%)125 (46.5%)
strong742270 (44%)112 (41.6%)
moderate38637 (6%)14 (5.2%)
weak97134 (5.5%)10 (3.7%)
negligible289930 (4.9%)8 (3%)
Disclaimer/Publisher’s Note: The statements, opinions and data contained in all publications are solely those of the individual author(s) and contributor(s) and not of MDPI and/or the editor(s). MDPI and/or the editor(s) disclaim responsibility for any injury to people or property resulting from any ideas, methods, instructions or products referred to in the content.