Article

An Integrated GIS–MILP Framework for Cost-Optimal Forest Biomass-to-Bioenergy Supply Chains: A Case Study in Queensland, Australia

by
Sam Van Holsbeeck
1,
Mauricio Acuna
2 and
Sättar Ezzati
3,*
1
Forest Research Institute, University of the Sunshine Coast, 90 Sippy Downs Drive, Sippy Downs, QLD 4556, Australia
2
Production Systems Unit, Natural Resources Institute (Luke), Yliopistokatu 6B, 80100 Joensuu, Finland
3
Department of Forest Resource Management, Gorgān University of Agricultural Sciences and Natural Resources, Gorgan P.O. Box 49189-43464, Iran
*
Author to whom correspondence should be addressed.
Forests 2025, 16(9), 1467; https://doi.org/10.3390/f16091467
Submission received: 1 August 2025 / Revised: 14 September 2025 / Accepted: 14 September 2025 / Published: 15 September 2025
(This article belongs to the Special Issue Forest-Based Biomass for Bioenergy)

Abstract

Renewable energy expansion requires cost-effective strategies to integrate underutilized biomass resources into energy systems. In Australia, forest residues represent a significant but largely untapped feedstock that could contribute to a more diversified energy portfolio. This study presents an integrated geospatial and optimization decision-support model designed to minimize the total cost of forest biomass-to-bioenergy supply chains through optimal facility selection and network design. The model combined geographic information systems with mixed-integer linear programming to identify the optimal candidate facility sites based on spatial constraints, biomass availability and infrastructure proximity. These inputs then informed an optimization framework that determined the number, size, and geographical distribution of bioenergy plants. The model was applied to a case study in Queensland, Australia, evaluating two strategic scenarios: (i) a biomass-driven approach that maximizes the use of forest residues; (ii) an energydriven approach that aligns facilities with regional energy consumption patterns. Results indicated that increasing the minimum facility size reduced overall costs by capitalizing on economies of scale. Biomass collection accounted for 81%–83% of total supply chain costs (excluding capital installation), emphasizing the need for logistically efficient sourcing strategies. Furthermore, the system exhibited high sensitivity to transportation distance and biomass availability; energy demands exceeding 400 MW resulted in sharply escalating transport expenses. This study provides a scalable, data-driven framework for the strategic planning of forest-based bioenergy systems. It offers actionable insights for policymakers and industry stakeholders to support the development of robust, cost-effective, and sustainable bioenergy supply chains in Australia and other regions with similar biomass resources.

1. Introduction

Forest biomass is increasingly recognized as a promising renewable energy resource with the potential to support global decarbonization efforts and the transition toward carbon-neutral energy systems. Unlike fossil fuels, forest biomass combustion resulted in significantly lower net carbon emission, estimated as 5%–10% of those comparable fossil energy sources, particularly when managed within sustainable cycles that account for regrowth and carbon reabsorption [1]. Beyond its direct contribution to reducing greenhouse gas emissions, this favorable carbon profile, combined with its inherent renewability and widespread availability, positions forest biomass as a key component of future renewable energy portfolios. This is especially true in rural and decentralized energy contexts, in which it offers a reliable and scalable alternative [2]. Furthermore, in regions with abundant forest resources, bioenergy development can, as a powerful economic catalyst, create employment opportunities, boost local incomes, and foster innovation in green technologies.
In Australia, despite considerable biomass availability, bioenergy contributes only about 4% of the nation’s total energy production [3]. Forest-derived biomass accounts for approximately 25% of this bioenergy output, with sugarcane residues (bagasse) contributing another 29% [3,4]. Each year, around 1% of Australia’s forested area is harvested for commercial wood products [5], generating significant volumes of residual biomass that remain largely underutilized. This material represents a promising feedstock for bioenergy that could diversify revenue streams for forest operators and reduce reliance on fossil fuels [6]. However, the development of a viable forest biomass energy sector requires overcoming substantial logistical and economic challenges, particularly those related to supply chain configuration and resource dispersion.
The geographic expanse of Australia further complicates the efficient use of forest biomass. Transporting biomass over long distances is costly and energy-intensive due to its low energy density, often undermining the economic and environmental benefits of its use [7,8,9,10]. Regional bioenergy systems that leverage local biomass resources and existing infrastructure offer a promising alternative [11,12], reducing transport needs while supporting local energy resilience. Nevertheless, designing such systems requires careful consideration of biomass availability, spatial distribution, seasonal variability, and infrastructure constraints. Life Cycle Assessment (LCA) studies have highlighted the importance of supply chain efficiency in determining the net environmental benefits of bioenergy systems. Transportation, in particular, is a major contributor to both the cost and carbon footprint of forest biomass energy [13,14]. Moreover, the vulnerability of biomass supply to seasonal fluctuations, climatic shocks, and market dynamics necessitates supply chain designs that are not only cost-effective but also resilient [15]. Despite these challenges, existing research has yet to fully integrate spatial resource assessment, economic optimization, and environmental considerations into a unified decision-support framework for bioenergy planning.
Geographic Information Systems (GIS) have been widely used to support bioenergy facility siting and supply chain analysis by enabling the integration and analysis of diverse spatial datasets [16,17,18,19,20,21,22]. Such tools facilitate the assessment of biomass availability, transport networks, and land-use constraints, providing critical inputs for strategic planning. Previous studies have applied multi-criteria decision analysis [16,18], service-area modeling [8], and location–allocation techniques [18] to identify suitable sites for bioenergy facilities. Others have combined GIS with optimization models to minimize transportation costs [13,23] or evaluate greenhouse gas emissions [14,24]. For example, Delivand et al. [13] used GIS to minimize transport distances and estimate emissions, while Zhang et al. [24] developed a two-stage decision-support system combining GIS with simulation for biofuel facility selection. However, many of these approaches treat facility siting and supply chain design as sequential rather than integrated processes. Few studies simultaneously address the optimal number, size, and location of bioenergy facilities while also designing the corresponding supply network under real-world constraints. There is also limited research on the sensitivity of supply chain costs and emissions to variables such as transport distance, facility capacity, and biomass availability, especially in the context of Australia’s unique geographic and economic conditions.
This study aims to address these research gaps by developing an integrated modeling framework that combines GIS-based resource assessment with mixed-integer linear programming (MILP) for the optimal design of forest biomass-to-bioenergy supply chains. The model seeks to minimize total supply chain costs while accounting for spatial resource distribution, infrastructure limitations, and economies of scale in facility sizing. A key contribution is the explicit consideration of supply chain resilience through sensitivity analysis, evaluating system performance under scenarios of biomass supply Updashock and variable energy demand. The framework is applied to a case study in Queensland, Australia, a region with abundant but underutilized forest biomass resources and no existing large-scale bioenergy facilities [3]. By situating the study in a real-world context with clear economic and environmental stakes, this research provides practical insights for policymakers and industry stakeholders aiming to promote sustainable bioenergy development. The outcomes offer a transferable methodology for enhancing the feasibility, sustainability, and resilience of forest-based bioenergy systems in Australia and beyond.

2. Materials and Methods

This study employed an integrated, multi-stage methodology (Figure 1) to optimize the strategic design of forest biomass-to-bioenergy supply chains. The framework synergistically combines geospatial analysis and mathematical optimization to address both the geographic feasibility and economic viability of bioenergy facility deployment. The initial phase utilized GIS to identify and pre-select strategically viable candidate locations for facilities based on spatial constraints and resource availability, as described in Van Holsbeeck & Srivastava [25]. The subsequent phase formulated a MILP model to determine the optimal number and capacity of facilities from the candidate set, minimizing total supply chain costs. This two-stage approach ensures solutions are grounded in real-world geographical realities while achieving economic efficiency.

2.1. Case Study Description

The developed optimization model was applied to the state of Queensland, Australia, to assess the strategic deployment of a forest biomass-to-bioenergy network. Queensland, with its extensive forest resources encompassing 51 million ha [5], presents a compelling case for investigating this potential. Within this area, approximately 20 million ha of state-owned native forest are commercially available for timber harvesting, alongside 1 million ha of private native forest and 216,000 hectares of established plantations [26,27] (Figure 2). The total volume of timber processed in Queensland during the financial year 2018–2019 reached 2,892,000 m3 [28]. Government estimates suggest a substantial annual availability of forest harvest residues (600,000 m3) and sawmill residues (950,000 m3) [29], representing a significant untapped feedstock for bioenergy. Notably, a densified fuel pellet production facility with a capacity of 125,000 dry metric tons (DMTs) per year is operational in southeast Queensland [30]; however, the majority of its output is currently exported, thus not directly contributing to Australia’s renewable energy targets.

2.2. Preceding GIS Analysis

The optimization phase was preceded by a GIS analysis to identify geographically feasible candidate locations for bioenergy facilities, as a result reducing the computational complexity of the model. This pre-selection analysis was based on the spatial availability of forest biomass resources and site suitability criteria. Adapted from the methodology of Van Holsbeeck & Srivastava [25], this analysis integrated multiple spatial criteria: (i) biomass availability, analyzed using the Local Index of Spatial Autocorrelation (LISA) to identify significant clusters of high resource density; (ii) proximity to existing road networks to ensure logistical feasibility for biomass transportation; (iii) land-use suitability (e.g., distance from protected areas, zoning regulations). The integration of these criteria generated a set of strategically pre-selected candidate sites (Figure 2), representing areas with both high biomass potential and feasible development conditions and were used as the potential demand points in the optimization model.

2.3. Data Collection

2.3.1. Network Construction

For the model analysis, a detailed spatial dataset was constructed that integrates supply, demand, and transport infrastructure. The network consisted of 128 potential bioenergy facility locations (J), 80,920 forest biomass supply points (I), and the Queensland road network [31]. Pairwise connections between all supply and demand nodes yielded 10,357,760 potential links, for which the shortest road distances (km) were calculated.
The spatially explicit quantity of available forest biomass at each of the 80,920 supply points (Qi) was derived from the availability study utilizing the database described in Van Holsbeeck & Srivastava [25]. Biomass availability was expressed in terms of potential energy content (MW) by applying a biomass-to-energy conversion factor as described in Van Holsbeeck & Srivastava [25]. This assessment estimated a total annual potential of 732 MW of forest biomass energy available across Queensland.

2.3.2. Cost Parametrization

Comprehensive cost factors associated with the biomass supply chain were included into the model as shown in Table 1. These included the following: stumpage fee, harvesting, forwarding costs, and roadside chipping, reflecting conventional operational practices. A fixed cost was applied to estimate truck transportation cost, covering salaries, maintenance, depreciation, insurance, registration, profit, and overhead. The variable cost was based on an average fuel price and accounted for round trips (loaded and unloaded) of biomass chips with a 40% moisture content [32], transported using B-double trucks configured for maximum chip capacity based on Australian regulations [33].
Energy consumption for harvesting was defined as a weighted average for soft- and hardwood forests in Queensland. The unit monetary cost for energy consumption during biomass supply is 0.005 AUD MJ−1, considering an energy content of wet biomass (20% MC) around 36 GJ DMT−1 carbon [34,35]. The greenhouse gas (GHG) emitted through transportation activities was calculated as a weighted average of emissions associated with the transport of biomass from native forests and plantations in Queensland [36,37]. The emissions associated with the harvest and forwarding of biomass were calculated as a weighted average of emissions associated with harvest in softwood and hardwood forests in Queensland [37].
Table 1. Summary of cost, energy and emission factors.
Model InputNotationValueRationale/Source
Unit stumpage cost of biomass, assumed constant for different harvesting areascs10 AUD DMT−1(Personal communication)
Percentage storage interest rate of biomasscm7% p.a.Represents interest on delayed payment [38]
Unit collection of biomass in native forest (harvesting, chipping, forwarding) assumed constant for different harvesting areas c n h 69.23 AUD DMT−1[32]—Appendix A
Unit collection cost of biomass in plantation forest (harvesting, chipping, forwarding), assumed constant for different harvesting areas c p h 38.37AUD DMT−1[32]—Appendix A
Fixed transport costcf6.02 AUD DMT−1[32]—Appendix A
Variable transport costcv0.118 AUD DMT−1−km[32]—Appendix A
Capacity-dependent installation cost of a facility j with capacity fck3,000,000 AUD MW−1[39,40,41]
Maximum transportation distance (km)Dmax105 kmEconomic break-even calculation (Equation (7)) [32,42]
Unit energy consumption costα0.005 AUD MJ−1[34,35]
Energy demand harvesting/forwardingeh204.66 MJ DMT−1[43]
Energy demand transportet2.38 MJ DMT−km[44]
Unit environmental cost of CO2 emissionsβ0.04 AUD kg−1Represents a carbon tax scenario [45]
GHG emissions harvesting/forwardinggh39.66 kg CO2-eq DMT−1Calculated average for QLD [36,37]
GHG emissions transportgt0.37 kg CO2-eq DMT−kmCalculated average for QLD [37]

2.4. Optimization Model Formulation

2.4.1. Objective and Scope

The objective of the optimization model is to determine the number, capacity, and distribution of bioenergy facilities required to minimize the total cost of a forest biomass-to-bioenergy supply chain. The model operates on a set of candidate sites pre-identified through GIS analysis, but the results are reported in terms of aggregate facility siting and sizing outcomes rather than exact geographic locations.
The scope of the model is limited to the strategic planning level, providing insights into cost trade-offs, facility sizing, and biomass allocation patterns under alternative supply and demand scenarios, without prescribing site-specific development decisions.

2.4.2. Mathematical Structure

The optimization problem was formulated as a multi-facility location-allocation problem and solved using the IBM® Decision Optimization CPLEX® with the DOcplex.MP library for Python 3.12.10. The objective is to minimize the total annualized cost of the supply chain network, including biomass collection, transport, and facility installation.
The model considers a set of i forest biomass supply nodes, which are further categorized into n potential native forest harvesting sites and p potential plantation forest harvesting sites. A set of j potential strategic facility locations can be established, each with a potential demand defined by a set of f discrete capacity levels, which can be satisfied by procuring biomass from any of the available forest biomass supply sites, subject to defined constraints.
Sets and indices:
  • I: set of forest biomass supply nodes, indexed by i;
  • NI: set of native forest origins, indexed by n;
  • PI: set of plantation forest origins, indexed by p;
  • J: set of potential facility locations, indexed by j;
  • F: set of discrete facility capacity levels, indexed by f.
Parameters:
  • C: Total cost of the network, a sum of stumpage, collection, storage and transportation, and opening a facility [AUD];
  • Qi: Availability of biomass at harvesting area i [DMT yr−1];
  • Dij: binary indicator = 1, if dij ≤ Dmax; 0 otherwise;
  • dij: Distance from harvesting area i to bioenergy facility j [km];
  • Dmax: Maximum transportation distance [km];
  • cs: Stumpage cost [AUD DMT−1];
  • c n h , c p h : Collection costs in native and plantation forests [AUD DMT−1];
  • cm: Percentage storage interest rate of biomass [%];
  • cf: Fixed transport cost [AUD DMT−1];
  • cv: Variable transport cost [AUD DMT−km];
  • ck: Facility installation cost of a facility j with capacity f [AUD MW−1];
  • Bjf: Capacity of facility f, if any, built at location j [MW];
  • θ: Biomass-to-capacity conversion factor [DMT yr−1 MW−1];
  • E: Total energy capacity target [MW].
The decision variables can be determined as follows:
  • Yij: Biomass transported from node i to facility j [DMT yr−1];
  • Xjf: Binary, =1 if facility j is built with capacity f, 0 otherwise.
The mathematical model formulation is represented by the following MILP model:
    M i n   C = i = 1 I j = 1 J c s Y i j + i = 1 I j = 1 J c n h + c p h Y i j                             + i = 1 I j = 1 J c m c n h + c p h Y i j           + i = 1 I j = 1 J c f + c v d i j Y i j + j = 1 J f c k B j f X j f
subject to
j J Y i j D i j = Q i                                 [ DMT   yr 1 ]                     i I
i I Y i j D i j θ B j f X j f                   [ DMT   yr 1 ]                   j J
j J f F B j f ( X j f ) = E               [ MW ]           i I , f F
f F X j f 1                                                                                                           j J
  e x c Y i j 0 ,   X j f { 0,1 }
The objective of the optimization model, as expressed in Equation (1), is a comprehensive summation of the costs incurred across all stages, including: the stumpage fees for harvesting biomass at the source (first term); the costs associated with the collection and handling of biomass at the harvesting sites (second term); the expenses related to the intermediate storage of biomass before transportation (third term); the costs of transporting the biomass from the harvesting areas to the bioenergy facilities (fourth term); and the capital investment costs for the installation of the bioenergy facilities themselves (fifth term).

2.4.3. Constraints

Constraint (2) ensures the physical feasibility of biomass supply by limiting the total biomass delivered from each harvesting area to not exceed its maximum sustainable availability within the defined maximum transportation distance. Constraint (3) ensures that each facility receiving a selected capacity level is supplied with sufficient biomass to support its operation, linking biomass flows from supply nodes to the facility’s capacity requirement. Constraint (4) requires that the total installed capacity across all facilities meets the predefined regional energy demand, consequently driving the model to deploy enough bioenergy generation capacity to satisfy the target. Constraint (5) prevents more than one facility from being established at the same candidate location, regardless of capacity level. Constraints (6) impose non-negativity on biomass flows and binary conditions on facility siting and sizing decisions.

2.5. Scenario Design

Two strategic scenarios (Table 2) were developed to evaluate alternative drivers of facility siting and sizing in the forest biomass-to-bioenergy supply chain:
(1)
Supply-Push (Biomass supply-driven) Scenario: In this scenario, the objective was to minimize system cost while maximizing the utilization of available forest biomass. The model considered all pre-identified candidate sites and installed the minimum number of facilities required to process the biomass supply, subject to lower and upper bounds on facility capacity and a maximum transport distance. Here, the installed capacity emerged as a proxy for the total bioenergy potential of the forest resource, rather than being constrained by external demand.
(2)
Demand-Pull (Energy demand-driven) Scenario: In this scenario, the model was cost-minimizing but constrained to meet a predefined regional energy demand [24,46]. Facilities were again restricted by minimum/maximum capacity and maximum transport distance. However, unlike the supply-push case, the total installed capacity was defined by an exogenous demand parameter representing the target energy requirement of the study area, not by the biomass resource base (Equation (4)).

2.6. Technological Assumptions

The model is built upon several key assumptions regarding biomass supply, facility operation, and model structure.
  • Incremental demand scaling: The model was run with increasing total bioenergy demand in 50 MW increments until the model returned an infeasible solution to analyze system behavior such supply chain scalability, identification of capacity constraints, and evaluation of economic trade-offs across different operational scales.
  • Biomass storage losses: Decay during storage was considered negligible for the timeframe relevant to this strategic analysis and was therefore not explicitly modeled.
  • Constant Biomass Supply: Seasonal variation in biomass availability was assumed to be negligible. This reflects the subtropical conditions of Queensland, where year-round harvesting operations of both native forests and plantations ensures a consistent biomass flow.
  • Exclusion of Facility Operational Costs: The objective function focuses on strategic, capital-intensive decisions, namely facility installation and the collection-and-transport network. Recurring operational costs (e.g., labor, maintenance, consumables) were excluded. While this simplifies the Total Economic Analysis (TEA), it is a valid approach for strategic planning. The main implication is that the model identifies the lowest-capital solution; a full TEA including operational expenditures would be essential for a final investment decision.
  • Linear Programming Formulation: MILP was used instead of non-linear programming to ensure computational tractability for a large-scale problem, guarantee convergence to a global optimum, and enhance model reproducibility and solution speed [1,2].
  • Emissions as an Output Metric, not a Constraint: GHG emissions from transportation and facility operations were calculated retrospectively from the optimized supply chain configurations. They were not integrated as a direct constraint or objective. This approach prioritizes cost minimization as a baseline, while enabling a clear post-analysis of cost–emission trade-offs. Future work may extend the model to multi-objective formulations that explicitly integrate climate objectives.

2.7. Sensitivity Analysis

Given the inherent uncertainties associated with key parameters of the biomass supply chain network, particularly the maximum economically viable transport distance and the total biomass availability, a sensitivity analysis was conducted. These parameters can influence strategic decisions on the optimal locations, number, and size of bioenergy facilities. The analysis was performed on the supply-push (biomass-driven) scenario of the optimization model. In this scenario, a constraint restricted biomass transport to a one-way distance not exceeding 105 km, representing the estimated economic break-even point. This value was derived by balancing the delivered cost of biomass against its market gate price, using the following linear relationship (Equation (7)):
D m a x = g a t e   p r i c e c h c s c f c v
where:
  • Gate price: 79 AUD DMT−1;
  • cs: Stumpage cost is assumed 0 AUD DMT−1 for this calculation;
  • c h : Harvesting/forwarding cost [AUD DMT−1] (Table 1);
  • c f : fixed transport [AUD DMT−1] (Table 1);
  • c v : Variable transport cost [AUD DMT−1−km] (Table 1).
This yielded a baseline value of 105 km for the maximum transport distance. The sensitivity analysis then explored the effect of relaxing and tightening this constraint to evaluate how the feasible service area influenced supply chain costs and facility deployment (Table 3).
In addition, the analysis assessed the impact of reductions in total biomass availability relative to the baseline estimate. This tested the robustness of the optimized network to resource uncertainty, providing insight into how resource scarcity could alter the cost-effectiveness and resilience of the system (Table 3).

3. Results

The economic viability of the forest biomass-to-bioenergy supply chain was evaluated by analyzing the total and average costs, along with a detailed breakdown encompassing collection, transportation, energy consumption during supply, emissions from supply activities, and facility installation.

3.1. Supply-Push Scenario (Biomass-Driven)

To understand the influence of facility scale, the minimum facility capacity in the biomass-driven scenario (with a maximum transport distance of 105 km) was incrementally increased from 5 MW to the point of infeasibility, with a fixed maximum capacity of 100 MW. The quantitative results are summarized in Table 4.
When the minimum facility capacity was set at 5 MW, the network achieved the highest total installed capacity of 472 MW, equivalent to 64% utilization of the estimated 732 MW biomass energy potential. This configuration required 34 small facilities across the region, averaging 14 MW each. Smaller minimum capacities reduced competition for biomass among candidate sites, allowing a denser network of plants.
As the minimum capacity requirement increased, the number of facilities and the total installed capacity declined, while the average capacity per facility rose. For example, at a minimum of 30 MW, only two facilities were installed (average size 42 MW), utilizing just 84 MW (11%) of the available biomass. Increasing the minimum further to 35 MW resulted in a single facility, indicating that larger-scale plants could not be consistently supported by localized biomass availability within the transport limit.
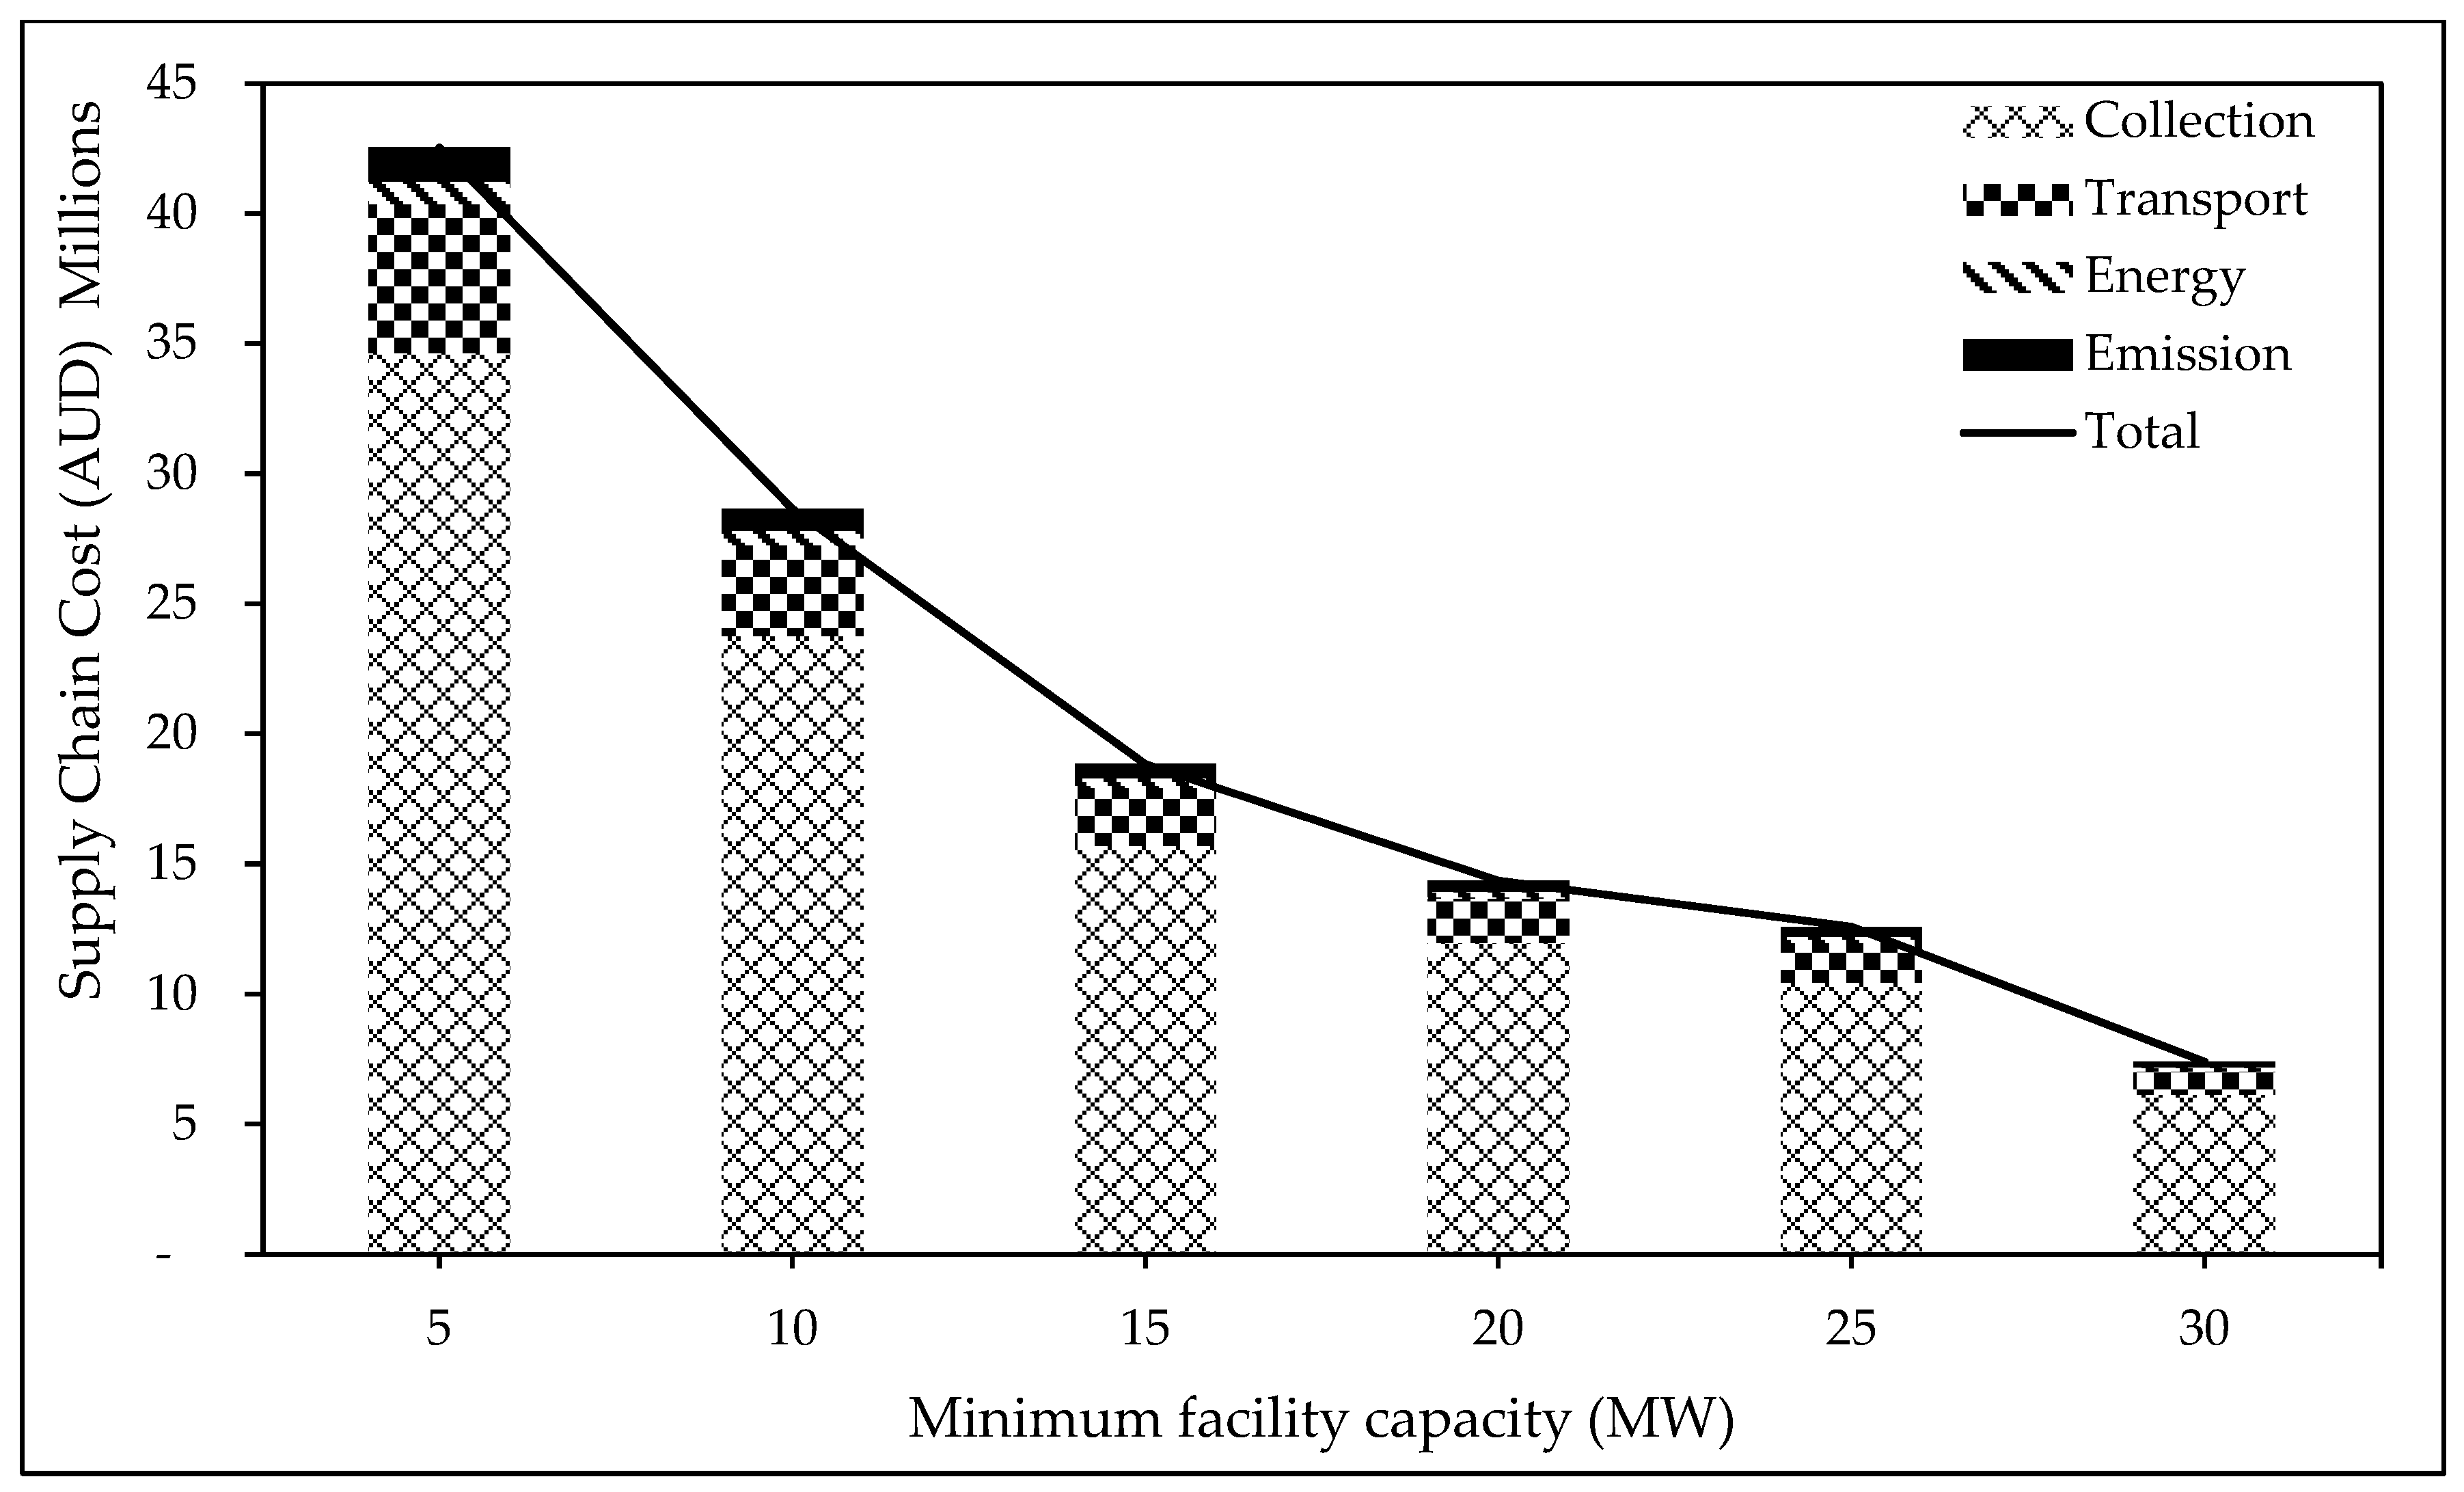
Figure 3 presents the breakdown of costs (excluding installation, which typically accounts for ~97% of total costs). Collection dominated the cost structure (81%–83%), while transport contributed ~12%. Although larger facilities required somewhat longer average transport distances to secure sufficient feedstock, the overall share of transport remained stable due to the decreasing number of facilities and the lower total capacity deployed. Energy consumption during harvesting and forwarding (~2%) and supply chain emissions (~3%) declined modestly as minimum facility size increased.

3.2. Demand-Pull Scenario (Energy-Driven)

Table 5 summarizes the optimal facility network under increasing total energy demand targets. The system was able to support up to 500 MW of installed capacity, equivalent to 68% of the estimated biomass energy potential, before becoming infeasible under the 105 km maximum transport constraint. At this demand level, the network required 41 facilities but could not expand further without exceeding the transport limit or competing for overlapping biomass supplies.
At lower total demand levels (50–100 MW), the model favored deploying multiple facilities (average size 5–10 MW) rather than fewer, larger ones, reflecting the localized availability of feedstock. As total demand increased, the average facility size rose gradually, peaking at 16 MW when total demand reached 400 MW (25 facilities). Beyond this point, higher demand was met by adding more facilities rather than larger ones, and at 500 MW, the average size dropped to 12 MW. This indicates that larger plants could not be consistently supported across the network once resource competition within the distance limit intensified.
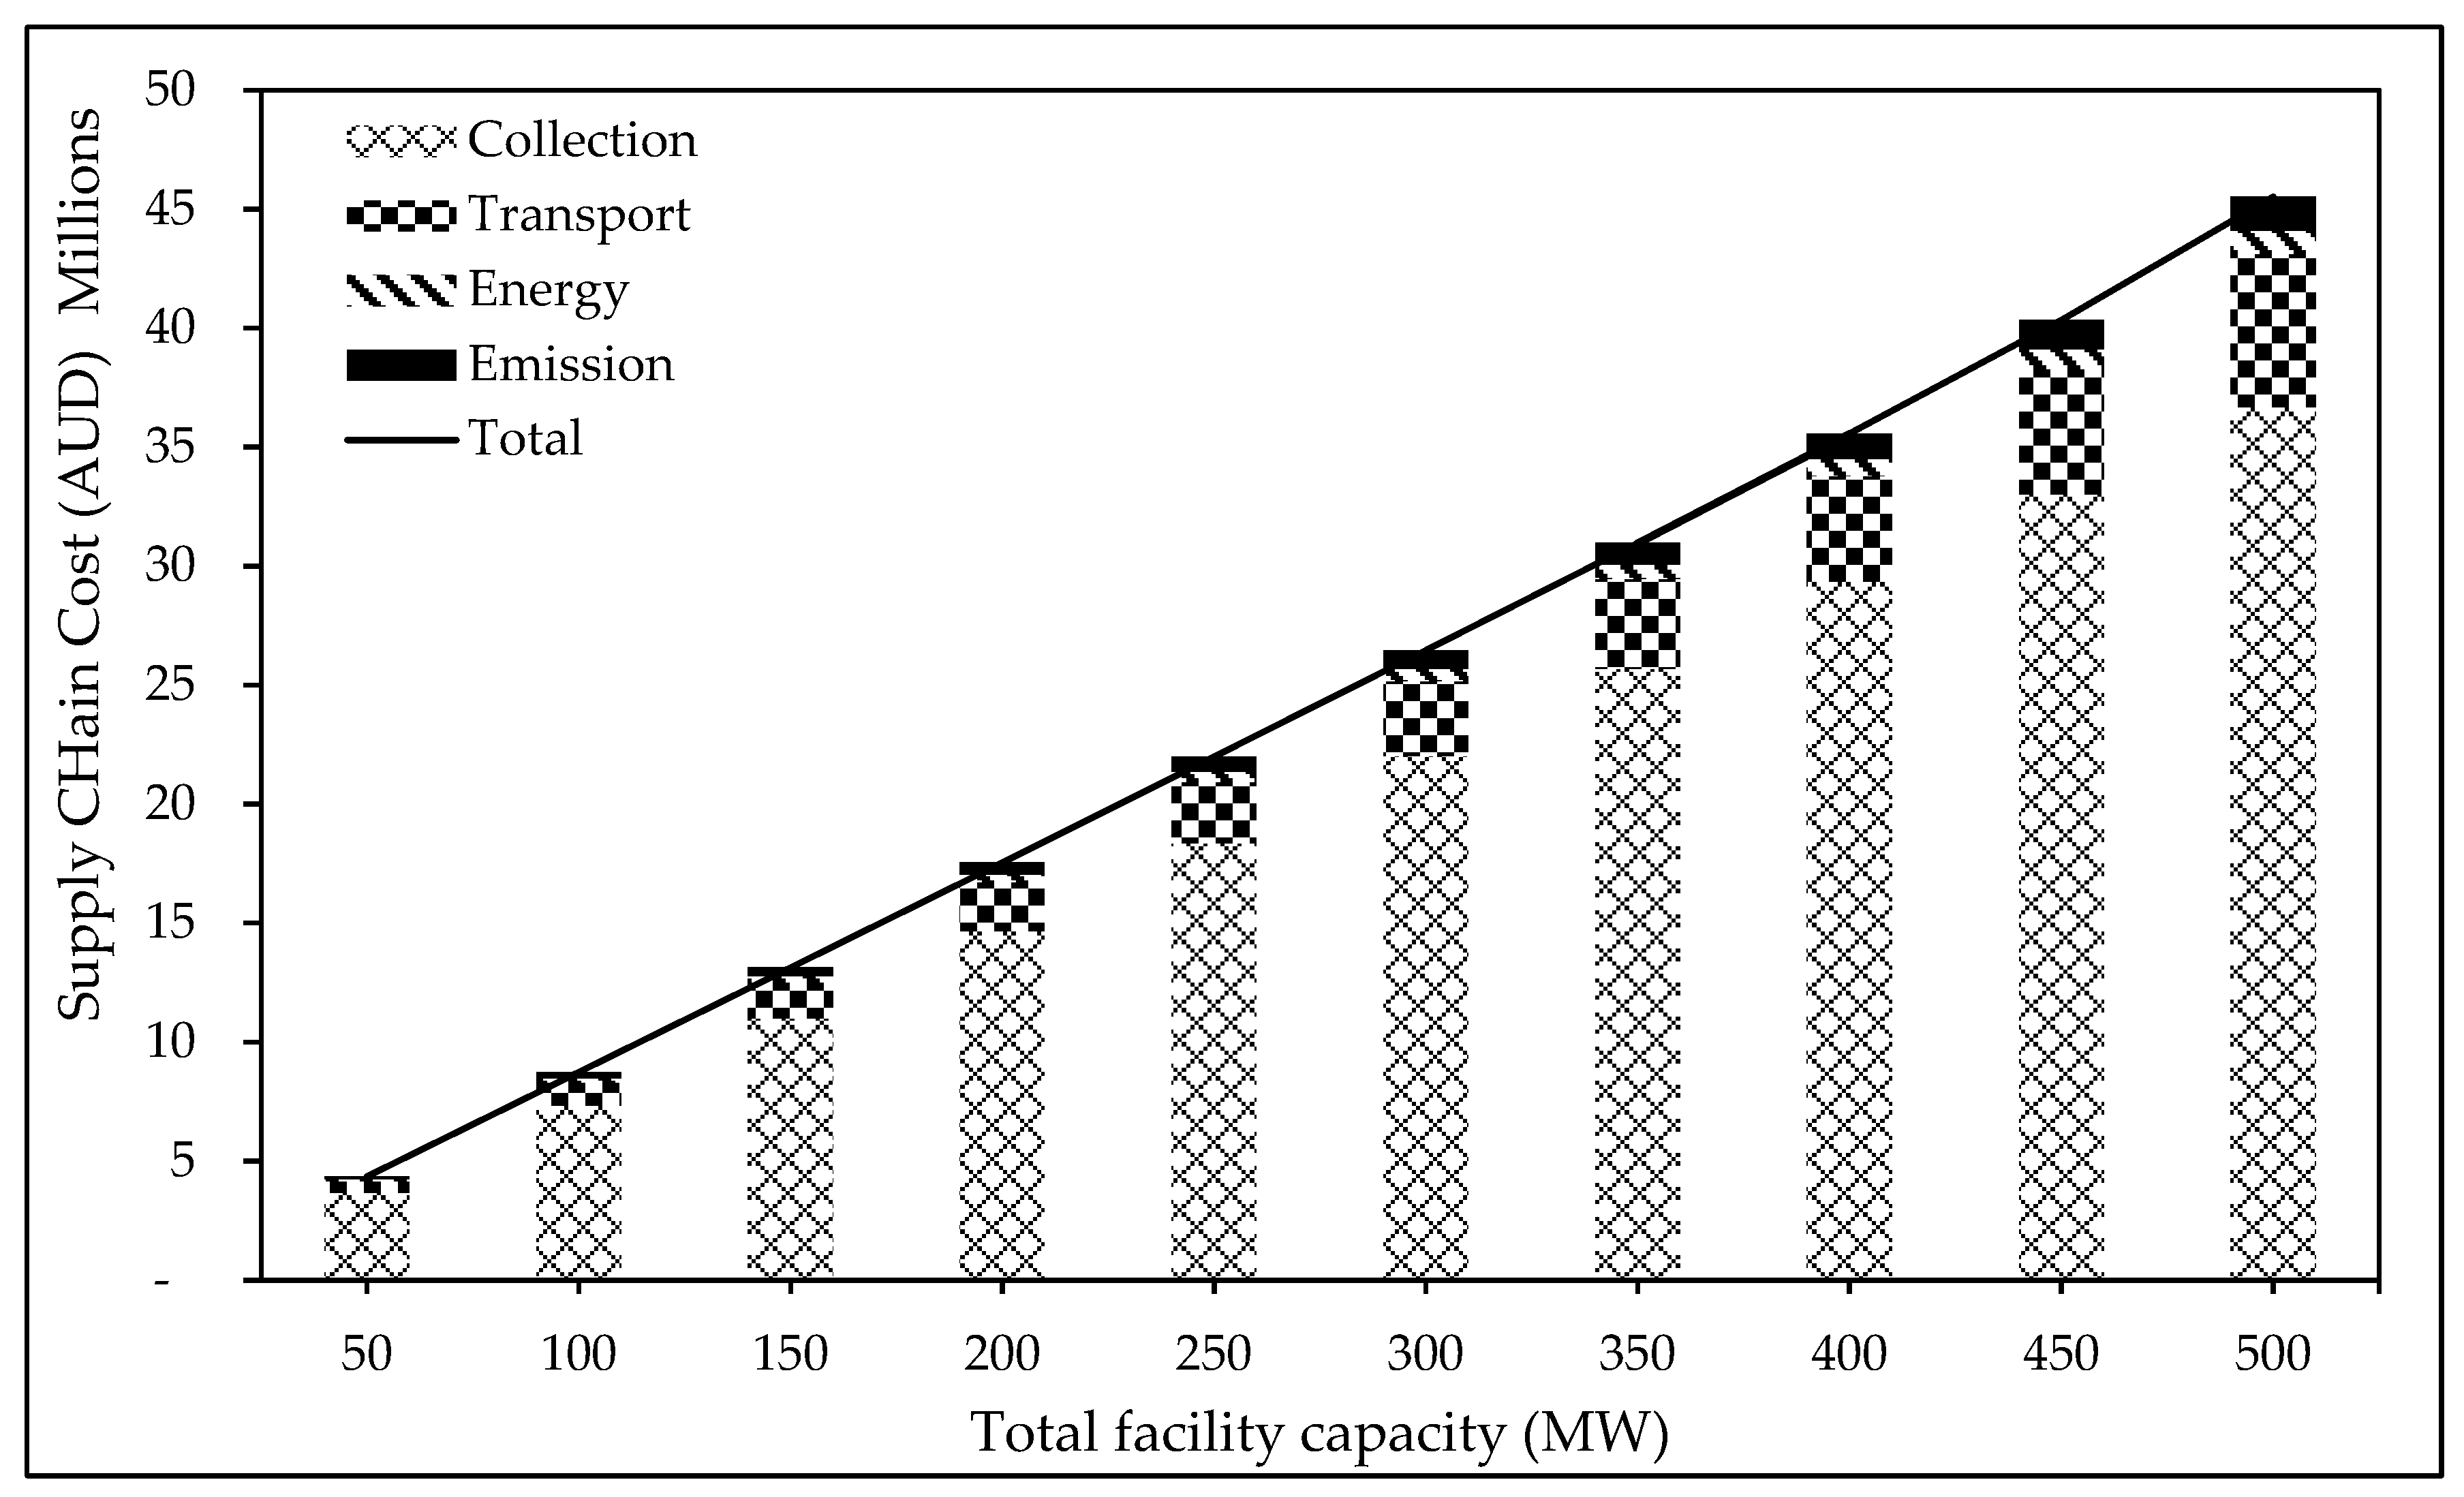
Figure 4 shows the corresponding operational costs (excluding installation). As in the biomass-driven scenario, collection dominated the cost structure, accounting for 81%–84% of total operational costs across demand levels. Transport contributed around 12%, while energy consumption during harvesting/forwarding (~2%) and supply-chain emissions (~3%) rose modestly with increasing demand. The overall trend was a linear increase in operational costs with growing demand up to 400 MW, after which costs escalated more sharply, reflecting the system’s limited flexibility once local resources were saturated.

3.3. Operational Cost Trends

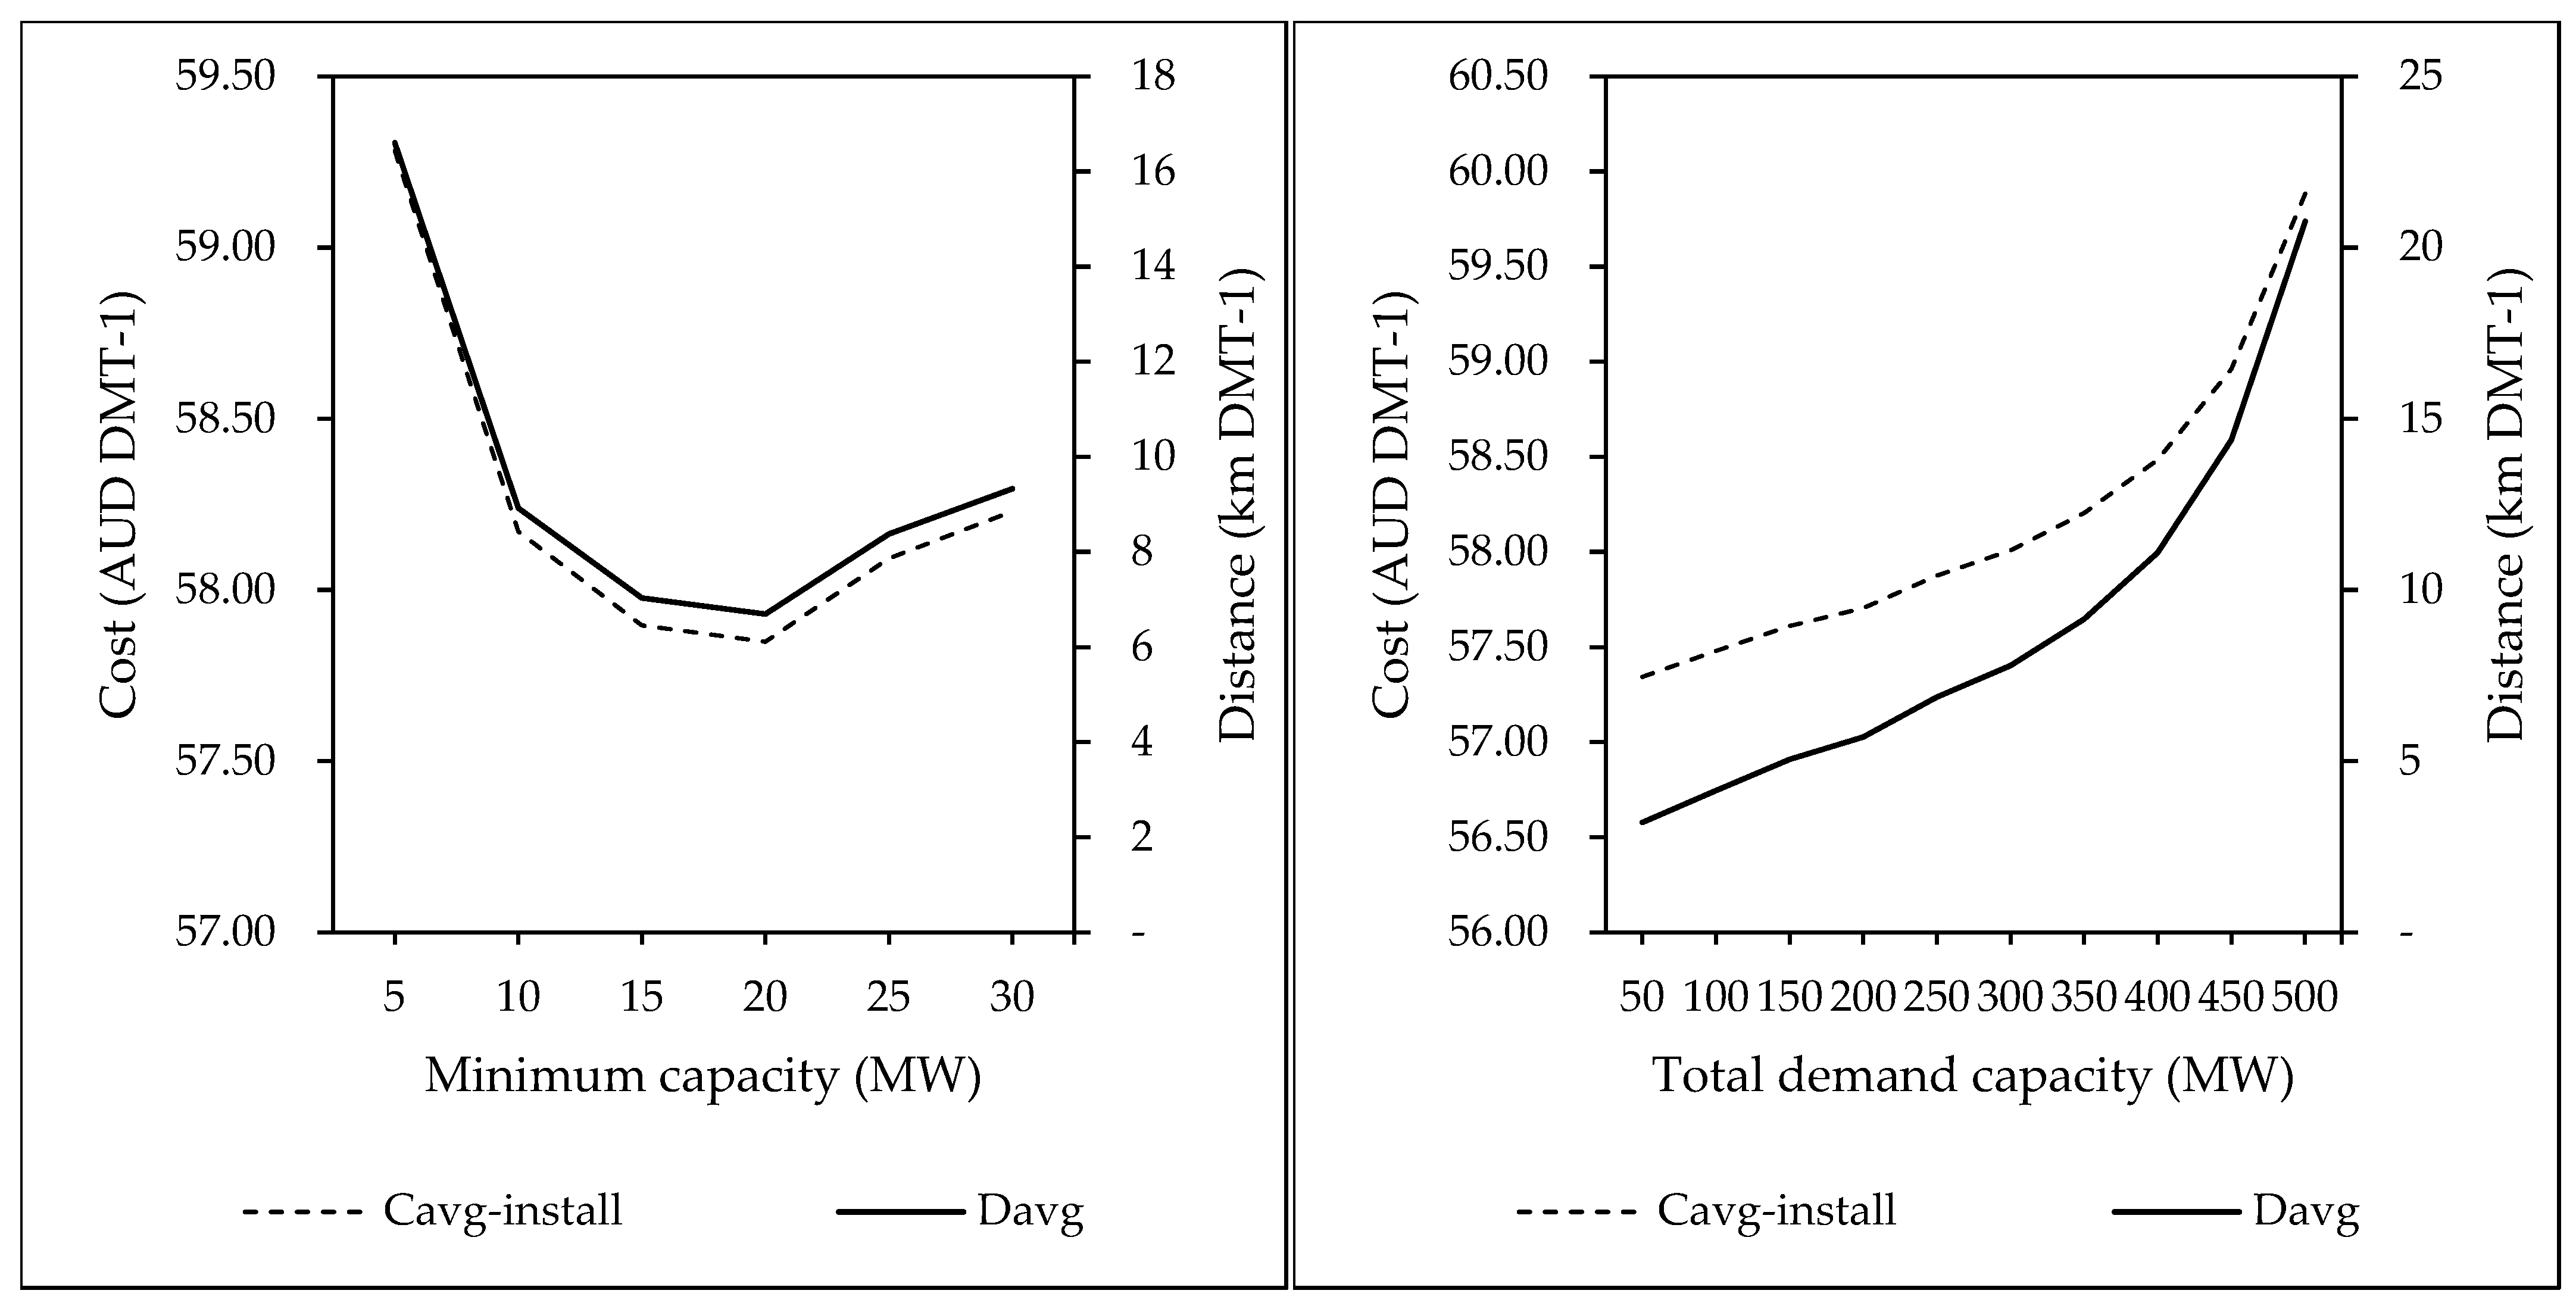
Figure 5 shows the relationship between average operational cost per ton of biomass and average transport distance under the two scenarios. Operational costs here include collection, transport, energy, and emissions, with installation costs excluded. At each capacity level, the average cost was calculated by dividing the sum of all operational cost components by the total biomass flow.
In the biomass supply scenario (left panel), average operational costs decreased as the minimum facility capacity increased up to ~15 MW, reaching a minimum of ~58 AUD DMT−1. Beyond this point, costs plateaued as both transport distances and cost shares stabilized.
In the energy demand scenario (right panel), average operational costs increased steadily with rising demand. At lower demand levels (50–200 MW), costs remained in the range of 56–58 AUD DMT−1, but above 400 MW they escalated sharply, reflecting longer average transport distances as the system strained to meet higher energy targets.
Across both scenarios, transport contributed 11%–14% of operational costs, while collection remained the dominant component. Although transport did not dominate the cost structure, its influence grew more pronounced at higher demand levels as average haul distances increased.

3.4. Sensitivity Analysis

3.4.1. Impact of Maximum Transport Distance

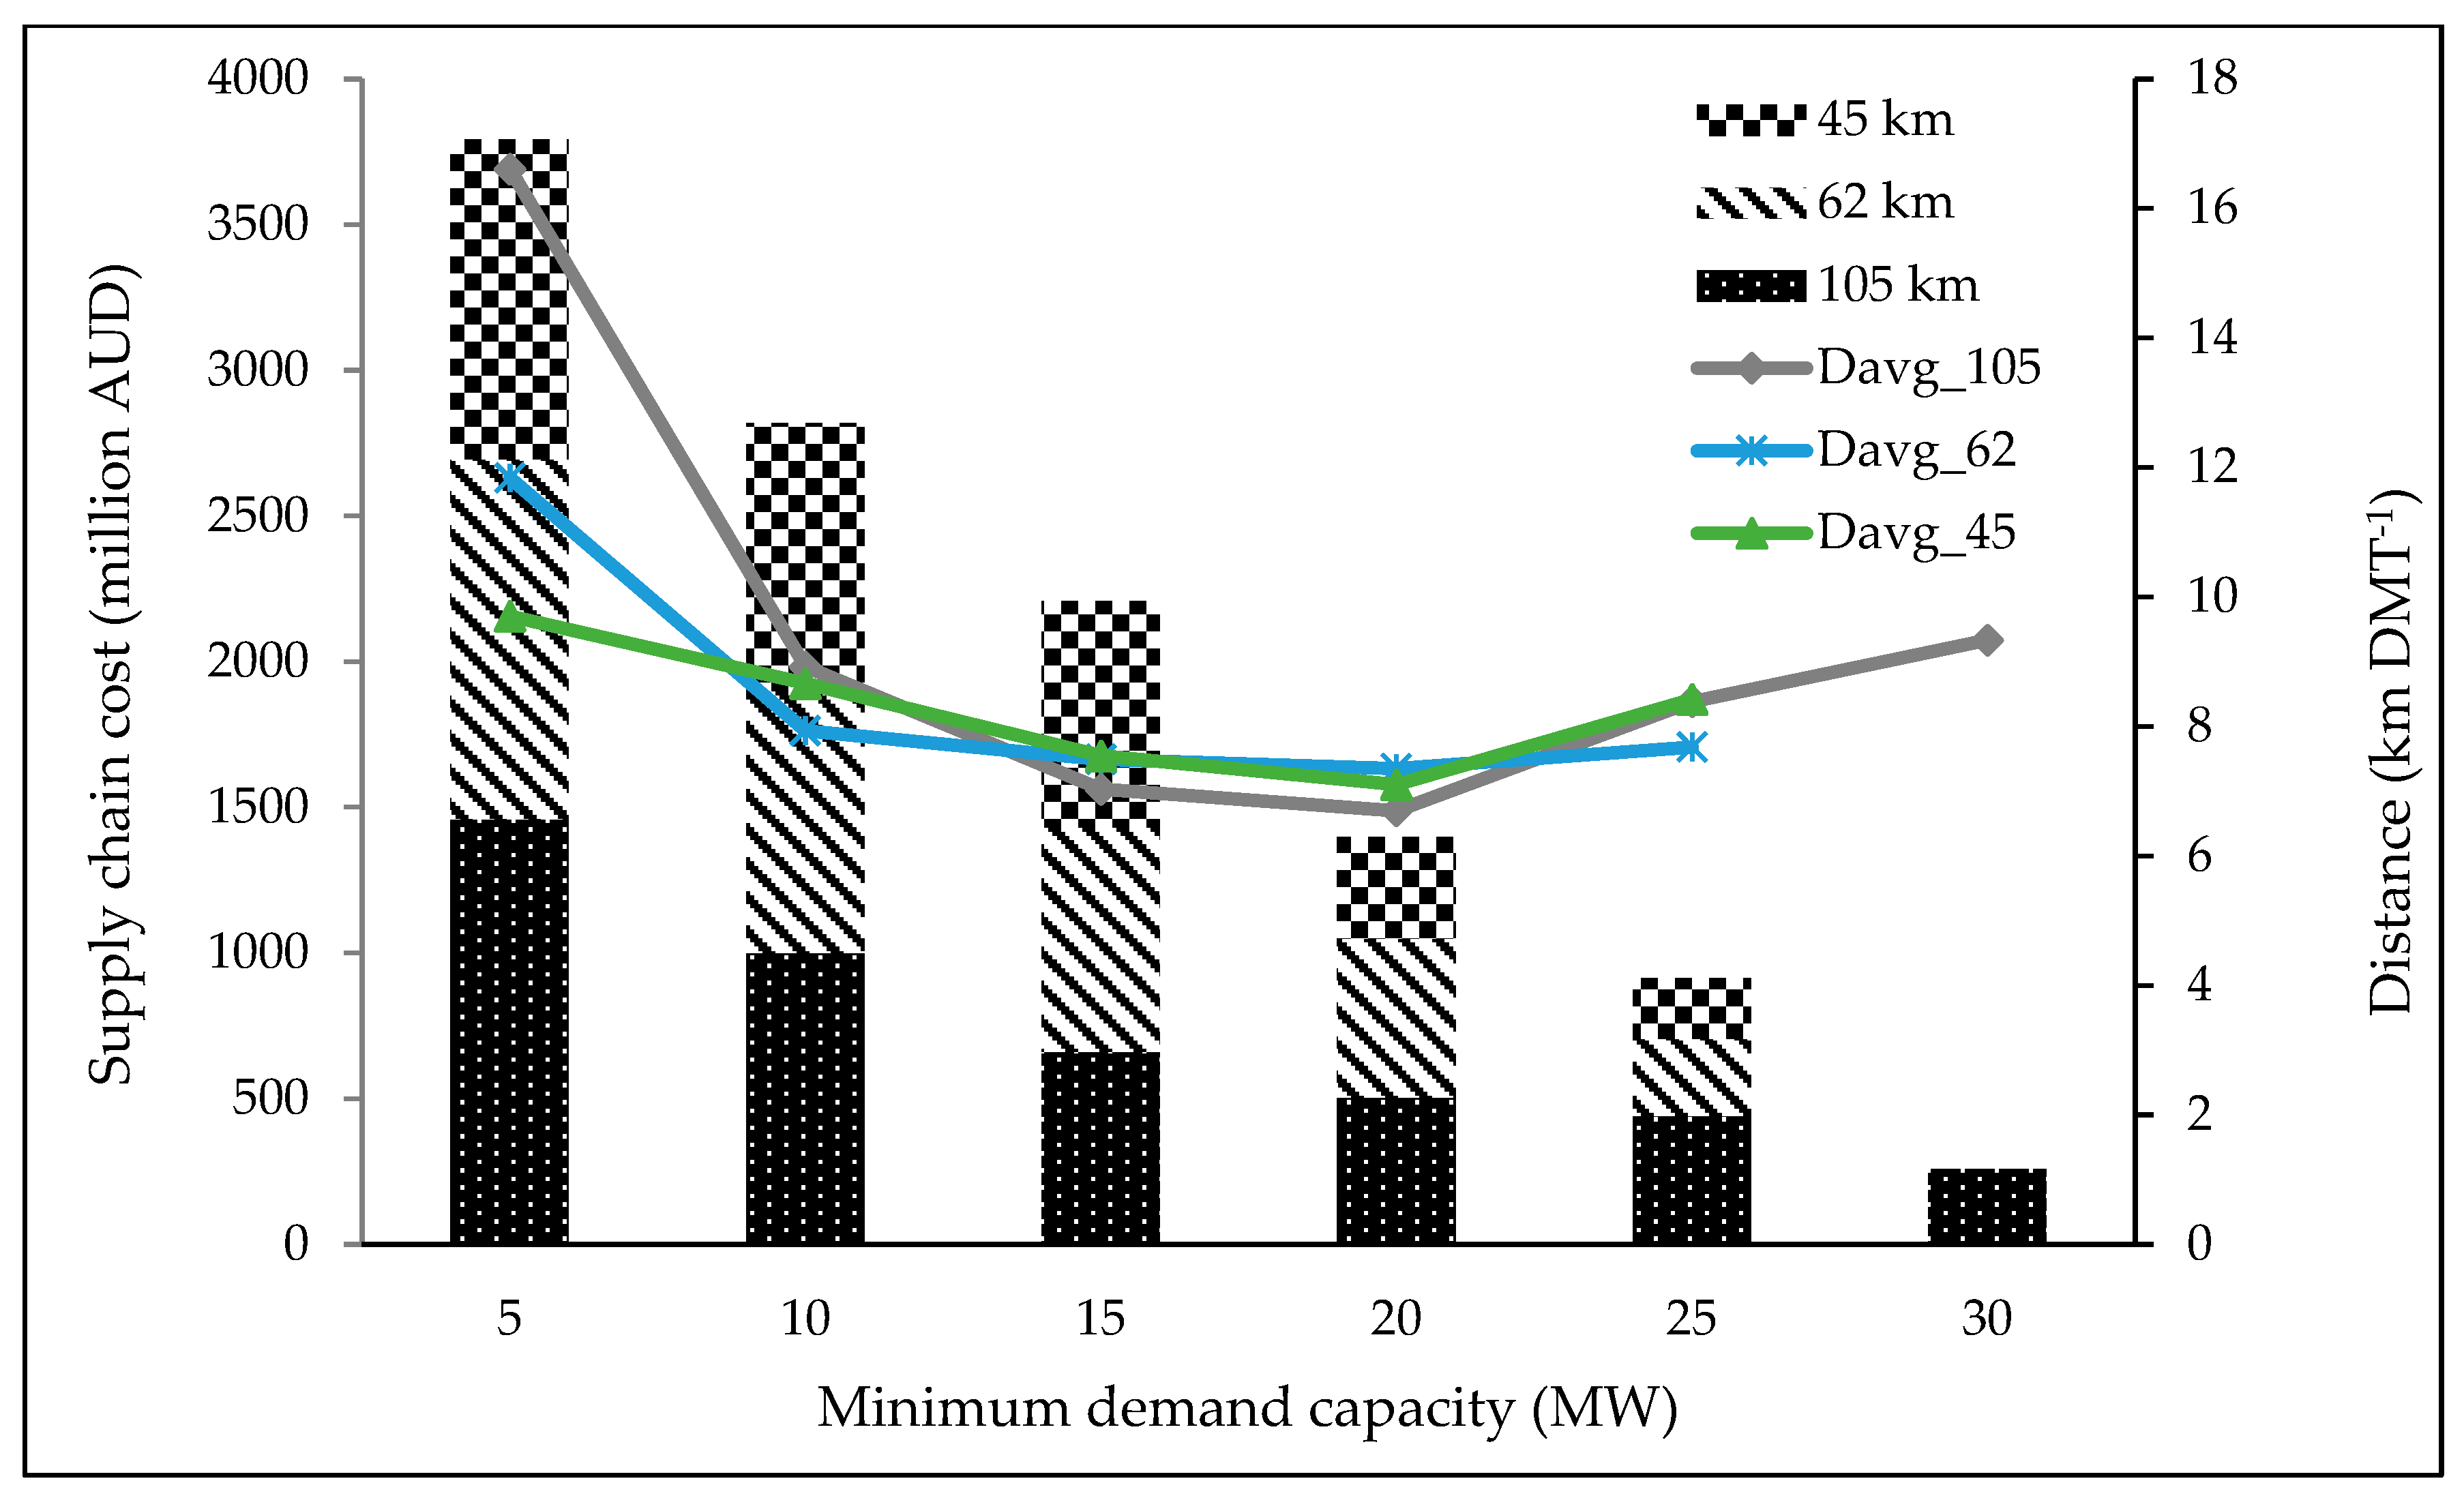
A sensitivity analysis was performed to evaluate the effect of limiting the maximum one-way transport distance (Dmax) from 105 km (baseline) to 62 km and 45 km. Figure 6 shows the resulting changes in total supply chain cost and average transport distance at different minimum facility capacities.
The results indicate that the total cost is highly sensitive to the transport constraint. At a minimum facility capacity of 5 MW, reducing Dmax to 62 km and 45 km lowered total supply chain costs by 24.8% and 15.3%, respectively, compared to the 105 km baseline. However, these shorter transport radii also restricted accessible biomass, leading to fewer feasible configurations at higher facility sizes. In particular, no feasible solutions were identified at minimum capacities of 25 MW and 30 MW when Dmax was reduced, as insufficient biomass could be sourced within the constrained radius.
Furthermore, while shorter maximum distances reduced costs at smaller facility sizes, they also lowered the total installed capacity compared with the 105 km baseline. This highlights the trade-off between reducing haul distances (and costs) and maintaining sufficient system-wide capacity.

3.4.2. Impact of Biomass Availability

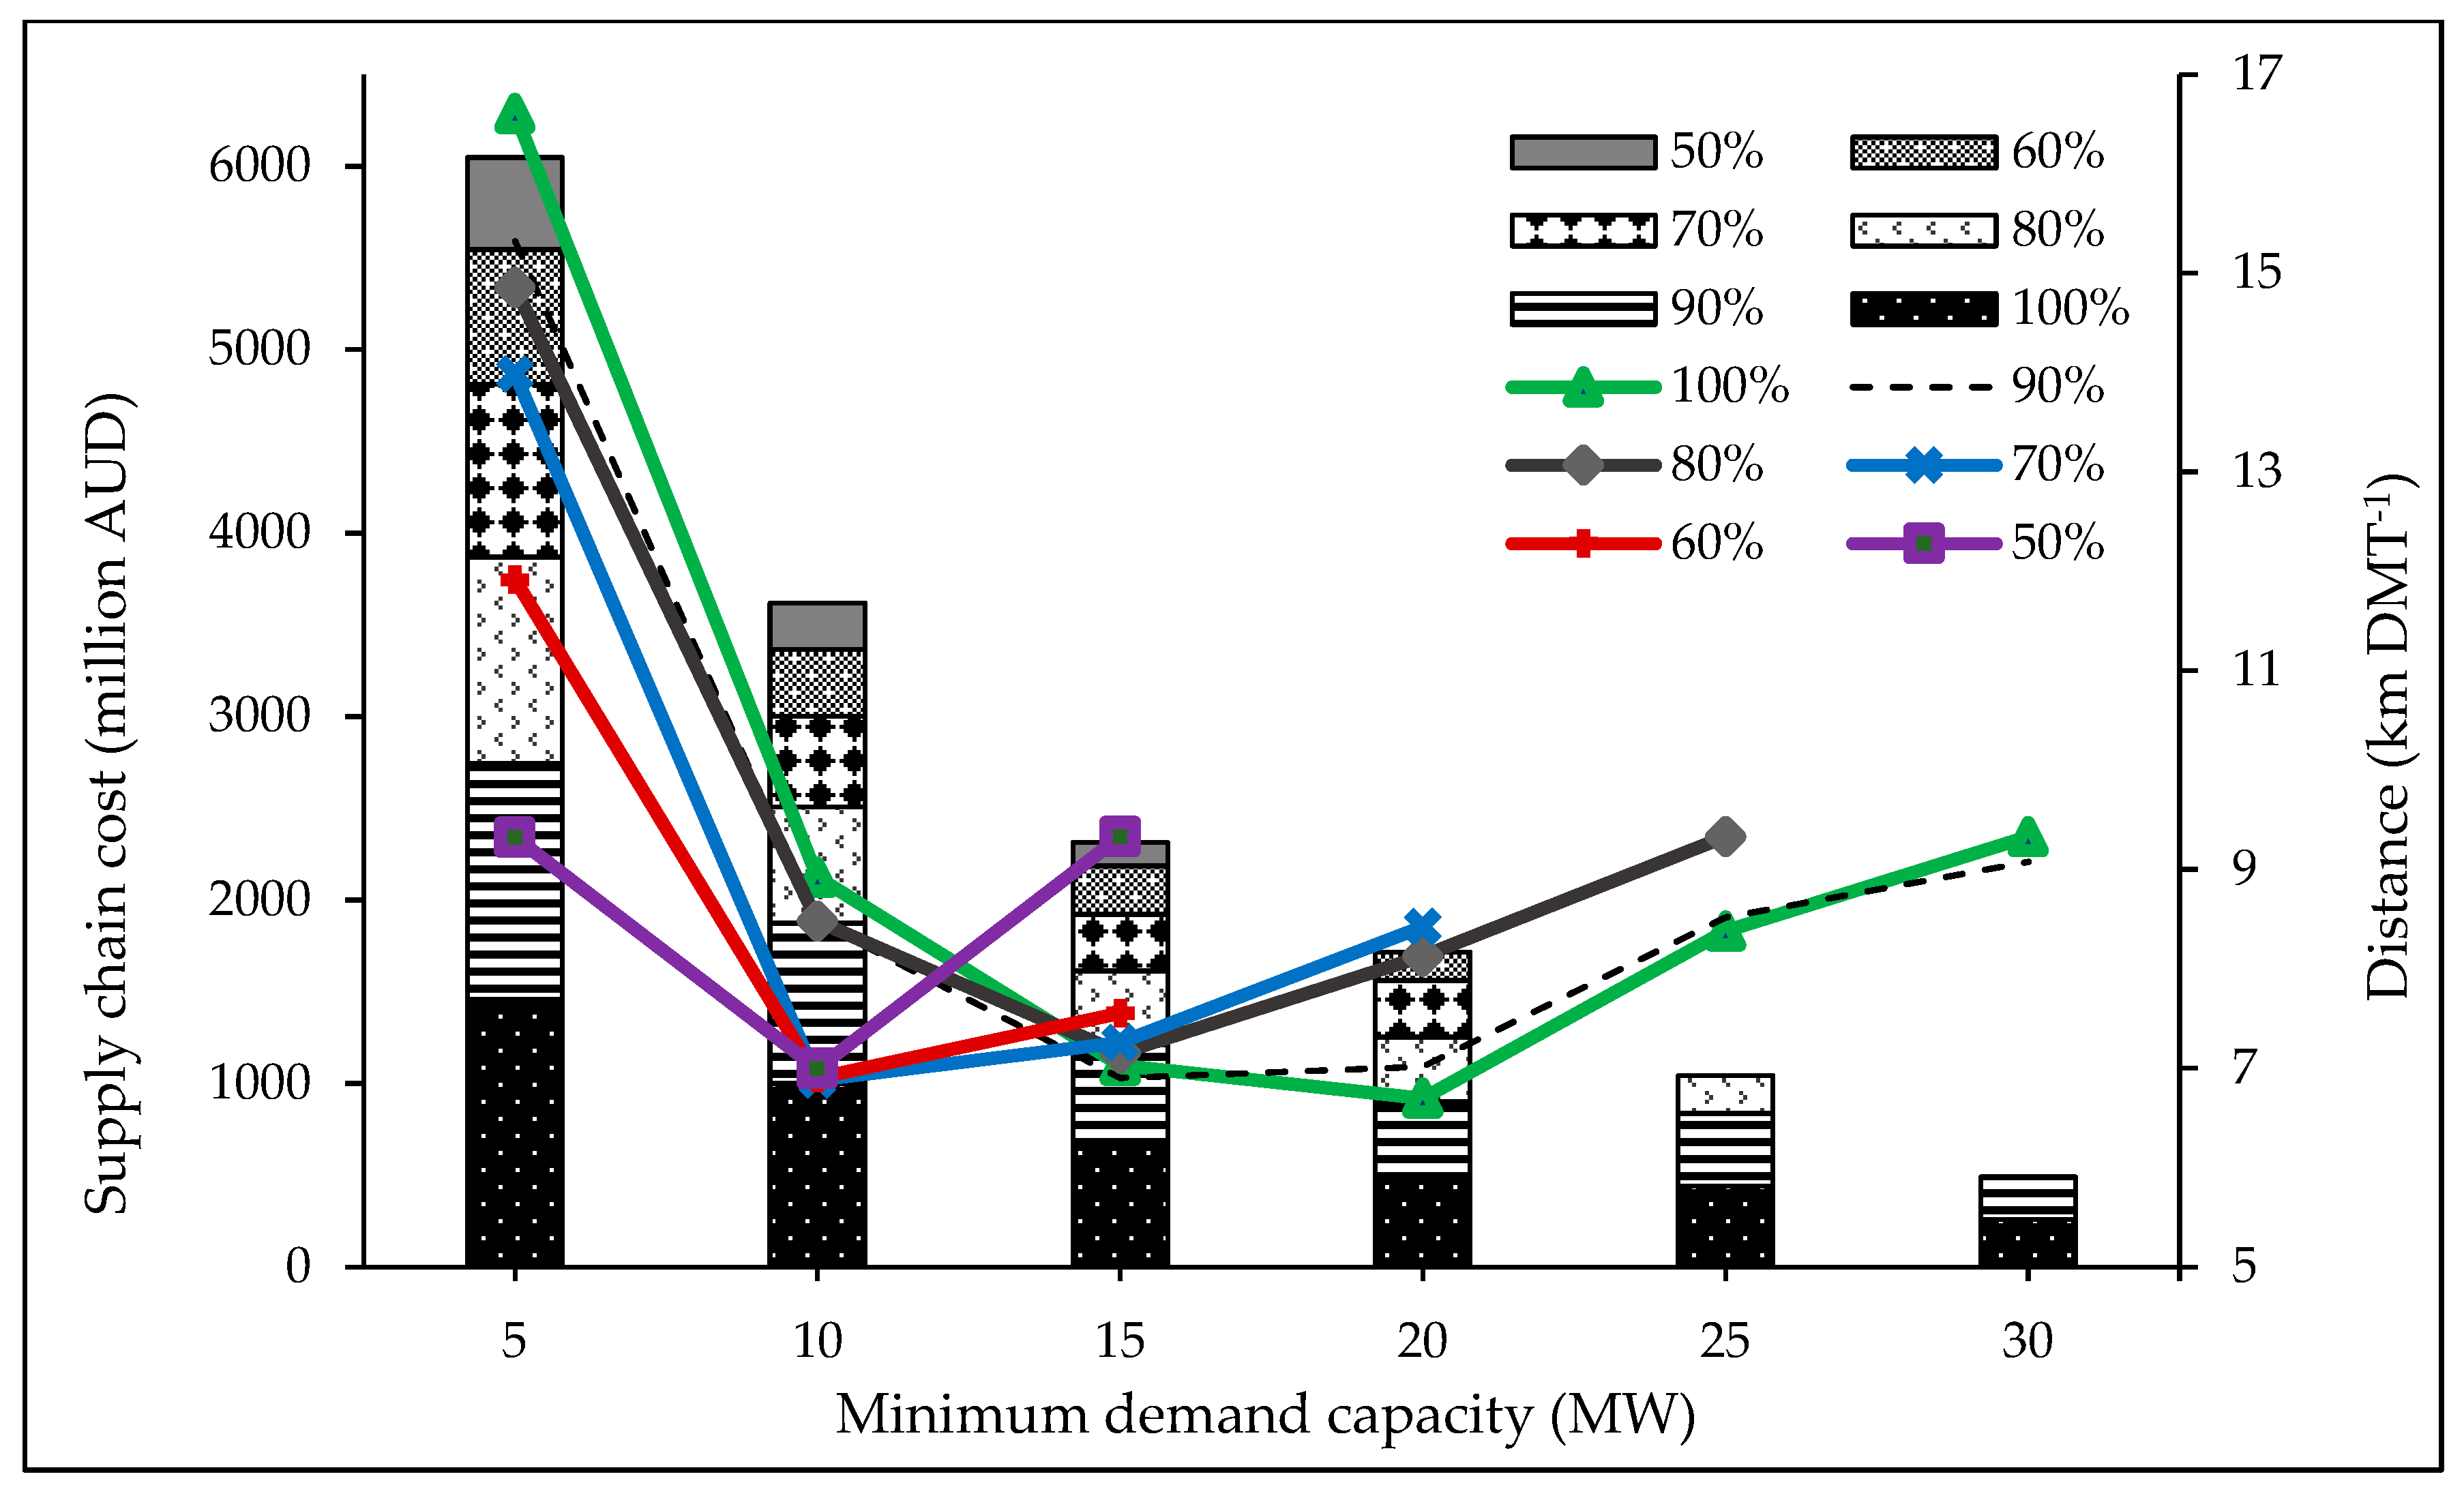
In the supply-push scenario, the total sustainable annual biomass harvest was assumed to be fully available for energy production. In practice, however, competing uses such as pulp and paper manufacturing may reduce the share of biomass accessible for bioenergy. To test this, total available biomass was reduced in 10% increments, down to 50% of the reference level, and supply chain outcomes were compared with the 100% baseline.
Figure 7 shows that the total supply chain cost is sensitive to biomass availability. As availability declined, costs decreased overall because less biomass were collected and transported. However, this reduction was accompanied by a sharp drop in total installed capacity. For example, reducing availability from 100% to 50% lowered installed capacity from 472 MW to 162 MW.
Infeasibility arose under certain combinations of high minimum facility capacity and low biomass availability. At a minimum facility size of 30 MW, solutions became infeasible when availability fell by more than 20%, and at 20 MW minimum size, infeasibility occurred at a 50% reduction. This reflects the inability of the reduced biomass supply to support larger facilities within the transport distance constraint.
Interestingly, lower biomass availability shifted the cost–distance trade-off. At reductions of 30% or more, the minimum cost scenario occurred at a 10 MW minimum facility size, suggesting that smaller facilities were favored under tighter supply conditions due to more localized collection radii.

4. Discussion

4.1. Novelty and Contributions of the Framework

This study contributes a generic, spatially explicit optimization framework for siting and sizing bioenergy facilities in forest-rich regions. By comparing biomass-driven (supply-push) and energy-driven (demand-pull) scenarios, we identify cost-effective configurations and highlight the sensitivity of outcomes to transport distance, facility size, and biomass availability in the Queensland case study. Unlike many previous models that focused on small-scale or stylized networks [14,24,47,48], this framework included a detailed spatial network with 80,920 supply nodes and over 10 million road links, enabling granular analysis of transport dynamics and facility placement.

4.2. Scenario Insights

In the biomass-driven scenario, infeasibility arose once the minimum facility size exceeded 30 MW, as the 105 km transport limit constrained access to sufficient biomass. This aligns with prior work by Zhang et al. [14], who found diminishing economic returns beyond 100 km catchment zones, and Ghaffariyan et al. [38], who reported rising marginal costs in Australian contexts beyond 90 km transport distances. Raising the minimum size from 5 to 30 MW reduced the number of facilities but increased their average size, with costs and transport distance following a convex trend and reaching a minimum around 20 MW. The total installed capacity in this scenario would utilize ~22% of the estimated forest biomass potential, which may seem modest but is plausible given the dispersed and remote nature of forest resources across more than 13 million ha in Queensland. At this configuration, the model deployed 8 facilities with the lowest average supply chain cost (≈58 AUD DMT−1, excluding installation), of which collection (≈83%) and transport (≈12%) dominated which is comparable to other Australian studies (48–63 AUD DMT−1 for ~90 km hauls [49]). The results are consistent with Woo et al. [20] who reported that 10–20 MW facilities offered optimal trade-offs between transport costs and local supply in remote regions.
Sensitivity analyses reinforced these trade-offs. Shorter maximum haul distances (45–62 km) reduced costs but lowered total installed capacity, as some larger facilities could not secure sufficient biomass. Similarly, reducing biomass availability by 20%–50% sharply reduced installed capacity and shifted the cost–distance balance toward smaller plants (10–15 MW), with infeasibility emerging at higher minimum capacities. For example, halving availability reduced installed capacity from 472 MW to 162 MW. These results emphasize the importance of secure long-term feedstock contracts in bioenergy planning, as echoed by Abasian et al. [50]. In the demand-driven scenario, feasible capacity peaked at 500 MW (~68% of available supply). At low demand levels, the model favored small, dispersed plants, while higher demand was met by adding more facilities rather than scaling up in size. Transport costs rose linearly up to ~400 MW, after which they escalated sharply, indicating the limits of long-distance haulage.

4.3. Strategic and Policy Implications

These results highlight that distributed networks of medium-scale facilities (~20 MW) are the most cost-effective and resilient option in forest-rich but spatially dispersed landscapes. Larger centralized facilities are theoretically possible with longer transport distances but are constrained by feedstock feasibility. Panichelli & Gnansounou [18] also observed that economies of scale are constrained by spatial supply limits. Improvements in transport infrastructure, operational experience, or integration with other supply chains could increase future utilization. For policymakers, this underscores the need to align regional energy targets with spatial resource availability rather than pursue centralized expansion. Setting regional demand targets above 400 MW would trigger disproportionate increases in transport costs, reinforcing the value of aligning energy demand with spatial resource constraints. For investors, the 20 MW benchmark represents a realistic facility scale that balances cost efficiency, feedstock security, and manageable transport distances. These insights align with earlier studies [18,20,49] showing that 10–20 MW plants strike an optimal balance between economies of scale and local resource accessibility.

4.4. Limitations and Future Research

This study demonstrates how GIS pre-screening reduces complexity in spatial optimization models, consistent with prior bioenergy studies [20,21]. A formal comparison of scenarios with and without GIS pre-processing was beyond this study’s scope but represents a valuable future direction to quantify computational benefits.
Several limitations and research extensions are noted. The single-objective function focused solely on cost minimization; future work could adopt multi-objective optimization (e.g., ε-constraint or NSGA-II) to balance economic, environmental, and capacity goals, or introduce stochastic programming to address uncertainties such as policy changes or disruptions. Installation costs were excluded from optimization; integrating these might favor fewer, larger facilities where economies of scale offset transport disadvantages, while introducing spatial heterogeneity in costs and operations would improve realism [32,50,51,52].
The use of a fixed 105 km transport distance reflected current economic feasibility but could be replaced in future studies with soft constraints or adaptive radii to better match logistical evolution. Emissions were calculated retrospectively; a full lifecycle assessment would provide more comprehensive environmental evaluation [53,54,55]. Finally, while the model assumed static annual supply and demand, including seasonal variability and dynamic biomass availability would enhance tactical relevance, with our supply reduction sensitivity analysis offering preliminary insight into system behavior under constraint.

5. Conclusions

This study applied an integrated GIS–optimization framework to design cost-efficient forest biomass-to-bioenergy supply chains in Queensland, Australia. Results showed that a facility size of ~20 MW provides the best trade-off between economies of scale and feedstock accessibility, aligning with both economic and technical constraints. Larger plants (>30 MW) were constrained by localized supply, while smaller plants lost efficiency. For policymakers, the findings indicate that distributed networks of medium-scale facilities are more viable than centralized large systems, offering resilience and cost-competitiveness. For investors, the 20 MW benchmark represents a realistic and competitive scale within current infrastructure and market conditions. Future work should extend the model with multi-objective formulations that integrate life-cycle assessment (LCA), techno-economic analysis (TEA), and greenhouse gas (GHG) emissions. Including dynamic supply modelling (e.g., rotations, seasonality, shocks) and socio-economic co-benefits would further enhance policy relevance and provide a roadmap toward resilient and sustainable bioenergy system design.

Author Contributions

Conceptualization, S.V.H., M.A. and S.E.; methodology, S.V.H., M.A. and S.E.; software, S.V.H.; formal analysis, S.V.H.; investigation, S.V.H., M.A. and S.E.; resources, S.V.H.; data curation, S.V.H.; writing—original draft preparation, S.V.H.; writing—review and editing, M.A. and S.E.; visualization, S.V.H.; supervision, M.A. and S.E.; funding acquisition, S.V.H. All authors have read and agreed to the published version of the manuscript.

Funding

This research was funded by the Australian Biomass for Bioenergy Assessment (ABBA) as part of the Australian Renewable Energy Agency (ARENA) through a University of the Sunshine Coast Research Scholarship (USCRS-ABBA), grant number (PRJ-010376).

Data Availability Statement

Data is contained within the article.

Acknowledgments

We want to thank the anonymous reviewers and the journal editor for taking their time to review and provide valuable input and comments. The Gottstein Trust provided additional funding through a forest industry top-up scholarship.

Conflicts of Interest

The first author, Sam Van Holsbeeck, serves as a Guest Editor for the Forests Special Issue titled “Forest-Based Biomass for Bioenergy.” In line with MDPI’s policies for Special Issue submissions, this manuscript will be managed entirely independently: an Editorial Board member or the Editor-in-Chief will oversee its editorial handling and peer-review process, ensuring impartiality. The authors declare no other conflicts of interest.

References

  1. IEA Bioenergy. Answers to Ten Frequently Asked Questions about Bioenergy, Carbon Sinks and Their Role in Global Climate Change; IEA Bioenergy: Graz, Austria, 2001. [Google Scholar]
  2. Szulecka, J. Towards Sustainable Wood-Based Energy: Evaluation and Strategies for Mainstreaming Sustainability in the Sector. Sustainability 2019, 11, 493. [Google Scholar] [CrossRef]
  3. KPMG. Bioenergy State of the Nation Report; Bioenergy Australia: Canberra, Australia, 2018. [Google Scholar]
  4. Australian Government. Australian Energy Update 2018; Department of the Environment and Energy: Canberra, Australia, 2018. [Google Scholar]
  5. ABARES. Australia’s State of the Forests Report 2018; Australian Government Department of Agriculture and Water Resources: Canberra, Australia, 2018. [Google Scholar]
  6. Berndes, G.; Abts, B.; Asikainen, A.; Cowie, A.; Dale, V.; Egnell, G.; Lindner, M.; Marelli, L.; Paré, D.; Pingoud, K.; et al. Forest Biomass, Carbon Neutrality and Climate Change Mitigation; European Forest Institute: Joensuu, Finland, 2016. [Google Scholar]
  7. Acuna, M.; Sessions, J.; Zamora, R.; Boston, K.; Brown, M.; Ghaffariyan, M.R. Methods to Manage and Optimize Forest Biomass Supply Chains: A Review. Curr. For. Rep. 2019, 5, 124–141. [Google Scholar] [CrossRef]
  8. Shi, X.; Elmore, A.; Li, X.; Gorence, N.J.; Jin, H.; Zhang, X.; Wang, F. Using Spatial Information Technologies to Select Sites for Biomass Power Plants: A Case Study in Guangdong Province, China. Biomass Bioenergy 2008, 32, 35–43. [Google Scholar] [CrossRef]
  9. Hock, B.K.; Blomqvist, L.; Hall, P.; Jack, M.; Möller, B.; Wakelin, S.J. Understanding Forest-Derived Biomass Supply with GIS Modelling. J. Spat. Sci. 2012, 57, 213–232. [Google Scholar] [CrossRef]
  10. Acuna, M. Timber and Biomass Transport Optimization: A Review of Planning Issues, Solution Techniques and Decision Support Tools. Croat. J. For. Eng. 2017, 38, 279–290. [Google Scholar]
  11. Murphy, H.T.; O’Connell, D.A.; Raison, R.J.; Warden, A.C.; Booth, T.H.; Herr, A.; Braid, A.L.; Crawford, D.F.; Hayward, J.A.; Jovanovic, T.; et al. Biomass Production for Sustainable Aviation Fuels: A Regional Case Study in Queensland. Renew. Sustain. Energy Rev. 2015, 44, 738–750. [Google Scholar] [CrossRef]
  12. Sahoo, K.; Hawkins, G.L.; Yao, X.A.; Samples, K.; Mani, S. GIS-Based Biomass Assessment and Supply Logistics System for a Sustainable Biorefinery: A Case Study with Cotton Stalks in the Southeastern US. Appl. Energy 2016, 182, 260–273. [Google Scholar] [CrossRef]
  13. Delivand, M.K.; Cammerino, A.R.B.; Garofalo, P.; Monteleone, M. Optimal Locations of Bioenergy Facilities, Biomass Spatial Availability, Logistics Costs and GHG (Greenhouse Gas) Emissions: A Case Study on Electricity Productions in South Italy. J. Clean Prod. 2015, 99, 129–139. [Google Scholar] [CrossRef]
  14. Zhang, F.; Johnson, D.; Johnson, M.; Watkins, D.; Froese, R.; Wang, J. Decision Support System Integrating GIS with Simulation and Optimisation for a Biofuel Supply Chain. Renew. Energy 2016, 85, 740–748. [Google Scholar] [CrossRef]
  15. Acuna, M.; Sánchez-García, S.; Canga, E. An Optimization Approach to Assess the Impact of Drying and Dry Matter Losses of Eucalyptus Globulus Roundwood and Biomass on Supply Chains Costs and GHG Emissions. Forests 2022, 13, 701. [Google Scholar] [CrossRef]
  16. Perpiña, C.; Martínez-Llario, J.C.; Pérez-Navarro, Á. Multicriteria Assessment in GIS Environments for Siting Biomass Plants. Land Use Policy 2013, 31, 326–335. [Google Scholar] [CrossRef]
  17. Voivontas, D.; Assimacopoulos, D.; Koukios, E.G. Assessment of Biomass Potential for Power Production: A GIS Based Method. Biomass Bioenergy 2001, 20, 101–112. [Google Scholar] [CrossRef]
  18. Panichelli, L.; Gnansounou, E. GIS-Based Approach for Defining Bioenergy Facilities Location: A Case Study in Northern Spain Based on Marginal Delivery Costs and Resources Competition between Facilities. Biomass Bioenergy 2008, 32, 289–300. [Google Scholar] [CrossRef]
  19. Zhang, F.; Johnson, D.M.; Sutherland, J.W. A GIS-Based Method for Identifying the Optimal Location for a Facility to Convert Forest Biomass to Biofuel. Biomass Bioenergy 2011, 35, 3951–3961. [Google Scholar] [CrossRef]
  20. Woo, H.; Acuna, M.; Moroni, M.; Taskhiri, M.S.; Turner, P. Optimizing the Location of Biomass Energy Facilities by Integrating Multi-Criteria Analysis (MCA) and Geographical Information Systems (GIS). Forests 2018, 9, 585. [Google Scholar] [CrossRef]
  21. Xing, J.; Sun, S.; Huang, Q.; Chen, Z.; Zhou, Z. Application of Geoinformatics in Forest Planning and Management. Forests 2024, 15, 439. [Google Scholar] [CrossRef]
  22. Costanza, L.; Maldera, F.; Garofalo, S.; Pietro; Vivaldi, G.A.; Camposeo, S. Ecological Optima Show the Potential Diffusion of Minor Tree Crops in Xylella Fastidiosa Subsp. Pauca-Infected Areas through a GIS-Based Approach. Front. Agron. 2024, 6, 1421627. [Google Scholar] [CrossRef]
  23. Ezzati, S.; Mohammadi, J. A Decision Support Model for Planning of Spatial Large Extent Biomass to Bioenergy Procurement Network. Bioresour. Technol. Rep. 2024, 27, 101886. [Google Scholar] [CrossRef]
  24. Zhang, F.; Wang, J.; Liu, S.; Zhang, S.; Sutherland, J.W. Integrating GIS with Optimization Method for a Biofuel Feedstock Supply Chain. Biomass Bioenergy 2017, 98, 194–205. [Google Scholar] [CrossRef]
  25. Van Holsbeeck, S.; Srivastava, S.K. Feasibility of Locating Biomass-to-Bioenergy Conversion Facilities Using Spatial Information Technologies: A Case Study on Forest Biomass in Queensland, Australia. Biomass Bioenergy 2020, 139, 105620. [Google Scholar] [CrossRef]
  26. Queensland Government. Forest Products Pocket Facts—2017; Queensland Government Department of Agriculture and Fisheries: Brisbane, Australia, 2017. [Google Scholar]
  27. Queensland Government. Queensland Forest & Timber Industry: An Overview; Queensland Government Department of Agriculture and Fisheries: Brisbane, Australia, 2016. [Google Scholar]
  28. ABARES. Australian Forest and Wood Products Statistics; March to June Quarter 2020; ABARES: Canberra, Australia, 2020. [Google Scholar]
  29. Lock, P.; Whittle, L. Future Opportunities for Using Forest and Sawmill Residues in Australia; Australian Government Department of Agriculture and Water Resources: Canberra, Australia, 2018. [Google Scholar]
  30. Albioma Tuan Biomass. Available online: https://www.albioma.com/pt/unidad/australia/tuan-biomass/ (accessed on 5 May 2020).
  31. Geoscience Australia. Bioregional Assessment Source Dataset; GEODATA TOPO 20K Series 3; Geoscience, Australia: Canberra, Australia, 2006. [Google Scholar]
  32. Van Holsbeeck, S.; Ezzati, S.; Röser, D.; Brown, M. A Two-Stage DSS to Evaluate Optimal Locations for Bioenergy Facilities. Forests 2020, 11, 968. [Google Scholar] [CrossRef]
  33. NHVR Common Heavy Freight Vehicle Configurations; National Heavy Vehicle Regulator: Brisbane, Australia, 2019.
  34. Cummins, J.; Skennar, C.; Cassidy, M.; Palmer, G.; Capill, L. Using Small Hardwood Logs to Produce Liquid Fuels and Electricity. Aust. For. 2016, 79, 189–195. [Google Scholar] [CrossRef]
  35. Pearman, G.I. Overheads of Truck Transport in Australia: Implications for Biomass as Feedstock for Bio-Energy. Aust. J. Multi-Discip. Eng. 2018, 14, 34–41. [Google Scholar] [CrossRef]
  36. England, J.R.; May, B.; Raison, R.J.; Paul, K.I. Cradle-to-Gate Inventory of Wood Production from Australian Softwood Plantations and Native Hardwood Forests: Carbon Sequestration and Greenhouse Gas Emissions. For. Ecol. Manag. 2013, 302, 295–307. [Google Scholar] [CrossRef]
  37. Farine, D.R.; O’Connell, D.A.; Raison, R.J.; May, B.M.; O’Connor, M.H.; Crawford, D.F.; Herr, A.; Taylor, J.A.; Jovanovic, T.; Campbell, P.K.; et al. An Assessment of Biomass for Bioelectricity and Biofuel, and for Greenhouse Gas Emission Reduction in Australia. GCB Bioenergy 2012, 4, 148–175. [Google Scholar] [CrossRef]
  38. Ghaffariyan, M.R.; Acuna, M.; Brown, M. Analysing the Effect of Five Operational Factors on Forest Residue Supply Chain Costs: A Case Study in Western Australia. Biomass Bioenergy 2013, 59, 486–493. [Google Scholar] [CrossRef]
  39. CEFC. The Australian Bioenergy and Energy from Waste Market; Clean Energy Finance Corporation: Sydney, Australia, 2015. [Google Scholar]
  40. Sönnichsen, N. Average Installation Cost for Bioenergy Plants Worldwide from 2010 to 2018 (in U.S. Dollars per Kilowatt)*. Available online: https://www.statista.com/statistics/799356/global-bioenergy-installation-cost-per-kilowatt/ (accessed on 21 June 2020).
  41. Stucley, C.R.; Schuck, S.M.; Larsen, P.L.; Turvey, N.D.; Marino, B.E. Biomass Energy Production in Australia: Status, Costs and Opportunities for Major Technologies; Australian Government Rural Industries Research and Development Corporation: Canberra, Australia, 2008. [Google Scholar]
  42. Rodriguez, L.C.; May, B.; Herr, A.; O’Connell, D. Biomass Assessment and Small Scale Biomass Fired Electricity Generation in the Green Triangle, Australia. Biomass Bioenergy 2011, 35, 2589–2599. [Google Scholar] [CrossRef]
  43. May, B.; England, J.R.; Raison, R.J.; Paul, K.I. Cradle-to-Gate Inventory of Wood Production from Australian Softwood Plantations and Native Hardwood Forests: Embodied Energy, Water Use and Other Inputs. For. Ecol. Manag. 2012, 264, 37–50. [Google Scholar] [CrossRef]
  44. Pandur, Z.; Šušnjar, M.; Zorić, M.; Nevečerel, H.; Horvat, D. Energy Return on Investment (EROI) of Different Wood Products. In Precious Forests—Precious Earth; IntechOpen: London, UK, 2015; pp. 165–184. [Google Scholar]
  45. Polglase, P.J.; Reeson, A.; Hawkins, C.S.; Paul, K.I.; Siggins, A.W.; Turner, J.; Crawford, D.F.; Jovanovic, T.; Hobbs, T.J.; Opie, K.; et al. Potential for Forest Carbon Plantings to Offset Greenhouse Emissions in Australia: Economics and Constraints to Implementation. Clim. Change 2013, 121, 161–175. [Google Scholar] [CrossRef]
  46. Freppaz, D.; Minciardi, R.; Robba, M.; Rovatti, M.; Sacile, R.; Taramasso, A. Optimizing Forest Biomass Exploitation for Energy Supply at a Regional Level. Biomass Bioenergy 2004, 26, 15–25. [Google Scholar] [CrossRef]
  47. Nord-Larsen, T.; Talbot, B. Assessment of Forest-Fuel Resources in Denmark: Technical and Economic Availability. Biomass Bioenergy 2004, 27, 97–109. [Google Scholar] [CrossRef]
  48. Frombo, F.; Minciardi, R.; Robba, M.; Rosso, F.; Sacile, R. Planning Woody Biomass Logistics for Energy Production: A Strategic Decision Model. Biomass Bioenergy 2009, 33, 372–383. [Google Scholar] [CrossRef]
  49. IndustryEdge. Australian Hardwood Chip Export Volume & Price Forecasts and Stumpage and Harvest Cost Review; IndustryEdge Pty Ltd.: Geelong West, Australia, 2013. [Google Scholar]
  50. Abasian, F.; Rönnqvist, M.; Ouhimmou, M. Forest Bioenergy Network Design under Market Uncertainty. Energy 2019, 188, 116038. [Google Scholar] [CrossRef]
  51. Razm, S.; Dolgui, A.; Hammami, R.; Brahimi, N.; Nickel, S.; Sahebi, H. A Two-Phase Sequential Approach to Design Bioenergy Supply Chains under Uncertainty and Social Concerns. Comput. Chem. Eng. 2021, 145, 107131. [Google Scholar] [CrossRef]
  52. Guilhermino, A.; Lourinho, G.; Brito, P.; Almeida, N. Assessment of the Use of Forest Biomass Residues for Bioenergy in Alto Alentejo, Portugal: Logistics, Economic and Financial Perspectives. Waste Biomass Valorization 2018, 9, 739–753. [Google Scholar] [CrossRef]
  53. Cambero, C.; Hans Alexandre, M.; Sowlati, T. Life Cycle Greenhouse Gas Analysis of Bioenergy Generation Alternatives Using Forest and Wood Residues in Remote Locations: A Case Study in British Columbia, Canada. Resour. Conserv. Recycl. 2015, 105, 59–72. [Google Scholar] [CrossRef]
  54. Tucker, S.N.; Tharumarajah, A.; May, B.; England, J.; Paul, K.; Hall, M.; Mitchell, P.; Rouwette, R.; Seo, S.; Syme, M. Life Cycle Inventory of Australian Forestry and Wood Products; Forest and Wood Products Research and Development Corporation: Melbourne, Australia, 2009. [Google Scholar]
  55. Cherubini, F.; Strømman, A.H. Life Cycle Assessment of Bioenergy Systems: State of the Art and Future Challenges. Bioresour. Technol. 2011, 102, 437–451. [Google Scholar] [CrossRef]
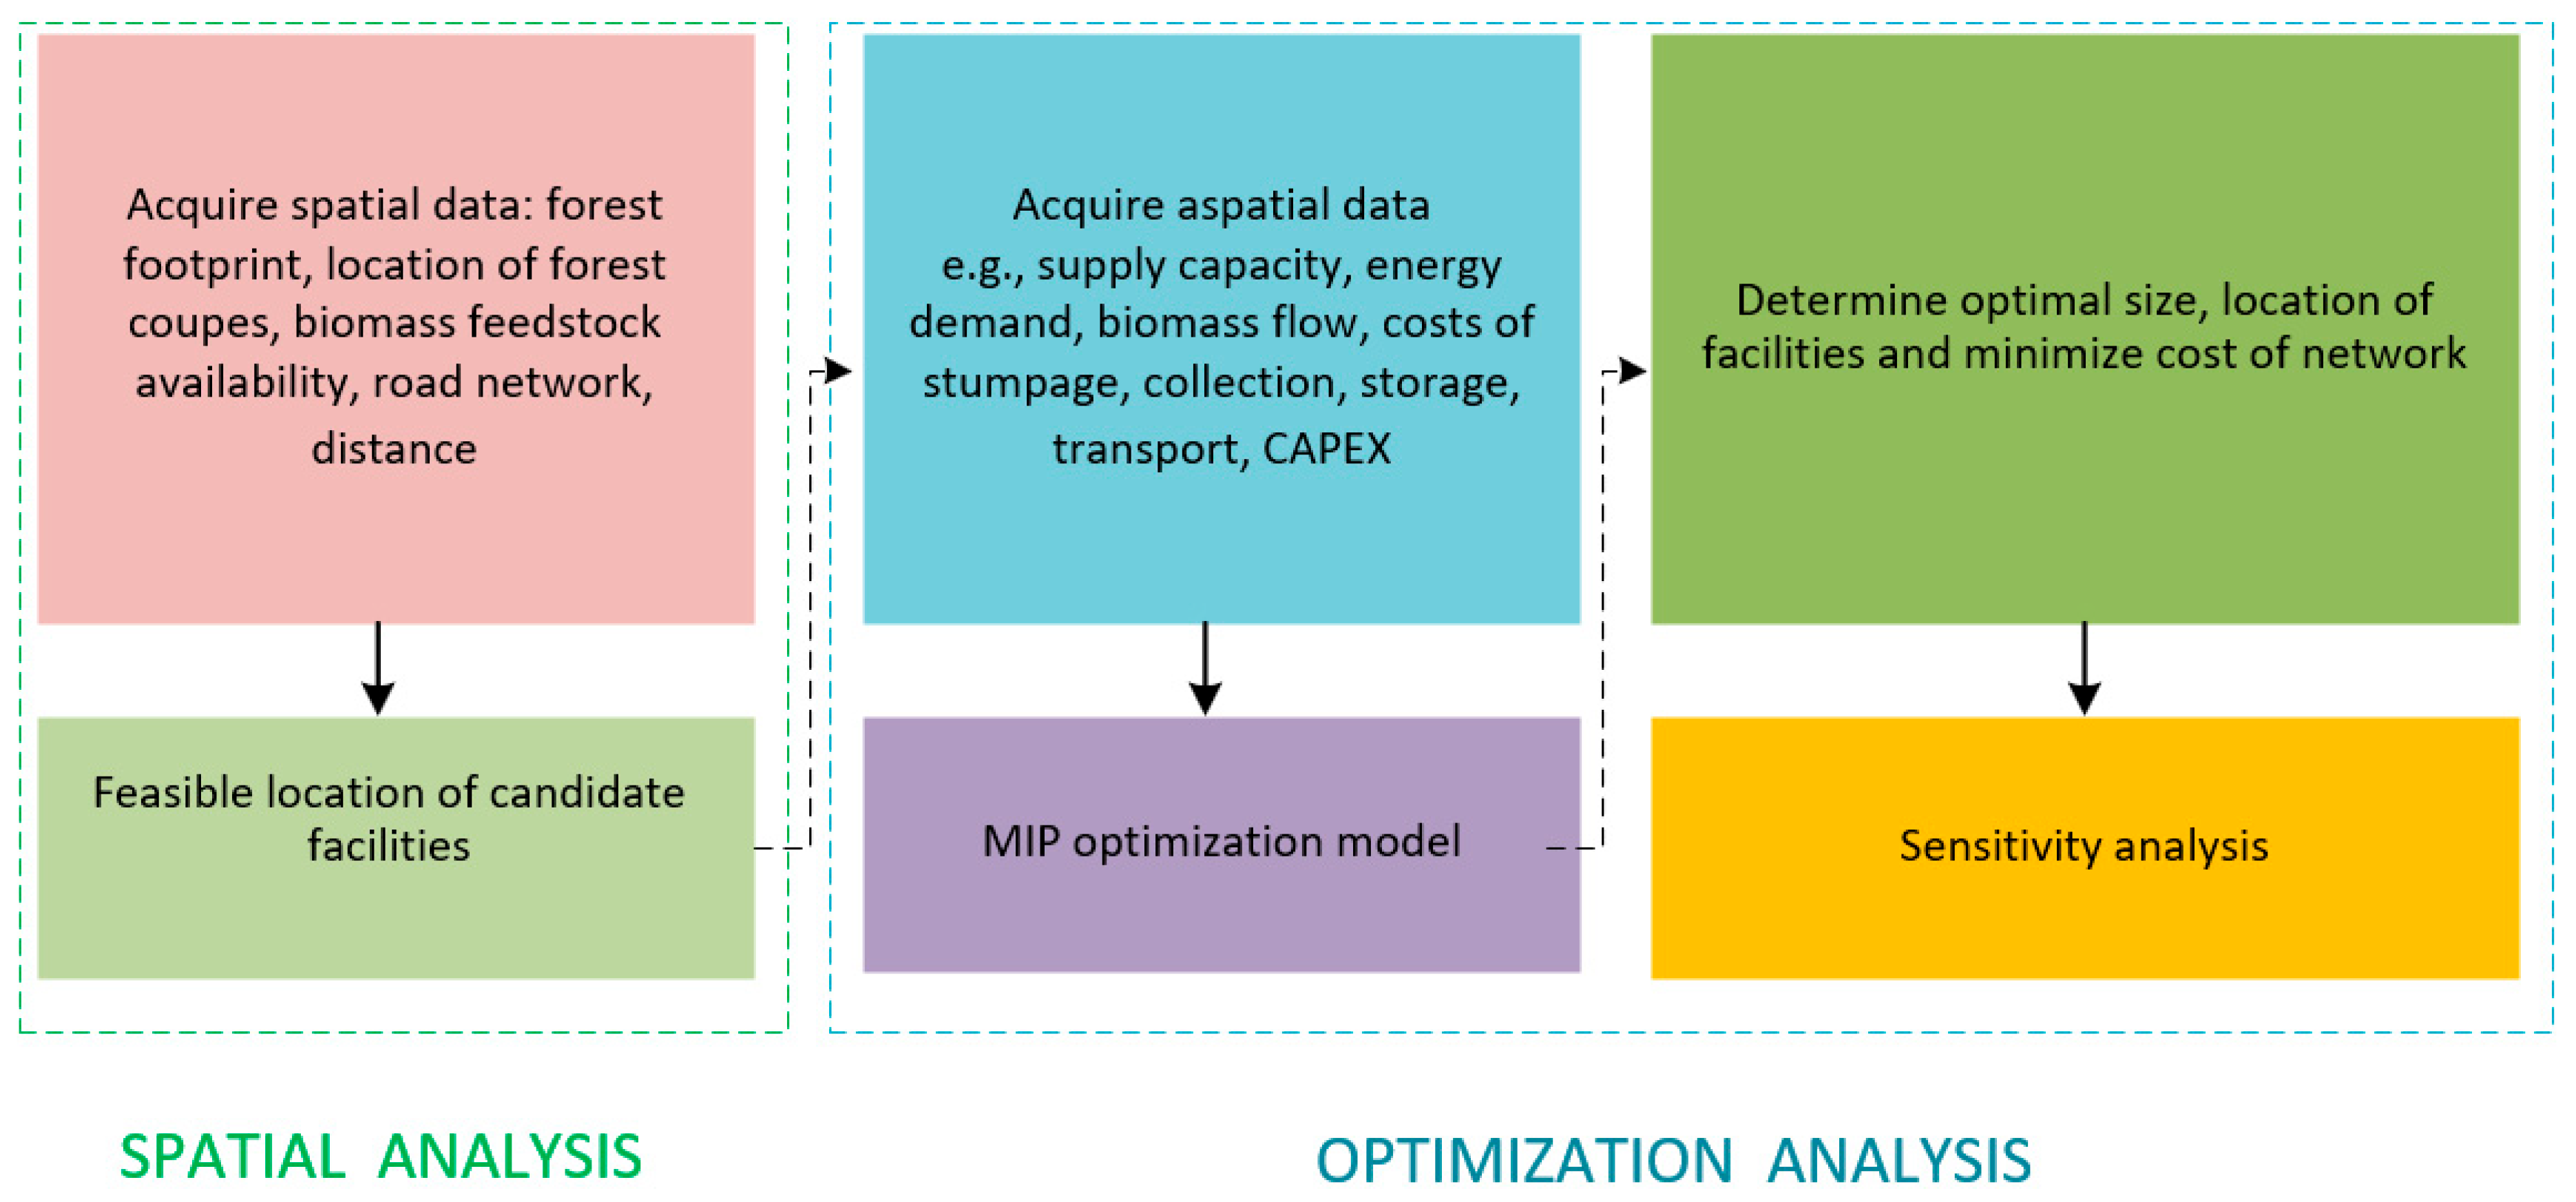
Figure 1. Overview of the methodology integrating GIS analysis and optimization methods.
Forests 16 01467 g001
Figure 2. Left: Study area in Queensland, Australia, showing the forest resource footprint (native forests and plantations). Right: Candidate bioenergy facility locations identified through the LISA-based GIS pre-screen.
Forests 16 01467 g002
Figure 3. Breakdown of operational cost components (million AUD) in the supply-push (biomass-driven) scenario as the minimum facility capacity increases. Costs are shown excluding installation, which typically constitutes ~97% of total cost. Collection consistently accounts for 81%–83% of operational costs, transport for ~12%, and energy use and emissions for the remainder. Data correspond to the outcomes reported in Table 4.
Forests 16 01467 g003
Figure 4. Operational cost trends under the demand-pull scenario as total energy demand increases. Collection dominates the cost structure (81%–84%), with transport (~12%), energy (~2%), and emissions (~3%) making smaller contributions. Installation costs are excluded for clarity.
Forests 16 01467 g004
Figure 5. Average operational cost per ton of biomass (AUD DMT−1) and average transport distance (km DMT−1) in the supply-push scenario (left) and demand-pull scenario (right). Operational costs include collection, transport, energy, and emissions, with installation costs excluded.
Forests 16 01467 g005
Figure 6. Sensitivity of total supply chain cost (including installation) to maximum transport distance constraints (45, 62, and 105 km). Bars show total cost at different minimum facility capacities, while lines indicate the corresponding average transport distance (km DMT−1).
Forests 16 01467 g006
Figure 7. Sensitivity of supply chain cost (including installation) to reductions in biomass availability (50%–100% of baseline). Bars show total cost at different minimum facility capacities, while lines indicate average transport distance (km DMT−1). Reduced biomass availability lowers costs but sharply reduces total installed capacity and introduces infeasibility at higher minimum facility sizes.
Forests 16 01467 g007
Table 2. Comparison of supply-push (biomass-driven) and demand-pull (energy-driven) scenarios, highlighting the primary drivers, capacity definitions, key constraints, and policy relevance in the optimization model.
AspectSupply-Push Scenario (Biomass-Driven)Demand-Pull Scenario (Energy-Driven)
Primary driverMaximize utilization of available forest biomassMeet predefined regional energy demand
Installed capacity defined byTotal biomass resource available (DMT → MW)Exogenous energy demand parameter (MW)
ObjectiveMinimize total cost while processing maximum feasible biomassMinimize total cost while meeting specified demand
Number of facilitiesMinimum required to utilize biomass within capacity and distance limitsMinimum required to satisfy demand within capacity and distance limits
Key constraintsMinimum/maximum facility capacity; maximum transport distance; biomass availabilityMinimum/maximum facility capacity; maximum transport distance; energy demand target
InterpretationProxy for bioenergy potential of the forest resourceProxy for system adequacy to meet regional energy needs
Policy relevanceInforms strategies to mobilize underutilized biomass resourcesInforms strategies to align bioenergy with energy market demand
Table 3. Summary of sensitivity analysis parameters, assumptions, and sensitivity ranges.
Model InputNotationValueSensitivity RangeRationale/Source
Max. viable transport distanceDmax105 km84–126 km (±20%)Economic break-even calculation (Equation (7)) [32,42]
Biomass availability multiplierQi10.8–1.2Reflects uncertainty in yield, access, and market competition
Table 4. Key parameters and costs of the optimized bioenergy network as functions of biomass supply availability and varying minimum demand capacity (MW).
Minimum Capacity
(MW)
Total Capacity
(MW)
Avg. Facility Size (MW)Number of FacilitiesAvg. Number of NodesInstallation Cost
(AUD)
547214348981,416,258,616
103241917351971,902,370
152141812292642,005,093
20163208311490,068,742
25143295448427,561,012
3084422280250,823,755
Table 5. Optimized bioenergy facility networks under increasing demand targets in the demand-pull scenario. The average facility capacity is rounded to the nearest MW.
Energy Capacity (MW)Average Capacity (MW)Optimal Number of Facilities Avg. Number of NodesInstallation Cost (AUD)
5051067150,000,000
1001010144300,000,000
1501312183450,000,000
2001316188600,000,000
2501517237750,000,000
3001421269900,000,000
35015233151,050,000,000
40016254581,200,000,000
45014327091,350,000,000
50012419721,500,000,000
Disclaimer/Publisher’s Note: The statements, opinions and data contained in all publications are solely those of the individual author(s) and contributor(s) and not of MDPI and/or the editor(s). MDPI and/or the editor(s) disclaim responsibility for any injury to people or property resulting from any ideas, methods, instructions or products referred to in the content.