Article

Analysis of Volatile Organic Compounds in Cinnamomum camphora Leaves by Direct Thermal Desorption–Gas Chromatography/Mass Spectrometry (DTD-GC/MS)

Hubei Academy of Forestry, Wuhan 430075, China
*
Author to whom correspondence should be addressed.
Forests 2025, 16(9), 1433; https://doi.org/10.3390/f16091433
Submission received: 7 August 2025 / Revised: 29 August 2025 / Accepted: 5 September 2025 / Published: 8 September 2025
(This article belongs to the Section Forest Ecophysiology and Biology)

Abstract

This study established a novel detection method for volatile organic compounds in forest therapy tree species based on direct thermal desorption technology. The optimized parameters included 20 mg sample loading, 110 °C desorption temperature, 30 min desorption time, and 1:30 split ratio. The optimal loading was 5–65 mg to balance the separation resolution and detection sensitivity. Desorption temperature significantly affected component detection: terpenoids accounted for the highest proportion (82.0%) at 90 °C; alkanes surged to 53.3% at 150 °C; acids (19.0%) and esters (19.4%) became dominant; and ascorbyl dipalmitate (17.3%) exceeded linalool (14.6%) at 180 °C. Chemotype analysis revealed that camphor-type leaves were dominated by camphor (72.8%) while linalool-type leaves by linalool (54.3%). Compared with steam distillation, DTD increased the camphor/linalool extraction efficiency while eliminating solvent contamination. Relative to dynamic headspace sampling, DTD mitigated the environmental interference and reduced the pretreatment time. The study confirmed that 110 °C is the optimal temperature for maximized characterization of terpenoids (63.3%), providing technical support for selecting high-terpenoid-emitting trees in forest therapy and evaluating the therapeutic efficacy. It also reveals the linkages between leaf volatiles and stand-level air composition and promotes the development of dynamic forest VOC databases.

1. Introduction

Forest therapy is an emerging industry that integrates forest resources with human health and wellness. Through multi-sensory immersive experiences (such as walking, meditation, or some other specific activities) in forest environments, individuals are exposed to and absorb beneficial factors released by forests, such as phytoncides (plant-derived antimicrobial compounds), negative oxygen ions, and specific landscapes and sounds. These experiences can promote physiological relaxation, psychological stress reduction, immune regulation, and overall health as a form of natural therapy and health management [1,2,3,4,5,6]. The health benefits of forest therapy result from the synergistic effects of multiple factors in forest environments, where phytoncides play a central role. Terpenoids, a type of volatile compounds released by trees, are key components for these benefits. When inhaled, terpenoids can trigger a series of beneficial physiological responses, such as lowering the cortisol level, enhancing NK cell activities, exerting anti-inflammatory and antioxidant effects, and influencing the limbic system via the olfactory pathway [1,5,6,7].
Camphor (Cinnamomum camphora) belongs to the Cinnamomum genus of the Lauraceae family, and is primarily distributed in tropical and subtropical regions such as southern China, India, Laos, Vietnam, Japan, and Cuba [8,9,10]. Camphor essential oil is rich in terpenoids, particularly monoterpenes such as 1,8-cineole, terpinen-4-ol, α-terpineol, linalool, and safrole [11,12], which have broad anticancer, antimicrobial, antioxidant, and anti-inflammatory activities [13,14]. Based on the chemical composition of leaf essential oil, camphor trees can be classified into the following types: camphor, linalool, cineol, iso-nerolidol, and borneol [15]. The camphor-type leaves contain camphor as the core marker, which accounts for 46% to 97% of the total essential oil. The linalool-type leaves are characterized by high concentrations of linalool, ranging from 58% to 95.92%, primarily in the form of levo- or dextro-isomers. Linalool and its derivatives are widely used in various fields such as cosmetics and pharmaceuticals. With its favorable and unique aroma, linalool is often used to blend various floral and fruity fragrances. It is the most frequently used fragrance ingredient in perfumes and other daily chemical products such as soap formulations [16]. Previous studies of camphor leaves primarily employed steam distillation or solvent extraction to isolate the essential oils, followed by analysis with gas chromatography–mass spectrometry (GC-MS). However, these approaches are generally time-consuming (3–5 h) and labor-intensive [8,9,14,17], and involve the use of organic solvents that may pose risks to the researcher and environment. Current research on the therapeutic functions of camphor volatile organic compounds (VOCs) predominantly relies on dynamic headspace adsorption combined with Tenax tube collection and GC-MS. However, this approach often suffers from cumbersome procedures, prolonged sampling time, and susceptibility to meteorological disturbances (such as wind speed and temperature). Moreover, its detection is also limited to medium- and low-molecular-weight VOCs (such as C5–C15), and often fails to capture high-molecular-weight or low-volatility compounds. For example, Zhou (2020) [18] only identified 78 VOCs in camphor leaves in a whole year, where terpenoids were dominated by α-pinene (10.70%), D-limonene (7.25%), and caryophyllene (11.66%), and the relative content of terpenes reached the peak (43.49%) in March. In another study, Zhou (2021) [19] merely detected 36 VOCs, including only five terpenoids, where camphor (16.7%) and eucalyptol (16.3%) reached the peak in September. These results highlight that these traditional approaches have limited coverage of the components. In contrast, direct thermal desorption coupled with GC-MS (DTD-GC/MS) eliminates the complex preprocessing procedures with a significantly higher analytical efficiency. DTD-GC/MS has been widely used in plant volatile analysis, but has been rarely applied to the analysis of VOCs from camphor leaves.
This study employed DTD-GC/MS to establish an analytical protocol for VOCs from camphor leaves. Through optimization of the sample loading, thermal desorption temperature, and several critical parameters, the study profiled the primary constituents of VOCs from two distinct camphor variants. The findings provide a theoretical foundation for selecting tree species with enhanced therapeutic functions and advancing research on forest therapy mechanisms.

2. Materials and Methods

2.1. Materials

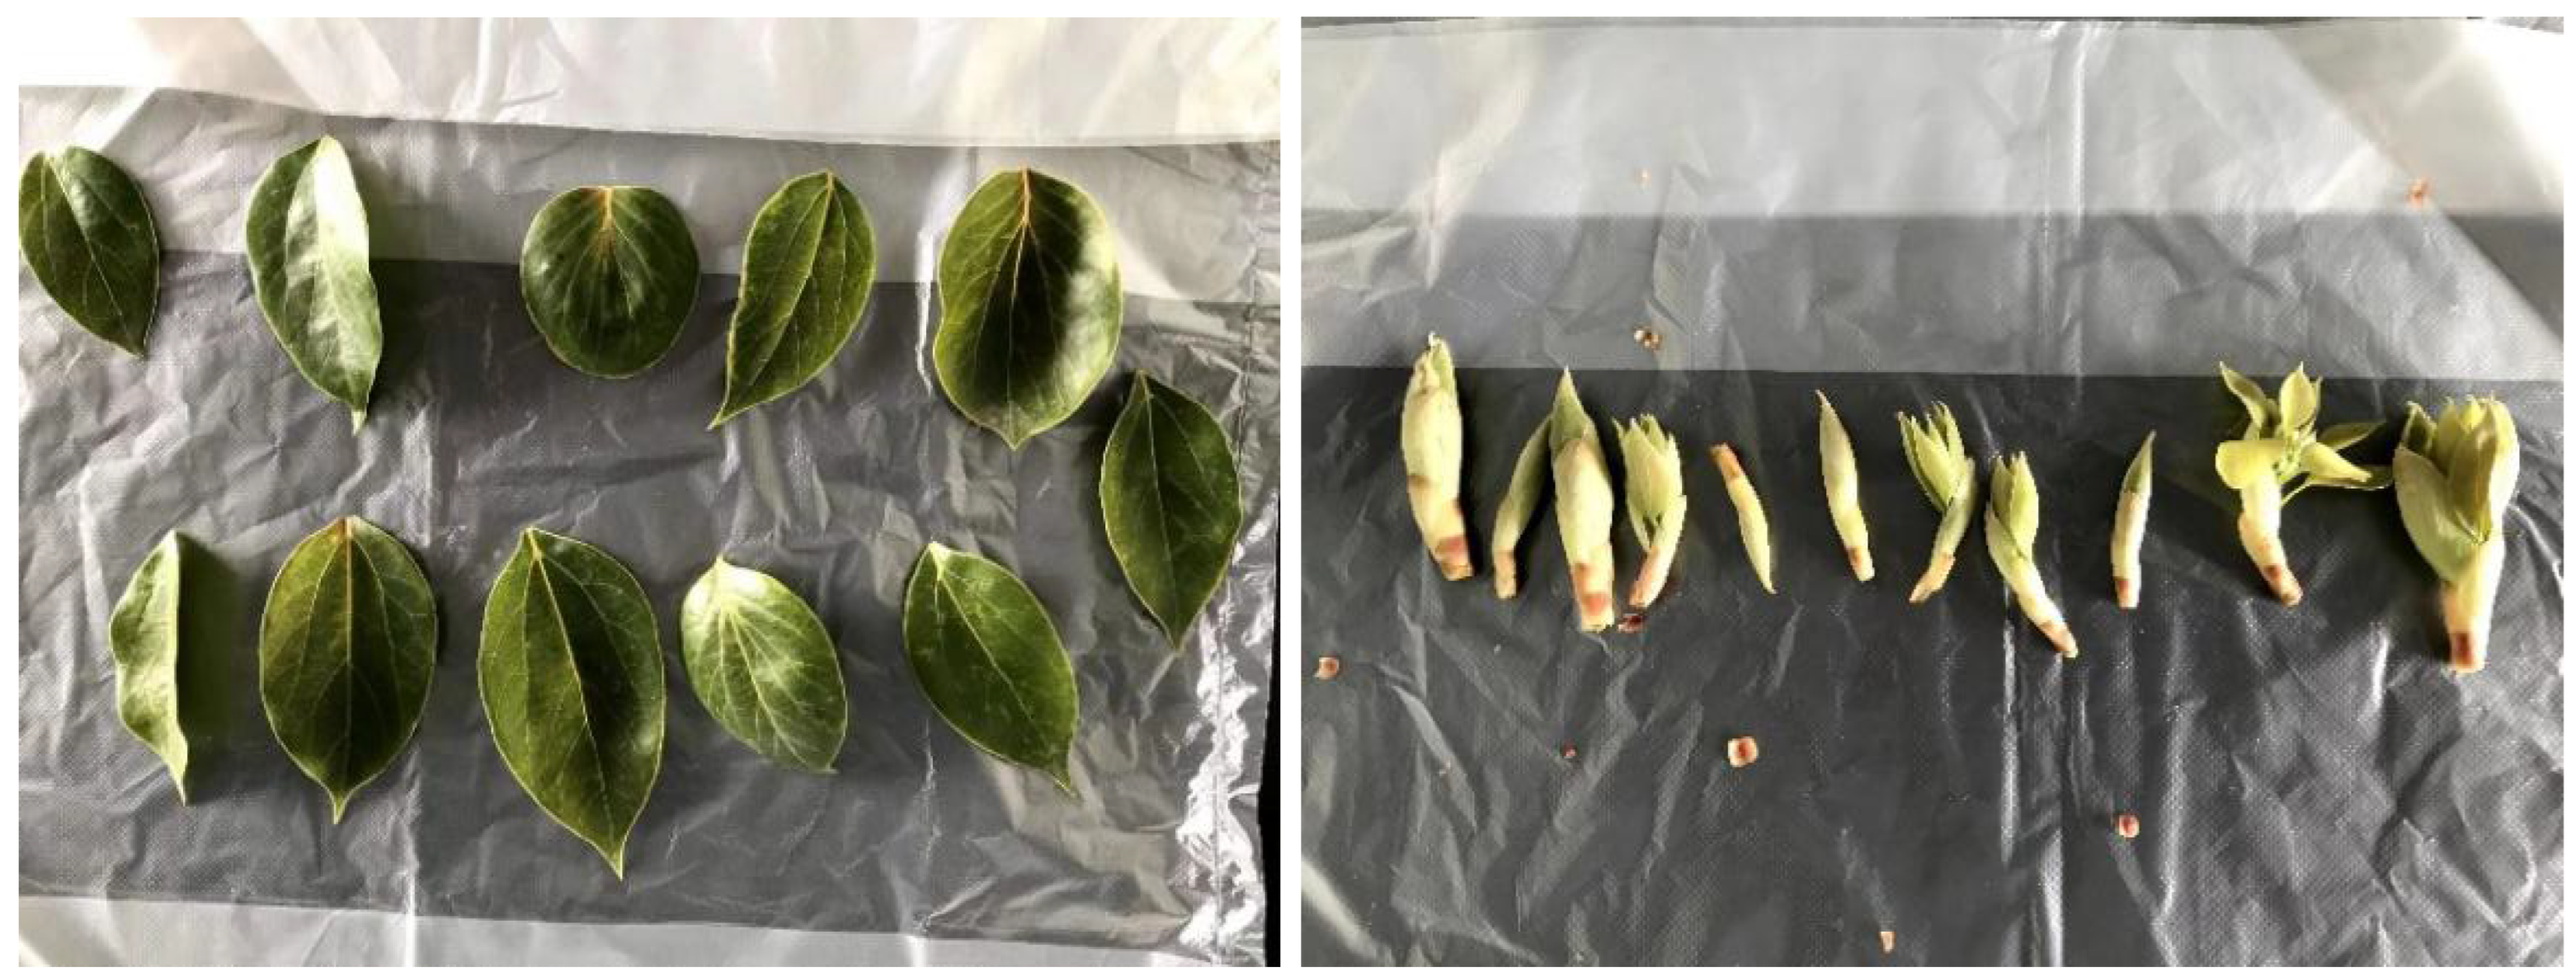
Camphor leaves were collected from Chuandian Town, Jingzhou District, Hubei Province (coordinates: 30°35′20.0″ N, 112°04′55.6″ E) (camphor-type leaves) (Figure 1) and Jiufeng National Forest Park, Wuhan City, Hubei Province (coordinates: 30°31′04″ N, 114°20′50″ E) (linalool-type leaves) (Figure 2). From 15–20 March, we collected 200 g each of dark green, thick-textured, pest-free linalool-type mature leaves, light yellow, fragile linalool-type young leaves with flower buds from the same branch, and 200 g of dark green, thick-textured, pest-free camphor-type leaves. The leaf samples were air-dried indoors at 20 ± 2 °C and 65% ± 5% relative humidity without direct sunlight and with ventilation (moisture content ≤ 8%), and then stored in Vaseline-coated wide-mouth jars for one month. For testing, one leaf was taken and cut into segments (10–30 mm long × 1 mm wide) using scissors. Approximately 20 mg of each sample was loaded into glass tubes sealed at both ends with 80-mesh stainless steel nets for subsequent analysis within 2 h, with two parallel samples per test.

2.2. Detection Instruments and Conditions

The glass tubes containing samples were loaded into the thermal desorption unit (Markes Unity Series 2, Wales, UK). The thermal desorption temperature was set to 90–180 °C [20,21,22,23,24,25,26,27], with desorption into the cold trap in a non-split mode. The cold trap temperature was maintained at −10 °C, followed by thermal desorption at 280 °C for 3 min. The transfer line temperature was set to 200 °C. The split ratio from the cold trap to the gas chromatograph (Thermo Fisher Trace 1310 GC, Bellerica, MA, USA) ranged from 1:20 to 1:100. The GC was equipped with a carrier gas (He) flow rate of 1.0 mL·min−1 and an injector temperature of 200 °C. The column temperature program was an initial temperature 70 °C, ramped at 1 °C·min−1 to 200 °C, then at 10 °C·min−1 to 250 °C, and held for 10 min. The GC was connected via a transfer line (270 °C) to the Thermo Fisher Trace ISQ LT mass spectrometer (MS, Bellerica, MA, USA). MS parameters included electron impact (EI) ionization at 70 eV, ion source temperature 280 °C, mass scan range m/z 40–650, and delayed scanning for 2–4 min.

2.3. Statistical Analysis

Characterization and preliminary identification of compounds were achieved by comparing the total ion chromatogram (TIC) peaks with the NIST mass spectral library. The relative content of each VOC was determined using the peak area normalization method [27]. Compounds were categorized and statistically analyzed into the categories of terpenoids, alkanes, esters, acids, ketones, and other compounds, as described in previous studies. Xcalibur 4.0 software (Thermo Fisher, USA) was used for data acquisition and chromatogram processing. Excel 2021was used to produce Figure 3, Figure 4, Figure 5 and Figure 6.

3. Results

3.1. Influence of Parameters

3.1.1. Influence of Loading Amount on the Peak Shape

Camphor leaves contain high concentrations of VOCs, making it essential to control the loading amount to prevent co-elution and flat peaks. At a loading amount of 80 mg of camphor leaves, a thermal desorption temperature of 90 °C for 30 min, and a split ratio of 1:20, a prolonged flat peak appeared at a retention time of 39.51 min. At a loading amount of 65 mg and a split ratio of 1:80, well-shaped peaks were obtained, but the signal intensity reached 109, indicating near-overload conditions. Conversely, a loading amount below 5 mg resulted in undetectable levels of many compounds, significantly reducing the number of identifiable VOCs.

3.1.2. Effects of Thermal Desorption Temperature on VOCs in Camphor Leaves

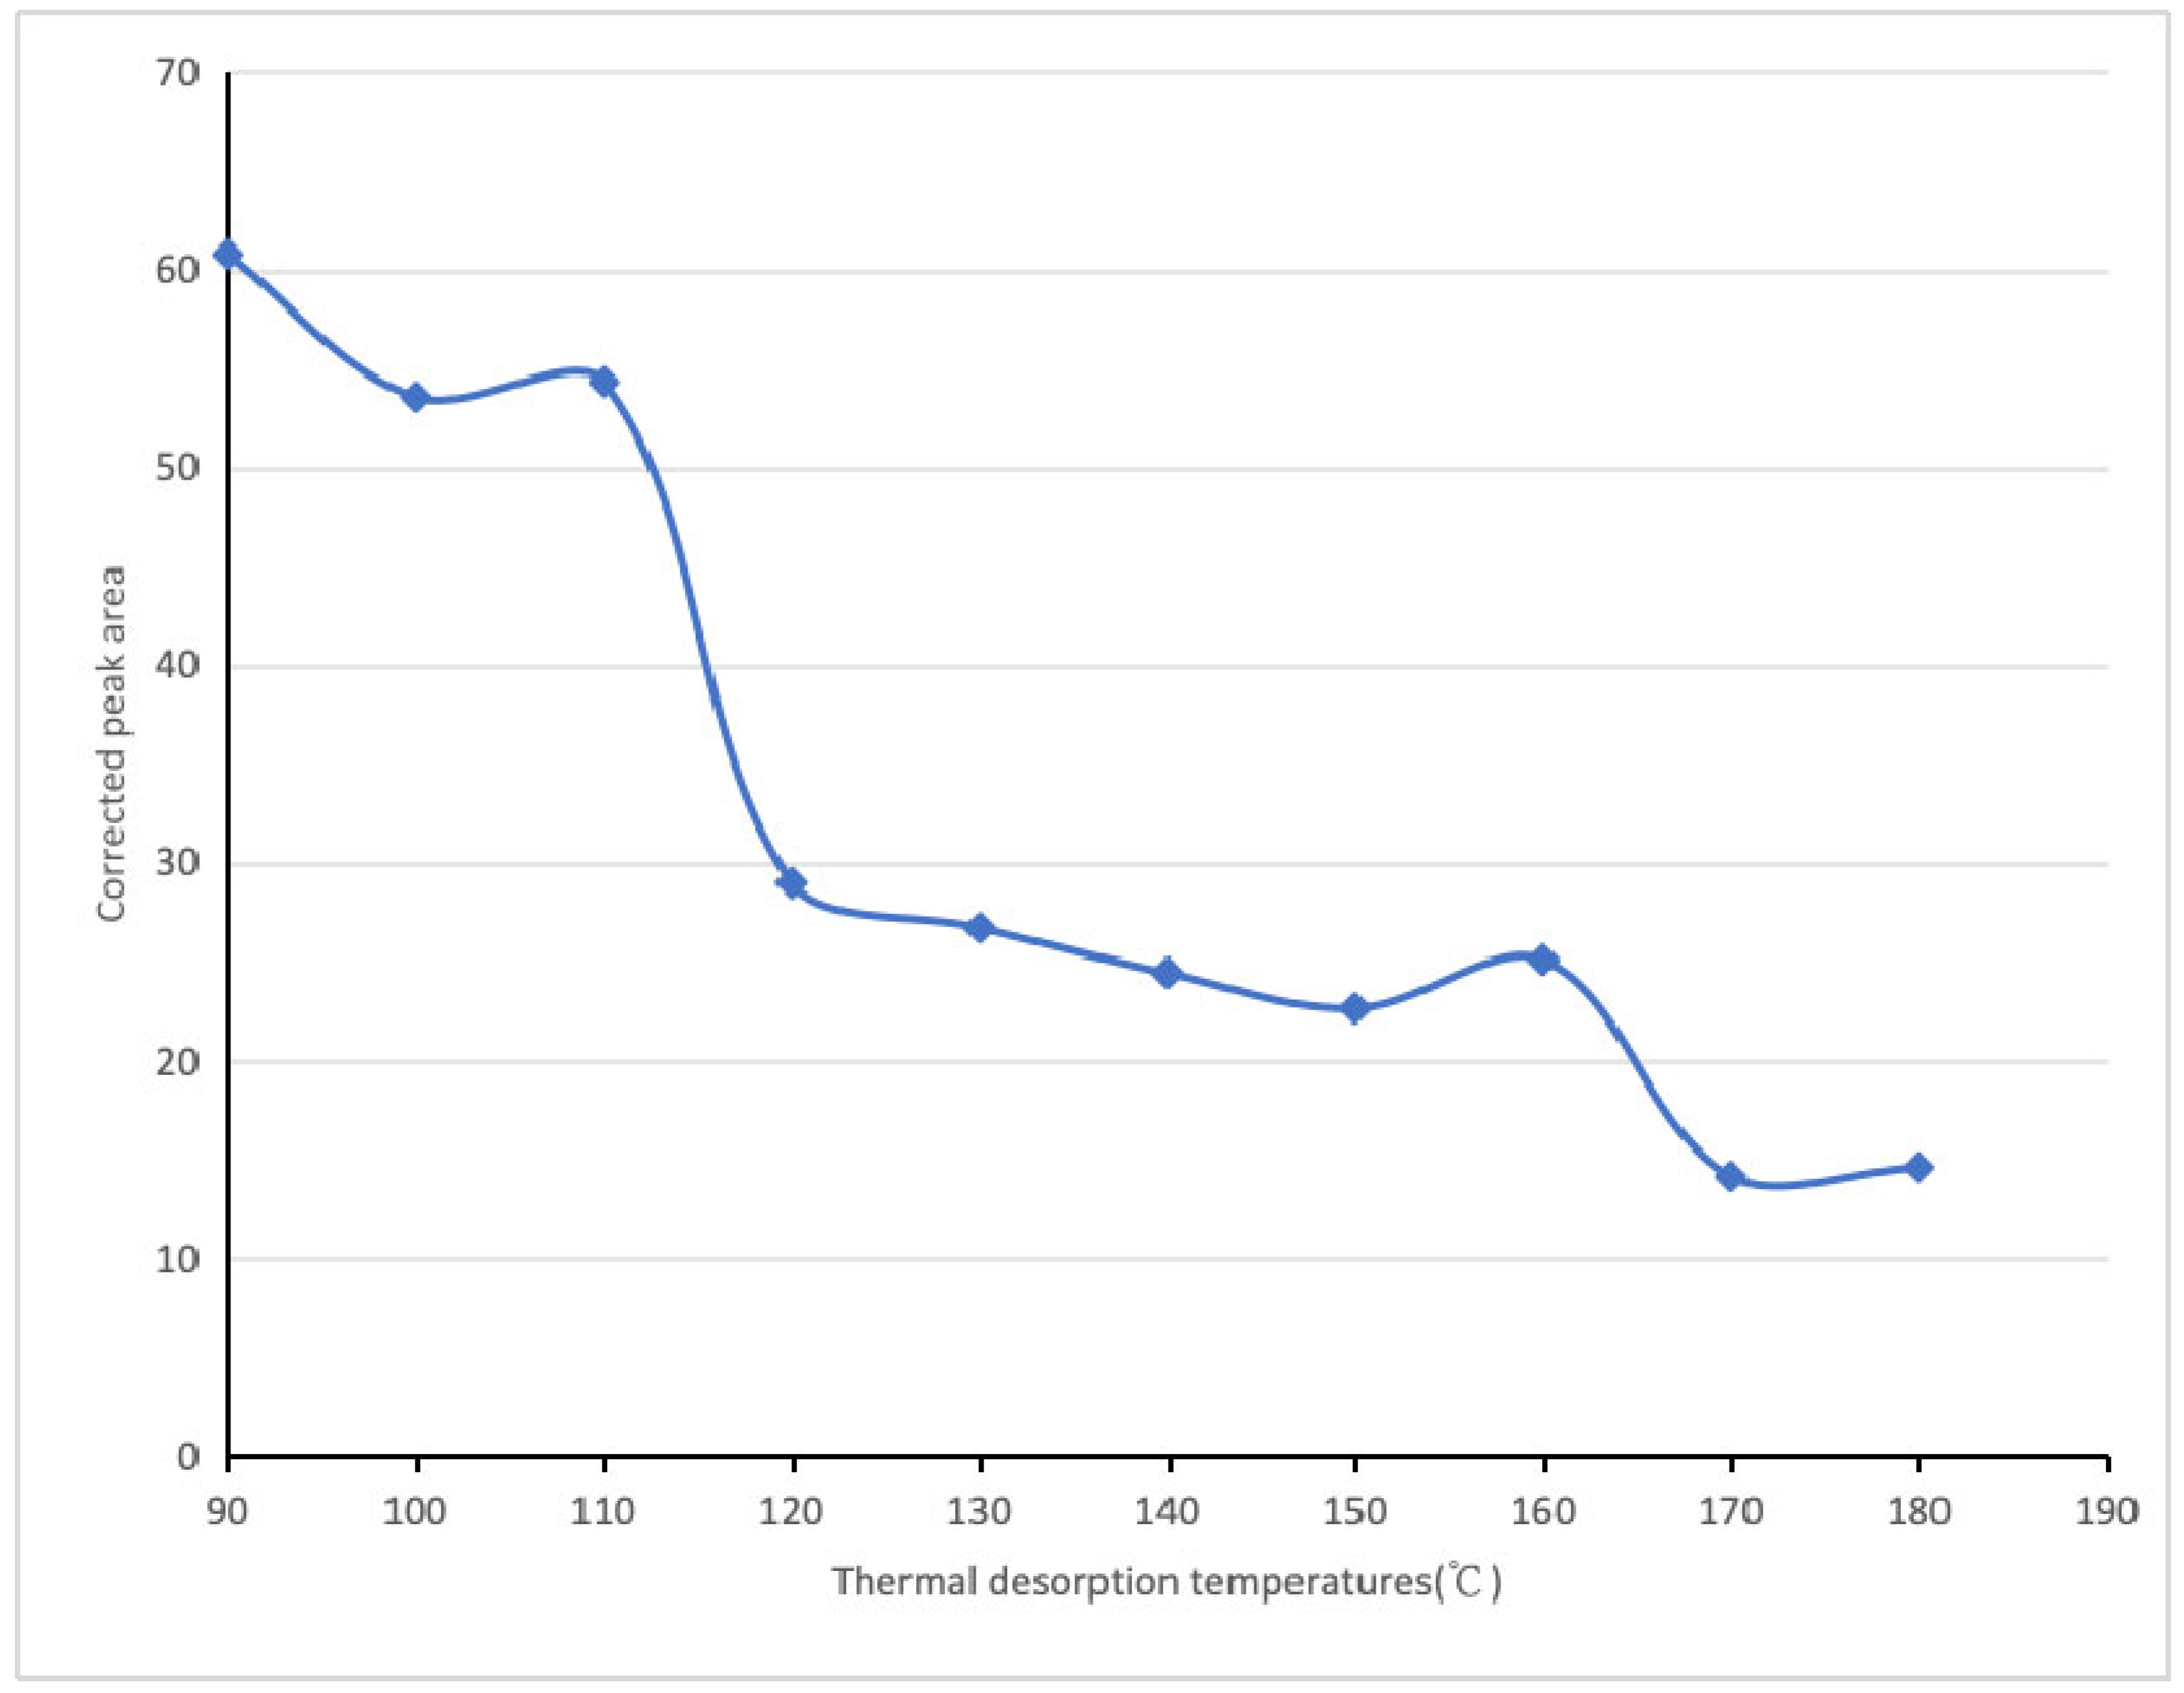
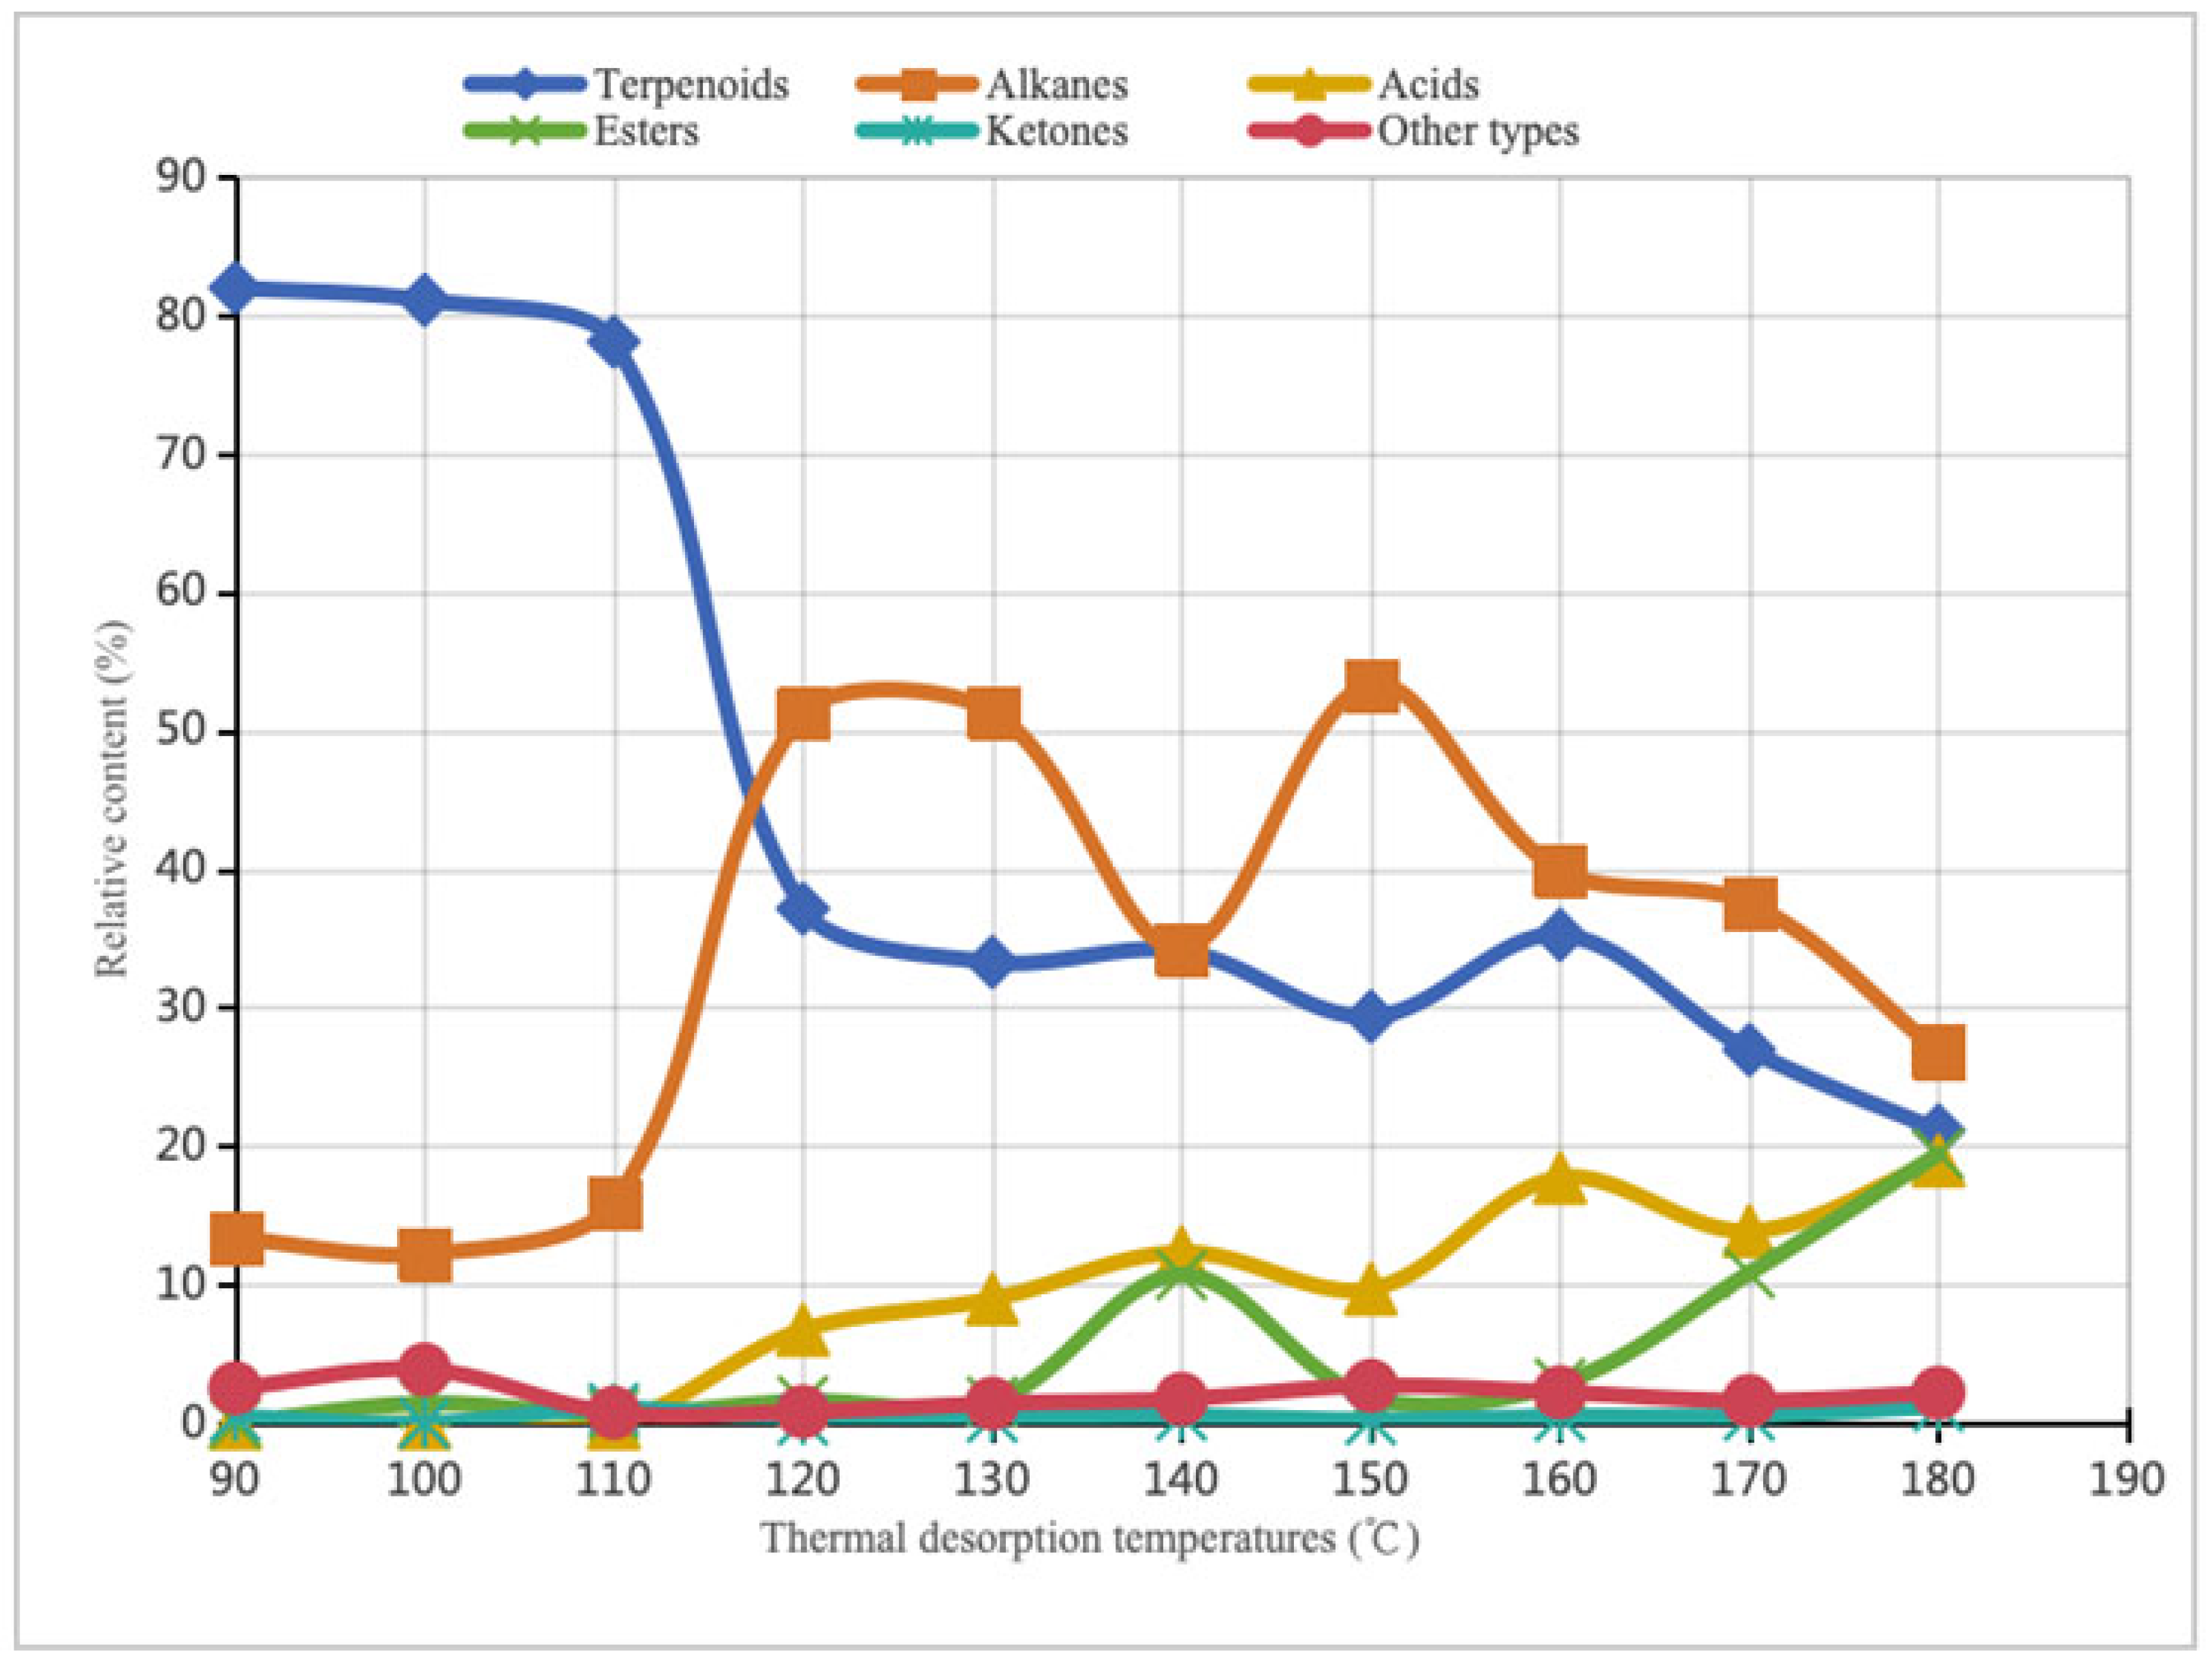
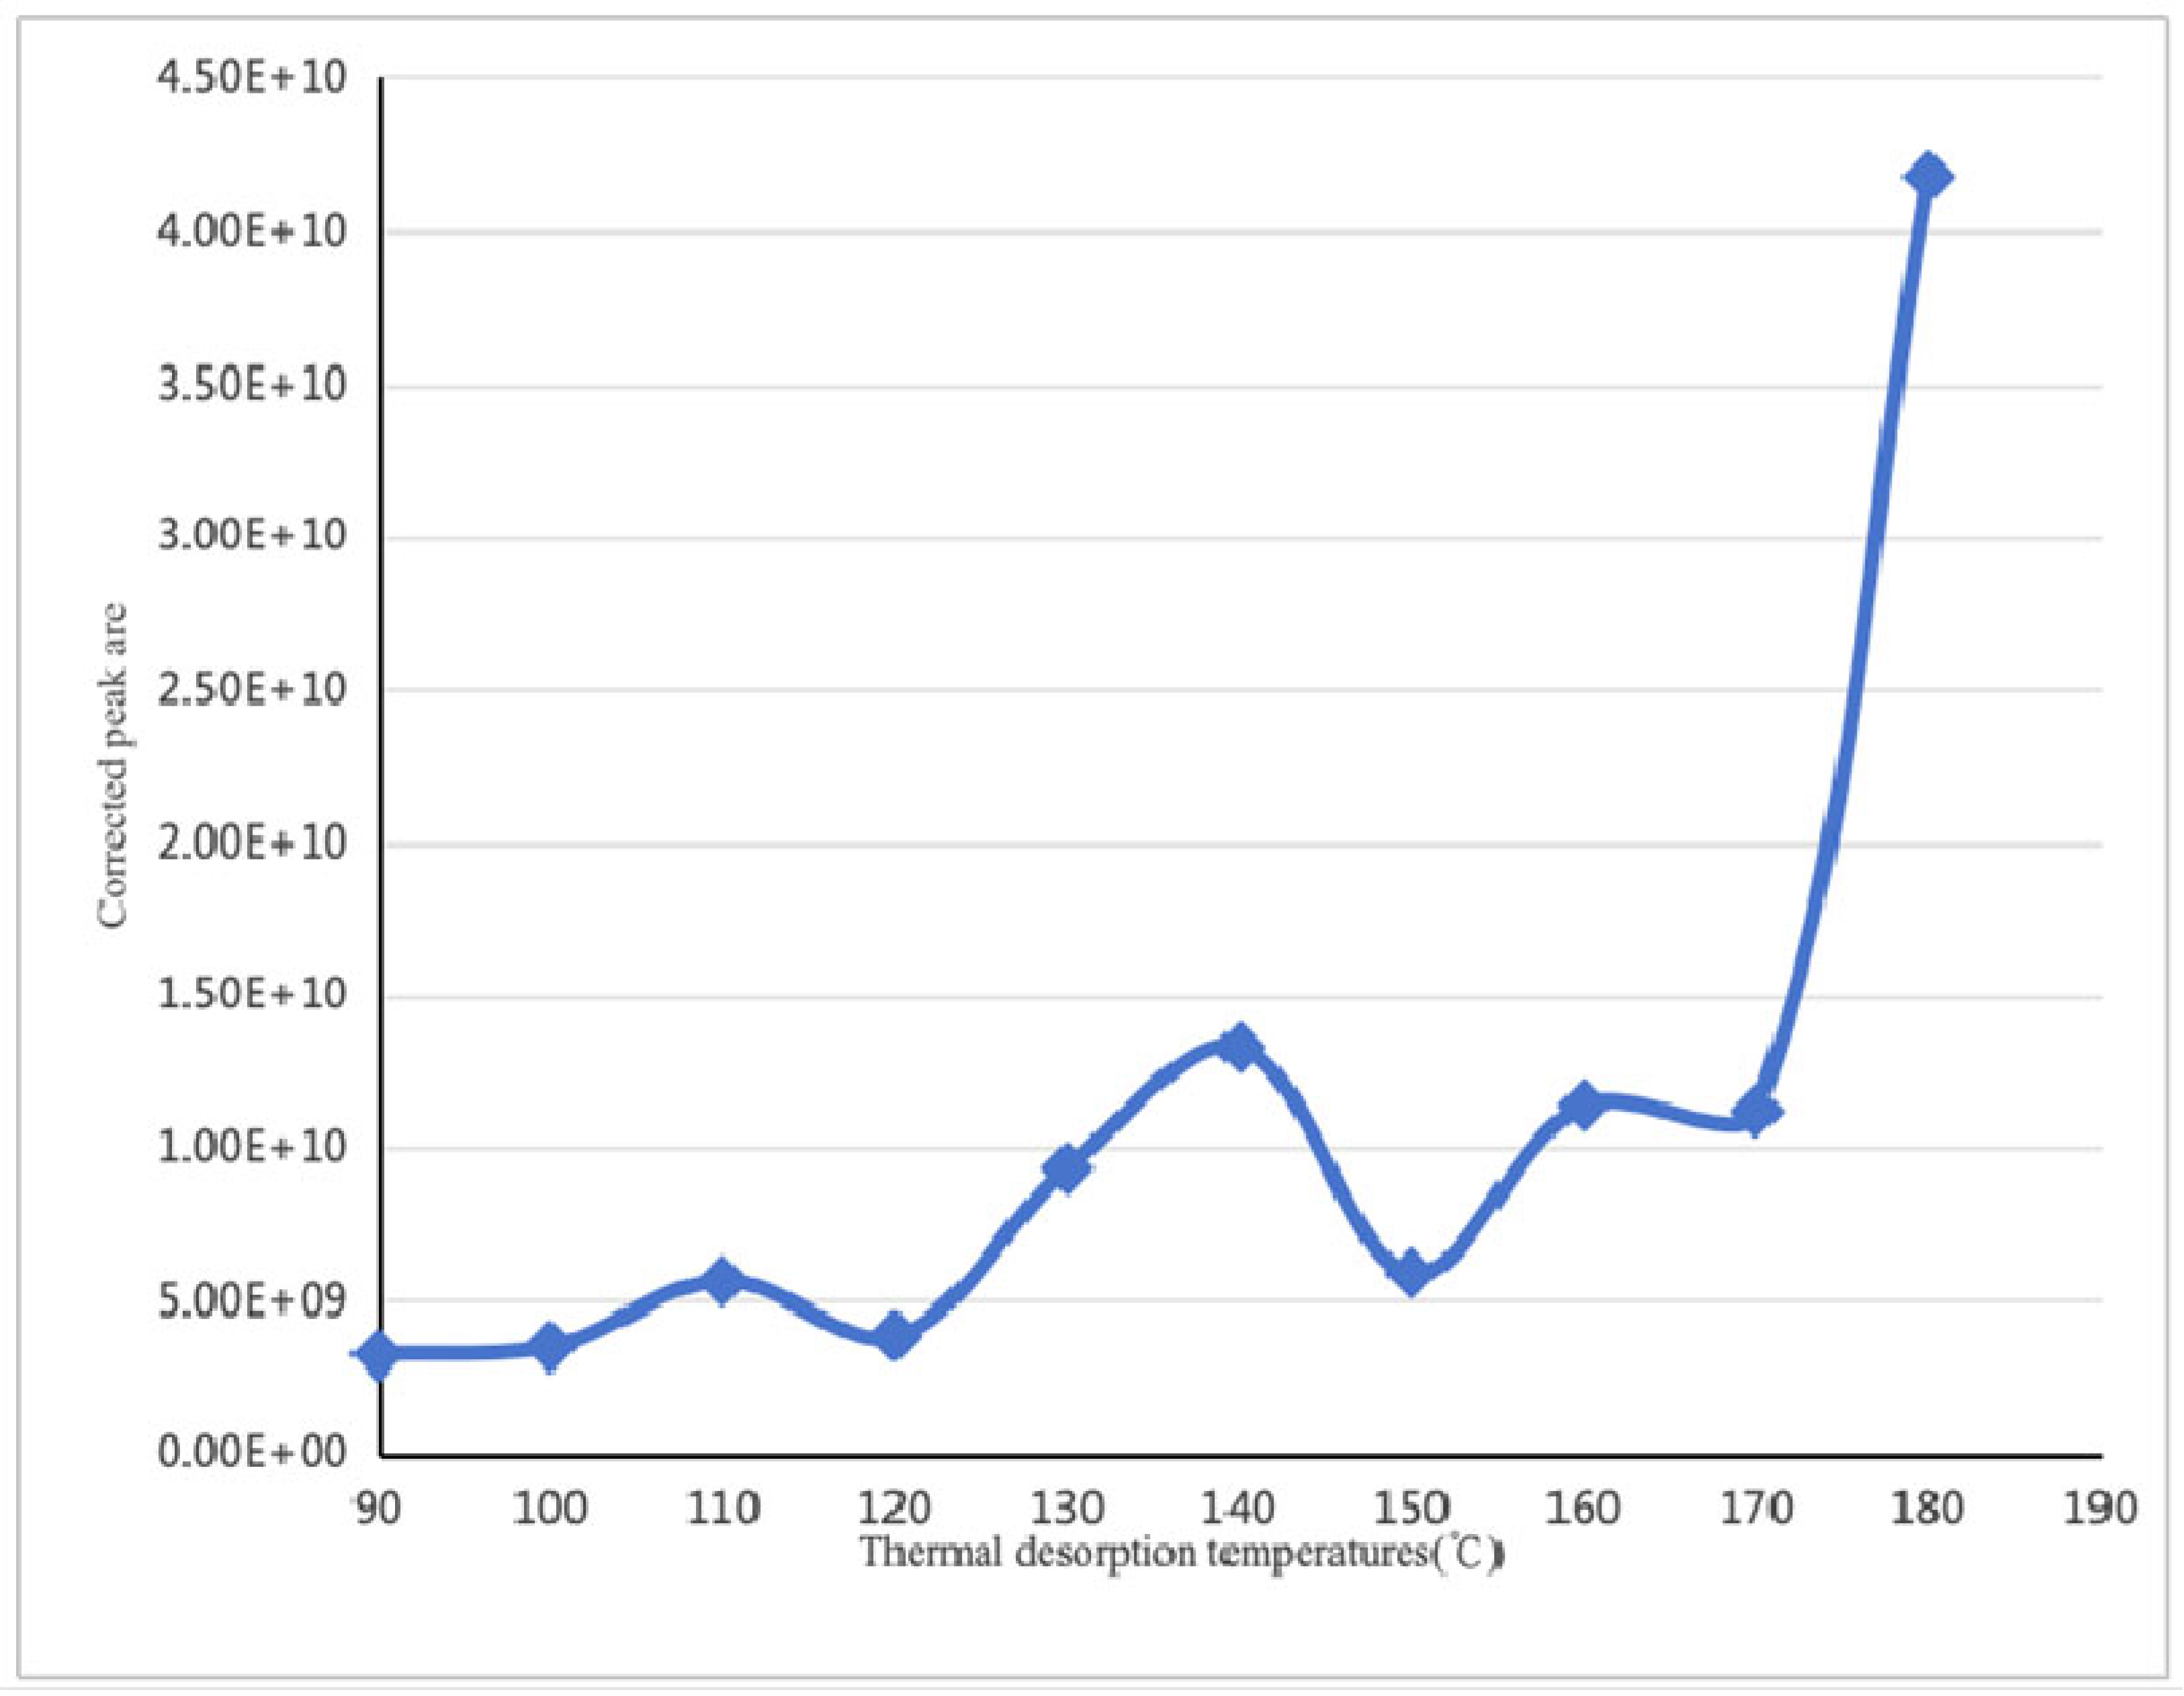
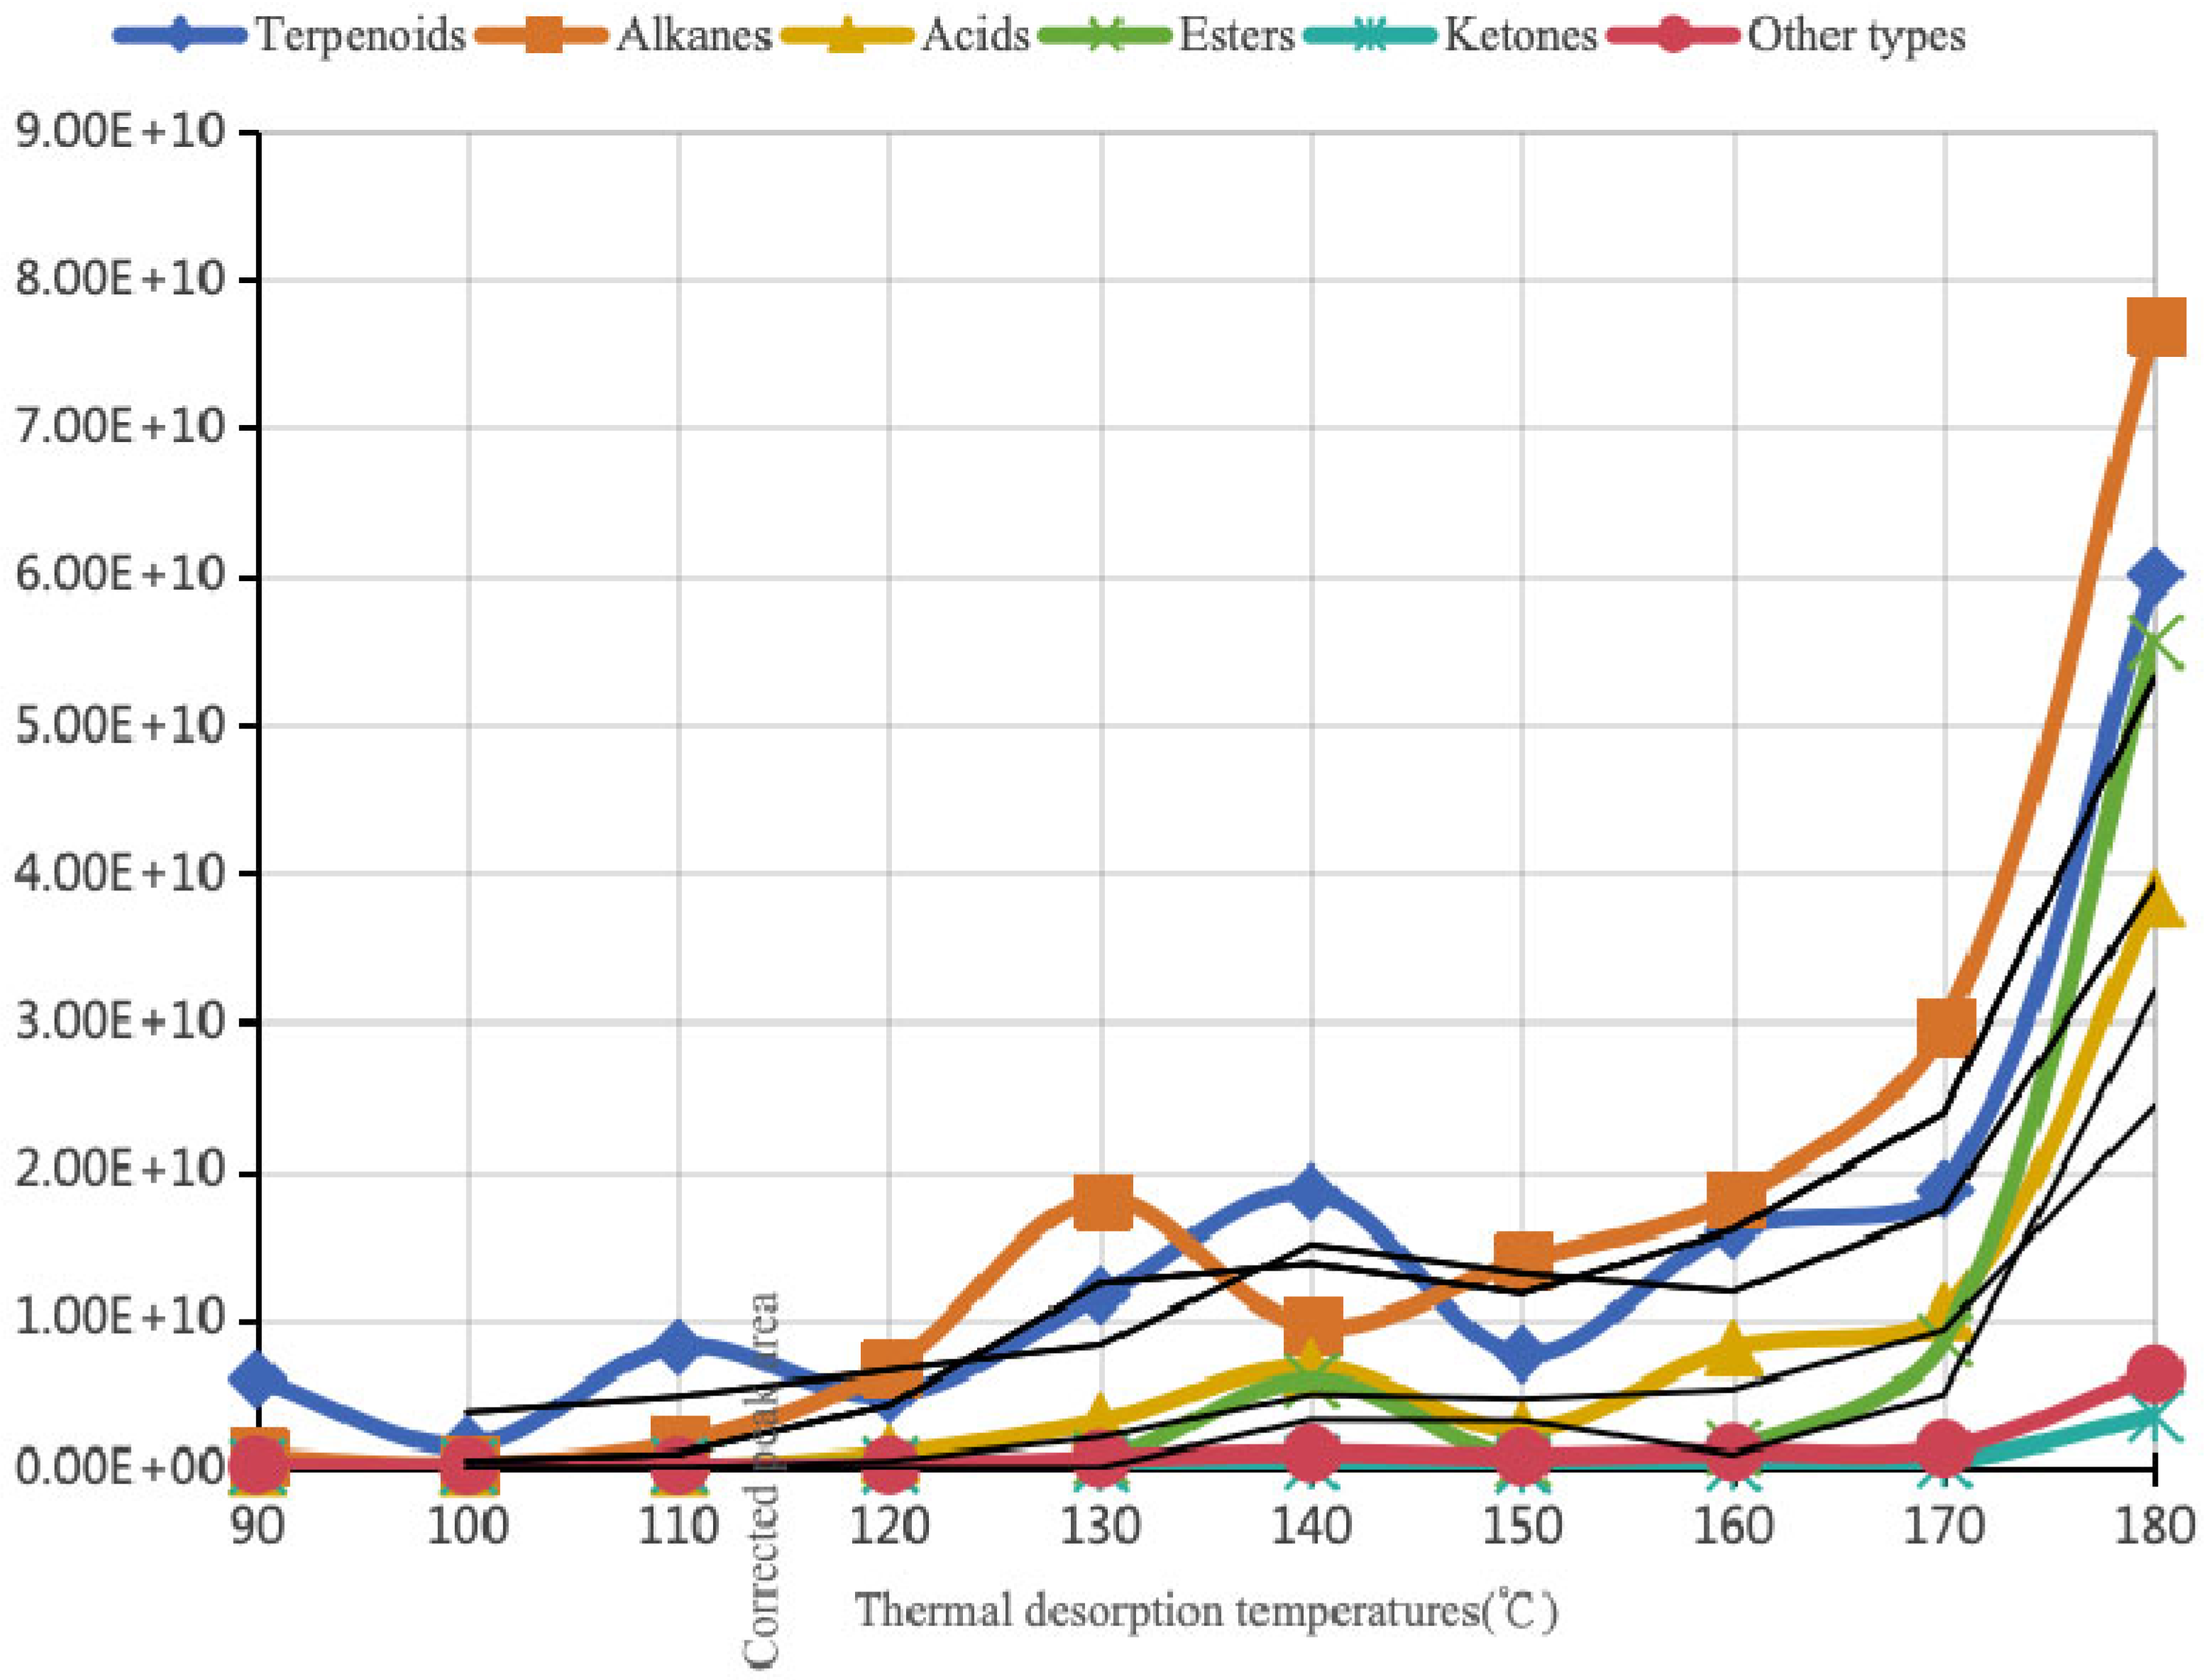
Linalool and different compounds showed variations with thermal desorption temperature. The peak areas of the top 30 compounds were normalized to those obtained with a 20 mg loading amount. Table 1 presents the peak areas and relative contents of linalool and terpenoids within the thermal desorption temperature range of 90–180 °C. The relative content of linalool (60.76%) was the highest at a thermal desorption temperature of 90 °C, while alkanes reached the maximum relative content (53.30%) at 150 °C. Acids and esters peaked at 180 °C with relative contents of 18.95% and 19.44%, respectively. Figure 3 shows that there was an inverse correlation between linalool relative content and thermal desorption temperature. As shown in Figure 4, the relative content of terpenes and their derivatives continuously decreased within the thermal desorption temperature range of 90–180 °C before stabilizing, while alkanes followed a normal distribution pattern. In contrast, acids and esters increased monotonically with rising temperature. Figure 5 and Figure 6 demonstrate positive correlations between the calibrated peak areas for linalool, terpenoids, alkanes, acids, and esters and thermal desorption temperature, whereas the relative contents of linalool and terpenoids exhibited an inverse correlation with the temperature.
The thermal desorption temperature affected the relative contents of specific chemical components. Table 2 lists the primary VOCs at different thermal desorption temperatures. At 90 °C, the relative contents of linalool, vitamin E, 2-methyl eicosane, γ-elemene, β-caryophyllene, and α-humulene were 60.76%, 13.26%, 10.28%, 2.3%, 1.83%, and 1.49%, respectively. At 100 °C, the relative contents of linalool, 2-methyl eicosane, β-pinene, γ-elemene, β-caryophyllene, α-humulene, (−)-spathulenol, α-pinene, (−)-chrysanthenyl acetate D, and camphor were 53.54%, 8.25%, 5.2%, 4.97%, 3.95%, 3.56%, 1.51%, 1.44%, 1%, and 0.97%, respectively. At 110 °C, terpenoids (19) accounted for the highest proportion (63.3%) in the top 30 VOCs. The relative contents of linalool, 2-methyl eicosane, γ-elemene, β-caryophyllene, α-humulene, (−)-chrysanthenyl acetate D, camphor, (−)-spathulenol, ocimene, α-pinene, β-elemene, elemene, myrcene, (+)-viridiflorol, and caryophyllene oxide were 54.31%, 14.54%, 7.28%, 5.34%, 4.84%, 1.88%, 0.33%, 1.32%, 0.19%, 0.11%, 0.18%, 0.35%, 0.24%, 0.23%, and 0.16%, respectively. At 120 °C, 2-methyl eicosane reached 50.53%, while linalool and terpenoids were 28.95% and 37.14%, respectively. At 130 °C, the relative contents of linalool, terpenoids, and alkanes were similar to those at 120 °C. At 140–180 °C, there were significant releases of acids and esters. At 140 °C, the relative contents of linolenic acid, stearic acid, and ascorbyl dipalmitate were 9.36%, 2.74%, and 8.36%; at 160 °C, the relative contents of pentadecanoic acid, linolenic acid, stearic acid, and 2,3-dihydro-3,5-dihydroxy-6-methyl -4H-pyran-4-one were 7.27%, 8.78%, 1.66%, and 0.19%; at 170 °C, the relative contents of linolenic acid, stearic acid, and ascorbyl dipalmitate were 11.43%, 1.9%, and 7.94%, respectively; at 180 °C, the relative content of ascorbyl dipalmitate (17.3%) exceeded that of linalool (14.58%), and that of linolenic acid was 11.59%.

3.2. Main VOCs in Camphor Leaves

3.2.1. Main VOCs in Camphor-Type and Linalool-Type Camphor Leaves

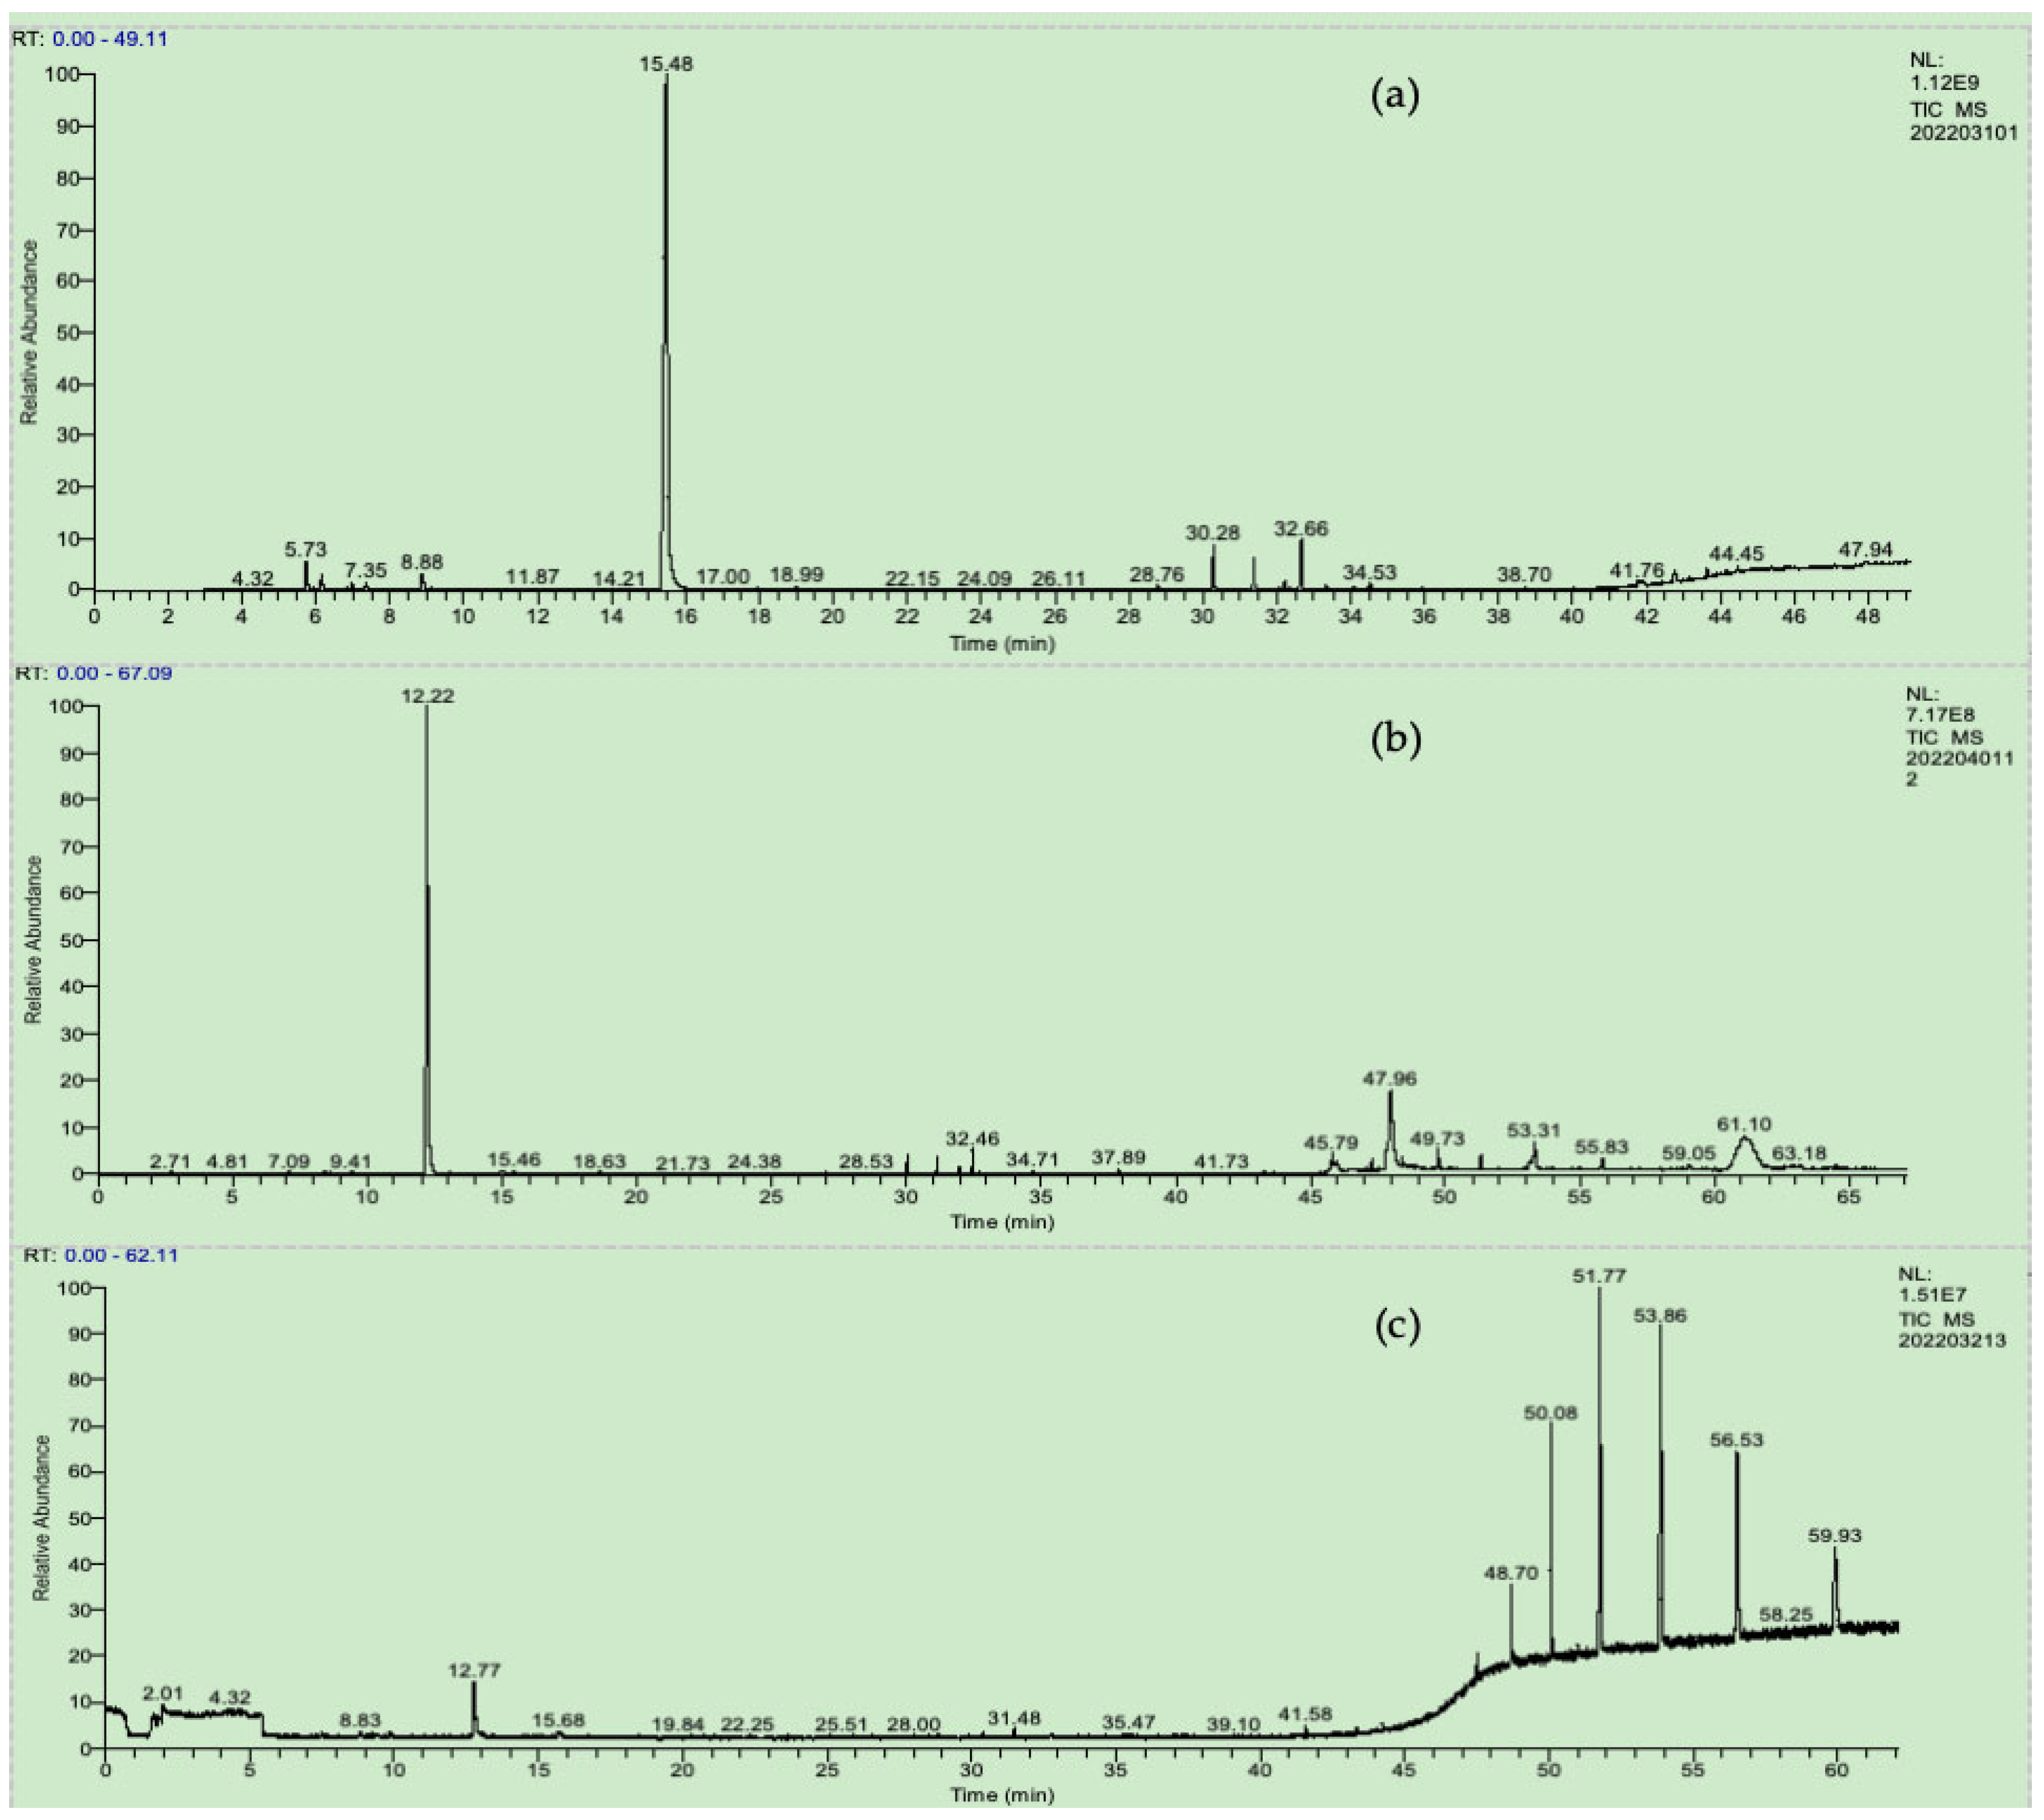
A further analysis was performed with a loading amount of 20 mg, a thermal desorption temperature of 110 °C for 30 min, and a 1:30 split ratio on camphor-type and linalool-type mature leaves. As shown in Figure 7a,b, there were significant visual differences in the GC-MS spectra of the two chemotypes. The highest peak in camphor-type leaves appeared at the retention time of 15.48 min, which was identified as camphor with a relative content of 72.8%. The highest peak in linalool-type leaves occurred at 12.22 min, which corresponded to linalool with a relative content of 54.31%. Camphor-type leaves contained 99 VOCs, while linalool-type leaves had 76 VOCs, among which 12 VOCs were shared by both types of leaves. As shown in Table 3, the secondary major VOCs were α-pinene (6.05%), β-caryophyllene (4.16%), and γ-elemene (4.16%) in camphor-type leaves, and 2-methyl eicosane (14.54%), γ-elemene (7.28%), α-humulene (4.84%), and β-caryophyllene (5.34%) in linalool-type leaves.

3.2.2. Main VOCs in Mature and Young Linalool-Type Leaves

The main VOCs in mature linalool-type leaves are described the previous section. Figure 7c shows the GC-MS spectrum of young linalool-type leaves. According to Table 3, the main VOCs were 2-methyl eicosane (68.44%), 2,6-dimethyl heptadecane (13.22%), 1-iodo-2-methyl undecane (8.19%), linalool (4.18%), and 2-methyl nonadecane (3.85%). The relative content of alkanes reached 93.7%. In contrast, the alkane content in mature linalool-type leaves was only 15.87%, indicating significant differences in primary VOCs between mature and young linalool-type leaves.

4. Discussion

In two previous studies of rose volatiles, the sample loading for DTD analysis was 20–30 mg and 10 ± 1 mg, respectively [26,27]. A previous study employed DTD with a loading amount of 20–120 mg for oak volatile compounds [22], while another study used 2–15 mg for oregano volatiles [23]. In studies of lavender volatiles, loading amounts of 10–20 mg were employed for DTD [24,25]. In this study of VOCs in camphor leaves, a loading amount at 80 mg resulted in flat peaks at 39.51 min retention time; a loading amount at 65 mg resulted in a satisfactory peak shape, but the signal intensity approached to the critical threshold; when the loading amount was below 5 mg, many compounds failed to reach the detection limit. The optimal loading may be set at 5–65 mg to achieve a balance between separation resolution and detection sensitivity.
In studies of plant VOCs, there has been great variability in the applied thermal desorption temperature, which typically ranges from 150 °C to 300 °C with no unified standards. For instance, 180 °C thermal desorption temperature was used for oregano, lavender, and multiple herbs; while 180–250 °C was employed for oak; 150 °C was applied to hops and onions; 220–280 °C was used for medicinal plant volatiles; and 300 °C was employed for cinnamon [22,23,24,25,26,27,28,29]. However, for forest therapy, terpenoids are the core bioactive compounds, and therefore require targeted optimization of the enrichment temperature. Experiments have shown that in the thermal desorption temperature range of 90–180 °C, the relative contents of linalool and terpenoids are negatively correlated with the temperature, while those of acids and esters increase significantly. At the thermal desorption temperature of 90 °C, terpenoids were dominant and the linalool content reached the peak (60.76%). Terpenoids showed minimal changes at a thermal desorption temperature between 90 and 110 °C, while alkanes surged and exceeded terpenoids in relative content at 120 °C. At 110 °C, terpenoids accounted for 63.3% of the major VOCs (19 compounds), and reached the peak in species diversity. Alkanes peaked at 150 °C (53.30%). Sugar degradation products such as pyranone derivatives (CAS:28564-83-2) emerged at 160 °C. At 180 °C, acids (18.95%) and esters (19.44%) became dominant, with ascorbyl dipalmitate (17.3%) and linolenic acid (11.59%) becoming predominant. Although over 200 VOCs were detected, active terpenoids showed dramatic decline. Thus, for forest therapy objectives, a thermal desorption temperature of 110 °C can maximize the retention of terpenoids in camphor leaves, which can better meet the demand for bioactive compounds [27,30].
In the thermal desorption temperature range of 90–180 °C, the peak areas of all compounds (such as linalool, terpenoids, alkanes, and esters) exhibited positive correlations with the temperature. However, the relative contents of linalool and terpenoids showed negative correlations due to the faster increase in peak areas of acids and esters, which diluted the relative proportion of linalool, terpenoids, and alkanes. The relative content of alkanes approximately followed a normal distribution with temperature, while acids and esters maintained a positive correlation. For some specific alkanes such as 2-methyl eicosane, the relative content increased with rising temperature, peaked at 120 °C, and then gradually declined, but still remained among the top 30 compounds. Since compound identification solely relied on mass spectral database matching without verification using certified reference materials (CRMs), the precise variation patterns of eicosane and tetracosane cannot be accurately characterized. Nevertheless, these compounds were confirmed as alkanes (not terpenoids, acids, or esters), ensuring that their classification does not affect the assessment of therapeutic plant efficacy. Similarly, for terpenoids, the relative content variation in individual compounds cannot be precisely described without CRM validation. However, trends for different categories of compounds (such as terpenoids as a class) can still be defined based on thermal desorption temperature changes.
On the above basis, this study analyzed the VOCs in camphor-type and linalool-type leaves through DTD-GC-MS under optimized conditions, including a loading amount of 20 mg, a thermal desorption temperature of 110 °C for 30 min, and a split ratio of 1:30. Camphor-type leaves contained 99 compounds, which were dominated by camphor (72.8%), followed by α-pinene (6.05%), β-caryophyllene (4.16%), and γ-elemene (4.16%). Linalool-type leaves contained 76 compounds, which were dominated by linalool (54.31%), followed by 2-methyl eicosane (14.54%), γ-elemene (7.28%), α-humulene (4.84%), and β-caryophyllene (5.34%). Twelve compounds were commonly detected in both chemotypes. Compared with traditional steam distillation (71.91% of linalool content in 46 compounds; 46.28% of camphor content in 34 compounds) [11], DTD significantly enhanced the extraction efficiency (camphor +26.5%, linalool +7.4%) and compound detection efficiency while eliminating the use of organic solvents and simplifying the procedures. Relative to dynamic headspace sampling [16,17], DTD achieved consistent detection of terpenoids (such as linalool and α-pinene) but eliminated the environmental interference and reduced the pretreatment time by >80%, as well as significantly improved the reproducibility. This method provides robust technical support for efficient chemotype identification and therapeutic function assessment of camphor trees.
Analysis of linalool-type leaves revealed six VOCs in young leaves, with linalool accounting for 4.18% and alkanes dominating at 93.7% in relative content. Young and mature leaves shared only two compounds, namely linalool and 2-methyl eicosane, and the relative contents of 2-methyl eicosane were 68.44% and 14.54%, respectively. This aligns with the previous finding that camphor-stand VOCs are predominantly terpenoids and alkanes, with terpenoids being dominant in May and August but alkanes being dominant in February [31]. These seasonal variations stem from different developmental stages. In February (bud stage), young leaves exhibit extremely high alkane contents (>90%), while mature leaves in May/August release abundant terpenoids (>60%). This study further indicates that alkanes in forest ecosystems are partially derived from leaves, and DTD-based leaf analysis can partially reflect forest atmosphere composition.

5. Conclusions

This study demonstrates the significant applicability of DTD-GC-MS in analyzing VOCs from therapeutic tree species. In a forest therapy context, this method enables precise profiling of VOCs released by different tree species through direct thermal desorption of plant samples to identify typical bioactive components specific to forest stands. It can also support the construction of dynamic VOC databases for forest ecosystems and serve as an auxiliary tool for identifying chemotypes in camphor leaves (such as camphor-type and linalool-type). By analyzing the leaf volatiles across plant species and seasons, it can provide a scientific basis for optimizing tree species selection (such as prioritizing high-terpenoid-emitting plants) and evaluating the therapeutic efficacy in forest therapy bases. A key issue that warrants further research is the correlation between DTD-measured leaf volatiles and actual in-forest emissions, particularly regarding the influencing mechanisms of environmental factors on the migration and transformation of VOCs.

Author Contributions

Conceptualization, Y.W. and G.L.; methodology, G.L.; formal analysis, Y.H.; investigation, F.C.; writing—original draft preparation, J.H. All authors have read and agreed to the published version of the manuscript.

Funding

This research was funded by the Hubei Academy of Forestry Science Research Fund, grant number 22LX202411, and the Hubei Provincial Forestry Bureau Forestry Science and Technology Innovation Fund, grant number [2025]LKZC08.

Data Availability Statement

Data is contained within the article.

Conflicts of Interest

The authors declare no conflicts of interest.

References

  1. Choi, Y.; Kim, G.; Park, S.; Lee, S.; Kim, S.; Kim, E. Statistical Evidence for Managing Forest Density in Consideration of Natural Volatile Organic Compounds. Atmosphere 2021, 12, 1113. [Google Scholar] [CrossRef]
  2. Levy, C.M.; Riederer, A.M.; Simpson, C.D.; Gassett, A.J.; Gilbert, A.J.; Paulsen, M.H.; Silva, L.K.; Bhandari, D.; Newman, C.A.; Blount, B.C.; et al. Effects of filtered vs. non-filtered forest air on stress-related psychophysiological outcomes: A randomized crossover trial. Environ. Res. 2025, 276, 121482. [Google Scholar] [CrossRef]
  3. Zhang, Z.; Ye, B. Forest Therapy in Germany, Japan, and China: Proposal, Development Status, and Future Prospects. Forests 2022, 13, 1289. [Google Scholar] [CrossRef]
  4. Chen, H.; Meng, Z.; Luo, J. Is forest bathing a panacea for mental health problems? A narrative review. Front. Public Health 2025, 13, 1454992. [Google Scholar] [CrossRef]
  5. Xu, R.Y.; Gong, D.C.; Meng, X.X.; Lin, Y.J.; Li, Z.; Chen, S.J.; Chen, X.; Chang, Q.H.; Liang, Y.; Wang, L.; et al. Spatio-temporal variations, influential factors and environmental health assessment of negative air ions (NAIs) in Hainan tropical rainforests. China Environ. Sci. 2025, 45, 657–670. [Google Scholar]
  6. Chen, X.; Gong, D.; Liu, S.; Meng, X.; Li, Z.; Lin, Y.; Li, Q.; Xu, R.; Chen, S.; Chang, Q.; et al. In-situ online investigation of biogenic volatile organic compounds emissions from tropical rainforests in Hainan, China. Sci. Total Environ. 2024, 954, 176668. [Google Scholar] [CrossRef] [PubMed]
  7. Wu, J.; Wang, Q.; Xu, C.; Lun, X.; Wang, L.; Gao, Y.; Huang, L.; Zhang, Q.; Li, L.; Liu, B.; et al. Biogenic volatile organic compounds emitted by Pinus tabuliformis mitigate under-canopy ozone concentrations and their healthcare effects in forest therapy bases. Sci. Total Environ. 2024, 931, 172944. [Google Scholar] [CrossRef]
  8. Zhang, B.H.; Xiao, Z.F.; Wang, Y.B.; Zhang, H.Y.; Li, F.; Cheng, H.J.; Jin, Z.N. Review on Chemotypes and Essential Oil Accumulation of Cinnamomum camphora. For. Sci. 2020, 48, 623–630. [Google Scholar]
  9. Li, J.X.; Meng, B.B.; Zhu, K. Components and Antioxidant Activity of Camphor Leaves Essential Oil. Chem. Ind. For. Prod. 2020, 40, 84–90. [Google Scholar]
  10. Hu, W.J.; Gao, H.D.; Jiang, X.M.; Yang, H.K. Analysis on Constituents and Contents in Leaf Essential Oil from Three Chemical Types of Cinnamomum camphora. J. Cent. South Univ. For. Technol. 2012, 32, 186–194. [Google Scholar]
  11. Tao, G.F.; Deng, J.K.; Sun, H.D. The chemical constituents of the essential oil from leaves of Cinnamomum Longepaniculatum in Hubei. China J. Wuhan Bot. Res. 2010, 20, 75–77. [Google Scholar]
  12. Yang, N. Mechanism of Cinnamomum camphora essential oil for analgesia based on gas chromatography-mass spectrometry integrated network pharmacology. Asian J. Tradit. Med. 2023, 18, 87–97. [Google Scholar]
  13. Sharma, N. Folkare and modern pharmacology of camphor (Cinnamomum camphora Nees & Eberm): Review. Sch. Int. J. Tradit. Complement. Med. 2021, 4, 128–135. [Google Scholar]
  14. Alabadi, R.B.; Kolkar, K.P.; Meti, N.T. Camphor tree, Cinnamomum camphora (L.); Ethnobotany and pharmacological updates. Biomedicine 2021, 41, 181–184. [Google Scholar] [CrossRef]
  15. Shi, Y.Y.; He, W.; Wen, G. Clasification and composition of essential oils. J. Integr. Plant Biol. 1989, 47–52. [Google Scholar]
  16. Jiang, Y. Study on The Change Law of The Main Components in Essential Oil of Linalool—Type Cinnamomum camphora (L.) Presl Leaves. Guangxi Sci. Technol. 2018, 16, 1–12. [Google Scholar]
  17. Li, G.Z.; Liang, Z.Y.; Cai, L.; Chen, H.Y. Analysis on the Chemical Compositions of Oil from the Camphor Tree Leaves of Camphor Type. Bull. Bot. Res. 2017, 6, 6–11. [Google Scholar]
  18. Zhou, Q.; Wang, J.F.; Xu, Y.Q.; Xia, S.F.; Shen, F.Q.; Xu, L.Y.; Chen, Z.M. Seasonal and diurmal change laws of volatile organic compounds from leaves of Cimnamomum camphora. Guihaia 2020, 40, 1021–1032. [Google Scholar]
  19. Zhou, Q.; Wang, J.; Wu, Q.; Chen, Z.; Wang, G. Seasonal dynamics of VOCs released from Cinnamomum camphora forests and the associated adjuvant therapy for geriatric hypertension. Ind. Crops Prod. 2021, 174, 114131. [Google Scholar] [CrossRef]
  20. Perez-Coello, M.S.; Sanz, J.; Cabezudo, M.D. Analysis of volatile components of oak wood by solvent extraction and direct thermal desorption-gas chromatography-mass spectrometry. J. Chromatogr. A 1997, 778, 427–434. [Google Scholar] [CrossRef]
  21. García, M.A.; Sanz, J.; Cabezudo, M.D. Analysis of Origanum vulgarevolatiles by direct thermal desorption coupled to gas chromatography-mass spectrometry. J. Chromatogr. A 2001, 918, 189–194. [Google Scholar] [CrossRef] [PubMed]
  22. Sanz, J.; Soria, A.C.; García-Vallejo, M.C. Analysis of volatile components of Lavandula luisieri L. by direct thermal desorption–gas chromatography–mass spectrometry. J. Chromatogr. A 2004, 1024, 139–146. [Google Scholar] [CrossRef]
  23. Esteban, J.L.; Martinez-Castro, I.; Morales, R.; Fabrellas, B.; Sanz, J. Rapid Identification of Volatile Compounds in Aromatic Plants by Automatic Thermal Desorption-GC-MS. Chromatographia 1996, 43, 63–72. [Google Scholar] [CrossRef]
  24. Hartman, T.G.; Eri, S.; Khoo, B.K.; Lech, J. Direct Thermal Desorption-Gas Chromatography and Gas Chromatography-Mass Spectrometry Profiling of Hop (Humulus lupulus L.) Essential Oils in Support of Varietal Characterization. J. Agric. Food Chem. 2000, 48, 1140–1149. [Google Scholar]
  25. González-de-Peredo, A.V.; Vázquez-Espinosa, M.; Espada-Bellido, E.; Ferreiro-González, M.; Carrera, C.; Palma, M.; Barbero, G.F. Application of Direct Thermal Desorption-Gas Chromatography-Mass Spectrometry for Determination of Volatile and Semi-Volatile Organosulfur Compounds in Onions: A Novel Analytical Approach. Pharmaceuticals 2023, 16, 715. [Google Scholar] [CrossRef]
  26. Wang, H.; Yao, L. Comparative Analysis of Components Obtained from Rose Petals by Direct Thermal Desorption and Water Distillation. J. Shanghai Jiaotong Univ. (Agric. Sci.) 2013, 31, 46–51. [Google Scholar]
  27. Özel, M.Z.; Göğüş, F.; Lewis, A.C. Comparison of direct thermal desorption with water distillation and superheated water extraction for the analysis of volatile components of Rosa damascena Mill using GCxGC-TOF/MS. Anal. Chim. Acta 2006, 566, 172–177. [Google Scholar] [CrossRef]
  28. Piryaei, M. Direct thermal desorption technique as a very fast, easy and low-cost method for analysis of volatile components compounds by gas chromatography with mass spectrometry. Sep. Sci. Plus 2019, 2, 416–421. [Google Scholar] [CrossRef]
  29. Dong, Y.; Lu, N.; Cole, R.B. Analysis of the volatile organic compounds in Cinnamomum cassia bark by direct sample introduction thermal desorption gas chromatography-mass spectrometry. J. Essent. Oil Res. 2013, 25, 458–463. [Google Scholar] [CrossRef]
  30. Sun, L.-J.; Ke, X.; Wang, J.-J.; Chen, Y. Research progress on constituents and biological activities of phytoncides from forest. Chin. Tradit. Herb. Drugs 2021, 52, 7032–7043. [Google Scholar]
  31. Jian, Y.; Lin, J.; Li, J.; He, J.; Luo, Z. Temporal Dynamic Characteristics of Chemical Components and Relative Contents of Phytoncide in Five Forest Stands. J. Sichuan For. Sci. Technol. 2020, 41, 44–50. [Google Scholar]
Figure 1. Camphor-type leaves.
Forests 16 01433 g001
Figure 2. Linalool-type leaves ((Left): mature leaves; (Right): young leaves).
Forests 16 01433 g002
Figure 3. Relative contents of linalool at different thermal desorption temperatures.
Forests 16 01433 g003
Figure 4. Relative contents of different VOCs at various thermal desorption temperatures.
Forests 16 01433 g004
Figure 5. Calibrated peak areas of linalool at different thermal desorption temperatures.
Forests 16 01433 g005
Figure 6. Calibrated peak areas of different VOCs at various thermal desorption temperatures.
Forests 16 01433 g006
Figure 7. GC-MS spectra of leaves: (a) camphor-type, (b) mature linalool-type, and (c) young linalool-type.
Forests 16 01433 g007
Table 1. Calibrated peak areas of different VOCs at various thermal desorption temperatures.
Thermal Desorption Temperatures (°C)90100110120130140150160170180
LinaloolCorrected peak area3.23 × 1091.01 × 1095.64 × 1093.84 × 1099.33 × 1091.33 × 10105.90 × 1091.14 × 10101.12 × 10104.18 × 1010
Relative content (%)60.7653.5454.3128.9526.6824.422.625.0614.1114.58
TerpenoidsCorrected peak area5.94 × 1091.51 × 1098.11 × 1094.92 × 1091.16 × 10101.85 × 10107.65 × 1091.60 × 10101.87 × 10106.01 × 1010
Relative content (%)81.9581.0678.0637.1433.2834.0829.3535.2426.9421.13
AlkanesCorrected peak area6.98 × 1082.16 × 1081.65 × 1096.79 × 1091.80 × 10109.50 × 1091.39 × 10101.81 × 10102.97 × 10107.69 × 1010
Relative content (%)13.3712.2215.8751.2651.3834.2953.339.8737.5326.85
AcidsCorrected peak area0.00 × 1000.00 × 1000.00 × 1008.92 × 1083.13 × 1096.75 × 1092.53 × 1098.04 × 1091.05 × 10103.83 × 1010
Relative content (%)0006.738.9612.339.6917.7113.8718.95
EstersCorrected peak area0.00 × 1002.70 × 1076.87 × 1072.10 × 1086.03 × 1085.83 × 1094.78 × 1081.30 × 1098.57 × 1095.56 × 1010
Relative content (%)01.440.651.61.5510.691.832.8610.8319.44
KetonesCorrected peak area2.59 × 1070.00 × 1001.12 × 1082.82 × 1071.45 × 1083.00 × 1083.66 × 1072.23 × 1084.34 × 1083.47 × 109
Relative content (%)0.4901.080.210.420.550.240.490.551.2
Other typesCorrected peak area1.35 × 1086.49 × 1077.91 × 1071.12 × 1085.85 × 1089.49 × 1087.07 × 1081.02 × 1091.28 × 1096.30 × 109
Relative content (%)2.533.880.760.841.431.762.712.241.622.2
Table 2. Primary VOCs and their relative contents at different thermal desorption temperatures.
Thermal Desorption Temperatures (°C)90100110120130140150160170180
CompoundNº CASFormulaRelative Contents (%)
Linalool78-70-6C10H18O60.7653.5454.3128.9526.6824.4022.6025.0614.1114.58
dl-α-Tocopherol10191-41-0C29H50O213.26 3.26
γ-Elemene3242-08-8C15H242.34.977.282.031.642.091.742.511.61.77
Caryophyllene87-44-5C15H241.833.955.341.521.331.91.352.061.321.54
Humulene6753-98-6C15H241.493.564.841.441.21.661.351.861.23
Germacrene D23986-74-5C15H240.5611.880.540.440.650.470.740.50.52
Camphor464-48-2C10H16O0.360.970.330.220.06 0.17
(−)-Spathulenol77171-55-2C15H24O0.261.511.321.110.680.780.571.212.931.84
3,7-Octadiene-2,6-diol,2,6-dimethyl-13741-21-4C10H18O20.220.410.410.440.390.530.160.38 0.25
β-Pinene127-91-3C10H160.215.2
α-Ocimene13877-91-3C10H160.2 0.19 0.1
α-Pinene80-56-8C10H160.11.440.11
β-Elemene110823-68-2C15H240.050.170.18 0.06 0.12
γ-Elemene29873-99-2C15H24 0.35 0.090.130.090.12
α-Myrcene123-35-3C10H16 0.24 0.12
Globulol51371-47-2C15H26O 0.23 0.080.15 0.230.470.37
Caryophyllene oxide1139-30-6C15H24O 0.160.10.08
Phytol150-86-7C20H40O 0.60.481.540.540.951.52
Squalene111-02-4C30H50 0.190.070.25
Tetracosane646-31-1C24H50 14.39 14.48
Eicosane112-95-8C20H42 20.930.9322.53 4.4323.59
Eicosane, 2-methyl-1560-84-5C21H4410.288.2514.5450.5329.9718.8130.4724.8919.623.26
Tetratriacontane14167-59-0C34H70 12.31
Pentadecanoic acid1002-84-2C15H30O2 6.567.56 7.27
α-Linolenic Acid463-40-1C18H30O2 0.17 9.363.268.7811.4311.59
Octadecanoic acid57-11-4C18H36O2 2.74 1.661.95.69
l-(+)-Ascorbic acid 2,6-dihexadecanoate28474-90-0C38H68O8 8.36 7.9417.3
Butyl 9,12,15-octadecatrienoate38370-68-2C22H38O2 0.15 1.080.920.630.55
4H-Pyran-4-one, 2,3-dihydro-3,5-dihydroxy-6-methyl-28564-83-2C6H8O4 0.190.260.27
3-Octen-2-ol76649-14-4C8H16O0.370.250.60.290.36 0.240.490.27
9-Octadecenamide, (Z)-301-02-0C18H35NO 1.231.470.880.91
Table 3. Main components and relative contents of VOCs in camphor leaves.
TypesNameNº CASFormulaRelative Contents (%)
Camphor-Type LeavesLinalool-Type
Old LeavesYoung Leaves
TerpenoidsHumulene6753-98-6C15H24 4.84
β-Pinene127-91-3C10H160.660.19
Isocarvestrene13898-73-2C10H16 0.18
α-Pinene80-56-8C10H166.050.11
cis-Linalool oxide5989-33-3C10H18O2 0.12
Linalool78-70-6C10H18O 54.314.18
L(−)-Camphor464-48-2C10H16O72.80.33
3,7-Octadiene-2,6-diol, 2,6-dimethyl-13741-21-4C10H18O2 0.41
(−)-Isocaryophyllene118-65-0C15H24 0.31
Isosativene24959-83-9C15H24 0.28
Globulol51371-47-2C15H26O 0.23
(−)-β-Elemene110823-68-2C15H240.050.18
Caryophyllene87-44-5C15H244.165.34
γ-Elemene29873-99-2C15H240.140.35
Germacrene D23986-74-5C15H240.721.88
γ-Elemene3242-08-8C15H244.167.28
(−)-Spathulenol77171-55-2C15H24O0.311.32
Caryophyllene oxide1139-30-6C15H24O0.050.16
Camphene79-92-5C10H161.47
α-Myrcene123-35-3C10H160.630.24
2-Thujene28634-89-1C10H160.24
D-Limonene5989-27-5C10H161.62
trans-β-Terpineol7299-41-4C10H16O0.03
Terpinolene586-62-9C10H18O0.07
isoborneol10385-78-1C10H160.14
(−)-Terpinen-4-ol20126-76-5C10H18O0.08
α-Terpineol98-55-5C10H18O0.25
Epi-B-Santalene25532-78-9C10H18O0.04
Nerolidol7212-44-4C15H240.02
Rhodopin105-92-0C15H26O0.02
AlkanesEicosane, 2-methyl-1560-84-5C21H441.0214.5468.44
Octadecane, 2-methyl-1560-88-9C19H401.531.33
Octadecane55282-12-7C26H540.1
1-Iodo-2-methylundecane73105-67-6C12H25I 8.19
Heptadecane, 2,6-dimethyl-54105-67-8C19H40 13.22
Nonadecane, 2-methyl-1560-86-7C20H42 3.85
EstersDibutyl phthalate84-74-2C16H22O40.090.21
2,5-Octadecadiynoic acid, methyl ester57156-91-9C19H30O20.05
Diethyl Phthalate84-66-2C12H14O4 0.17
Triethyl citrate77-93-0C12H20O7 0.11
9-Octadecenoic acid (Z)-, hexyl ester20290-84-0C24H26O2 0.16
KetonesDodecanal112-54-9C12H24O0.080.55
2-Pentadecanone, 6,10,14-trimethyl-502-69-2C18H36O0.02
Acetoin513-86-0C4H8O2 0.36
Methyl vinyl ketone78-94-4C4H6O 0.17
Otherso-Cymene527-84-4C10H140.080.16
Rhodoxanthin116-30-3C40H50O20.06
3-Octen-2-ol76649-14-4C8H16O 0.60
Disclaimer/Publisher’s Note: The statements, opinions and data contained in all publications are solely those of the individual author(s) and contributor(s) and not of MDPI and/or the editor(s). MDPI and/or the editor(s) disclaim responsibility for any injury to people or property resulting from any ideas, methods, instructions or products referred to in the content.