Abstract
This study investigates the spatial distribution characteristics and influencing factors of soil organic carbon (SOC) in the Tamarix chinensis forest ecosystem in Changyi National Marine Ecological Special Reserve, China. Five sampling routes and 32 sampling points were established; 293 soil samples were collected every 10 cm from the surface downwards. GIS spatial analysis techniques were employed to analyze the overall, horizontal, and vertical distribution characteristics of SOC within the 0–100 cm depth range. The results show that SOC content in the reserve ranges from 1.0 to 10.0 gC/kg, with an average of 2.5–8.2 gC/kg. High-SOC zones are in the southwest, where human disturbance is minimal and vegetation is dense, whereas low-SOC areas are in the west, and the north suffers from frequent tides and salinization. Horizontally, the surface SOC (0–10 cm) increased from 2.30 gC/kg in the east to 9.15 gC/kg in the western tidal flat. Vertically, six profile types were identified; the fluctuating type dominated (74.07%). Eight ecological zones were delineated based on land cover and function: the Tamarix core area exhibited surface aggregation with a depth-wise decline; the ecological restoration zone showed a mid-depth peak; and the moisture-proof dam zone displayed a “shallow-rise–deep-drop” pattern. Storm surges, moisture-proof dams, ecological zoning, and restoration projects were key drivers of SOC distribution.
1. Introduction
Forest soil carbon pools play an important role in terrestrial ecosystems, storing approximately 40% of global soil carbon [1,2,3]. As the core of these pools, soil organic carbon (SOC) plays a vital role in carbon sequestration, climate change mitigation, and ecosystem sustainability, making it a central focus of scientific research [4,5]. Extensive studies have been conducted worldwide on the spatial distribution of SOC in forest ecosystems, with broadly consistent findings [6,7]. Vertically, SOC generally exhibits surface enrichment and decreases with depth [8], as evidenced in diverse forest systems such as urban forests in Changsha, karst landscapes in Guizhou, and low mountainous regions in northern Jiangsu. However, SOC content varies significantly across forest types [9,10,11,12]. While the pattern of SOC decreasing with increasing soil depth has been validated in most ecosystems, its applicability in ecosystem and special ecological context such as coastal wetlands, which are influenced by tides, high salt content, unique vegetation types, and special soil textures, still needs to be further analyzed and confirmed through specific empirical research [13,14]. At the same time, in the actual research process, due to the relative lack of measured soil profile data, research on the vertical and horizontal distribution characteristics and influencing factors of SOC is relatively scarce [15,16]. Therefore, this greatly limits the quantification, evaluation, and related in-depth research on the carbon storage and sink functions of forest soil ecosystems [17].
The Changyi National Marine Ecological Special Protection Area, a core zone of this initiative, offers particular significance for assessing ecosystem health and informing conservation strategies [18]. The Tamarix wetland ecosystem along the southern coast of Laizhou Bay also plays an essential role in maintaining ecological balance, preventing wind and sand erosion, and conserving biodiversity. In addition, with the gradual development of Geographic Information System (GIS) technology, which provides a computational framework for managing, analyzing, and visualizing geographic information. By utilizing GIS spatial analysis technology, it is possible to more accurately analyze and study the spatial distribution characteristics of SOC in soil carbon pool from different perspectives at different regional scales [19,20].
Although previous studies on the Tamarisk forest SOC in the region have left the spatial distribution across the overall, vertical, and horizontal dimensions insufficiently resolved, this study presents a comprehensive re-examination. High-density field surveys and laboratory measurements were combined with ArcGIS 10.6, ENVI 5.6, Kriging interpolation, bar chart spatial analysis, Origin 2022, and Excel 2010 to map and quantify SOC stocks throughout the Changyi National Marine Ecological Special Protection Area. By explicitly dissecting both the horizontal and vertical patterns within the entire reserve—rather than its core zone alone—we clarify the primary environmental drivers governing SOC variability. These findings advance our understanding of SOC’s role in coastal carbon cycling, provide robust estimates of carbon storage and sequestration potential, and furnish science-based guidance for the ecological restoration and adaptive management of the coastal Tamarix chinensis ecosystem.
Despite achieving the research objectives to a certain extent, there are still some limitations and shortcomings. Specifically, this study only analyzed the spatial distribution characteristics of SOC in the depth range of 0–100 cm, while the distribution characteristics of SOC at more than 100 cm need to be further explored. In addition, due to the limitations of safety factors and technical conditions, the spatial distribution of sample points in this study is not uniform enough, and the number of overall sampling points is relatively small. Some areas failed to yield samples due to environmental factors, which limits the comprehensiveness and accuracy of the research results to a certain extent.
2. Materials and Methods
2.1. General Situation of Study Area
2.1.1. Geographic Situation
Changyi Tamarix Chinensis Forest (belonging to the Changyi National Marine Ecological Special Protection Area, hereinafter referred to as the “Protection Area”) is located on the south coast of Laizhou Bay in the Bohai Sea, China. The total area of the protection area is 2929 hectares, with a Tamarix forest area of 1548 hectares. It is the only national marine ecological special protection area in China that mainly protects Tamarix [18,21]. Therefore, the area covered by Tamarix forest with regional characteristics and representativeness in the reserve is taken as the study area. The geographical locations of the study area and sampling points are shown in Figure 1a and Figure 1b, respectively.
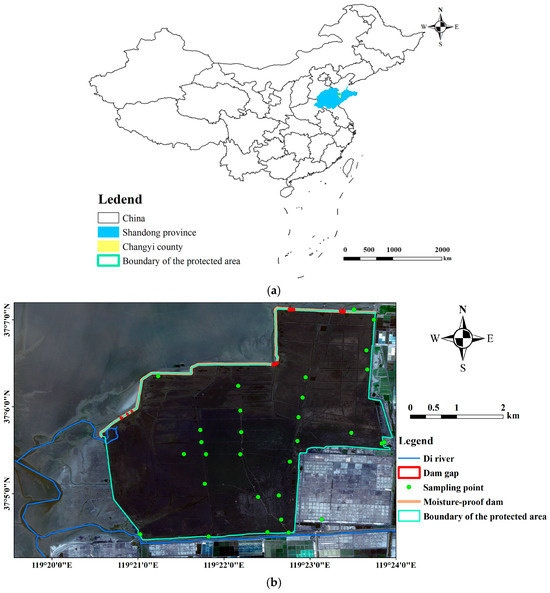
Figure 1.
(a) The geographic location of the study area. (b) The distribution map of the study area.
2.1.2. Climate and Precipitation
The study area is located in Changyi City, Shandong Province, China, which is a warm temperate continental monsoon climate zone. It has a mild climate, sufficient sunshine, abundant heat, four distinct seasons, concentrated rainfall, rainy and hot weather in the same season, and obvious dryness and wetness. The average annual total solar radiation is 123.2 Kcal/cm2, the average annual sunshine hours are 2640.1 h, the average annual temperature is 11.9 °C, the highest temperature is 40.4 °C, the lowest temperature is −19.5 °C, the active accumulated temperature is 4582 °C above 0 °C, the effective accumulated temperature is 4127.5 °C above 10 °C, the frost-free period is 195–225 days, and the maximum depth of the frozen soil layer is 50 cm [10].
In addition, the average annual precipitation in this region is 628.6 mm, with precipitation mostly concentrated between June and September, accounting for 72.4%–76.2% of the total annual precipitation. The annual evaporation is 1764–1859 mm, and the annual average total evaporation is much greater than the annual average precipitation. The average annual snowfall is 9–11.1 days, with a maximum of 25 days and a minimum of 3–5 days. Tamarix forest in the protection area is alocated in the muddy tidal flat of Laizhou Bay. Its landform is coastal shallow flat depression, with an elevation of 1.7–2.2 m. Its soil is coastal tidal saline soil, with a light soil texture. The surface soil in the study area is classified as Typical Salic Tidal Flat Soil in the Chinese Soil System Classification (2001), with a salt content of 4.1–8.7 g/kg in the 0–20 cm layer, exhibiting intertidal sedimentary characteristics and a saline diagnostic layer [22]. The groundwater level is less than 1 m, and the salinity of groundwater is more than 1 mg/L.
2.2. Soil Sample Collection and Processing
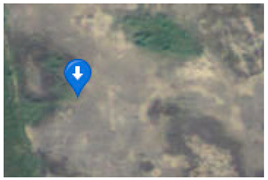
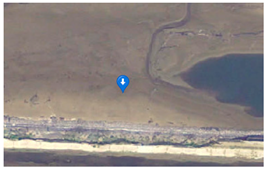
This study completed soil sampling in the study area in October 2023. Based on safety and practical feasibility conditions, the final sampling-point tally for this study was 27, with 5 points located outside the protection area. The specific distribution of sampling points is shown in Figure 1b. It should be noted that during the vertical sampling process, some sampling points were disturbed by storm surges and seawater backflow, making it difficult to sample strictly adhere to the 10 cm depth gradient standard. In response to this phenomenon, two affected samples of neighboring soil layers were homogenized in equal volume ratios in this study.
This study used a ring cutter drill to collect samples of soil from 0 to 100 cm at each sampling point. Each sampling point collected a sample every 10 cm from the surface downwards, and a total of 10 soil samples were taken, named D1–D10. This study collected a total of 293 soil samples, including 256 within the protected area and 37 outside the protected area. The sampling diagram and sampling equipment are shown in Figure 2.
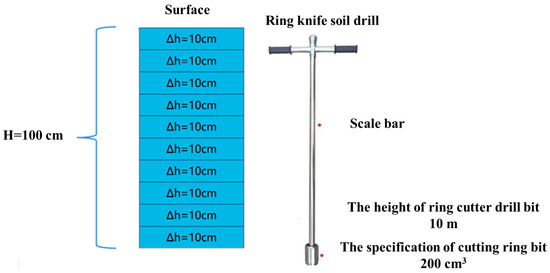
Figure 2.
Sampling and equipment diagram (the red dots from top to bottom represent the scale bar and ring cutter drill bit, respectively).
During the sample processing, all soil samples were first placed in sealed bags and marked with positioning and numbering, and brought back to the laboratory. Subsequently, the collected soil samples underwent natural air-dried, removal of coarse branches, fallen leaves, and other impurities. After pre-treatment such as grinding and sieving, the SOC content was determined using the potassium dichromate bulk density–external heating method, and the unit was gC/kg. The specific operation method is as follows: weigh a small amount of air dried soil sample, add potassium dichromate standard solution and concentrated sulfuric acid, heat and simmer in an oil bath at 170–180 °C for 5 min to oxidize organic carbon, and titrate the remaining potassium dichromate with ferrous sulfate solution to the endpoint. After calibration through blank experiments, the organic carbon and organic matter content can be calculated based on the volume of oxidant consumed. During the measurement process, it should be noted that performing single point calibration with national standard substance GBW07458 [23] (1.50 ± 0.06% C) before measurement; two blank samples, one parallel sample, and one standard sample are inserted into each batch. The relative deviation of the parallel samples is less than 5%, and the recovery rate of the standard samples is 97%–103%. The experiment is repeated three times throughout the entire process [24,25].
This study conducted one-time sampling in a single season and did not capture the seasonal fluctuations in SOC; due to safety reasons, a small number of sampling points were missing and needed to be filled through Kriging interpolation, which may have amplified local errors. In addition, to avoid the influence of salt crystallization, the samples were only air-dried and ground without sieving and homogenization, which may have led to the enrichment of fine carbon particles. Subsequent work will include multi-season repeated sampling, grid refinement, and homogenization preprocessing to reduce the aforementioned uncertainties.
2.3. Data Processing and Spatial Visualization
After the experiment, the SOC content of each soil layer (D1–D10) at each sampling point could be obtained. Based on the SOC content, the latitude and longitude of sampling points, and the GF2 image (image product number: 13429723001) of the study area on 13 October 2023, this study used ArcGIS (v10.6), ENVI (v5.6), SPSS (v27), Origin (v2022) and Excel (v2010) to perform spatial processing and analysis of the data [26].
The content of analysis and visualization mainly includes the production of histograms and trend distribution maps of SOC content in the surface and bottom layers of the study area, as well as in each soil layer at each sampling point, and the drawing of SOC spatial distribution characteristic maps based on the Kriging spatial interpolation method [27]. The distribution of SOC in the entire protection area and the horizontal and vertical distribution characteristics of SOC in the study area can be obtained by analyzing the above results. We used Origin 2022 and Excel 2010 for descriptive analysis of data, and use ArcGIS 10.6 and ENVI 5.6 for spatial mapping and analysis.
3. Results and Discussion
3.1. Range and Distribution Characteristics of SOC Content in the Study Area (Depth Range of 0–100 cm)
3.1.1. Statistical Characteristics of SOC Content in the Study Area
Figure 3 shows a box line diagram of the SOC content in the range of 0–100 cm depth at 27 sampling points in the study area. Analysis of Figure 3 reveals that the SOC content in the study area is roughly distributed within the range of 1.0–10.0 gC/kg, with the mean value is distributed in the range of 2.5–8.2 gC/kg. According to the statistical data on the dynamic changes in soil organic carbon in China from 2001 to 2020, the average SOC content at depths of 0–100 cm from 2001 to 2020 was 9.3 gC/kg, slightly higher than the average SOC content in this study area [28]. Some of the sampling points have relatively high box sizes, such as sampling points 5 and 31, indicating that the SOC content of these sampling points varies greatly. The first and tenth sampling points have relatively low box heights, indicating that their SOC content changes relatively little [29,30].
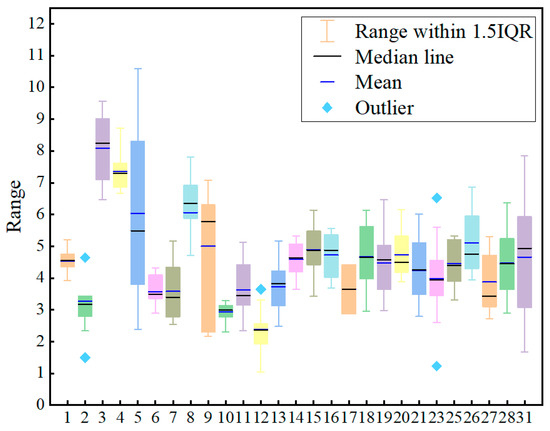
Figure 3.
Box line diagram of SOC distribution at sampling points within the study area.
The values marked with diamonds in Figure 3 are outliers, which may be caused by special environmental factors. Point 2 located next to the road at the entrance of the protected area, and is greatly affected by human activities. As for the 23-point, it is located on the eastern boundary of the protected area, adjacent to an abandoned salt field, so the vegetation is greatly affected by salt stress, resulting in abnormal SOC content distribution at this point. Through statistical analysis of the box line diagram results after removing outliers at each sampling point, it can be found that the distribution of SOC content intervals at each sampling point is relatively concentrated overall, but there are still certain differences between different sampling points, indicating that local environmental factors may have a significant impact on SOC content [31,32].
Further analysis of Figure 3 reveals that the median and mean lines of sampling points 1, 12, 15, 17, 18, 21, and 28 are relatively close, indicating that the SOC content of these points varies slightly. For these sampling points, the SOC data may follow a relatively symmetric distribution. In a symmetric distribution, the mean and median tend to be close to each other. Additionally, the environmental conditions at these points might be relatively homogeneous. For example, similar vegetation cover, soil types, and levels of human disturbance could result in a more consistent SOC accumulation and decomposition processes, leading to less variation in SOC content [33,34]. The significant difference between the median and mean lines of sampling points 5, 8, 9, 20, and 31 indicates great variation in SOC content at these points. Due to the mean value being susceptible to extreme values, when there are extreme values (abnormally high or low values) in the dataset, the mean will be pulled towards these extreme values. The median is the value located in the middle position after sorting the data from small to large, and it is not affected by extreme values. Furthermore, the difference between median and mean can reflect the skewness of data distribution. For sampling points 8, 9, 20, and 31, the significant difference between median and mean indicates that the SOC data distribution has obvious skewness. The data is not uniformly or symmetrically distributed, and there are cases where some values deviate greatly from most values.
3.1.2. Spatial Distribution Characteristics of SOC Content in the Study Area
In order to better analyze the overall spatial distribution characteristics of SOC content in the study area, this study systematically analyzed the distribution and characteristics of SOC content at each sampling point by calculating the SOC mean value (SOC sum value at each sampling point/soil layer number at each sampling point).
Figure 4 shows the spatial distribution of mean value of SOC content at 0–100 cm (some sampling points are unable to collect samples at depths below 100cm) of 27 sampling points in the study area. Based on this, the distribution types of SOC content within the protection area are divided into high-value areas, median-value areas, and low-value areas in this study. Overall, the comprehensive analysis of Figure 4 indicates that SOC within the protected area exhibited pronounced spatial heterogeneity: high (>5 gC/kg), moderate (4–5 gC/kg) and low (<4 gC/kg) zones were clearly separated. The comprehensive analysis of Figure 4 indicates that the specific spatial distribution characteristics are as follows.
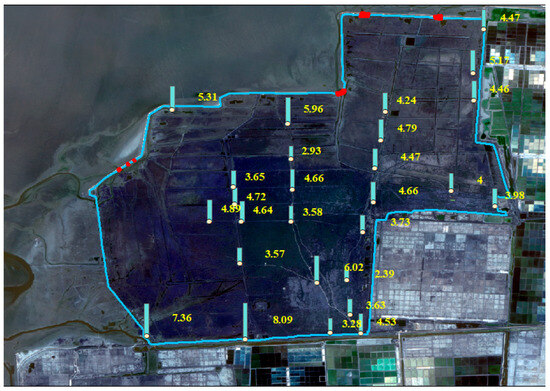
Figure 4.
Bar chart of average SOC content in the depth range of 0–100 cm at each sampling point within the protected area (the blue outline represents the boundary of the protected area, and the red area represents the moisture-proof dam).
- (1)
- The high-value areas (SOC > 5.0 gC/kg) are relatively concentrated, corresponding to sample points 3, 4, 5, 8, 9, and 26, which are concentrated in the southwest, northwest, and northeast, likely due to minimal human disturbance and high vegetation cover, which facilitate organic carbon accumulation. Specifically, the southwest region, with an average SOC value of 8.09 gC/kg, represents the peak accumulation zone, possibly due to its favorable vegetation and soil conditions.
- (2)
- The distribution of the median region (SOC ranging from 4.0 to 5.0 gC/kg) is relatively regular, corresponding to sample points 1, 14, 15, 16, 18, 19, 20, 21, 25, 28, and 31. The SOC mean value distribution is in the range of 4.24–4.89 gC/kg. The main distribution range of the median region of SOC is a stepped distribution from west–central to northeast, and is influenced by a combination of natural and anthropogenic factors. For instance, the area near sampling points 20 and 21, characterized by artificial planting and increased Tamarix coverage, exhibits relatively stable SOC levels. The area near points 20 and 21 belongs to the artificial planting area, the coverage of Tamarix has increased, and the distribution of SOC content is relatively stable.
- (3)
- In contrast, the low-value zones, located in the central western region and southeastern corners, are severely affected by tidal intrusion, leading to high salinization and SOC depletion [35]. The western moisture-proof dam may further restrict the influx of external organic matter, limiting SOC accumulation [36,37]. Additionally, the southeastern corners, impacted by intensive human activities and low vegetation cover, show consistently low SOC values.
- (4)
- The mean value distribution of SOC content in the boundary area of the study area shows significant differences. We conclude that this is mainly because the distribution characteristics of SOC content within the protection area are mainly influenced by various factors such as geographical location, vegetation coverage, salinization degree and human activities, while the background environment of the marginal areas is quite different [7,38]. For example, the two points 9 and 4 in the western part of the study area both have high sum and mean values, and the SOC content in the eastern part is relatively low.
3.2. Horizontal Spatial Distribution Characteristics of SOC in Each Soil Layer Within the Study Area
3.2.1. Analysis of Spatial Distribution Characteristics Within Each Horizontal Layer
This study obtained the horizontal spatial distribution of SOC content in 10 soil layers in the 0–100 cm depth range of the study area through Kriging spatial interpolation. And the distribution characteristics of SOC in each horizontal layer can be obtained by analyzing Figure 5. The specific distribution characteristics and influencing factors of SOC at each horizontal layer were analyzed and the results are shown in Table 1.
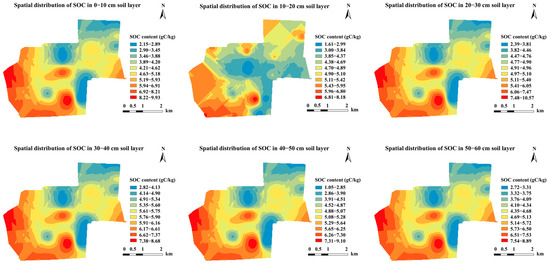
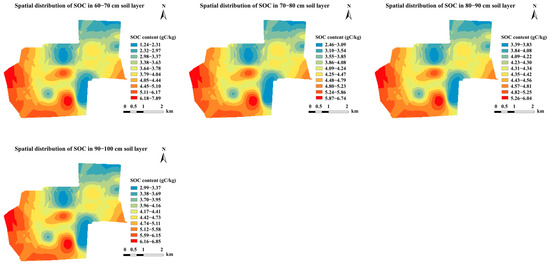
Figure 5.
Horizontal spatial distribution map of SOC content in each soil layer from 0 to 100 cm in the protected area.

Table 1.
Distribution characteristics of SOC at each horizontal layer.
In the surface layer (0–10 cm), SOC exhibited a pronounced west-to-east gradient, ranging from 2.30 to 9.15 gC/kg. High-SOC zones (>6.49 gC/kg) were concentrated in the western tidal flat adjacent to the Di River and in the southern inland areas, whereas low-SOC zones (<3.45 gC/kg) occurred in the eastern saline–alkali land and near the breached northern seawall. The Di River continuously delivers large quantities of terrigenous organic matter that accumulate on the western tidal flat, providing a persistent carbon source [39,40]. Halophytic Tamarix further enhances SOC accrual through litterfall and rhizodeposition, especially where tidal influence is dampened by freshwater dilution. Conversely, the northern sector experiences seawater intrusion and frequent tidal flushing; elevated salinity suppresses microbial activity and accelerates SOC loss [41]. Although SOC in the north-eastern restoration zone has risen annually following Tamarix planting, levels remain below those in the west.
At 10–20 cm, SOC continued the west-high/east-low pattern but declined to 2.40–7.54 gC/kg. The high-SOC area in the west shrank markedly, while the low-SOC zone aligned with that of the surface. Reduced vegetation cover and diminished fresh organic-matter inputs at this depth shifted SOC control to sedimentary micro-environment and groundwater-level changes. SOC in the northern tidal flat remained generally low, though local deposition anomalies generated slightly higher pockets. The north-eastern restoration zone showed a modest SOC rebound, but its spatial extent was limited.
Between 20 and 30 cm, SOC fell further to 2.65–8.22 gC/kg and spatial variability contracted. The residual high-SOC area was restricted to the western tidal flat near the Di River, governed by a paleo-carbon enrichment layer formed during earlier fluvial deposition [42]. At 30–40 cm, SOC rebounded slightly to 3.59–8.71 gC/kg and the high-SOC band extended eastward. The minimum SOC in the eastern saline–alkali land (3.59 gC/kg) now exceeded that of the 20–30 cm layer. Weakened shallow-salt stress and fine-grained deposition within the Tamarix forest core favored organic-matter preservation, jointly promoting SOC accumulation and spatial expansion.
From 40 to 50 cm, SOC was marginally lower than in the 30–40 cm layer but still significantly higher than in the 20–30 cm layer. The high-SOC area continued to contract and spatial heterogeneity weakened. West-side deep groundwater flow transported part of the SOC downward, causing local losses, whereas stable salinity in the eastern saline–alkali land reduced mineralization and dampened SOC fluctuations.
At 50–60 cm, SOC displayed a “west-high–east-low and south-low–north-high” gradient. Long-term cycles of salt leaching and evaporative concentration sustained SOC depletion in the eastern deep strata. Between 60 and 70 cm, SOC declined overall, yet localized high values emerged in the northern tidal flat where clay and Fe-Mn oxides chemically sequestered ancient organic matter [43]. Seawater intrusion also promoted the downward translocation of surface SOC, further shaping the distribution.
In the 70–80 cm layer, SOC in the western high-value zone dropped markedly, while the eastern saline–alkali land remained stable. Low-SOC areas in the northern and southern tidal flats narrowed, and the entire layer became more homogeneous. Microbial activity approached dormancy, organic-matter degradation nearly stagnated, and SOC variability was minimized [44].
At 80–90 cm, SOC distribution was further homogenized, entering a “deep stabilization” stage. From 90 to 100 cm, SOC decreased from southwest to northeast and increased from southeast to northwest. Persistent riverine and marine erosion drove organic-carbon migration to deeper horizons, while the geological setting reached a stable state, fixing the spatial pattern.
3.2.2. Analysis of SOC Changes Between Each Horizontal Layer
Analysis of Figure 5 reveals a significant change in the horizontal distribution characteristics of SOC content from the surface layer (0–10 cm) to the bottom layer (90–100 cm). Overall, the content in the northern part of the study area is relatively low and gradually increases from north to south. At the same time, the SOC content in the surface soil is greatly affected by the external environment, resulting in a more obvious distribution pat-tern of surface SOC content, which is affected by the wind disturbance and human activity. Human activity could significantly reduce the microbial and plant derived carbon and pools in the topsoil [45]. Specifically, the SOC content is higher in the southwest region and gradually decreases northeastward to the central region, where some localized high-value areas occur. As depth increases, the distribution of SOC becomes more uniform: from 20 to 30 cm down to 80–90 cm, high-value zones gradually diminish and are more evenly distributed, reflecting weakened vertical influence from external drivers. Specifically, across the 10–90 cm depth interval, SOC generally shows higher values in the west and lower in the north. In the central region, SOC is relatively low at 10–60 cm but irregularly distributed at 60–90 cm, which is attributed to strong tidal intrusion that redistributes SOC laterally within deeper layers. The spatial distribution characteristics of SOC content at the bottom layer are more pronounced. The SOC content in the study area gradually decreases from the southwest corner to the central region, and gradually increases from the southeast to the northwest, reaching the maximum and minimum values of the bottom SOC content in the southwest and northwest corners, respectively (the SOC content in the bottom layer reaches the minimum at point 9 in the northwest corner and the maximum at 4-point in the southwest).
3.3. Vertical Spatial Distribution Characteristics of SOC in the Study Area
3.3.1. The Variation Trend Characteristics of SOC with Depth at Each Sampling Point in the Study Area
In order to analyze the variation trend characteristics of SOC content with depth at each sampling point in the study area, this study divides the SOC content variation trend types with depth at 27 sampling points in the study area into six types: significant increase, integral rise, relative stability, significant decrease, integral decline, and fluctuation trend. The final variation trend type discrimination of SOC content with depth and its corresponding results are shown in Table 2.

Table 2.
Types and classification criteria of SOC content variation trend with depth.
A comprehensive analysis of the fitted results of the SOC variation trend with depth and Table 2 shows the following:
- (1)
- Points 5, 7, 11, and 27 show relatively high R2 values in linear function fitting. Combined with the results of Table 2, this can be explained by the fact that the slopes of the fitting lines of SOC and depth change at the three points of 5, 7, and 27 are <−0.20; that is, the SOC content decreases significantly with depth [46]. The slope of the fitting line corresponding to point 11 is −0.15, showing an overall downward trend. The number of points belonging to these two variation trend types accounts for 11.11% and 3.7% of the total number of points, respectively.
- (2)
- Points 4, 8, and 10 show lower R2 values in linear function fitting. Combined with the results of Table 2, it can be seen that the slope of the fitting line between SOC and depth change at point 4 is only 0.024; that is, the SOC content is relatively stable with depth change. The slope of the fitting line between SOC and depth change at point 8 is 0.32, and the SOC content increases significantly with depth. The slope of the 10-point fitting curve is only 0.081, showing an overall downward trend. Altogether, the number of points belonging to these three variation trend types accounts for 3.70% of the total number of points.
- (3)
- Points 3, 12, 13, 17, 18, 25, and 28 have higher R2 values in quadratic function fitting. Combined with Table 2, it can be concluded that the SOC content of the above points increases first and then decreases or decreases first and then increases with depth, and the number of points accounts for 25.92% of the total points.
- (4)
- Points 1, 2, 6, 8, 9, 10, 14, 15, 16, 19, 20, 21, 23, 26, and 31 show relatively high R2 values in cubic function fitting. Combined with the results of Table 2, it can be concluded that the SOC content of the above points shows a wave-like trend with depth, and the number of points accounts for 48.15% of the total points.
In addition, the spatial distribution of SOC variation trend with depth at each sampling point in the study area is shown in Figure 6.
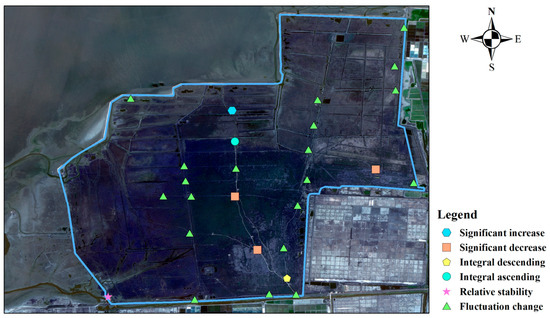
Figure 6.
Distribution of SOC variation trend at each sampling point in the protection area.
Analyzing Figure 6, the following can be observed:
- (1)
- The significant rising areas are mainly distributed in some coastal areas in the north–central part of the study area, such as the area near sampling point 8. The SOC content in these areas increases significantly with depth, and the SOC content in deep soil is higher. This study concludes that this phenomenon may be caused by the “sedimentary effect” of organic matter input, storm surges, moisture-proof dams, vegetation coverage, and other factors.
- (2)
- The overall growth trend area appears in the north–central region of the reserve, such as sampling point 10. The SOC content in this area fluctuates at different depths, but the overall trend is an increasing one. This study concludes that this phenomenon may also be caused by tidal phenomena, storm surges, moisture-proof dams, vegetation coverage, and other factors. However, the point is at a distance of 977 m from the coast and the vegetation coverage less than point 8.
- (3)
- The relatively stable area is mainly concentrated in the southwest of the protection area, such as sampling point 4. The SOC content in this area does not vary much with depth and remains relatively stable, reflecting the balance of soil environmental conditions.
- (4)
- The significant decline areas are mainly distributed in some areas in the south–central and eastern parts of the reserve, such as the areas where sampling points 5, 7, and 27 are located. The SOC content in these areas decreases significantly with depth, and the SOC content in deep soil is low, which may be related to soil erosion, drainage conditions, or the salt effect [47].
- (5)
- The integral decline trend area is mainly distributed in the southeast corner of the southernmost part of the reserve. For example, the SOC content of sampling point 11 gradually decreases with the increase in depth, but the decrease is relatively gentle.
- (6)
- The area of the fluctuation change trend area accounts for the largest area of the protection area (the number of corresponding points of the fluctuation change trend accounts for 74.07% of the total number of sampling points), which appears in some areas in the south, west, northwest, and central northeast of the protection area, such as the surrounding areas corresponding to the sampling points of 1, 2, 3, 9, 14, 16, 19 and 21 in the protection area. The SOC content in these areas shows an obvious fluctuation with depth, which is similar to the wave shape. This may be related to the interaction of various factors such as soil bedding structure, seasonal variation, tidal action and salinity change [48,49,50].
In summary, the trend distribution characteristics of SOC with depth change in the reserve are complex and diverse, and the six variation types show specific distribution patterns in geographical space, reflecting the complexity and diversity of SOC distribution in coastal Tamarix forests.
3.3.2. Vertical Spatial Distribution Characteristics of SOC in Different Regions of the Study Area
In order to analyze the vertical spatial distribution characteristics of SOC in the study area more clearly, based on factors such as land cover type, ecological function, and geographical location, this study divides the study area into “core area of Chinese Tamarix forest and high-density Tamarix forest area”, “core area of Tamarix forest and medium-density Tamarix forest area”, “northeast ecological restoration area and low-density Tamarix forest area”, “southeast inland area and medium-density Tamarix forest area”, “area affected by seawater backflow and high-density Tamarix forest area”, “area affected by seawater backflow and medium-density Tamarix forest area”, “moisture-proof dam protection area and low-density Tamarix forest area”, and “Di River influencing area”: a total of eight zones [51]. The vertical variation and spatial distribution of SOC content at each sampling point in the study area are shown in Figure 7.
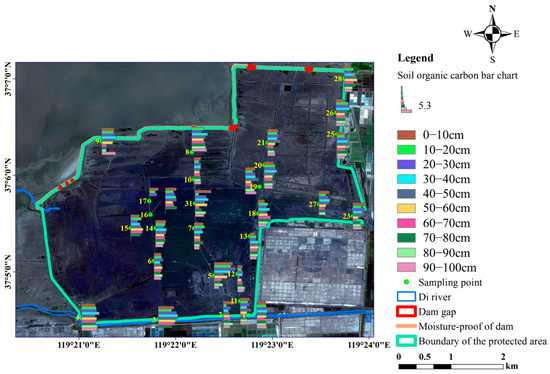
Figure 7.
Distribution of SOC content at each sampling point in the protected area.
Analysis of Figure 7 reveals the following:
- (1)
- In the core area of the Tamarix forest and high-density Tamarix forest area (near point 5), the SOC content in the surface layer (0–10 cm) is as high as 9.18 gC/kg, but it has decreased to 2.38 gC/kg in the soil layer at a depth of 90–100 cm, showing a distribution characteristic of “surface aggregation, gradually decreasing layer by layer”. This study concludes that the reason is that dense Tamarix vegetation inputs organic matter through dead branches, fallen leaves, and root exudates, but the deep soil has poor air permeability and slow organic matter decomposition.
- (2)
- In the core area of the Tamarix forest and the medium-density Tamarix forest area (near points 6, 7, 14, and 31), the surface SOC content is relatively low compared to point 5, and SOC fluctuates with increasing depth. This may be related to the effects of vegetation coverage, soil disturbance, and root exudates on organic matter input. In addition, medium-density Tamarix forests may have a balancing effect on the input and decomposition rate of SOC, thereby affecting the vertical distribution of SOC [52].
- (3)
- In the northeast ecological restoration area and low-density Tamarix forest area (near points 13, 18, 19, 20, 21, 23, 25, 26, 27, 28), the surface SOC is relatively low compared to the core area. SOC shows an overall upward trend from the surface to the middle soil layer, with a sharp decrease in soil SOC near 50 cm, and SOC exhibits relatively small fluctuations in the deep layer. The upward trend may be mainly influenced by the root system of artificially planted Tamarix, and the stabilization may be influenced by the leaching effect. The different trends in SOC content at each point may be due to different factors such as tree age, the shallow root system, soil disturbance and other factors in different regions.
- (4)
- In the southeastern inland area and medium-density Tamarix forest area (around points 1, 2, 11, and 12), the surface SOC content is relatively small and fluctuates with increasing depth. As the region is located adjacent to the inland area on the southeast side, this study concludes that the dominant factors affecting the distribution characteristics of SOC content in the region may be relatively low vegetation coverage and strong human activities.
- (5)
- In the area affected by seawater intrusion and high-density Tamarix forest (around points 15, 16, and 17), the surface SOC content is similar. Except for point 17 (due to seawater backflow, it is impossible to accurately distinguish the soil samples of each soil layer, so accurate sampling below a depth of 30 cm is not possible), there is a significant increase in SOC in the middle soil layer at a depth scale of 40 cm. This study suggests that the increase in salt content may inhibit the activity of microorganisms, slow down the decomposition rate of organic matter, and thus facilitate the accumulation of SOC [53].
- (6)
- The variation in SOC content with depth is complex and varied in the area affected by seawater intrusion and medium-density Tamarix chinensis forest (around points 8, 10, and 31). This study concludes that this may be due to the significant difference in the impact of seawater backflow, as well as the input and decomposition rate of SOC by the Tamarix forest.
- (7)
- In the moisture-proof dam protection area and low-density Tamarix forest area (around point 9), the SOC content is relatively high in the depth range of 0–40 cm and shows an overall upward trend, and decreases significantly when the depth increases to more than 40 cm. This study concludes that the moisture-proof dam greatly reduces the impact of seawater backflow in the area, which in turn affects the trend of SOC variation with depth.
- (8)
- In the area affected by the Di River and the medium-density Tamarix forest area (near point 3 and point 4), the overall SOC content is relatively high. The SOC variation trend shows an overall upward trend in the upper layer and reaches its maximum value in the 30–40 cm soil layer, and then gradually decreases or remains relatively stable with increasing soil depth. This study concludes that the upward trend may be influenced by the change in soil moisture conditions due to the impact of the Di River, leading to the accumulation of SOC [54].
3.4. Comparative Analysis of SOC Content in Typical Areas Inside and Outside the Study Area
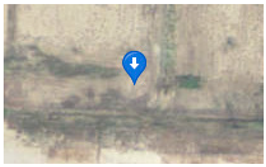
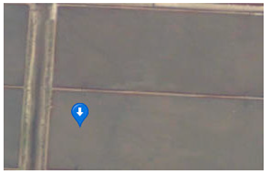
Studies have shown that different land types (such as abandoned salt pans, restored salt pans, tidal flats, and so on) and geographical locations have a significant impact on the distribution of SOC content [55]. According to the actual situation of the study area, this study selected the point 24 (near the area of bare soil that needs repairing), point 29 (near the tidal-flat area outside the moisture-proof dam), point 30 (the inland bare soil area), and point 32 (natural restoration area of the original tidal-flat area) as the representative points outside the study area, and compared these points with points 21, 23, 26, and 28. Table 3 is the geographical location, geomorphological characteristics, and corresponding remote sensing images of sampling points outside the study area.

Table 3.
Geographical location and geomorphic features of sampling points outside the study area.
3.4.1. Comparative Analysis of SOC Between “Single-Row Tamarix Area Along Inland Roads”, “Bare Soil and To-Be-Repaired Area” and Low-Density Tamarix Forest Area
Compared with point 23 near the artificial planting area, point 24 is located outside the eastern edge of the study area, which was originally a salt field and is now an area of bare soil that needs to be repaired, with a straight distance of 2.5 km from the coast. Figure 8 is a histogram of vertical SOC content comparison at point 23 and point 24. Analysis of Figure 8 shows that with the increase in soil depth, the SOC content of the two shows a wave variation trend and an overall downward trend, respectively. Both of them show that more than 58% of the total SOC content in the 0–100 cm depth range comes from the 0–50 cm soil layer, indicating that the 0–50 cm soil layer depth is the main distribution area of SOC content. At each depth level, the SOC content at point 23 is generally higher than that at point 24. In the 0–30 cm soil layer, the SOC content at point 23 is significantly higher than that at point 24. With the increase in depth, although the content of both has changed, the content advantage of point 23 at most depth levels still exists.
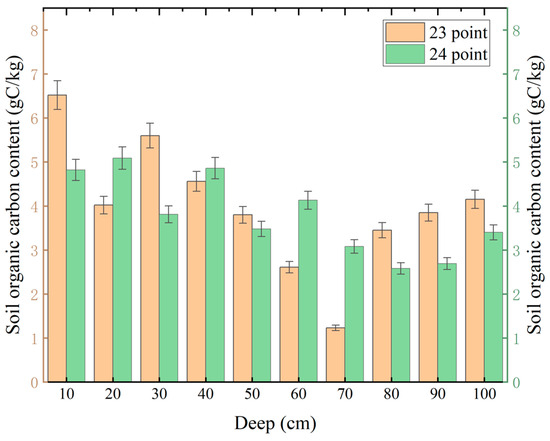
Figure 8.
A contrast histogram of the vertical SOC content at sampling points inside and outside the protected area (23rd and 24th points).
This study concludes that the main reasons for these differences are land use, human activity interference, vegetation coverage and so on [33]. For example, the land use pattern at point 23 in the study area is relatively stable, the ecosystem is less disturbed by human interference, and the vegetation types in the surrounding area are rich and the vegetation coverage is high. Vegetation can fix a large amount of carbon through photosynthesis and input it into soil in the form of root exudates and residues, which provides a material basis for SOC accumulation [56]. Meanwhile, the area near point 24 was originally a salt field; the high-salinity environment in the salt field period caused great damage to the soil ecology. High salinity inhibits the growth of vegetation and the activity of soil microorganisms, resulting in a reduction in soil organic matter input and slow decomposition [57,58]. High salt content can inhibit microbial activity, reduce the decomposition rate, and facilitate the preservation of SOC; on the other hand, high salinity puts stress on most plants and soil organisms, reduces primary productivity, and decreases the input sources of organic matter. Due to the fact that this area was previously a salt field, in the early stages of its abandonment, the stress of salt on vegetation far exceeded its inhibitory effect on microbial decomposition in a relatively short period of time, resulting in a net loss of SOC [59,60]. And it is now in a state to be repaired: the soil ecosystem has not been completely repaired, the vegetation coverage is low, and the source of organic matter is limited, so the SOC content is relatively low.
3.4.2. Comparative Analysis of SOC Between Inland Bare Soil Area and Artificial Restoration Area
Figure 9 is a histogram of the vertical SOC content at point 21 and point 30. It can be clearly seen from Figure 9 that in the surface and sub-surface soil layers (0–30 cm depth range), the SOC content at point 21 is significantly higher than that at point 30. With the increase in soil depth, except for individual soil layers, the SOC content of both shows an overall downward trend, and the SOC content of most soil layers at point 21 is higher than that at point 30. This is because the area near point 30 has more human activities and low vegetation coverage, resulting in a significant decrease in SOC content compared with the point in the artificial restoration area [61]. In addition, point 30 is located in the inland bare soil area, and the soil bareness is more serious. Due to the lack of vegetation coverage, the organic matter input provided by vegetation is insufficient, and the source of SOC is scarce. The bare soil is more susceptible to wind erosion and water erosion, which leads to the destruction of soil structure and the loss of organic matter, which is not conducive to the accumulation of SOC [62]. Meanwhile, point 21 is located in the artificial restoration area, and the vegetation coverage is higher than that of point 30, which provides a rich source of organic matter for soil microorganisms and promotes the accumulation of SOC.
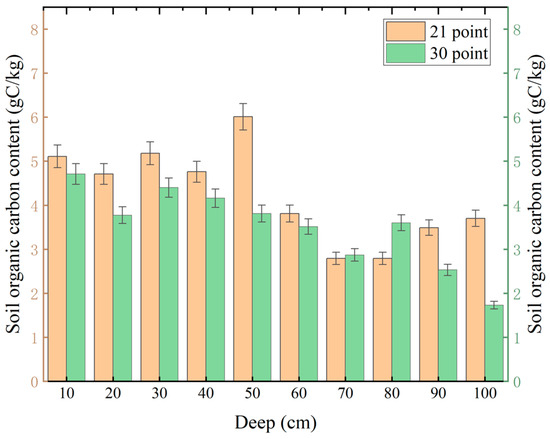
Figure 9.
A contrast histogram of the vertical SOC content at sampling points inside and outside the protected area (21st and 30th points).
3.4.3. Comparative Analysis of SOC Between Natural Growth Recovery Zone and Ecological Engineering Recovery Zone
Figure 10 is the vertical SOC content comparison histogram of point 26 and point 32. It can be seen from Figure 10 that in the depth range (0–30 cm) where SOC data can be compared, the SOC content at point 26 is higher than that at point 32, and the SOC content increases gradually with the increase in soil depth in this range. Point 26 is located in the ecological engineering restoration area. A series of restoration measures (such as laying water distribution pipes for irrigation, artificial planting of Tamarix vegetation, and so on) in this area have not only increased the vegetation coverage but also provided a more suitable growth environment for soil microorganisms, which is conducive to the activity of soil microorganisms and the accumulation of organic substances. The vicinity of point 32 was originally a tidal-flat area, and is now a natural growth restoration area of Tamarix forest. It is in a natural restoration state and lacks artificial ecological restoration intervention. Natural recovery is a very long process, with low biomass and limited input of organic matter, so the SOC content is relatively low.
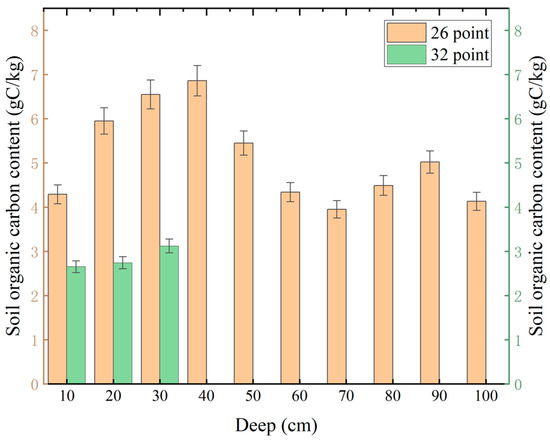
Figure 10.
A contrast histogram of vertical SOC content at sampling points inside and outside the protected area (point 26 and point 32). Limitation Notice: Due to geographical and environmental reasons, the soil conditions at the sampling location are poor, with a high soil moisture content. Accurate stratified sampling cannot be achieved when using a cutting ring drill to collect to a depth of 30 cm.
3.4.4. Comparative Analysis of SOC Between the Tidal-Flat Area Outside the Moisture-Proof Dam and the Ecological Restoration Area Inside the Moisture-Proof Dam
Figure 11 is a vertical SOC content comparison histogram of point 28 and point 29. Analysis of Figure 11 shows that except for individual soil layers, the SOC content at point 28 is mostly higher than that at point 29. In the surface and subsurface soil layers (0–30 cm), the SOC content at point 28 is significantly higher than that at point 29, and the SOC content at point 28 shows a trend of increasing first and then decreasing with the increase in soil depth, reaching a peak at 60 cm and roughly showing a “symmetrical distribution with a symmetry axis of 50–60 cm soil depth”. In this study, the area near point 29 was invaded by seawater due to the lack of protection of moisture-proof dam. Due to the scouring effect of seawater, the organic matter in the soil was accumulated in the deep layer and the SOC content was evenly distributed.
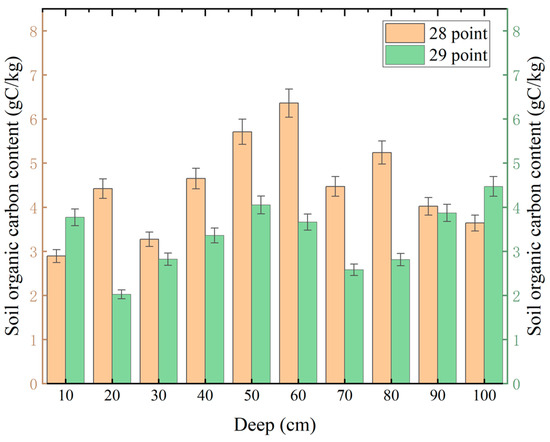
Figure 11.
A contrast histogram of vertical SOC content at sampling points inside and outside the protected area (28th and 29th points).
3.5. Analysis of Influencing Factors of SOC in the Study Area
3.5.1. The Impact of Storm Surges and Moisture-Proof Dams on the Spatial Distribution Characteristics of SOC
A storm surge is a kind of natural disaster that causes great harm in the Bohai Sea area. The Laizhou Bay in Bohai Sea is one of the most frequent and severe areas of storm surges in the northern coastal areas of China [63]. The tidal-flat area of the protection area is located on the south bank of Laizhou Bay and is deeply affected by storm surge disasters. According to the survey, the frequency of storm surges with lighter hazards close to the coastal area of the protection area is an average of 3 years/time, heavier ones have an average of 10 years/time, and the most serious have an average of 30 years/time. In 2022, the reserve suffered an extremely serious 50-year storm surge, which caused serious damage to some moisture-proof dams and obvious gaps. This natural disaster has seriously affected the stability of the ecosystem in the reserve and the regular spatial distribution characteristics of SOC content. Figure 12 shows the real scene and high-definition remote sensing image of the moisture-proof dam damaged by the storm surge.
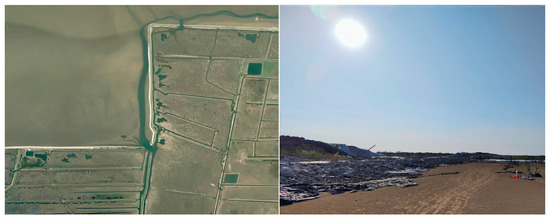
Figure 12.
High-definition remote sensing images and real scene of moisture-proof dam damaged by the storm surge.
Sampling point 9, which is better protected by the moisture-proof dam, is located in the tidal-flat area in the northwest corner of the study area. The distribution characteristics of SOC are as shown in Figure 13: In the total SOC content of the 0–100 cm soil layer, the SOC content of shallow soil (0–40 cm) accounts for a relatively large proportion, showing a certain distribution characteristic of “surface aggregation”. The bottom SOC is due to the invasion of seawater, which means that the organic matter in the soil migrates downward and accumulates in the bottom layer [64,65]. This phenomenon is common in coastal wetlands, where salinity changes and tidal processes can significantly affect the distribution and stability of SOC.
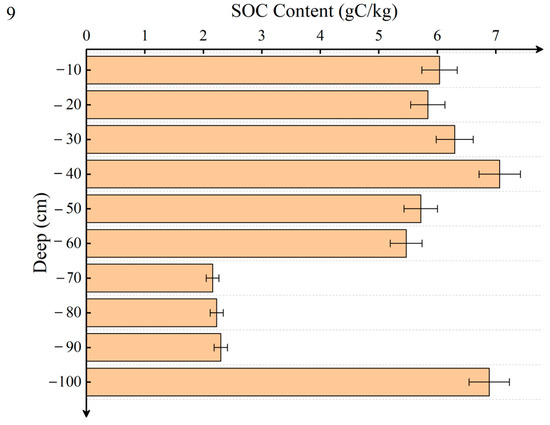
Figure 13.
The histogram of SOC content distribution at point 9 within the protected area.
Points 20 and 21 are located in the north–central part of the study area, where the moisture-proof dam was seriously damaged and significant gaps were caused. By analyzing the SOC content distribution of 20 and 21 points in Figure 14, it can be found that the SOC content of both shows a certain surface aggregation and an overall upward trend in the shallow soil, and the SOC content in the middle and deep soil shows an “S”-type variation trend overall. This study concludes that this is due to the different distances between different points and the gap of the moisture-proof dam, resulting in different intensities of seawater invasion, erosion and migration.
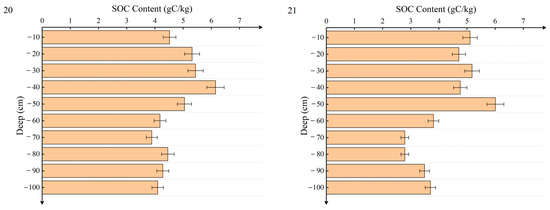
Figure 14.
The histograms of SOC content distribution at points 20 and 21 within the protected area.
As an important carbon sink, the storage and distribution of SOC in Tamarix forest are of great significance for maintaining regional ecological balance and evaluating the carbon cycling process [66]. Moisture-proof dams may slow down the erosion of inland soil by seawater, but tidal action and salinity changes in coastal tidal-flat areas affect the accumulation and decomposition of SOC [67]. In addition, the strong erosion and sediment redistribution caused by storm surges are likely to lead to the loss and redistribution of SOC, which in turn affects the growth of the Tamarix forest and the carbon cycling dynamics of the entire ecosystem, and brings more complex challenges to the subsequent ecological protection and restoration work.
3.5.2. The Impact of Ecological Functional Zoning on the Spatial Distribution Characteristics of SOC
In order to scientifically guide the protection of the Tamarix forest and standardize the construction and management of the protection area, in the “Overall Plan of Shandong Changyi Marine Ecological National Marine Protection Area (2016–2025)”, the protection area is divided into four types: an ecological protection area, a resource restoration area, an environmental remediation area, and a development and utilization area. Based on this, this study analyzed the impact of ecological function zoning on the spatial distribution characteristics of SOC.
Among them, the vegetation in the ecological reserve is dominated by natural Tamarix, and the natural ecological conditions are good. By analyzing the representative points 6, 7, and 10 within the ecological protection area, it can be found that the SOC content in most parts of this sub-region is generally low and gently variable, with a small portion showing wavy variations.
In the resource restoration area, the biodiversity and are gradually being restored through the artificial planting of Tamarix and other vegetation, water irrigation, and self-reproduction. Analyzing the SOC content at points 5, 9, 12, 20, and 21 in this subzone, it can be found that, except for point 12, the SOC content is concentrated in the 0–50 cm soil layer.
In terms of meeting protection needs, the development and utilization area develops clean and environmental protection industries such as seedling breeding, tourism, and ecological proliferation to maximize the value of resources. By analyzing the representative points 1, 2, 12, and 13 in the development and utilization area, it can be found that the SOC content of the points located in this area is generally low, and the variation in SOC from the 0–10 cm soil layer to the 90–100 cm soil layer is very gentle.
The environmental remediation area adopts measures such as biological purification to improve water quality and gradually eliminate pollution damage. In this study, there were no sampling points in the environmental remediation area.
3.5.3. The Impact of Ecological Restoration Project on the Spatial Distribution Characteristics of SOC
In order to effectively protect the Tamarix forest in the study area, the local management department implemented ecological planting and restoration projects in the northeast area of the study area (about 4 km2). The project significantly improves the vegetation coverage in the study area and lays a strong foundation for the restoration and stability of the regional ecosystem. The ecological restoration project has adopted a series of scientific measures (water distribution and irrigation measures, as shown in Figure 15), the core aim of which is to optimize the soil environment and create more favorable conditions for the growth of Tamarix. By improving the soil environment, increasing the soil available water and nitrogen content, and reducing salinity, the assimilation of CO2 and the fixation of carbon in the photosynthesis of Taramix chinensis leaves can be significantly promoted, resulting in an increase in SOC content [68].
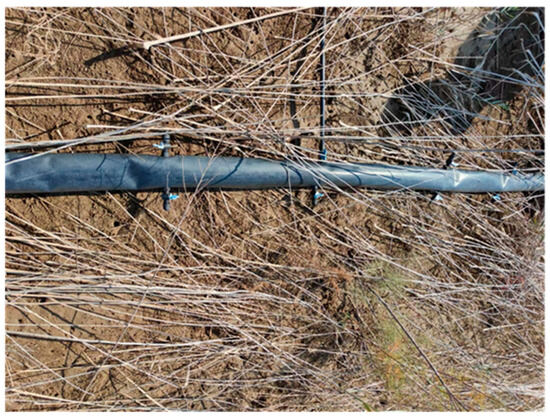
Figure 15.
A real scene of a water pipe laid in the protected area.
In the context of the implementation of ecological restoration engineering measures, from the distribution of SOC content at each sampling point in Figure 8, it can be observed that the SOC content of the upper soil (0–50 cm) at points 20, 21, 25, and 26 increases with increasing soil depth and reaches the peak at 50 cm. The reason is that the artificial planting of Tamarix increases the vegetation coverage in the region, providing abundant organic matter input to the upper soil and increasing the SOC content. However, compared with point 5 in the core area of the Tamarix forest, there is still much room for improvement in terms of vegetation coverage. By further increasing vegetation coverage, the SOC content in individual areas of the reserve can be further improved, thereby enhancing the carbon storage capacity of the reserve. This not only helps to improve soil fertility and productivity but also plays an important role in combating climate change.
3.5.4. Suggestions for Management and Related Protective Measures
The natural Tamarix forest in the study area is the best developed, largest contiguous, most typical, and most intact natural Tamarix distribution area on the mainland coast of China. Such an area is extremely rare in the northern coastal areas and has high protection and development and utilization value. At the same time, there are typical Tamarix forest ecosystems in the study area, and the value of ecological environment protection is significant. In order to more scientifically and effectively manage the construction of the marine special protection area, strengthen the ecological protection of ecosystems, and explore the sustainable development and utilization of biological resources in the protection area, we propose the following five management and related protection measures:
- (1)
- Strengthen the construction and maintenance of key defense facilities such as moisture-proof dams, repair and build the first line of defense for ecological resources in the reserve from damage, so as to resist natural disasters such as storm surges to the greatest extent.
- (2)
- It is necessary to study the long-term impact of storm surges on SOC spatial distribution, as well as planning the construction of submerged areas so as to minimize the negative impact of natural disasters such as storm surges, while providing data support for the development of scientific and reasonable defense strategies.
- (3)
- The Tamarix forest is a vital core ecological resource in the region. In view of this, emphasis should be placed on strengthening its protection by establishing clear protected area and precisely and strictly restricting all unrelated development and construction activities. At the same time, we should actively engage in in-depth cooperation with scientific research institutions; carry out scientific research and monitoring work on Tamarix in a holistic manner, controlling its growth dynamics and health status in real time so as to prevent the degradation of the Tamarix forest area in advance; lay a strong foundation for ensuring that the Tamarix forest area will not be reduced; and gradually realize recovery and expansion. In addition, for the restoration area in the northeast direction, Tamarix seedlings should be planted to further limit the development and construction behavior in the area.
- (4)
- In terms of ecological restoration projects, it is necessary to strive towards Tamarix restoration projects via multiple channels; inject strong impetus into the improvement of vegetation coverage in the area; and promote the effective protection of the Tamarix forest ecosystem, the scientific restoration of wetland resources, and the rational development and utilization of the economic value of the Tamarix forest. In the process of promotion, we should actively unite the forces of the departments of the ecological environment, forestry, and others; build a collaborative cooperation mechanism; jointly overcome technical difficulties in the repair process; and ensure the successful implementation of the repair project.
- (5)
- In terms of management, we should make full use of modern scientific and technological means such as remote sensing technology to establish an efficient ecological state monitoring system, so as to realize real-time and accurate monitoring of the Tamarix forest and other ecological elements in the reserve, and ensure that problems can be found in time and respond quickly. In addition, a detailed and operable ecological protection and restoration plan should be formulated, with clearly set protection objectives, detailed specific measures, a reasonable planning schedule, and a strict monitoring and evaluation mechanism to ensure that all protection measures are effectively implemented without fail, so as to provide a solid institutional guarantee for the long-term stability and sustainable development of the Tamarix forest and its ecosystem.
4. Conclusions
In this study, through the in-depth analysis of the spatial distribution characteristics and influencing factors of SOC in the Tamarix forest in the Changyi National Marine Ecological Special Protection Area, China, the main conclusions are as follows.
- (1)
- Overall, SOC spans 1.0–10.0 gC kg−1 (mean: 2.5–8.2). High values (>5.0) cluster east and south where human impact is low; lows (<4.0) dominate north–central and west–central zones shaped by tidal submergence and salinization. Marked disparities at the boundaries arise from contrasting locations, vegetation cover, salinity, human pressure, storm surges, and seawater intrusion.
- (2)
- Horizontal SOC shows marked spatial heterogeneity. In surface soils, values decrease steadily from southwest to northeast under strong external forcing; down-profile, this gradient fades as the environmental influence weakens. By the bottom layer, heterogeneity re-emerges: SOC declines from the southwest corner toward the center, then climbs from southeast to northwest, achieving its maximum in the southwest corner and minimum in the northwest.
- (3)
- Vertical patterns: six SOC depth trends and eight functional zones were delineated based on cover, function, and location. A wave-like decline prevails in 74% of profiles, reflecting the interplay between bedding, seasonality, tides, and salinity. In the core and high-density Tamarix stands, “surface enrichment with stepwise decline” dominates, driven by dense litter and root inputs yet slow decomposition in poorly permeable subsoil. In zones affected by seawater intrusion within high-density stands, surface SOC converges at low values, but a marked mid-layer (≈40 cm) peak emerges as salt loading and marine erosion redistribute carbon.
- (4)
- Comparisons across land types show consistent patterns. Inside the reserve, artificially planted (point 23) and restored (point 21) zones yield 0–30 cm SOC levels that are 1.5–2.0 times those of adjacent bare sites (24, 30), owing to dense vegetation and limited disturbance; this advantage persists below 30 cm at point 21. Inside the moisture-proof dam (point 28), SOC remains markedly higher than outside (point 29), peaking at 60 cm and forming a symmetrical 50–60 cm bulge. Bare sites (24, 29, 30) suffer salinization, erosion, or seawater intrusion, suppressing vegetation and microbial activity and flattening SOC profiles.
- (5)
- Influencing factors such as offshore distance, storm surges, and moisture-proof dams, ecological function zoning and ecological restoration projects have a significant impact on the spatial distribution characteristics of SOC. The construction of moisture-proof dams effectively reduces the erosion of inland soil by seawater, while storm surges may lead to the loss and redistribution of SOC. The ecological function zoning and ecological restoration project significantly affected the accumulation and distribution of SOC by changing the vegetation coverage and soil environmental conditions.
- (6)
- In view of the management and protection of the Changyi National Special Marine Ecological Protection Area, it is suggested that the construction and maintenance of key defense facilities such as moisture-proof dams should be strengthened, the impact of storm surges on SOC and other ecological factors should be studied in depth, the protection of the Tamarix forest should be increased, ecological restoration projects should be implemented, land use types should be optimized, and modern scientific and technological means should be used to strengthen ecological state monitoring to ensure the stability and sustainable development of the ecosystem in the protection area.
Author Contributions
Conceptualization, J.W. and R.L.; methodology, R.L.; software, R.L.; validation, J.W. and K.L.; formal analysis, R.L.; investigation, L.W., G.X., X.C. and J.X.; resources, X.S.; data curation, R.L.; writing—original draft preparation, R.L.; writing—review and editing, J.W. and Y.D.; visualization, R.L.; funding acquisition, J.W. and F.C. All authors have read and agreed to the published version of the manuscript.
Funding
This research was funded by the Shandong Top Talent Special Foundation (grant number: No. 0031504), the National Science Fund for Distinguished Young Scholars (grant number: 42107496), and the Natural Science Foundation of Shandong Province (grant number: ZR2024MD117).
Data Availability Statement
Data is contained within the article.
Conflicts of Interest
Author Lin Wang was employed by Qingdao Municipal Engineering Design and Research Institute Co., Ltd. Author Geng Xu was employed by the Jinan City Construction Group Ltd. The remaining authors declare that the research was conducted in the absence of any commercial or financial relationships that could be construed as a potential conflict of interest.
References
- Mahmoudzadeh, H.; Matinfar, H.R.; Taghizadeh-Mehrjardi, R.; Kerry, R. Spatial Prediction of Soil Organic Carbon Using Machine Learning Techniques in Western Iran. Geoderma Reg. 2020, 21, e00260. [Google Scholar] [CrossRef]
- Sun, W.; Liu, X. Review on carbon storage estimation of forest ecosystem and applications in China. Forest Ecosyst. 2020, 7, 37–50. [Google Scholar] [CrossRef]
- Rui, Y.; Mingyue, L.; Yongbin, Z. Estimation of Soil Organic Carbon Stocks Utilizing Machine Learning Algorithms and Multi-source Geospatial Data in Coastal Wetlands of Tianjin and Hebei, China. Chin. Geogr. Sci. 2025, 35, 707–721. [Google Scholar] [CrossRef]
- Angst, G.; Mueller, K.E.; Castellano, M.J. Unlocking Complex Soil Systems as Carbon Sinks: Multi-Pool Management as the Key. Nat. Commun. 2023, 14, 2967. [Google Scholar] [CrossRef] [PubMed]
- Sokol, N.W.; Whalen, E.D.; Jilling, A. Global Distribution, Formation and Fate of Mineral-Associated Soil Organic Matter Under a Changing Climate: A Trait-Based Perspective. Funct. Ecol. 2022, 36, 1411–1429. [Google Scholar] [CrossRef]
- Kai, L.; Huimin, D.; Yunhong, S. Climate and Soil Geochemistry Influence the Soil Organic Carbon Content in Drylands of the Songliao Plain, Northeast China. Acta Geol. Sin. 2024, 98, 1394–1403. [Google Scholar]
- Wang, H.L.; Wang, J.C.; Zhang, Y.; He, G.X.; Wen, S.Z. Spatial distribution of soil organic carbon and its response to forest growth and soil layer in Cunninghamia lanceolata plantations in mid-subtropical China. For. Ecol. Manag. 2023, 532, 121302. [Google Scholar] [CrossRef]
- Jin, W.T.; Li, Q.F.; Zhang, M.; Li, F.H.; Deng, Y.J. Distribution Characteristics and Influencing Factors of Soil Organic Carbon in Beichuan River Protection Area, Datong, Qinghai Province. Forest Sci. Technol. 2025, 8, 36–41. (In Chinese) [Google Scholar]
- Rong, Q.; Liu, J.; Cai, Y.; Lu, Z.; Zhao, Z.; Yue, W.; Xia, Z. Leaf Carbon, Nitrogen and Phosphorus Stoichiometry of Tamarix Chinensis Lour. in the Laizhou Bay Coastal Wetland, China. Ecol. Eng. 2015, 76, 57–65. [Google Scholar] [CrossRef]
- Xie, L.; Wang, B.; Xin, M.; Wang, M.; He, X.; Wei, Q.; Shi, X.; Sun, X. Characteristics of Vegetation Carbon, Nitrogen, and C/N Ratio in a Tamarix Chinensis Coastal Wetland of China. Clean Soil Air Water 2019, 47, 1800452. [Google Scholar] [CrossRef]
- Xie, L.; Wang, B.; Xin, M.; Wang, M.; He, X.; Wei, Q.; Shi, X.; Sun, X. Impacts of Coppicing on Tamarix Chinensis Growth and Carbon Stocks in Coastal Wetlands in Northern China. Ecol. Eng. 2020, 147, 105760. [Google Scholar] [CrossRef]
- Yuan, M.X.; Zhu, N.H.; Guo, Q. The impact of different artificial forests on soil physicochemical properties and soil quality evaluation in the south subtropical zone. For. Res. 2022, 35, 112–122. (In Chinese) [Google Scholar]
- Ali, A.; Lin, S.L.; He, J.K.; Kong, F.M.; Yu, J.H.; Jiang, H.S. Climate and soils determine aboveground biomass indirectly via species diversity and stand structural complexity in tropical forests. Forest Ecol. Manag. 2019, 432, 823–831. [Google Scholar] [CrossRef]
- Ullah, F.; Gilani, H.; Sanaei, A.; Hussian, K.; Ali, A. Stand structure determines aboveground biomass across temperate forest types and species mixture along a local-scale elevational gradient. Forest Ecol. Manag. 2021, 486, 118984. [Google Scholar] [CrossRef]
- Zhang, S.; Zhou, X.; Chen, Y.; Du, F.; Zhu, B. Soil Organic Carbon Fractions in China: Spatial Distribution, Drivers, and Future Changes. Sci. Total Environ. 2024, 919, 170890. [Google Scholar] [CrossRef]
- Yang, X.; Xu, J.; Wang, H.; Quan, H.; Yu, H.; Luan, J.; Wang, D.; Li, Y.; Lv, D. Vertical Distribution Characteristics of Soil Organic Carbon and Vegetation Types under Different Elevation Gradients in Cangshan, Dali. PeerJ 2024, 12, e16686. [Google Scholar] [CrossRef] [PubMed]
- Zhao, M.L.; Cao, G.C.; Ma, Y.G.; Cao, S.K.; Zhao, Q.L.; Yuan, J.; Yan, X.; He, Q.X.; Qiu, X.X. Spatial Distribution Pattern and Influence Path of Soil Carbon and Nitrogen in the Heihe River Source Region, Northeast Qinghai-Tibet Plateau. Ecol. Indic. 2024, 165, 112181. [Google Scholar] [CrossRef]
- Ying, F.; Hua, X.; Hongyan, H.; Pengshuai, S.; Haisong, M.; Ximei, Z.; Jiangbao, X. Effect of Tamarix chinensis Forest on Soil Improvement in Changyi National Ocean Ecology Special Protection Zone. Wet. Sci. 2023, 21, 35–43. (In Chinese) [Google Scholar]
- Shu, X.; Gao, L.M.; Yang, J.X.; Xia, J.Y.; Song, H.; Zhu, L.M.; Zhang, K.; Wu, L.; Pang, Z.D. Spatial Distribution Characteristics and Influencing Factors of Soil Organic Carbon Based on the Geographically Weighted Regression Model. Environ. Monit. Assess. 2024, 196, 1083. [Google Scholar] [CrossRef]
- Fusaro, C.; Sarria-Guzmán, Y.; Chávez-Romero, Y.A.; Luna-Guido, M.; Muñoz-Arenas, L.C.; Dendooven, L.; Estrada-Torres, A.; Navarro-Noya, Y.E. Land Use Is the Main Driver of Soil Organic Carbon Spatial Distribution in a High Mountain Ecosystem. PeerJ 2019, 7, e7897. [Google Scholar] [CrossRef] [PubMed]
- Wang, J.; Han, P.; Zhang, Y.; Li, J.Y.; Xu, L.X.; Shen, X.; Yang, Z.G.; Xu, S.S.; Li, G.X.; Chen, F.Y. Analysis on Ecological Status and Spatial–Temporal Variation of Tamarix Chinensis Forest Based on Spectral Characteristics and Remote Sensing Vegetation Indices. Environ. Sci. Pollut. Res. 2022, 29, 37315–37326. [Google Scholar] [CrossRef] [PubMed]
- Research Group of Soil Taxonomy; Nanjing Institute of Soil Research; Chinese Academy of Sciences; China Soil System Classification Research Collaborative Group. Classification and Retrieval of Soil Systems in China, 3rd ed.; University of Science and Technology of China Press: Hefei, China, 2001; pp. 70–71. [Google Scholar]
- Certificate and Certified Reference Values for Soil Available Nutrients Reference Material GBW07458 (Heilongjiang Black Soil), 2009.
- Sousa, R.B.D.; Netto-Ferreira, J.B.; Barra, C.M.; Alves, B.J.; Lã, O.R.; Rocha Junior, J.G. Sustainable Wet Method for Determination of Total Organic Carbon in Soils Using Potassium Permanganate as a Substitute for Potassium Dichromate. J. Soil Sci. Plant Nut 2025, 25, 322–330. [Google Scholar] [CrossRef]
- Wang, Q.; Wang, W.; He, X.; Zhang, W.; Song, K.; Han, S. Role and Variation of the Amount and Composition of Glomalin in Soil Properties in Farmland and Adjacent Plantations with Reference to a Primary Forest in North-Eastern China. PLoS ONE 2015, 10, e0139623. [Google Scholar] [CrossRef]
- Hongye, X.; Nana, F.; Xi, W.; Kai, L.; Hui-min, D.; Ze, Y.; Guo-dong, L. Spatiotemporal distribution characteristics of surface soil carbon pool in Sanjiang Plain. Geol. Resour. 2025, 34, 217–224+245. (In Chinese) [Google Scholar]
- Zhang, Y.; Chang, X.; Liang, J.; Luo, D.; He, R. The efficacy of Kriging spatial interpolation for filling temporal gaps in daily air temperature data: A case study in northeast China. Sci. Cold Arid. Reg. 2016, 8, 441–449. [Google Scholar]
- Zou, F.; Li, X.; Zhang, Y.; Wang, Z.; Liu, J. Dynamic changes in and driving factors of soil organic carbon in China from 2001 to 2020. Land 2024, 13, 1764. [Google Scholar] [CrossRef]
- Harsha, B.R.; Kumar, K.S.A.; Nandeesha, C.V. Climatic Analysis, Soil Site Suitability Evaluation and Soil Organic Carbon Stock Studies on Major Grape-Growing Soils in the Southern Karnataka, India. Commun. Soil Sci. Plant Anal. 2023, 54, 3043–3062. [Google Scholar] [CrossRef]
- Vos, C.; Balesdent, J.; Angers, D.A. Assessing spatial and seasonal variability in soil organic carbon fractions of teal carbon in semi-arid Ramsar wetlands of India as a natural climate solution. Wetl. Ecol. Manag. 2022, 33, 215–230. [Google Scholar]
- Li, L.; Yue, Y.J.; Qin, F.C. Multi-Scale Characterization of Spatial Variability of Soil Organic Carbon in a Semiarid Zone in Northern China. Sustainability 2022, 14, 9390. [Google Scholar] [CrossRef]
- Zhang, X.Y.; Zhang, D.D.; Zhang, Y. Spatiotemporal Patterns and Drivers of Soil Organic Carbon in Black Soil Landscapes of Northeast China. PLoS ONE 2024, 19, e0320784. [Google Scholar]
- Zhang, J.; Song, M.; Zheng, S.; Zhou, P.; Guo, J.; He, J.; Yue, H. Distribution Characteristics of Top SOC in Different Forest Types of Genhe in the Greater Khingan Range of Inner Mongolia. Sci. Rep. 2025, 15, 6736. [Google Scholar] [CrossRef]
- Zhang, Y.; Wang, X.; Zheng, Y.; Duan, L. Characteristics of Soil Organic Carbon Fractions and Influencing Factors in Different Understory Mosses in Karst Urban Parks. Sci. Rep. 2024, 14, 27691. [Google Scholar] [CrossRef]
- Gore, C.; Garrett, A.; Ladd, C.J.T.; Möller, I. Saltmarsh blue carbon accumulation rates and their relationship with sea-level rise on a multi-decadal timescale in northern England. Estuar. Coast. Shelf Sci. 2024, 284, 108665. [Google Scholar] [CrossRef]
- Ge, J.X.; Cui, B.L.; Wang, X.J.; Xie, B.H.; Zhao, M.L.; Yu, D.X.; Yu, Y.; Song, W.M.; Ma, H.Q.; Zhang, X.S.; et al. The Influence of Tidal Gully Morphology on the Spatial Distribution of Soil Organic Carbon in Tidal Flat Wetlands. Environ. Eng. 2023, 41, 23–31. (In Chinese) [Google Scholar] [CrossRef]
- Naughton, H.R.; Keiluweit, M.; Tfaily, M.M.; Dynes, J.J.; Regier, T.; Dendorf, S. Development of Energetic and Enzymatic Limitations on Microbial Carbon Cycling in Soils. Biogeochemistry 2021, 153, 191–213. [Google Scholar] [CrossRef]
- Mayer, M.; Prescott, C.E.; Abaker, W.E.A.; Augusto, L.; Cécillon, L.; Ferreira, G.W.D.; Jason, J.; Jandl, R.; Katzensteiner, K.; Laclau, J.P.; et al. Tamm Review: Influence of Forest Management Activities on Soil Organic Carbon Stocks: A Knowledge Synthesis. Forest Ecol. Manag. 2020, 466, 118127. [Google Scholar] [CrossRef]
- Niu, X.G.; Zhang, S.L.; Zhang, C.B.; Yan, P.K.; Wang, H.; Xu, W.T.; Song, M.K.; Aurangzeib, M. Key Factors Influencing the Spatial Distribution of Soil Organic Carbon and Its Fractions in Mollisols. Catena 2024, 247, 108522. [Google Scholar] [CrossRef]
- Wang, C.; Liu, X.T.; Tong, C.; Chen, X.X.; Chen, Y.Y.; Mou, X.J.; Wan, S.A. The Effect of Water Salt Gradient on Soil Organic Carbon Components in the Minjiang River Estuary Wetland. China Environ. Sci. 2017, 37, 3919–3928. (In Chinese) [Google Scholar]
- Han, G.X. Research Progress on the Impact Mechanism of Tidal Action and Wet Dry Alternation on Carbon Exchange in Salt Marsh Wetlands. J. Ecol. 2017, 37, 8170–8178. [Google Scholar]
- Zhang, J.H.; Li, G.D.; Wang, Y.S.; Zhu, L.Q.; Zhao, W.L.; Ding, Y.P. Spatial Characteristics and Variation Mechanisms of Different Components of Soil Organic Carbon in the Yellow River Sediment Erosion/Deposition Area. Acta Geogr. Sin. 2020, 75, 558–570. (In Chinese) [Google Scholar]
- Wang, L.; Ying, R.R.; Shi, J.Q.; Long, T.; Acta, Y.L. Research Progress on the Adsorption and Fixation Mechanism of Soil Minerals on Organic Matter. Acta. Pedofil. Sin. 2017, 54, 805–818. (In Chinese) [Google Scholar]
- Luo, X.; Xie, Y.; Han, C. Plant species richness increases the relationship between soil microbial and extracellular enzyme activities and enhances soil fertility. Ecolo. Indi. 2025, 171, 113202. [Google Scholar] [CrossRef]
- Liu, M.; Hugelius, G.; Olefeldt, D. Unprotected carbon dominates decadal soil carbon increase. Nat. Commun. 2024, 15, 2314. [Google Scholar] [CrossRef]
- Wang, H.; Yin, Y.; Cai, T. Global patterns of soil organic carbon dynamics in the 20–100 cm soil profile for different eco-systems: A global meta-analysis. Earth Syst. Sci. Data Discuss. 2024, 17, 3375–3390. [Google Scholar] [CrossRef]
- Chen, P.; Xie, Y.; Ren, X. Spatial variation of soil organic carbon density in the black soil region of Northeast China under the influence of erosion and deposition. J. Clean. Prod. 2024, 475, 143616. [Google Scholar] [CrossRef]
- Gong, Z.; Wen, T.Y.; Jin, C.; Zhao, K.; Su, M. Distribution Characteristics and Influencing Factors of Soil Organic Carbon in Intertidal Wetlands in Central Jiangsu Province. J. Appl. Ecol. 2023, 34, 2978–2984. (In Chinese) [Google Scholar]
- Xi, M.; Lu, X.; Li, Y.; Kong, F. Distribution Characteristics of Dissolved Organic Carbon in Annular Wetland Soil-Water Solutions through Soil Profiles in the Sanjiang Plain, Northeast China. J. Environ. Sci. 2007, 19, 1074–1078. [Google Scholar] [CrossRef] [PubMed]
- Yuan, Z.; Fu, C.; Liu, J. Soil Organic Carbon Stocks Depend Differently on Physicochemical Features in Subtropical Seasonally Flooded Wetland and Non-flooded Shoreland Forest. Land. Degrad. Dev. 2025, 36, 144–157. [Google Scholar] [CrossRef]
- Carbajal, M.; Ramírez; David, A.; Turin, C. From Rangelands to Cropland, Land-Use Change and Its Impact on Soil Organic Carbon Variables in a Peruvian Andean Highlands: A Machine Learning Modeling Approach. Ecosystems 2024, 27, 899–917. [Google Scholar] [CrossRef]
- Sun, J.; Xia, J.B.; Dong, B.T.; Gao, F.L.; Chen, P.; Zhao, W.L.; Li, C.R. Root Morphology and Growth Characteristics of Tamarix Ramosissima Forests with Different Densities in Coastal Mudflat of the Yellow River Delta. J. Ecol. 2021, 41, 3775–3783. (In Chinese) [Google Scholar]
- Amini, S.; Ghadiri, H.; Chen, C.; Marschner, P. Salt-Affected Soils, Reclamation, Carbon Dynamics, and Biochar: A Review. J. Soils Sediments 2016, 16, 939–953. [Google Scholar] [CrossRef]
- Liu, X.D.; Qiao, Y.N.; Zhou, G.Y. Controlling action of soil organic matter on soil moisture retention and its availability. Chin. J. Plant Ecol. 2011, 35, 1209–1218. [Google Scholar] [CrossRef]
- Zhu, Y.H.; Liu, X.L.; Chen, W.F.; Song, X.L.; Lin, X.T.; Niu, X.C. Eco-stoichiometric Characteristics of Soil Carbon, Nitrogen, and Phosphorus in Reclaimed Area of Abandoned Salt Pan in the Yellow River Delta. J. Soil Water Conserv. 2020, 34, 352–360. [Google Scholar]
- Huang, M.Z.; Lan, J.C.; Wang, S.S.; Wang, J.X.; Qi, X.; Liu, L.; Yue, K.Q. Effects of Soil Exchangeable Calcium in Promoting the Accumulation of Soil Organic Carbon by Karst Vegetation Restoration. J. Soil Sci. Plant Nutr. 2024, 24, 843–854. [Google Scholar] [CrossRef]
- Wan, Q.Z.; Zhu, G.F.; Guo, H.W.; Zhang, Y.; Pan, H.X.; Yong, L.L.; Ma, H.Y. Influence of Vegetation Coverage and Climate Environment on Soil Organic Carbon in the Qilian Mountains. Sci. Rep. 2019, 9, 17623. [Google Scholar] [CrossRef]
- Seitz, D.; Fischer, L.M.; Dechow, R.; Wiesmeier, M.; Don, A. The Potential of Cover Crops to Increase Soil Organic Carbon Storage in German Croplands. Plant Soil. 2023, 488, 157–173. [Google Scholar] [CrossRef]
- Smith, A.J.; Kirwan, M.L. Sea Level-driven Marsh Migration Results in Rapid Net Loss of Carbon. Geophys. Res. Lett. 2021, 48, e2021GL092420. [Google Scholar] [CrossRef]
- Arif, Y.; Singh, P.; Siddiqui, H.; Bajguz, A.; Hayat, S. Salinity Induced Physiological and Biochemical Changes in Plants: An Omic Approach towards Salt Stress Tolerance. Plant Physiol. Biochem. 2020, 156, 64–77. [Google Scholar] [CrossRef]
- Menezes, R.S.C.; Sales, A.T.; Primo, D.C.; Albuquerque, E.R.G.M.; Jesus, K.N.; Pareyn, F.G.C.; Santana, M.S.; Santos, U.J.; Martins, J.C.R.; Althoff, T.D.; et al. Soil and Vegetation Carbon Stocks after Land-Use Changes in a Seasonally Dry Tropical Forest. Geoderma 2021, 390, 114943. [Google Scholar] [CrossRef]
- Zhang, H.; Li, F.R.; Zhang, T.H.; Li, Y.L.; Su, Y.Z. Dynamics and variation characteristics of soil wind erosion in bare sandy farmland in spring. J. Soil Water Conserv. 2002, 16, 29–32. (In Chinese) [Google Scholar]
- Zhu, Z.; Wang, Z.; Dong, C. Physics informed neural network modelling for storm surge forecasting—A case study in the Bohai Sea, China. Coast. Eng. 2025, 197, 104686. [Google Scholar] [CrossRef]
- Yu, L.; Tao, Z.; Bai, J.H.; Wang, J.J.; Yu, Z.B.; Wang, X.; Zhang, G.L. Effects of Water and Salinity on Soil Labile Organic Carbon in Estuarine Wetlands of the Yellow River Delta, China. Ecohydrol. Hydrobiol. 2020, 20, 556–569. [Google Scholar] [CrossRef]
- Qu, W.D.; Li, J.Y.; Han, G.X.; Wu, H.T.; Song, W.M.; Zhang, X.S. Effect of Salinity on the Decomposition of Soil Organic Carbon in a Tidal Wetland. J. Soils Sediments 2019, 19, 609–617. [Google Scholar] [CrossRef]
- Xia, S.P.; Song, Z.L.; Van Zwieten, L.; Guo, L.D.; Yu, C.X.; Wang, W.Q.; Li, W.; Hartley, I.P.; Yang, Y.H.; Liu, H.Y.; et al. Storage, Patterns and Influencing Factors for Soil Organic Carbon in Coastal Wetlands of China. Glob. Change Biol. 2022, 28, 6065–6085. [Google Scholar] [CrossRef] [PubMed]
- Liu, L.; Zhang, Q.; Liu, Q.; Li, Z. Is Soil an Organic Carbon Sink or Source upon Erosion, Transport and Deposition? Eur. J. Soil Sci. 2023, 74, e13344. [Google Scholar] [CrossRef]
- Peng-shuai, S.; Hong-yan, H.A.N.; Jing-kuan, S.U.N. Effects of Wetland Degradation and Restoration on Soil Organic Carbon Content and Infrared Carbon Compounds of Tamarix Chinensis Woodland in the Yellow River Delta. Chin. J. Ecol. 2022, 41, 1258. [Google Scholar]
Disclaimer/Publisher’s Note: The statements, opinions and data contained in all publications are solely those of the individual author(s) and contributor(s) and not of MDPI and/or the editor(s). MDPI and/or the editor(s) disclaim responsibility for any injury to people or property resulting from any ideas, methods, instructions or products referred to in the content. |
© 2025 by the authors. Licensee MDPI, Basel, Switzerland. This article is an open access article distributed under the terms and conditions of the Creative Commons Attribution (CC BY) license (https://creativecommons.org/licenses/by/4.0/).
