Article

Evaluating the Effects of Glutathione and Controlled-Release Fertilizer on the Height Growth of Cryptomeria japonica D. Don Seedlings Accounting for Topography and Vegetation

1
Department of Plant Ecology, Forestry and Forest Products Research Institute, Tsukuba 305-8687, Japan
2
Kyushu Research Center, Forestry and Forest Products Research Institute, Kumamoto 860-0862, Japan
*
Author to whom correspondence should be addressed.
Forests 2025, 16(9), 1407; https://doi.org/10.3390/f16091407
Submission received: 1 August 2025 / Revised: 29 August 2025 / Accepted: 29 August 2025 / Published: 2 September 2025

Abstract

Fertilization is occasionally applied to promote early growth of outplanted tree seedlings. However, the effectiveness of fertilization can be obscured by topographic variations and competing vegetation. The aim of this study was to reevaluate the effects of fertilization and glutathione disulfide (GSSG) on Cryptomeria japonica D. Don (Japanese cedar) seedling height using a four-year dataset from a previous study showing no significant effects using linear models. The impact of treatment was examined using random forest, generalized additive models (GAMs), and structural equation models (SEMs), while accounting for topography and competing vegetation. Topographic features, including the topographic wetness index, were the primary determinants of height growth, reflecting C. japonica’s preference for moist environments. Although the effects of fertilization and GSSG were limited, the GAMs indicated marginal positive interactions in specific stable topographic contexts. The SEMs revealed that fertilization and GSSG indirectly negatively reduced height by increasing competing vegetation coverage. By applying these advanced statistical approaches, we demonstrate how treatment effects that conventional analyses might overlook can be detected, illustrating the methodological contribution of this study. These findings show that topography plays a dominant role in early C. japonica growth, and fertilization and GSSG provide only modest, context-dependent benefits.

1. Introduction

Prompt growth of planted tree seedlings after outplanting is essential for successful afforestation [1,2]. Fertilization is occasionally applied at the time of outplanting to promote early growth [3,4]. However, in contrast to the well-documented benefits of fertilization in agricultural systems, the effects of fertilization can be unpredictable in forestry settings [5,6], as forestry operations are frequently conducted on heterogeneous terrain, unlike the relatively uniform conditions of agricultural landscapes. This topographical variability results in substantial differences in soil properties [7,8], even within a single plantation [9], which can influence the seedling response to fertilization [10,11]. The overgrowth of competing vegetation may also obscure the effects of fertilization [4,12]. Vegetation control is usually less intensive in forestry compared with agricultural practices. Thus, competing vegetation may absorb a substantial portion of applied fertilizer, reducing the nutrient availability for newly planted seedlings [13]. This uptake of fertilizers can diminish the intended benefits of fertilization by stimulating vegetation growth, intensifying competition, and suppressing seedling growth [4,14].
Cryptomeria japonica D. Don (Japanese cedar) is the most important temperate evergreen conifer in Japanese forestry, valued primarily for construction timber, as well as for furniture and pulp. First-generation plantations were established in areas that underwent heavy logging during and after World War II. These plantations are reaching the final harvesting stage [15]. Thus, clear-cutting followed by reforestation is increasing. Plantations are established almost exclusively by planting rather than natural regeneration, and the management cycle typically follows site preparation, planting, early weeding, pre-commercial thinning, commercial thinning, and final harvesting (usually at 40–60 years). However, the country’s warm and humid climate promotes vigorous regrowth of vegetation around outplanted seedlings, necessitating intensive postplanting management. Vegetation is usually manually removed by brush cutters for five or more consecutive years to successfully establish seedlings, as herbicides are generally not used for vegetation control in Japan [16,17]. Due to the steep and operationally demanding terrain of reforestation sites and the growing shortage of silviculture workers, this labor-intensive practice is expensive, impeding sustained vegetation management. In some cases, reforestation following clear-cutting has been postponed or cancelled, posing a critical threat to the sustainability of plantation forestry in Japan.
To address this issue, silvicultural investigations have explored the use of controlled-release fertilizer and glutathione disulfide (GSSG) at the time of outplanting. GSSG, a tripeptide antioxidant, enhances stress tolerance and promotes plant growth in several crop species [18,19,20,21]. These treatments can enhance vertical height growth, enabling seedlings to overtop competing vegetation more quickly and reducing the need for repeated manual weeding, although their application is labor- and resource-intensive. However, in our previous planting trial, linear model analysis showed that fertilization and GSSG did not significantly promote the growth of C. japonica seedlings [22], which may be because the effects of site conditions and competing vegetation were not taken into account, and possibly also because of the limited dataset available.
We hypothesize that fertilization and GSSG treatments will enhance the height growth of C. japonica under conditions of low vegetation and favorable topography, whereas high competition of complex topography may reduce these effects. To explore these hypotheses and demonstrate the utility of advanced statistical approaches for detecting treatment effects under heterogeneous topography and limited sample sizes, we reanalyzed the previously collected dataset [22] using multiple complementary statistical approaches. Random forest regression was employed to assess treatment effects under varying topography [23,24,25], generalized additive models (GAMs) were used to capture nonlinear growth responses to treatments across varying topography [26,27], and structural equation modeling (SEM) allowed us to evaluate direct and indirect effects of competing vegetation [7,28]. Height growth was chosen as the primary response variable because overtopping surrounding vegetation is crucial for reducing competition and minimizing the need for repeated manual weeding. By applying these methods, we explored how fertilization and GSSG treatments may influence seedling growth under diverse topographic and competitive scenarios, illustrating how advanced statistical approaches can reveal treatment effects that conventional analyses might overlook. The results provide preliminary insights that could inform the optimization of silvicultural practices in heterogeneous environments.

2. Materials and Methods

2.1. Study Site and Experimental Design

The study site was located in a reforested area of the Takabou National Forest in northern Ibaraki Prefecture, Japan (36°52′ N, 140°40′ E), at an elevation of 420–470 m above sea level and an average slope of approximately 30°. Based on data from the nearest meteorological station (Kitaibaraki Meteorological Station [29]), the mean annual temperature and precipitation were 13.8 °C (range: 13.6–13.9 °C) and 1452 mm (range: 1105–1804 mm), respectively, during the study period (2019–2022). The mean temperatures of the coldest and warmest months were 2.6 °C and 25.0 °C, respectively. The site is classified as a humid subtropical climate (Cfa) according to the Köppen climate classification. The soil at the site is an allophanic Andosol (black volcanic ash soil). The site had been a C. japonica plantation that was clear-cut in the year prior to planting for this study, and it was manually prepared for reforestation.
Two-year-old C. japonica seedlings grown in 150 cc multicavity containers (JFA150, Zenbyouren, Tokyo, Japan) were planted on 8 May 2019, along a 188 m transect at elevations of 420–470 m above sea level [22]. The linear transect was selected to fit the constraints of the national forest site while allowing the sampling of a range of micro-topographic conditions along the slope. The seedlings were arranged in two parallel rows at 2.2 m intervals and assigned to four treatment groups: (1) control (no treatment), (2) controlled-release fertilizer, (3) GSSG granules, and (4) combined fertilizer and GSSG. Each treatment was assigned to two rows × two seedlings (i.e., four seedlings) and replicated 20 times, resulting in 80 seedlings for this study (Figure 1a). While some gaps occurred along the transect due to logging trails or logging residue accumulation, the overall linear arrangement was maintained. The treatments were distributed using a cyclic block design: each block of four seedlings (2 × 2) contained all four treatments, and their positions were rotated across successive blocks to balance spatial heterogeneity (Figure 1b).
The controlled-release fertilizer (Hi-Control 650-180, N:P:K 16-5-10, released over 180 days; JCAM AGRI Co., Ltd., Chiyoda, Tokyo, Japan; 3–4 mm prills) was applied at 10 g per seedling, 10 cm from the planting spot. The nutrients are enclosed in a resin coating, which allows gradual diffusion into the soil as moisture penetrates micro-pores. GSSG (KANEKA PEPTIDE R1, 1% GSSG, Kaneka Co., Osaka, Japan), a water-soluble powder, was applied directly into the planting hole at 16 g per seedling. These application rates were determined according to previous studies on Eucalyptus globulus [30,31], in which growth and photosynthetic efficiency were promoted. During container cultivation, the seedlings were fertilized in the spring of their first and second years (Hi-Control 650-180, 1.5 g per plant in both years); no additional fertilization was applied, and because of the 180-day release period, its effect was assumed to be negligible at the time of outplanting.

2.2. Seedling Growth and Vegetation Surveys

Seedling height (to the nearest 1 cm, measured with a ruler) and root collar diameter (RCD; to the nearest 0.1 mm, measured with calipers) were recorded immediately after planting (13 May 2019) and annually over four growing seasons (25 November 2019, 3 December 2020, 26 November 2021, and 1 November 2022), with n = 20 seedlings per treatment. The data on seedling height and RCD were reported in Tobita et al. [22]. Seedling volume (D2H, cm3), calculated as height multiplied by the square of RCD, was used as an index of seedling size, and the height-to-RCD ratio (H:D ratio) was calculated as an indicator of stem form.
Vegetation surveys were conducted during the summers before manual vegetation clearing in years 2, 3, and 4 (17 August 2020, 12 July 2021, and 10 August 2022). The tallest competing vegetation species within a 1 m radius of each seedling (i.e., the species exerting the greatest shading pressure) and the vegetation height were recorded. In addition, the percentage of each seedling’s surface area covered by surrounding vegetation (termed vegetation coverage) was visually estimated in 10% increments (0%–100%) [26,32] by a single trained observer who thoroughly examined the entire seedling, following a consistent protocol to ensure uniform assessment across all plots. Vegetation clearing was carried out from summer to early autumn of each year; in years 2–4, this followed the vegetation surveys, while in the first year, when no surveys were conducted, all vegetation in the planting area was manually cut to ground level using brush cutters. No herbicides were applied. Consequently, the vegetation patterns observed in subsequent surveys largely reflect regrowth from the previous year following manual clearing.

2.3. Calculation of Topographic Variables

A high-resolution digital elevation model (DEM) was generated from aerial imagery captured using an unmanned aerial vehicle (UAV) (Mavic 2 Pro, DJI, Shenzhen, China) on 25 June 2019 (approximately one month after planting). The flight was conducted at a constant altitude of 60 m above ground level using the Litchi app (VC Technology Ltd., London, UK). Thus, the ground sampling distance was 1.76 cm/pixel. The imagery covered the 10 ha reforested area, including the study site. The images were processed using Pix4Dmapper (Version 4.4.12; Pix4D S.A., Prilly, Switzerland) to produce the DEM. Five ground control points (GCPs), surveyed with high-precision GNSS (Global Navigation Satellite System) within the study area, were used for georeferencing to ensure high positional accuracy. The DEM was resampled at 1, 2, 3, 4, and 5 m spatial resolutions for topographic analyses, which were chosen to capture variation relevant to the scale of individual seedlings, considering that the planting spacing was 2.2 m and the maximum seedling height was approximately 4 m in the final year of this study.
The following topographic indices were calculated using the SAGA toolbox (version 2.12.99) in QGIS (version 3.22): topographic wetness index (TWI; higher values indicate wetter conditions), with suction = 10, area type = square root of catchment area, and slope type = catchment slope; terrain ruggedness index (TRI; higher values indicate more uneven terrain), with circular search mode, search radius = 1, and no distance weighting; topographic position index (TPI; high positive values indicate ridges, negative values indicate valleys), with standardization enabled, no distance weighting, power = 1, and bandwidth = 75; and LS factor (LSF; higher values indicate greater erosion risk) with local slope, specific catchment area type = contour-length-dependent, rill/interrill erosivity = 1, and stability = stable. In the winter after the fourth growing season, when competing vegetation withered or shed leaves and the planted seedlings were clearly visible, an orthophoto was generated from the UAV imagery under the same conditions as described above. These images were used to determine the precise location of each surveyed seedling. The values of the topographic indices were extracted using these corresponding locations.

2.4. Statistical Analyses

All statistical analyses were conducted using R version 4.5.0 [33]. A significance threshold of α = 0.05 was used for all hypothesis testing. Seedlings that died (5 individuals: 1 control, 2 fertilizer-only, 2 fertilizer + GSSG) or were inadvertently mowed during vegetation clearing (4 individuals: 2 control, 2 GSSG) were excluded from the analysis. These exclusions were distributed across treatment groups without a clear pattern, indicating no obvious differences in mortality or accidental removal among treatments.

2.4.1. Generalized Linear Mixed Models for Treatment Effects on Seedling and Vegetation Growth

The effects of GSSG and fertilizer applications at planting on early seedling performance and surrounding vegetation responses were analyzed using generalized linear mixed models (GLMMs). All models included GSSG, fertilizer treatments, and their interaction as fixed effects, with replication group (20 blocks) included as a random effect to account for block-level variation. The contribution of the random effect to the total variance ranged from 5% to 20% across traits, indicating a moderate effect of block-level variation.
GLMMs, assuming a Gaussian error distribution with an identity link function, were fitted for seedling traits (height, RCD, D2H, and H:D ratio) and the maximum height of the surrounding vegetation using the lmer() function from the lme4 package [34]. When analyzing changes in height, RCD, and D2H from the first to the fourth growing seasons, the initial values at planting were included in the models as offset terms to account for initial variation among seedlings. Vegetation coverage rate, defined as the percentage of each seedling’s surface area visually obscured by surrounding vegetation, was analyzed using a GLMM with a binomial error distribution and a logit link function. The model included the same fixed and random effects structure as the other models. The significance of fixed effects was assessed with Type II Wald chi-square tests using the car package [35]. If the interaction effect and the main effect of fertilizer or GSSG were significant, a post hoc analysis was conducted using estimated marginal means via the emmeans() function from the emmeans package [36].
Tobita et al. [22] included a competition index (a categorical variable with four levels) as a fixed effect in their GLMM analysis of seedling height and RCD from the first to fourth growing seasons. We excluded this parameter because the influence of competition was examined in a separate analysis using structural equation modeling (see Section 2.4.4).

2.4.2. Topographic and Treatment Effects on Seedling Height: Random Forest Regression

The influence of planting treatments and topographic conditions on seedling height after four growing seasons was assessed with a random forest regression using the randomForest package [37]. As a preliminary step, a full model was constructed that included all available explanatory variables: treatment effects, initial seedling morphology (height, RCD, and H:D ratio), and a suite of topographic indices (e.g., TRI, TPI, TWI, and LSF), each calculated at five spatial resolutions (1 to 5 m).
Hyperparameters were optimized by model tuning, and variable importance was assessed based on the percentage increase in mean squared error (%IncMSE) (Figure S1). To reduce collinearity among topographic variables across scales, the optimal resolution for each index, defined as the one yielding the highest %IncMSE, was selected. A reduced model was then built using only the selected indices, and variable importance was recalculated to assess their relative contributions to seedling height.

2.4.3. Topographic Influence Assessment on the Effects of Fertilizer and GSSG: Generalized Additive Models

To assess variations in treatment effects along topographic gradients, GAMs were fitted using the mgcv package [38,39]. The analysis included the topographic indices selected via the random forest regression (Section 2.4.2) related to seedling height after four growing seasons. The planting treatment was modeled as a four-level categorical variable (treatment: control, fertilizer only, GSSG only, and fertilizer + GSSG), and the interactions with each topographic index were included using the “by” argument in the smoothing function. Initial RCDs and H:D ratios were included as covariates to account for preplanting variability.
The models assumed a Gamma error distribution with a log link function due to the right-skewed nature of the response variable. The models were fitted using maximum likelihood estimation. For each topographic index, the significance of treatment effects across gradients was determined by comparing the full model, including the treatment and its interaction with the topographic index, with a null model excluding the treatment term. Model comparisons were performed using Type II likelihood ratio tests.
Fitted GAMs with 95% confidence intervals were visualized for each treatment group. Regions where the confidence intervals of the treatment groups and the control group did not overlap indicated potentially meaningful treatment effects.

2.4.4. Vegetation Influence Assessment of the Effects of Fertilizer and GSSG: Structural Equation Modeling

To evaluate whether the effects of fertilization and GSSG on seedling growth were mediated by competition from surrounding vegetation, an SEM was developed using the lavaan package [40]. While the other models targeted seedling height after four growing seasons, the SEM focused on height at the end of the third growing season, as the suppressive effect of vegetation had weakened by the fourth year.
The SEM included both direct and indirect paths. Third-year seedling height was modeled as being directly influenced by fertilization, GSSG, vegetation coverage in the second and third summers, and initial seedling traits (RCD and H:D ratio). Both fertilization and GSSG were modeled as influencing vegetation coverage in the second and third summers, thereby allowing for indirect effects on seedling height via vegetation competition. Vegetation coverage in each year was modeled independently, without assuming causal links between years.
The model was fitted using robust standard errors clustered based on planting replication units (block of four seedlings under one set of treatments). The strength and significance of direct and indirect effects were assessed using standardized path coefficients and model fit indices.

2.5. Use of Generative AI Tools

Parts of the R code used for statistical analysis in this study were developed with the assistance of generative AI tools, including ChatGPT-4 and ChatGPT-5 (OpenAI) and GitHub Copilot (GitHub). These tools were used to support the generation of scripts and the troubleshooting of code. Additionally, ChatGPT was used to assist in translating and refining the English text. All outputs generated by these tools were carefully reviewed and edited by the authors.

3. Results

3.1. Seedling and Vegetation Growth

The mean height of C. japonica seedlings was 42 ± 8 cm (standard deviation, SD; range: 26–61 cm) at planting and increased to 205 ± 65 cm (110–386 cm) after four growing seasons (Figure 2a). The mean RCD was 5.0 ± 0.6 mm (3.5–6.5 mm) at planting and reached 45.5 ± 21.2 mm (19.1–128 mm) after four growing seasons (Figure 2b). The mean D2H increased from 11 ± 4 cm3 (4–18 cm3) at planting to 6655 ± 11,207 cm3 (409–63,242 cm3) after four growing seasons (Figure 2c). Based on GLMM analyses, the fertilization and GSSG treatments did not significantly affect the growth parameters during the four-year growing period.
The mean H:D ratio of C. japonica seedlings decreased from 85 ± 15 (59–126) at planting to 47 ± 11 (4–80) after three growing seasons, indicating that RCD growth outpaced height growth during this period (Figure 2d). The H:D ratio was stable at 47 ± 10 (16–66) after the fourth growing season. The GLMM results showed no significant effects of the fertilization or GSSG treatments on the H:D ratio during the study period.
The tallest surrounding vegetation species within 1 m of the seedlings varied over the four-year study. In the second summer, the most common tallest species was the deciduous shrub Rubus microphyllus, followed by other Rubus species and the deciduous small tree Mallotus japonicus. R. microphyllus was dominant in the third summer, although the deciduous shrub Aralia elata and the deciduous herb Macleaya cordata were also common. By the fourth summer, the most frequent tallest species was the annual herb Erigeron sumatrensis, followed by the deciduous shrub Callicarpa japonica, M. cordata, and the perennial grass Miscanthus sinensis. R. microphyllus became less prominent in the fourth year.
In the second summer, the vegetation coverage of the seedlings varied widely from 0% to 100% across all treatments (Figure 3a). GLMM analysis revealed significant effects of fertilization, GSSG, and their interaction. The combination of fertilization and GSSG resulted in the highest coverage, followed by GSSG alone. In the third summer, vegetation coverage decreased, but treatment trends were consistent with the second year. In the fourth summer, vegetation coverage declined across all treatment groups (with a median value of 0 for all); however, the coverage tended to be higher in the fertilization and GSSG and GSSG-only treatment groups.
The maximum height of the surrounding vegetation within 1 m of the planted seedlings was 104 ± 44 cm (0–222 cm) in the second summer, 102 ± 38 cm (40–230 cm) in the third summer, and 154 ± 47 cm (80–367 cm) in the fourth summer (Figure 3b). The maximum vegetation height was significantly higher in the fertilization group at all time points, but GSSG and the interaction between fertilization and GSSG did not significantly affect maximum vegetation height.

3.2. Analysis of Seedling Growth Considering Topographic Parameters and Planting Treatments

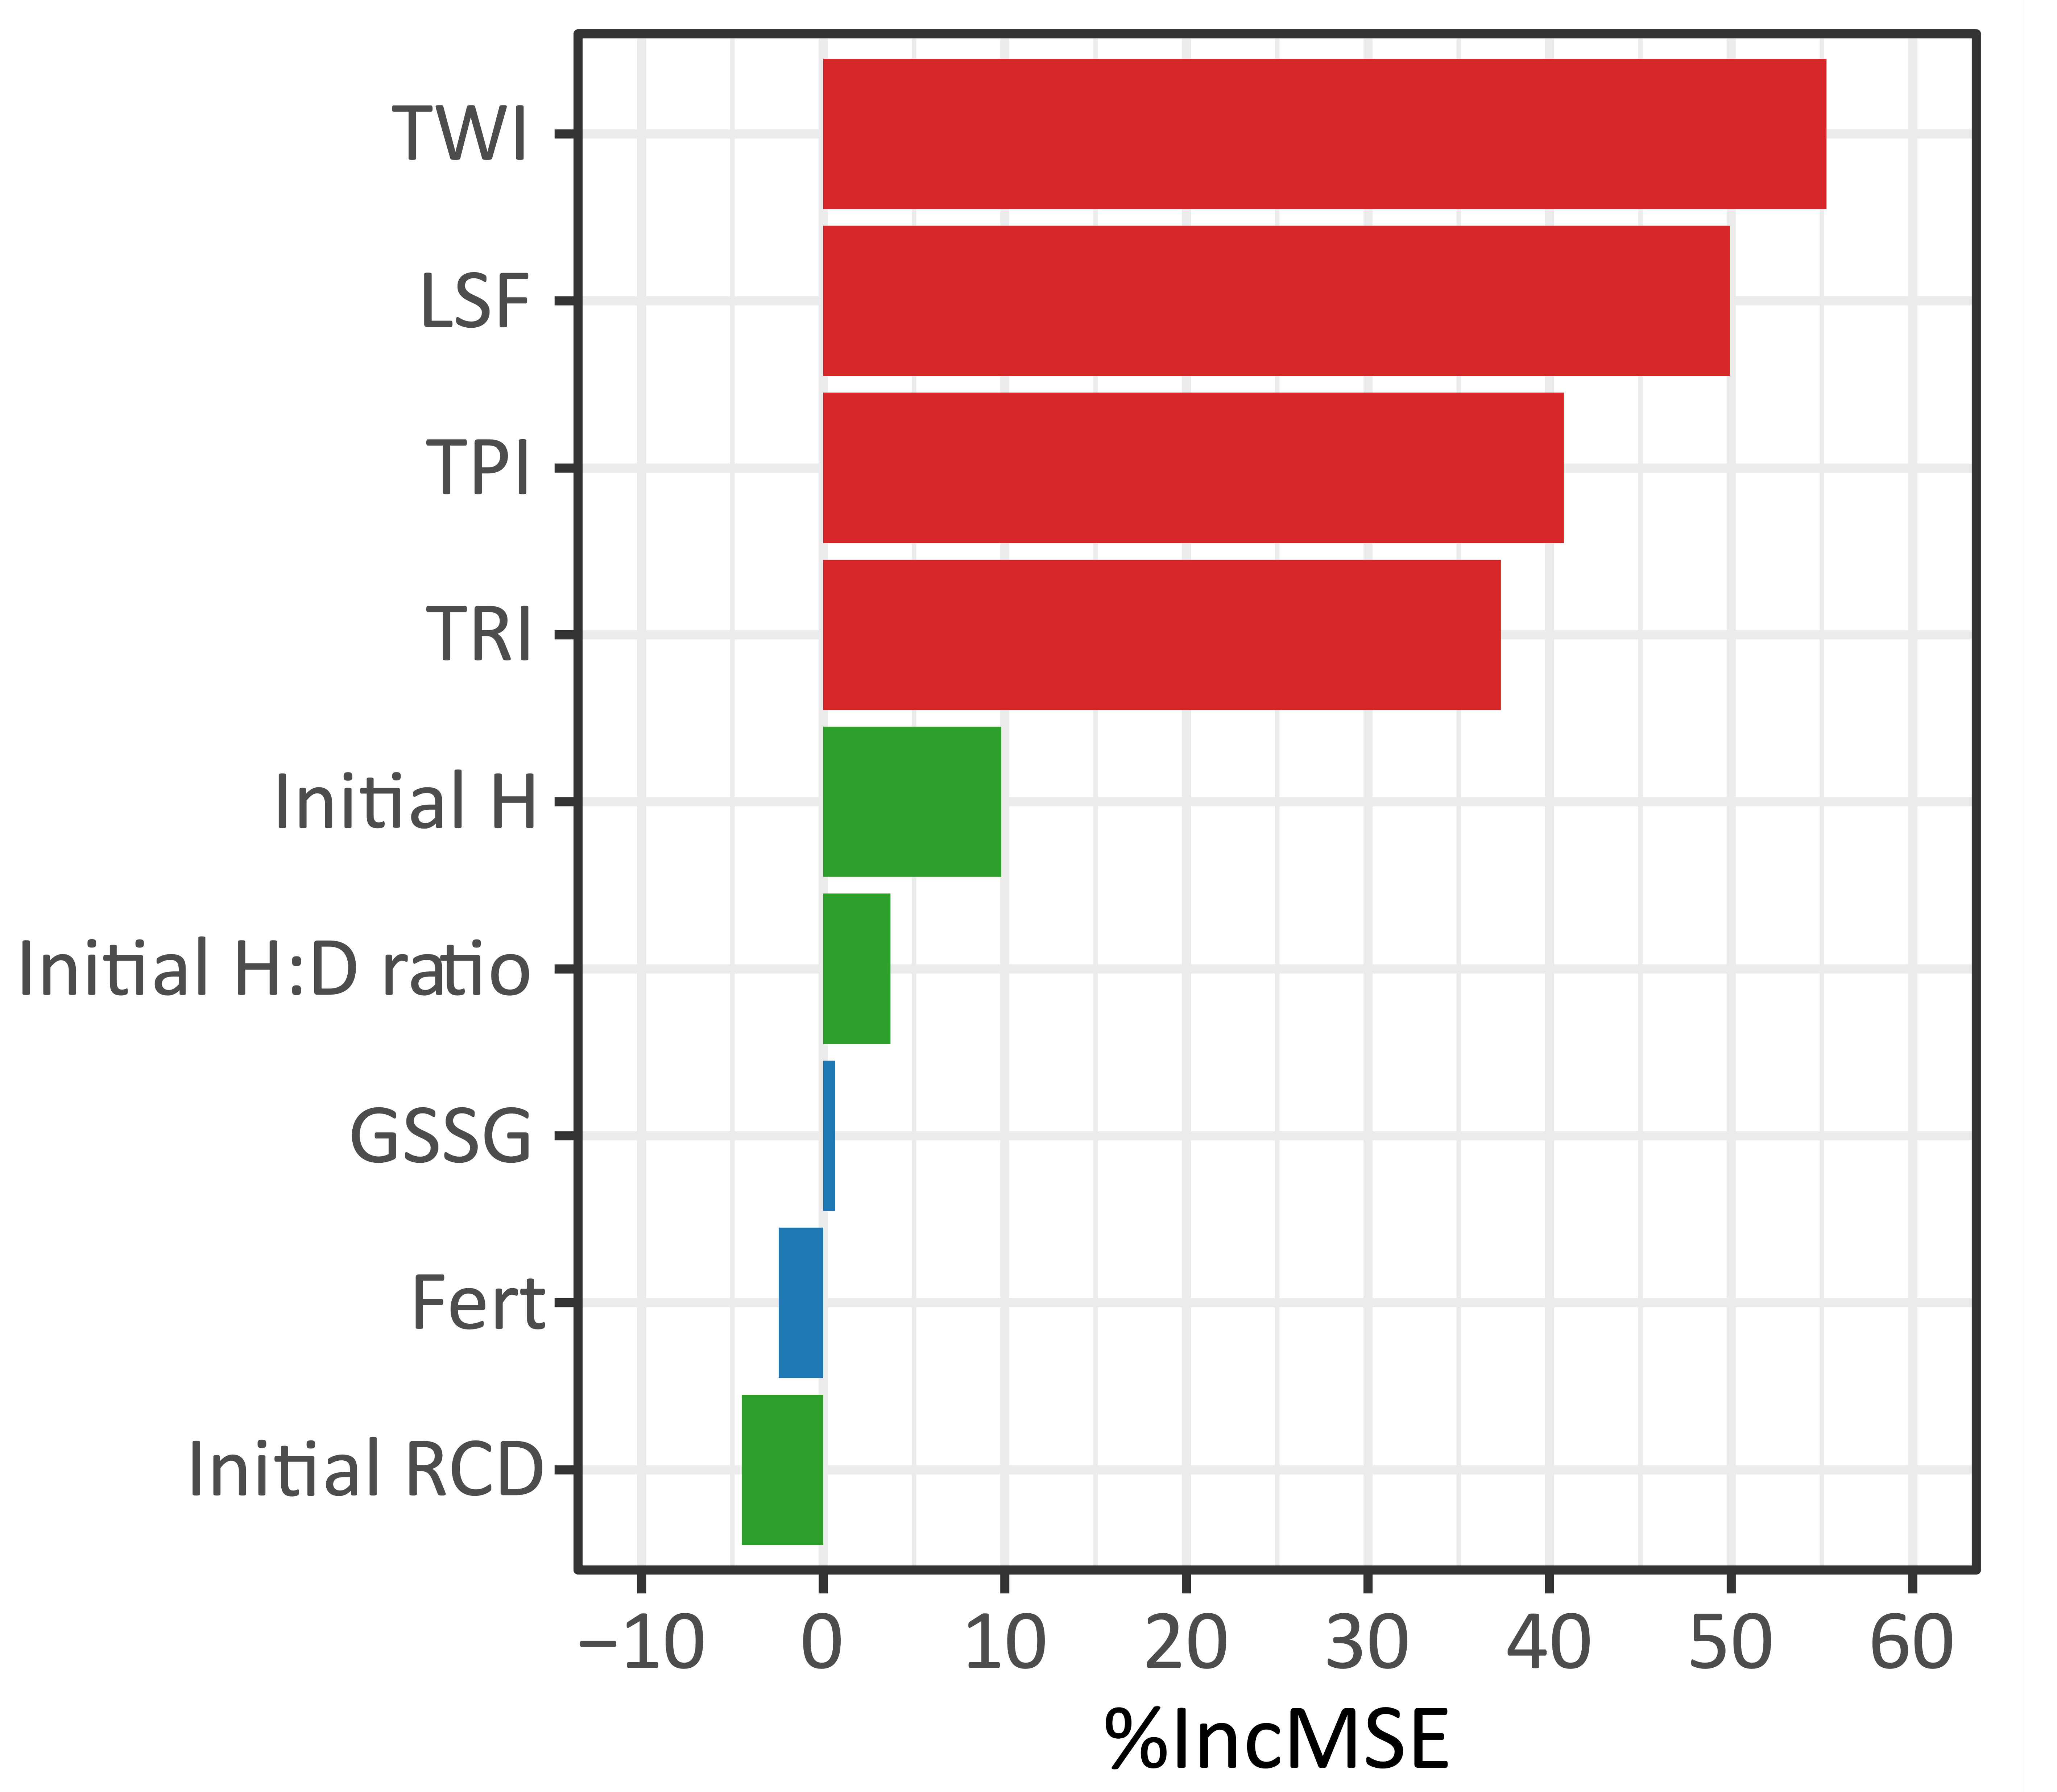
Based on the %IncMSE values from the random forest analysis, including topographic variables at all tested resolutions (1–5 m), the 1 m resolution was selected for analyzing the TWI, and the 3 m resolution was selected for analyzing LSF, TPI, and TRI (Figure S1). In the refined random forest regression model using these selected topographic indices, planting treatments (fertilization and GSSG) and initial seedling morphology explained 71.1% of the variance in the fourth-year seedling height, and TWI showed the highest %IncMSE, followed by LSF, TPI, and TRI (Figure 4). These site-related variables contributed the most to the model’s predictive accuracy. The seedling morphological variables, initial height, and H:D ratio, were more influential than fertilization and GSSG, which had only minor effects. Note that the initial height, RCD, and H:D ratio are mathematically interdependent, such that any two determine the third. Thus, the low importance of the initial RCD likely reflects redundancy with the other two morphological parameters.
The GAM revealed that most topographic indices had significant positive relationships with seedling height across treatments, except for the fertilizer-only treatment under TRI (Figure 5; Supplementary Table S1 for full GAM outputs). However, no significant differences were detected between the control and planting treatments, including fertilizer (Figure 5a,d,g,j), GSSG (Figure 5b,e,h,k), or their combination (Figure 5c,f,i,l). These results were confirmed by model comparisons demonstrating nonsignificant interactions between treatment and topographic indices (TWI: p = 0.978, LSF: p = 0.219, TPI: p = 0.721, TRI: p = 0.994; Table S2). Although the GAM-fitted curves for the combined fertilizer and GSSG treatment suggested 50–100 cm greater seedling height compared with the control treatment at higher TPI and TRI, the 95% confidence intervals overlapped (Figure 5i,l). Similar tendencies were observed for the fertilizer-only treatment at low LSF (seedling height was approximately 100 cm greater than the control, Figure 5d) and for the combined treatment at low TRI values (height difference of approximately 50 cm, Figure 5l). However, the 95% confidence intervals overlapped in all cases, indicating that the effects of the treatments were not statistically significant across the range of topographic indices.

3.3. Analysis of Seedling Growth Considering Competing Vegetation and Planting Treatments

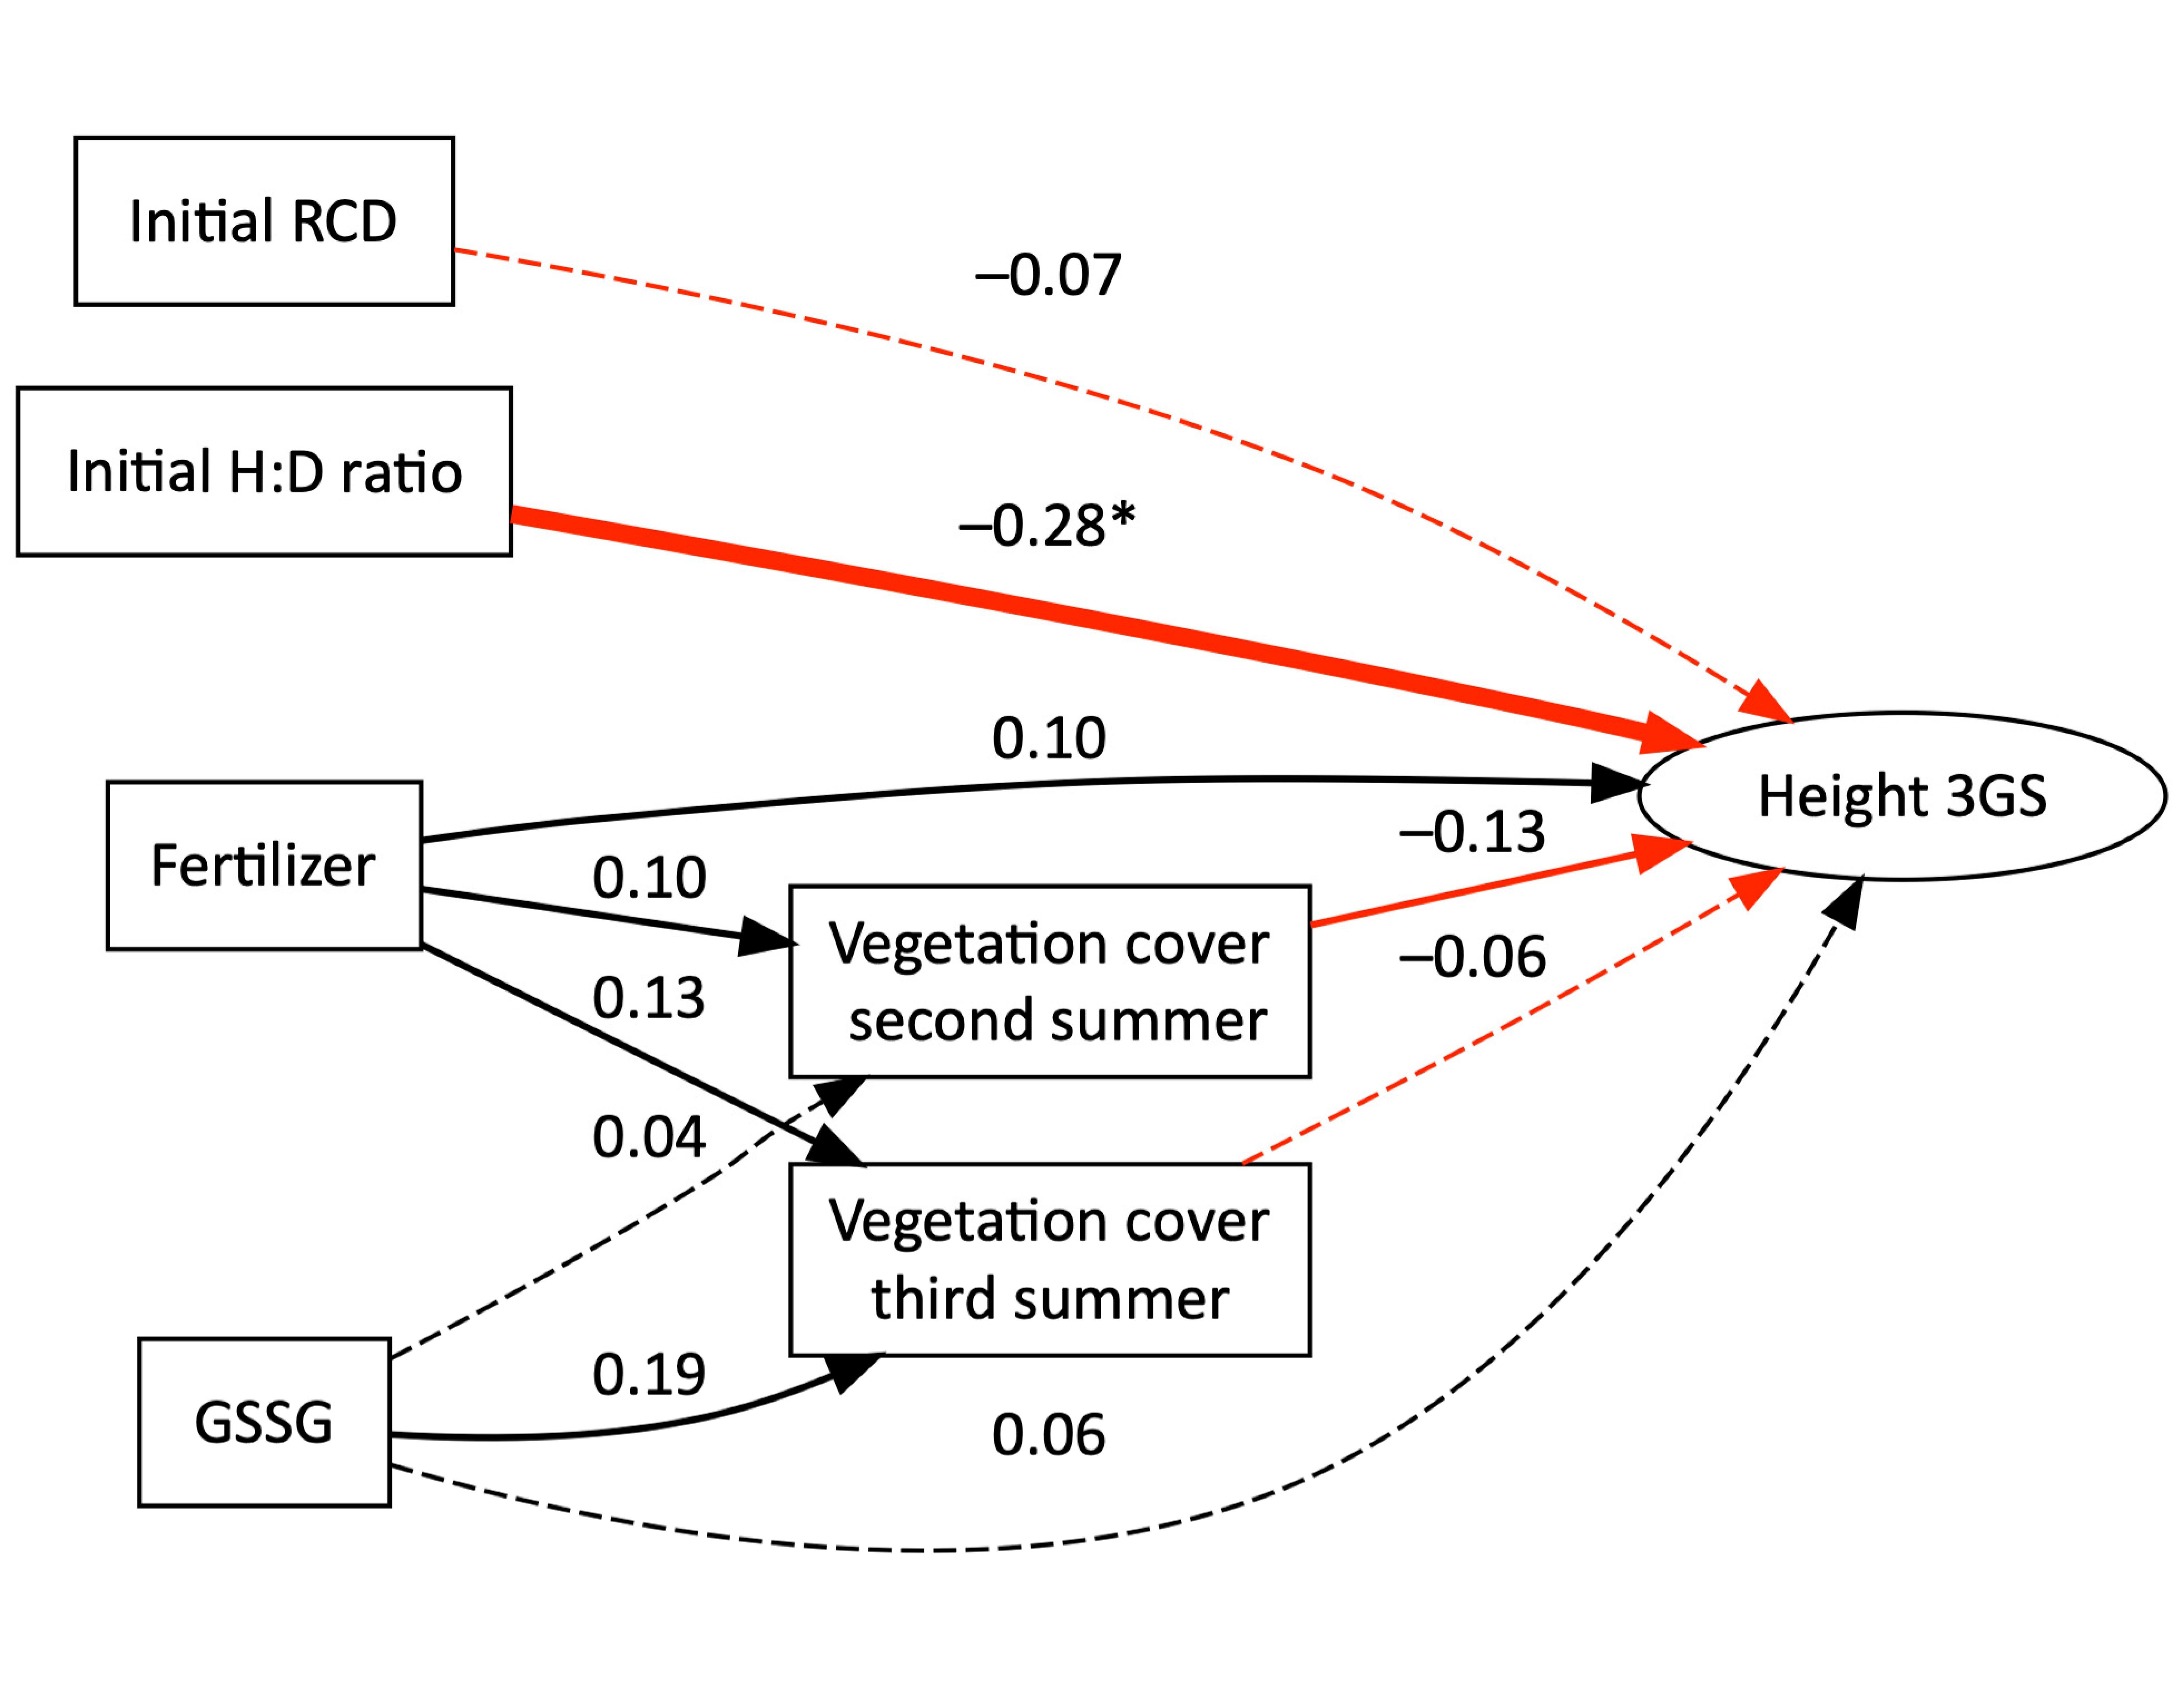
According to the SEM, fertilization slightly increased seedling height in the third year (standardized coefficient = 0.10) and slightly increased vegetation coverage in the second and third years (0.10 and 0.13, respectively, Figure 6). Vegetation coverage in the second year had a small negative effect on third-year height (−0.13). The total indirect effects of fertilization via vegetation coverage were estimated as −0.01 (0.10 × −0.13) for the second year and −0.01 (0.13 × −0.06) for the third year; the overall indirect effect was approximately −0.02. GSSG had minimal direct effects on third-year height (0.06) and a positive effect on vegetation coverage in the third year (0.19). The indirect effects were approximately −0.01 (0.04 × −0.13) through the second year and −0.01 (0.19 × −0.06) through the third year, resulting in a total indirect effect of approximately −0.02. A higher H:D at planting had a significant negative effect on third-year height (−0.28).
Of note, the model fit indices indicated poor fit (CFI = 0.14, RMSEA = 0.21), likely due to the exclusion of topographic variables to focus on the effects of vegetation coverage. However, the model adequately captured the relationships between fertilization, GSSG, vegetation coverage, and third-year seedling height and provided exploratory insights into their potential interactions under competitive conditions.

4. Discussion

Topography emerged as the primary determinant of C. japonica seedling height growth, significantly overshadowing the effects of fertilizer or GSSG treatments and explaining a substantial portion of the variation four years after planting (Figure 4). This result aligns with our hypothesis that spatial heterogeneity in site conditions, particularly topographic complexity, may override the intended effects of fertilization and GSSG on seedling growth. In particular, greater TWIs were associated with better seedling height growth (Figure 5a–c), consistent with findings from regional-scale studies in mature C. japonica plantations with tree heights over 10 m [23,41,42]. The positive correlation between TWI and height at both the seedling and mature stages likely reflects the preference of C. japonica for moist environments, evidenced by the ecophysiological traits compiled in Osone et al. [43].
Our findings can be compared with those of Tobita et al. [22], who analyzed the same dataset using similar GLMM approaches. They did not detect any effect of fertilization or GSSG. In contrast, by additionally considering topographic context via GAM and SEM analyses, our study detected weak, non-significant trends suggesting that these treatments may have modest positive effects on seedling height under specific micro-topographic conditions. This highlights that accounting for local environmental variation can reveal context-dependent responses that may be overlooked in coarser-scale analyses.
The GAM analysis accounting for topographic conditions did not detect significant main effects of fertilization or GSSG (Figure 5). Weak trends in seedling height were observed under specific topographic contexts, such as fertilization in areas with LSF values of 2–4 (Figure 5d) and combined fertilization and GSSG at higher TPI and TRI (Figure 5i,j). However, the 95% confidence intervals overlapped, indicating no statistically significant differences. These observations suggest that fertilizer and GSSG may have modest positive effects on seedling height in moderately stable terrain with localized elevation and surface heterogeneity, although these effects were not statistically confirmed. In such conditions, soils are less prone to loss and not overly wet, providing favorable conditions for nutrient uptake [44].
The week effects of treatments (overlapping 95% confidence intervals) may be partially due to the limited spatial extent of the study area. Although the survey plot extended nearly 200 m in length, the linear layout may not have captured the full topographic variability in the reforestation site. Consequently, the range of values observed for each topographic index was narrower than the range of typical plantation landscapes. For instance, the range of TRI values in this study was 0.4–1.6, within which a positive correlation with seedling height was observed.
A landscape-scale study of a C. japonica plantation [45] with a TRI range of 2–5 reported a negative correlation between TRI and seedling height three years after planting, attributed to an associated decrease in soil depth at more rugged sites. A similar contrast was observed for TPI. A positive relationship between TPI and seedling height was detected at year four in the present study. However, a negative correlation was detected in a cork oak (Quercus suber) plantation in Portugal, where TPI negatively correlated with juvenile tree diameter at the stand level [46]. These contrasting results highlight the strong effects of topology on early-stage tree growth. In addition, differences in the spatial scale for assessing topography may reverse the direction of the relationship between topography and growth metrics, indicating the need for careful consideration of scale in future topographic studies.
Another possible explanation for the lack of clear treatment effects is the potentially fertile soil at the study site. It is possible that nutrient availability was already sufficient to support seedling growth before treatments, thereby diminishing the apparent effects of fertilization and GSSG. Baseline soil properties, such as nutrient content and foliar nutrient concentration, were not measured before and after the treatments in this study, which limits our ability to directly evaluate this possibility. A previous study of one-year-old potted seedlings of C. japonica reported that leaf nitrogen (N) concentration increased with higher N fertilization. However, biomass production and the photosynthetic rate increased with up to 50 mg N L–1, but tended to decline at higher application levels of 100 and 300 mg N L–1 [47], suggesting that excessive N availability may not further enhance growth. In Japanese forestry practice, soil analysis prior to planting is typically not conducted because fertilization is not routinely applied; nevertheless, assessing soil and foliar nutrient status before and after treatments would provide valuable insights into the mechanisms underlying fertilization and GSSG effects.
The relatively small sample size used in this study (71 seedlings after accounting for mortality and accidental removal) may also have limited our ability to detect all treatment effects and interactions in the SEM and GAM analyses. To better understand the topographic and edaphic conditions under which fertilization and GSSG are most effective in promoting height growth in C. japonica, future studies should include baseline soil measurements, be conducted over larger and more diverse areas, and employ larger sample sizes to increase the robustness of conclusions. Such studies would also allow the application of geostatistical analyses to explore spatial variability in growth responses more comprehensively [48,49].
The SEM analysis quantitatively demonstrated that fertilization and GSSG exert indirect negative effects on seedling height growth by increasing vegetation coverage around the seedlings (Figure 6). These results support our hypothesis that the effectiveness of treatments applied at outplanting may be attenuated by competition from surrounding vegetation. The magnitudes of the indirect effects of fertilization and GSSG (standardized coefficients of −0.02 for both treatments) were approximately 20% and 33%, respectively, of their direct positive effects on height growth (0.10 for fertilization and 0.06 for GSSG). These modest indirect effects may reflect the tolerance of C. japonica to moderate vegetation interference. Yamagawa et al. [50] reported that height growth was only reduced when the seedlings were overtopped by surrounding vegetation; when the apical parts of the seedlings were exposed, height growth was not substantially affected. Notably, the negative effect of vegetation on height growth was stronger in the second year than in the third year, suggesting that vegetation management is crucial during the early stages after planting in C. japonica, in agreement with previous studies [16]. In standard management protocols for Japanese national forests, vegetation is usually not cleared in the first year after site preparation and planting to reduce costs. However, in our study, vegetation clearing was conducted in the first year. Although treatment effects were modest, vegetation clearing in the planting year may reduce competition for applied nutrients and bioactive compounds such as GSSG, enhancing treatment efficacy [51,52].

5. Conclusions

This study quantitatively demonstrated that topographic variation is the primary determinant of C. japonica seedling height growth, significantly outweighing the effects of fertilization and GSSG. Random forest, GAMs, and an SEM were integrated to untangle the complex interactions among silvicultural treatments, topography, and vegetation competition. The primary contribution of this study lies in demonstrating how advanced statistical approaches can be applied to detect treatment effects under heterogeneous conditions and limited sample sizes. This analytical approach is applicable to diverse reforestation contexts globally. Weak trends in treatment responses were observed under specific topographic conditions (e.g., low LSF and elevated TPI or TRI values). However, the overall effectiveness of these treatments was limited and context-dependent. Furthermore, our SEM analysis revealed indirect negative effects of fertilization and GSSG due to increased vegetation coverage, highlighting the importance of early vegetation management. Given the uncertainty and modest benefits of fertilization and GSSG, as well as the labor and material costs associated with their application, the implementation of these treatments as a standard silvicultural practice at outplanting should be approached with caution. Other studies have reported increased height growth in response to fertilization and GSSG [53]. Thus, broader and more spatially extensive research is needed to clarify the conditions under which these treatments are effective. Meanwhile, practical measures such as selecting planting sites with favorable topography and implementing early vegetation management—e.g., clearing competing vegetation in the first year—may help maximize the potential benefits of fertilization and GSSG in applied forestry settings.

Supplementary Materials

The following supporting information can be downloaded at https://www.mdpi.com/article/10.3390/f16091407/s1: Figure S1: Comparison of variable importance (% increase in mean squared error [%IncMSE]) in the random forest regression analysis of Cryptomeria japonica seedling height after four growing seasons; Table S1: Summary of generalized additive model (GAM) results examining the interaction between topographic indices and planting treatments on seedling height in the fourth growing season; Table S2: Analysis of deviance comparing models without and with treatment-specific smooth terms for each topographic index.

Author Contributions

Conceptualization, S.O. and H.T.; methodology, H.H., S.O. and H.T.; formal analysis, H.H.; investigation, H.H., S.O., H.Y., T.S., D.K. and H.T.; data curation, H.H., H.Y., T.S. and H.T.; writing—original draft preparation, H.H.; writing—review and editing, H.H., S.O., H.Y., T.S., D.K. and H.T.; visualization, H.H.; project administration, H.T.; funding acquisition, D.K. and H.T. All authors have read and agreed to the published version of the manuscript.

Funding

This research was supported by the Ministry of Agriculture, Forestry and Fisheries of Japan through the projects “Development of silviculture systems using high-performance seedlings and cuttings” (Grant No. 18064868) and “Development of a profitability evaluation method in forestry using a site–location matrix” (Grant No. JPJ012043).

Data Availability Statement

The original data presented in this study are openly available in FigShare at https://doi.org/10.6084/m9.figshare.29818265.v1.

Acknowledgments

We gratefully acknowledge the Forestry Technical and Support Center, Kanto Regional Forest Office, for granting access to the study site. We also thank Masatake G. Araki and Ken’ichi Ogawa for their valuable support in the design and establishment of the study site. The authors used ChatGPT (OpenAI, GPT-4 and GPT-5) to assist with English translation and editing. ChatGPT and GitHub Copilot (GitHub) were also used to support R code development. The authors have reviewed and edited all AI-generated content and take full responsibility for the content of this publication.

Conflicts of Interest

The authors declare no conflicts of interest. The funders had no role in the design of this study; in the collection, analyses, or interpretation of data; in the writing of this manuscript; or in the decision to publish the results.

Abbreviations

The following abbreviations are used in this manuscript:
%IncMSEPercentage increase in mean squared error
DEMDigital elevation model
GAMGeneralized additive model
GLMMGeneralized linear mixed model
GSSGGlutathione disulfide
H:D ratioHeight-to-RCD ratio
LSFLS factor
RCDRoot collar diameter
SDStandard deviation
SEMStructural equation model
TPITopographic position index
TRITerrain ruggedness index
TWITopographic wetness index
UAVUnmanned aerial vehicle

References

  1. Grossnickle, S.C.; MacDonald, J.E. Seedling quality: History, application, and plant attributes. Forests 2018, 9, 283. [Google Scholar] [CrossRef]
  2. Davis, A.S.; Pinto, J.R. The scientific basis of the target plant concept: An overview. Forests 2021, 12, 1293. [Google Scholar] [CrossRef]
  3. Jacobs, D.F.; Salifu, K.F.; Seifert, J.R. Growth and nutritional response of hardwood seedlings to controlled-release fertilization at outplanting. For. Ecol. Manag. 2005, 214, 28–39. [Google Scholar] [CrossRef]
  4. Rose, R.; Scott Ketchum, J. Interaction of initial seedling diameter, fertilization and weed control on Douglas-fir growth over the first four years after planting. Ann. For. Sci. 2003, 60, 625–635. [Google Scholar] [CrossRef]
  5. Smethurst, P.J. Forest fertilization: Trends in knowledge and practice compared to agriculture. Plant Soil 2010, 335, 83–100. [Google Scholar] [CrossRef]
  6. Hedwall, P.-O.; Gong, P.; Ingerslev, M.; Bergh, J. Fertilization in northern forests—Biological, economic and environmental constraints and possibilities. Scand. J. For. Res. 2014, 29, 301–311. [Google Scholar] [CrossRef]
  7. Jucker, T.; Bongalov, B.; Burslem, D.; Nilus, R.; Dalponte, M.; Lewis, S.L.; Phillips, O.L.; Qie, L.; Coomes, D.A. Topography shapes the structure, composition and function of tropical forest landscapes. Ecol. Lett. 2018, 21, 989–1000. [Google Scholar] [CrossRef]
  8. Rodrigues, A.C.; Villa, P.M.; Ferreira-Júnior, W.G.; Schaefer, C.E.R.G.; Neri, A.V. Effects of topographic variability and forest attributes on fine-scale soil fertility in late-secondary succession of Atlantic Forest. Ecol. Process. 2021, 10, 62. [Google Scholar] [CrossRef]
  9. Enoki, T.; Kawaguchi, H.; Iwatsubo, G. Topographic variations of soil properties and stand structure in a Pinus thunbergii plantation. Ecol. Res. 1996, 11, 299–309. [Google Scholar] [CrossRef]
  10. Scholten, T.; Goebes, P.; Kühn, P.; Seitz, S.; Assmann, T.; Bauhus, J.; Bruelheide, H.; Buscot, F.; Erfmeier, A.; Fischer, M.; et al. On the combined effect of soil fertility and topography on tree growth in subtropical forest ecosystems—A study from SE China. J. Plant Ecol. 2017, 10, 111–127. [Google Scholar] [CrossRef]
  11. Pretzsch, H.; Biber, P. Fertilization modifies forest stand growth but not stand density: Consequences for modelling stand dynamics in a changing climate. Forestry 2022, 95, 187–200. [Google Scholar] [CrossRef]
  12. South, D.B.; Zwolinski, J.B.; Lee Allen, H. Economic returns from enhancing loblolly pine establishment on two upland sites: Effects of seedling grade, fertilization, hexazinone, and intensive soil cultivation. New For. 1995, 10, 239–256. [Google Scholar] [CrossRef]
  13. Eyles, A.; Worledge, D.; Sands, P.; Ottenschlaeger, M.L.; Paterson, S.C.; Mendham, D.; O’Grady, A.P. Ecophysiological responses of a young blue gum (Eucalyptus globulus) plantation to weed control. Tree Physiol. 2012, 32, 1008–1020. [Google Scholar] [CrossRef]
  14. Brancalion, P.H.S.; Campoe, O.; Mendes, J.C.T.; Noel, C.; Moreira, G.G.; van Melis, J.; Stape, J.L.; Guillemot, J. Intensive silviculture enhances biomass accumulation and tree diversity recovery in tropical forest restoration. Ecol. Appl. 2020, 29, 118325. [Google Scholar] [CrossRef] [PubMed]
  15. Masaki, T.; Oguro, M.; Yamashita, N.; Otani, T.; Utsugi, H. Reforestation following harvesting of conifer plantations in Japan: Current issues from silvicultural and ecological perspectives. Reforesta 2017, 3, 125–141. [Google Scholar] [CrossRef]
  16. Fukumoto, K.; Ota, T.; Mizoue, N.; Yoshida, S.; Teraoka, Y.; Kajisa, T. The effect of weeding frequency and schedule on weeding operation time: A simulation study on a sugi (Cryptomeria japonica) plantation in Japan. J. For. Res. 2020, 31, 2129–2135. [Google Scholar] [CrossRef]
  17. Fukumoto, K.; Ota, T.; Mizoue, N.; Yoshida, S.; Teraoka, Y.; Kajisa, T. The effect of weeding frequency and timing on the height growth of young sugi (Cryptomeria japonica) in southwestern Japan. J. For. Res. 2017, 22, 204–207. [Google Scholar] [CrossRef]
  18. Koh, Y.S.; Wong, S.K.; Ismail, N.H.; Zengin, G.; Duangjai, A.; Saokaew, S.; Phisalprapa, P.; Tan, K.W.; Goh, B.H.; Tang, S.Y. Mitigation of environmental stress-impacts in plants: Role of sole and combinatory exogenous application of glutathione. Front. Plant Sci. 2021, 12, 791205. [Google Scholar] [CrossRef]
  19. Mohri, T.; Uekita, K.; Saito, H.; Shiraiwa, T.; Nojiri, M.; Degola, F. Exogenous application of oxidized glutathione during the seedling stage promotes root growth after transplantation and potentially increases panicles in rice. Int. J. Agron. 2024, 2024, 1884599. [Google Scholar] [CrossRef]
  20. Ahmad, M.; Ahmed, S.; Yasin, N.A.; Wahid, A.; Sardar, R. Exogenous application of glutathione enhanced growth, nutritional orchestration and physiochemical characteristics of Brassica oleracea L. under lead stress. Physiol. Mol. Biol. Plants 2023, 29, 1103–1116. [Google Scholar] [CrossRef]
  21. Hasanuzzaman, M.; Nahar, K.; Rahman, A.; Mahmud, J.A.; Alharby, H.F.; Fujita, M. Exogenous glutathione attenuates lead-induced oxidative stress in wheat by improving antioxidant defense and physiological mechanisms. J. Plant Interact. 2018, 13, 203–212. [Google Scholar] [CrossRef]
  22. Tobita, H.; Okuda, S.; Harayama, H.; Uemura, A.; Ogawa, K.i. Effect of glutathione disulfide application at planting time on growth of cedar container seedlings. Kanto J. For. Res. 2023, 74, 53–56, (In Japanese with English Summary). [Google Scholar]
  23. Nakao, K.; Kabeya, D.; Awaya, Y.; Yamasaki, S.; Tsuyama, I.; Yamagawa, H.; Miyamoto, K.; Araki, M.G. Assessing the regional-scale distribution of height growth of Cryptomeria japonica stands using airborne LiDAR, forest GIS database and machine learning. For. Ecol. Manag. 2022, 506, 119953. [Google Scholar] [CrossRef]
  24. Tsuyama, I.; Ishizuka, W.; Kitamura, K.; Taneda, H.; Goto, S. Ten years of provenance trials and application of multivariate random forests predicted the most preferable seed source for silviculture of Abies sachalinensis in Hokkaido, Japan. Forests 2020, 11, 1058. [Google Scholar] [CrossRef]
  25. Augusto, L.; Borelle, R.; Boca, A.; Bon, L.; Orazio, C.; Arias-Gonzalez, A.; Bakker, M.R.; Gartzia-Bengoetxea, N.; Auge, H.; Bernier, F.; et al. Widespread slow growth of acquisitive tree species. Nature 2025, 640, 395–401. [Google Scholar] [CrossRef]
  26. Harayama, H.; Yamada, T.; Kitao, M.; Tsuyama, I. Analysis of height and diameter growth patterns in Sakhalin fir seedlings competing with evergreen dwarf bamboo and deciduous vegetation using generalized additive models. J. For. Res. 2025, 36, 63. [Google Scholar] [CrossRef]
  27. Parada-Díaz, J.; Kluge, J.; Bello-Rodríguez, V.; Del Arco Aguilar, M.J.; González-Mancebo, J.M. To what extent does the species composition of Macaronesian laurel forests depend on their human disturbance history and environmental drivers? For. Ecol. Manag. 2021, 497, 119468. [Google Scholar] [CrossRef]
  28. Rowland, L.; Oliveira, R.S.; Bittencourt, P.R.L.; Giles, A.L.; Coughlin, I.; Costa, P.B.; Domingues, T.; Ferreira, L.V.; Vasconcelos, S.S.; Junior, J.A.S.; et al. Plant traits controlling growth change in response to a drier climate. New Phytol. 2021, 229, 1363–1374. [Google Scholar] [CrossRef]
  29. Japan Meteorological Agency. Japan Meteorological Agency Website. Available online: https://www.jma.go.jp/jma/index.html (accessed on 22 May 2025).
  30. Ogawa, K.; Hatano-Iwasaki, A.; Hayashi, K.; Awano, T.; Okubo, Y.; Hayakawa, T.; Takabe, K.; Kawaoka, A. Glutathione feeding promotes photosynthetic electron transfer rate and biomass productivity in Blue Gum (Eucalyptus globulus). In Proceedings of the 16th International Congress on Photosynthesis Research, St. Louis, MO, USA, 11–16 August 2013. [Google Scholar]
  31. Hatano-Iwasaki, A.; Hayashi, K.; Awano, T.; Takabe, K.; Kawaoka, A.; Ogawa, K. Effects of oxidized glutathione feeding on photosynthesis and biomass production in Eucalyptus globulus. In Tree and Crop Technology for Improving Quality and Productivity of Food and Biomaterials: Toward Achieving Another Green Revolution; Bunkyo: Tokyo, Japan, 2015. [Google Scholar]
  32. Harayama, H.; Tsuyama, I.; Uemura, A.; Kitao, M.; Han, Q.; Kuramoto, S.; Utsugi, H. Growth and survival of hybrid larch F1 (Larix gmelinii var. japonica × L. kaempferi) and Japanese larch under various intensities of competition. New For. 2023, 54, 945–961. [Google Scholar] [CrossRef]
  33. R Core Team. R: A Language and Environment for Statistical Computing; R Foundation for Statistical Computing: Vienna, Austria, 2025. [Google Scholar]
  34. Bates, D.; Maechler, M.; Bolker, B.; Walker, S. Fitting linear mixed-effects models using lme4. J. Stat. Softw. 2015, 76, 1–48. [Google Scholar] [CrossRef]
  35. Fox, J.; Weisberg, S. An {R} Companion to Applied Regression, 3rd ed.; Sage Publications: Thousand Oaks, CA, USA, 2019; p. 608. [Google Scholar]
  36. Lenth, R.V. Emmeans: Estimated Marginal Means, Aka Least-Squares Means, R package version 1.11.0; R Foundation for Statistical Computing: Vienna, Austria, 2025. [CrossRef]
  37. Liaw, A.; Wiener, M. Classification and regression by randomforest. R News 2002, 2, 18–22. [Google Scholar]
  38. Wood, S.N. Fast stable restricted maximum likelihood and marginal likelihood estimation of semiparametric generalized linear models. J. R. Statist. Soc. B 2011, 73, 3–36. [Google Scholar] [CrossRef]
  39. Wood, S.N.; Pya, N.; Säfken, B. Smoothing parameter and model selection for general smooth models. J. Am. Stat. Assoc. 2016, 111, 1548–1563. [Google Scholar] [CrossRef]
  40. Rosseel, Y. {lavaan}: An {R} package for structural equation modeling. J. Stat. Softw. 2012, 48, 1–36. [Google Scholar]
  41. Farhadur Rahman, M.; Onoda, Y.; Kitajima, K. Forest canopy height variation in relation to topography and forest types in central Japan with LiDAR. For. Ecol. Manag. 2022, 503, 119792. [Google Scholar] [CrossRef]
  42. Tange, T.; Ge, F. Topographic factors and tree heights of aged Cryptomeria japonica plantations in the Boso peninsula, Japan. Forests 2020, 11, 771. [Google Scholar] [CrossRef]
  43. Osone, Y.; Hashimoto, S.; Kenzo, T. Verification of our empirical understanding of the physiology and ecology of two contrasting plantation species using a trait database. PLoS ONE 2021, 16, e0254599. [Google Scholar] [CrossRef]
  44. Haywood, J.D. Small topographic differences affect slash pine response to site preparation and fertilization. South. J. Appl. For. 1983, 7, 145–148. [Google Scholar] [CrossRef]
  45. Otani, T.; Yoneda, R.; Fukumoto, K.; Yamagawa, H. Enhancing weed management in a young cedar plantation by leveraging high-performing cedar varieties and soil topographical conditions. J. Jpn. For. Soc. 2023, 105, 329–337, (In Japanese with English Summary). [Google Scholar] [CrossRef]
  46. Firmino, P.N.; Paulo, J.A.; Lourenço, A.; Tomé, M.; Campagnolo, M. How do soil and topographic drivers determine tree diameter spatial distribution in even aged cork oak stands installed in average to high productivity areas. New For. 2024, 55, 1475–1496. [Google Scholar] [CrossRef]
  47. Nakaji, T.; Fukami, M.; Dokiya, Y.; Izuta, T. Effects of high nitrogen load on growth, photosynthesis and nutrient status of Cryptomeria japonica and Pinus densiflora seedlings. Trees 2001, 15, 453–461. [Google Scholar] [CrossRef]
  48. Robertson, G.P.; Hutson, M.A.; Evans, F.C.; Tiedje, J.M. Spatial variability in a successional plant community: Patterns of nitrogen availability. Ecology 1988, 69, 1517–1524. [Google Scholar] [CrossRef]
  49. Wallerman, J.; Joyce, S.; Vencatasawmy, C.P.; Olsson, H. Prediction of forest stem volume using kriging adapted to detected edges. Can. J. For. Res. 2002, 32, 509–518. [Google Scholar] [CrossRef]
  50. Yamagawa, H.; Shigenaga, H.; Araki, M.G.; Nomiya, H. Effects of initial size and surrounding weed trees on height growth of planted sugi (Cryptomeria japonica) trees in Kyushu, Japan. J. Jpn. For. Soc. 2016, 98, 241–246, (In Japanese with English Summary). [Google Scholar] [CrossRef]
  51. Dey, D.C.; Jacobs, D.; McNabb, K.; Miller, G.; Baldwin, V.; Foster, G. Artificial regeneration of major oak (Quercus) species in the eastern United States—A review of the literature. For. Sci. 2008, 54, 77–106. [Google Scholar] [CrossRef]
  52. Nilsson, U.; Örlander, G. Vegetation management on grass-dominated clearcuts planted with Norway spruce in southern Sweden. Can. J. For. Res. 1999, 29, 1015–1026. [Google Scholar] [CrossRef]
  53. Utsugi, H.; Sakai, T.; Yamagawa, H. Harnessing Plant Growth Power! Omitting Undergrowth Weeding with Elite Trees; Forestry and Forest Products Institute: Tsukuba, Japan, 2024; p. 52. (In Japanese) [Google Scholar]
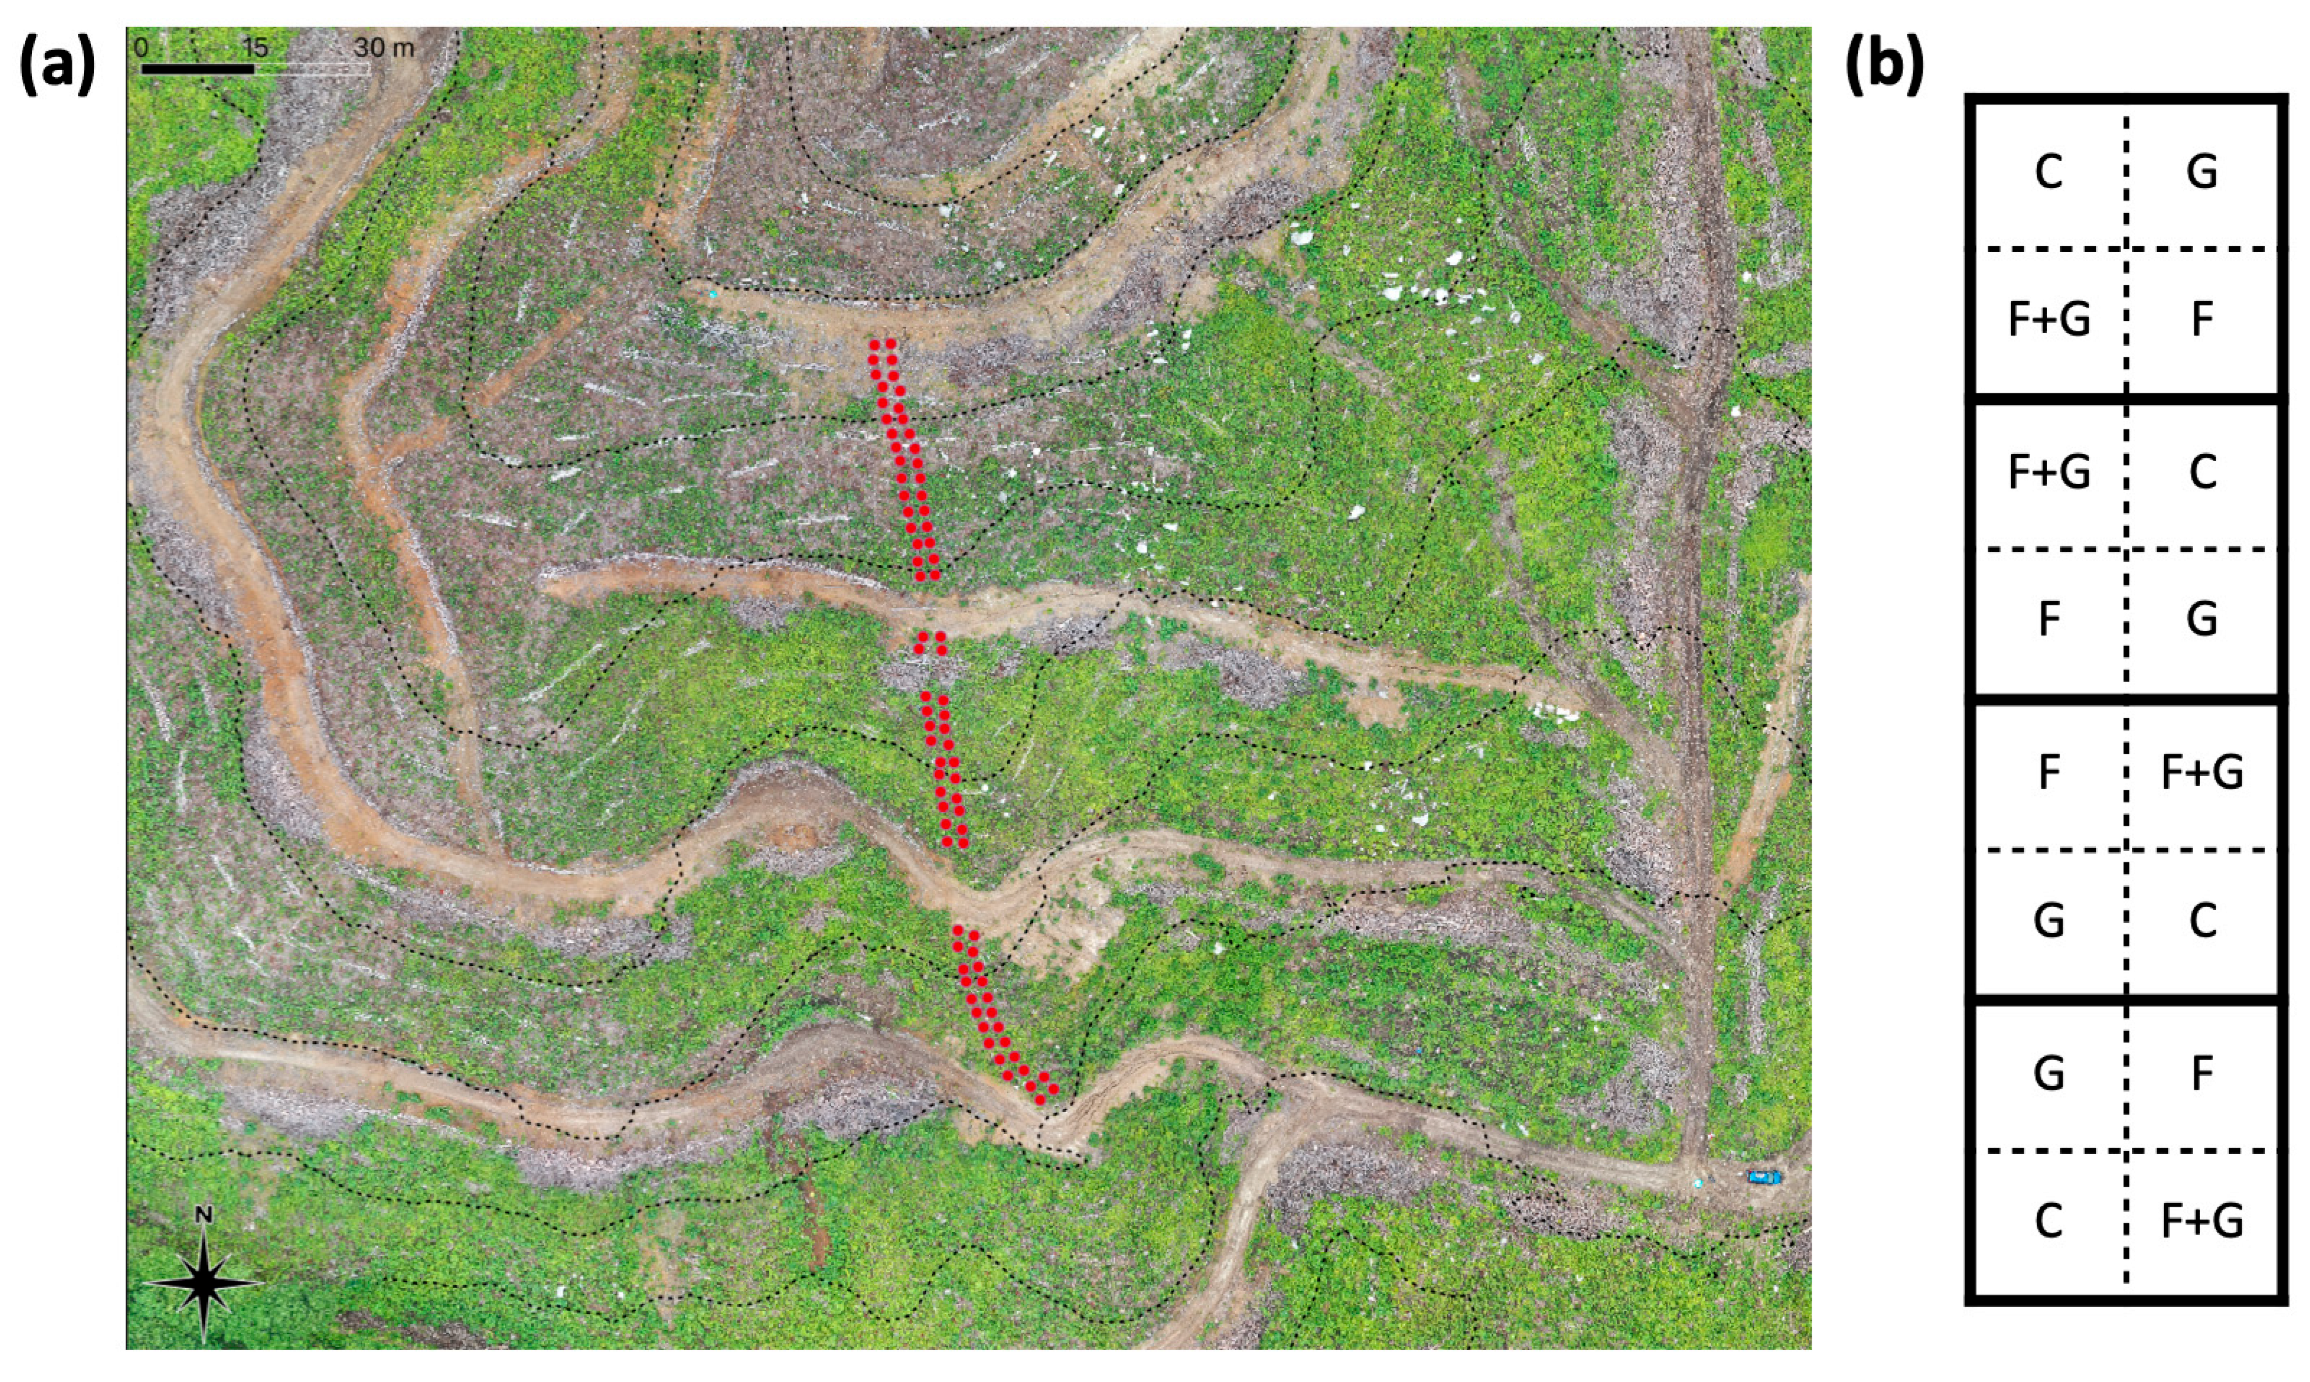
Figure 1. (a) Orthophoto of the study site derived from UAV imagery (25 June 2019), approximately one month after planting. Red dots indicate the locations of the surveyed seedlings. (b) Schematic representation of the cyclic block design used along the 188 m transect. Each 2 × 2 block contained all four treatments (control [C], fertilizer [F], GSSG [G], and fertilizer + GSSG [F+G]), with treatment positions rotated across successive blocks.
Forests 16 01407 g001
Figure 2. Temporal changes in (a) height, (b) root collar diameter (RCD), (c) the product of squared RCD and height (D2H), and (d) height-to-diameter ratio (H:D ratio) of Cryptomeria japonica D. Don seedlings over four growing seasons after the following planting treatments: fertilizer only (F), GSSG only (G), both fertilizer and GSSG (F + G), and no treatment (control; C). Boxplots show the median (line), interquartile range (box), and minimum/maximum values within 1.5 × IQR; black circles indicate outliers beyond this range. The statistical significance of the main effects of fertilizer (F), GSSG (G), and their interaction (Int) was assessed using generalized linear mixed models (GLMMs) with Type II Wald chi-square tests, as indicated in each panel: *** p < 0.001, ** p < 0.01, * p < 0.05, and ns (not significant) p ≥ 0.05.
Forests 16 01407 g002
Figure 3. Comparison of (a) the proportion of Cryptomeria japonica D. Don seedling surface area covered by vegetation (vegetation coverage) and (b) maximum vegetation height after treatment with fertilizer only (F), glutathione only (G), both fertilizer and glutathione (F + G), and no treatment (control; C) measured in the 2nd, 3rd, and 4th summers. Boxplots show the median (line), interquartile range (box), and minimum/maximum values within 1.5 × IQR; black circles indicate outliers beyond this range. Different lowercase letters in (a) indicate significant differences among treatments. The statistical significance of the main effects of fertilizer (F), glutathione (G), and their interaction (Int), assessed using generalized linear mixed models with Type II Wald chi-square tests, is indicated in each panel. *** p < 0.001, ** p < 0.01, * p < 0.05, and ns (not significant) p ≥ 0.05.
Forests 16 01407 g003
Figure 4. Relative importance of topographic parameters (red), planting treatments (blue), and seedling morphological parameters (green) in predicting Cryptomeria japonica D. Don seedling height after four growing seasons, based on random forest regression analysis. Importance is expressed as the percentage increase in mean squared error (%IncMSE) when each variable is permuted. Fert: fertilization; GSSG: glutathione disulfide; H: height; H:D ratio: height–RCD ratio; LSF: LS factor; RCD: root collar diameter; TPI: topographic position index; TRI: terrain ruggedness index; TWI: topographic wetness index.
Forests 16 01407 g004
Figure 5. Relationships between topographic indices and seedling height after four growing seasons (Height 4GS). The control treatment (black crosses) is compared with fertilizer only (red circles; a,d,g,j), glutathione disulfide (GSSG) only (blue triangles; b,e,h,k), or combined fertilizer and GSSG (green squares; c,f,i,l). The topographic variables shown on the x-axes include the topographic wetness index (TWI; ac), LS factor (LSF; df), topographic position index (TPI; gi), and terrain ruggedness index (TRI; jl). Smoothed curves and shaded 95% confidence intervals were estimated using generalized additive models (GAMs) for each treatment group. p-values in the upper left of each panel indicate the statistical significance of treatment effects compared to the control, based on the GAM results.
Forests 16 01407 g005
Figure 6. Structural equation model (SEM) showing direct and indirect relationships between fertilization, glutathione disulfide (GSSG) application, vegetation coverage in the second and third summers, and seedling height in the third year (Height 3GS). The model includes initial seedling root collar diameter (RCD) and height-to-RCD (H:D) ratio as predictors. Numbers on the arrows indicate standardized path coefficients. Asterisks denote statistically significant relationships (p < 0.05). Thick solid lines represent significant paths (p < 0.05). Thin solid lines indicate marginal (absolute standardized coefficients ≥ 0.1) but not significant (p ≥ 0.05) relationships, implying a potentially meaningful effect. Dashed lines indicate weak relationships with absolute standardized coefficients <0.1. Black lines indicate positive effects, and red lines indicate negative effects.
Forests 16 01407 g006
Disclaimer/Publisher’s Note: The statements, opinions and data contained in all publications are solely those of the individual author(s) and contributor(s) and not of MDPI and/or the editor(s). MDPI and/or the editor(s) disclaim responsibility for any injury to people or property resulting from any ideas, methods, instructions or products referred to in the content.