Article

Simulation of Carbon Sinks and Sources in China’s Forests from 2013 to 2023

1
School of Forestry, Northeast Forestry University, Harbin 150040, China
2
Key Laboratory of Sustainable Forest Ecosystem Management, Ministry of Education, School of Forestry, Northeast Forestry University, Harbin 150040, China
*
Author to whom correspondence should be addressed.
Forests 2025, 16(9), 1398; https://doi.org/10.3390/f16091398
Submission received: 10 June 2025 / Revised: 21 August 2025 / Accepted: 27 August 2025 / Published: 1 September 2025

Abstract

Chinese forest ecosystems are key carbon sinks that significantly contribute to lowering carbon emissions. Accurate Net Ecosystem Productivity (NEP) estimations are essential for evaluating their carbon sequestration capabilities and overall health. This study employed the Physiological Principles Predicting Growth-Satellites (3-PGS) and soil heterotrophic respiration models to simulate China’s forest carbon sinks and sources distribution from 2013 to 2023. Then, climatic factors influencing NEP changes were examined through the application of a geographical detector model. The net carbon sequestered was 1.71 ± 0.09 PgC with an annual average of 0.156 ± 0.0071 PgC, signifying a substantial carbon sink in China’s forest. The annual NEP was highest in evergreen broadleaf forests (352.12 gC m−2) and lowest in deciduous needleleaf forests (148.31 gC m−2). NEP in China’s forests increased by a rate of 1.67 gC m−2 annually, with most regions exhibiting a 275.32 gC m−2 annual carbon sink. The geographical detector model analysis showed that solar radiation, precipitation, and vapor pressure deficit were the main drivers of NEP change, while temperature and frost days had a secondary influence. Furthermore, the interaction between solar radiation and temperature variables showed the greatest impact. This study can enhance the understanding of carbon sink and source distribution in China, serve as a reference for regional carbon cycle research, and provide key insights for policymakers in developing effective climate strategies.

1. Introduction

China has been the top carbon emitter globally since 2006, producing 10.67 × 10⁹ tons of CO2 in 2020, which makes up 30.65% of the world’s total emissions [1]. Despite this, China’s land, which covers about 6.5% of the world’s landmass, plays an essential function in the global carbon cycle by capturing between 10 and 31% of the world’s net CO2 uptake [2]. Between 2010 and 2020, approximately 55.26% of China’s land area maintained its status as a carbon sink, highlighting its important function in mitigating climate change [3]. In September 2020, China’s government declared its goal to reach peak carbon emissions prior to 2030 and to attain carbon neutrality by 2060 [4]. According to the Intergovernmental Panel on Climate Change (IPCC), carbon neutrality is defined as achieving net zero CO2 emissions when the amount of CO2 entering the atmosphere is equal to the amount that is removed over a specified period [5]. In terrestrial landscapes, forests, being the largest carbon pool [6], accounted for over 90% of China’s total carbon sinks between 1999 and 2014 [7], highlighting their prominent contribution to the carbon balance maintained by terrestrial ecosystems [8]. The concept of Net Ecosystem Production (NEP) is crucial for evaluating the dynamics of carbon sinks/sources, which indicates the net carbon fixation efficiency of atmospheric CO2 absorbed by the ecological community [9]. NEP reflects the balance between carbon gain through photosynthesis (NPP, Net Primary Productivity) and carbon loss via soil heterotrophic respiration (Rh) [10]. NEP helps in explaining how ecosystems interact with the atmosphere by measuring the net carbon exchange [11].
Assessing the NEP change in the Chinese forest ecosystem is crucial in understanding China’s ‘carbon neutrality’ goal and awareness of the global carbon flux in considering the existing changing climate patterns [12]. Recent advances in modeling approaches for carbon dynamics across ecosystems have enabled large-scale NEP estimation incorporating ecosystem process models, climate potential, and light use efficiency models (LUE) [13,14]. The LUE model simplifies plant physiological processes, focusing on how plants use light energy for photosynthesis; a commonly used model is the Carnegie–Ames–Stanford Approach (CASA) [15]. Ecosystem process models, like CENTURY and Community Land Model, provide productivity estimates using systematic modeling processes such as the decay of organic matter and cycling of nutrients, offering valuable insights into ecosystem physiology; however, their reliance on numerous input parameters, which are often challenging to measure and can compromise accuracy [16]. Several research initiatives have been made to assess and quantify NEP in Chinese forest ecosystems by utilizing a model approach, which is critical for understanding the forest carbon transformation. The use of models enhances the accuracy of NEP calculations, thereby refining the depiction of the carbon absorption effect and offering a thorough assessment of carbon sequestration in the forest ecosystem.
Chen et al. [17] assessed vegetation carbon dynamics in China by employing a CASA model and then identified key drivers influencing the changes using a geographical detector model between 1982 and 2020. Ma et al. [18] forecasted the sequestration capacity of forests in China from 2018 to 2060 using the CO2FIX model and inventory approach. He et al. [19] modeled terrestrial NEP shifts in China (1982 to 2010) and assessed their responses to climate fluctuation across various regions. Liu et al. [20] utilized inventory data and the CASA model along with a forest vegetation map to quantitatively estimate China’s forests’ NEP spatial distribution between 1984 and 2003. Piao et al. [21] examined carbon storage and emissions in the 1980s and 1990s by using an inventory-based approach along with remotely sensed vegetation indices, ecosystem simulations, and atmospheric CO2 data inversion. Modeling forest carbon accumulation in China has advanced significantly due to extensive research efforts. Despite considerable progress in modeling forest carbon accumulation in China, uncertainties remain regarding the accuracy and regional variability of these estimates, which are impacted by factors like the forests’ spatial-temporal heterogeneity due to China’s large area and diversity in climate conditions, with alterations related to land use change [22] that greatly cause the variations of forest carbon sinks.
This study aims to bridge these gaps by utilizing a simplified, spatially based process 3-PGS model alongside a soil heterotrophic respiration model to simulate and provide a more accurate and comprehensive understanding of forest carbon sinks and sources distribution in China between 2013 and 2023. Additionally, the climatic influences on carbon NEP were assessed using a geographical detector model. This finding can inform the development of more effective carbon reduction policies and support China’s ambitious carbon neutrality goals for 2060, thereby contributing to both regional and global efforts in mitigating climate change.

2. Materials and Methods

2.1. Area Description

China is ranked as the 3rd largest country worldwide with an enormous territory of 9.6 million km2 and is in the eastern part of Asia [23]. The country features vast mountain ranges and plateaus, spanning multiple climatic zones with distinct geographical, natural, and human attributes, including a warm temperate semi-humid region (I), a mid temperate arid and semi-arid region (II, V), a northern subtropical humid region (III), a mid-temperate semi-humid region (IV), a plateau temperate semi-arid region (VI), and a marginal tropical humid region (VII). Forest ecosystems are distributed along a latitudinal gradient and include diverse types, including deciduous and evergreen coniferous forests, mixed forests, deciduous and evergreen broadleaf forests, rainforests, and monsoon forests. Together, forests cover 220 million hectares (22.96%), as reported in the 9th national forest inventory [24,25], as shown in Figure 1. Refer to Figure S1 for the climate information map.

2.2. Data Sources and Processing

Monthly data on precipitation, average air temperature, shortwave radiation, temperature extremes, dewpoint temperature, and frost frequency were retrieved from the ERA5-Land dataset of spatial resolution approximately 0.1° [26].
The MODIS normalized difference vegetation index (NDVI) product, providing monthly datasets in a grid format with a 0.05°/16-day spatiotemporal resolution [27], was used. To reduce atmospheric interferences on satellite imagery, the maximum value composite (MVC) technique was applied [28,29].
The MODIS Land Cover product (MCD12C1v061) from the International Geosphere-Biosphere Program (IGBP), with an annual temporal resolution and a spatial resolution of 0.05° [30], was used in this study. According to the IGBP land cover classification scheme, global land cover is categorized into 17 types, including 11 natural vegetation classes, 3 human-altered classes, and 3 non-vegetated classes. The reclassification tool in ArcGIS Pro software was employed to reclassify the original land cover data, resulting in five major forest categories found in China: evergreen needleleaf forest (ENF), deciduous broadleaf forest (DBF), deciduous needleleaf forest (DNF), evergreen broadleaf forest (EBF), and mixed forest (MF). The MODIS Land Cover product was chosen for its high overall accuracy, which reaches up to 66.42% at the pixel scale [31].
A soil fertility index (FR), soil texture classes, and the soil’s water storage capacity were used to initialize the 3-PGS model (Tables S1 and S2) [32,33].
Due to the lack of NEP flux data for the study period (2013–2023), we evaluated the accuracy of the model’s Net Primary Productivity (NPP) and soil heterotrophic respiration ( R h ) estimates instead of directly validating NEP. MODIS NPP product MOD17A3HGFv061, with a 500 m pixel and annual resolution [34], was used to validate the model’s NPP estimates. For R h validation, we used 634 annual soil respiration data from Sun et al. [35] and 140 data from Song et al. [36] obtained through chamber methods (static and dynamic), gas chromatography (GC), and infrared gas analyzers. The Sun et al. data were stored as georeferenced points, which we overlaid onto our Rh raster to extract corresponding values. This dataset was then filtered by longitude, latitude, and elevation to remove duplicates, and points outside the Rh raster’s pixel extent were excluded. The Song et al. data were provided as a list of geographic coordinates and forest type categories. By overlaying the land cover map of China with the Rh raster, we extracted Rh estimates based on the provided coordinates. After data filtering, a total of 200 estimates of annual forest soil CO2 flux were obtained for Rh validation.
Using China as the area of interest (AOI), and applying filters for both time (2013 to 2023) and data quality, we developed codes to download the meteorological and MODIS data from the Google Earth Engine (GEE) platform. GEE is renowned for its efficiency and geospatial capabilities in processing large datasets [37,38,39]. Albers conical projection (equal-area), with 110° E as the central meridian and standard parallels at 25° N and 47° N, and data resampling to 0.05° spatial resolution through the bilinear interpolation method were applied in ArcGIS Map 10.4 software to ensure spatial analysis compatibility and consistency.

2.3. Research Methods

2.3.1. 3-PGS Model Description

Physiological Principles Predicting Growth using Satellites model, abbreviated as 3-PGS, is a spatial Light Use Efficiency (LUE)-based and simplified version of the 3-PG model [40,41]. This model estimates forest Net Primary Productivity (NPP) by integrating structural and functional processes using fundamental empirical principles. This allows for more scalable predictions of NPP without needing detailed field measurements. The main simplifications added to the model include using satellite data on vegetation indices at large spatial scales instead of stand-specific attributes. Additionally, the 3-PGS model eliminates the calculations of root turnover and detailed stand-growth models, making it computationally efficient [42]. Also, it uses a fixed fraction ratio (α) to approximate the relationship between NPP and Gross Primary Productivity (GPP). Monthly maximum potential Gross Primary Productivity (GPP) is linked to APAR (canopy-absorbed photosynthetically active radiation) in the model with maximum LUE, ε m a x . It also incorporates climatic constraints ( f x ) that reduce LUE based on three environmental modifiers: vapor pressure deficit (VPD), frost ( f d ), and soil moisture stress ( f q ). Importantly, f x ranges from 0 (no production) to 1 (maximum production) [43] and uses the most limiting factor between VPD and f q [41] to adjust the LUE. Therefore, the NPP was calculated according to the general LUE equation:
N P P = P A R   ×   ε m a x   ×   f P A R   ×     f x     ×     α
where NPP: Net Primary Productivity (gC·m−2 per month); ε m a x   : maximum LUE (g Cm−2MJ−1 APAR); f x : climatic constraints; and α: fractional ratio of NPP to GPP. The portion of PAR captured by the canopy ( f P A R ) is linearly related to NDVI [44,45] as follows:
f P A R = m × N D V I   + C
Constants m and c were assigned values of 1.27 and −0.03, respectively [42] in this study. The value α varies across several ecosystems, ranging from 0.4 to 0.6 [46]. Then, in this study, α was adjusted for DNF (0.48), EBF (0.47), ENF (0.5853), DBF (0.4688), and MF (0.5488) [47].

2.3.2. Estimation of Soil Heterotrophic Respiration (Rh)

Soil R h plays a crucial role in the terrestrial carbon cycle by representing the carbon released during the microbial breakdown of litter, detritus, and soil organic matter (SOM) [48]. R h can be estimated using either direct methods (such as ground sampling and spatial interpolation) or indirect approaches. However, due to the vast territory and diverse ecosystems in China, variations in the key factors controlling R h across various climate regions and the direct estimation approach may have a large margin of error [49]. The indirect estimation of the R h approach entails the development of an empirical statistical model for soil respiration. This method initially estimates soil respiration ( R s ) and subsequently employs the R s R h model to derive R h [50]. The indirect approach has been extensively utilized in large-scale applications owing to its effective parameterization techniques [51].
Then, this study calculated Rs from the density of carbon from surface soil, temperature, and precipitation data as suggested by Chen et al. [52].
R S = 1.55 e 0.031 T × P P + 0.68   S O C S O C + 2.23
where R S : annual soil respiration (kgC·m−2·yr−1); T; temperature (°C); P; rainfall (mm), both on an annual scale; and SOC: soil carbon density at a depth of 0 to 20 cm of the soil surface (kgC·m−2·yr−1). SOC values were assigned as follows: broadleaf forest (4.700), coniferous forest (3.770), and mixed forest (4.235) [53]. The R h estimates in this study were estimated using the Zhang et al. [54] model.
R h = 0.6163 R S 0.7918

2.3.3. NEP Estimation

NEP is derived by subtracting R h from NPP. When NEP is positive, it reflects a carbon sink, while a negative value reflects sources [55].
N E P = N P P R h
where NEP: Net Ecosystem Productivity; NPP: Net Primary Productivity; and Rh is the estimated soil heterotrophic respiration.

2.3.4. The Geographical Detector Model

The GD model identifies and analyzes spatiotemporal differentiation, examining the interactions and explanatory potential of various driving factors [56,57]. It assesses the impact of explanatory elements on explained elements, assuming that significant relationships show spatial distribution similarities [58,59]. The GD model has four components: factor detector (FD), interactive detector (ID), ecological detector, and risk detector [56]. The FD and ID were major concerns in this study. The GD model in this study was used to explore the influence of climatic variables (predictors), including solar radiation, VPD, average temperature, precipitation, frost days, and the maximum and minimum temperature on NEP as the response variable.
Factor Detector
This component measures the influence of explanatory elements on explained elements through the influencing power value, q. A higher q-value (from 0 to 1) indicates a stronger spatial diversity of the response factor (NEP). A value of 1, signifying the NEP distribution pattern, is completely influenced by predictor factors, while 0 indicates no effect. According to the requirements of the GD model, which only processes discrete variables [56]; therefore, all predictor variables utilized for studying NEP spatial distribution were first stratified using the natural breakpoint approach. This strategy minimizes the average deviation within each class and maximizes the deviation between classes, as proposed by Jenks [60], thus avoiding human bias [61].
q = 1 i = 1 L N i σ i 2 N σ 2
where q: influencing power; N : total number of observations in study area; i = 1, 2, 3 …, L is the number of stratums of the climatic variables; N i : number of observations present in stratum i; σ 2 : variance of NEP; and σ i 2 : variance within stratum i.
Interaction Detector
The joint influence of factors, i.e., X1 and X2, on the explained variable is evaluated using this GD component, determining if their interaction strengthens or weakens its influence [57]. The interactions can be categorized based on the following judgement: if q(x1x2) > q(x1) or q(x2): enhance; if q(x1x2) > q(x1) and q(x2): enhance bivariate; if q(x1x2) > q(x1) + q(x2): enhance nonlinear; if q(x1x2) < q(x1) + q(x2): weaken; and if q(x1x2) = q(x1) + q(x2): independent.
In this study, statistical computation and analysis were performed in RStudio 2024.12.0, while the GD model (www.geodetector.cn) and spatial distribution maps were implemented and generated in ArcGIS Pro 3.1.6, respectively.

3. Results

3.1. Accuracy Assessment of NPP and R h

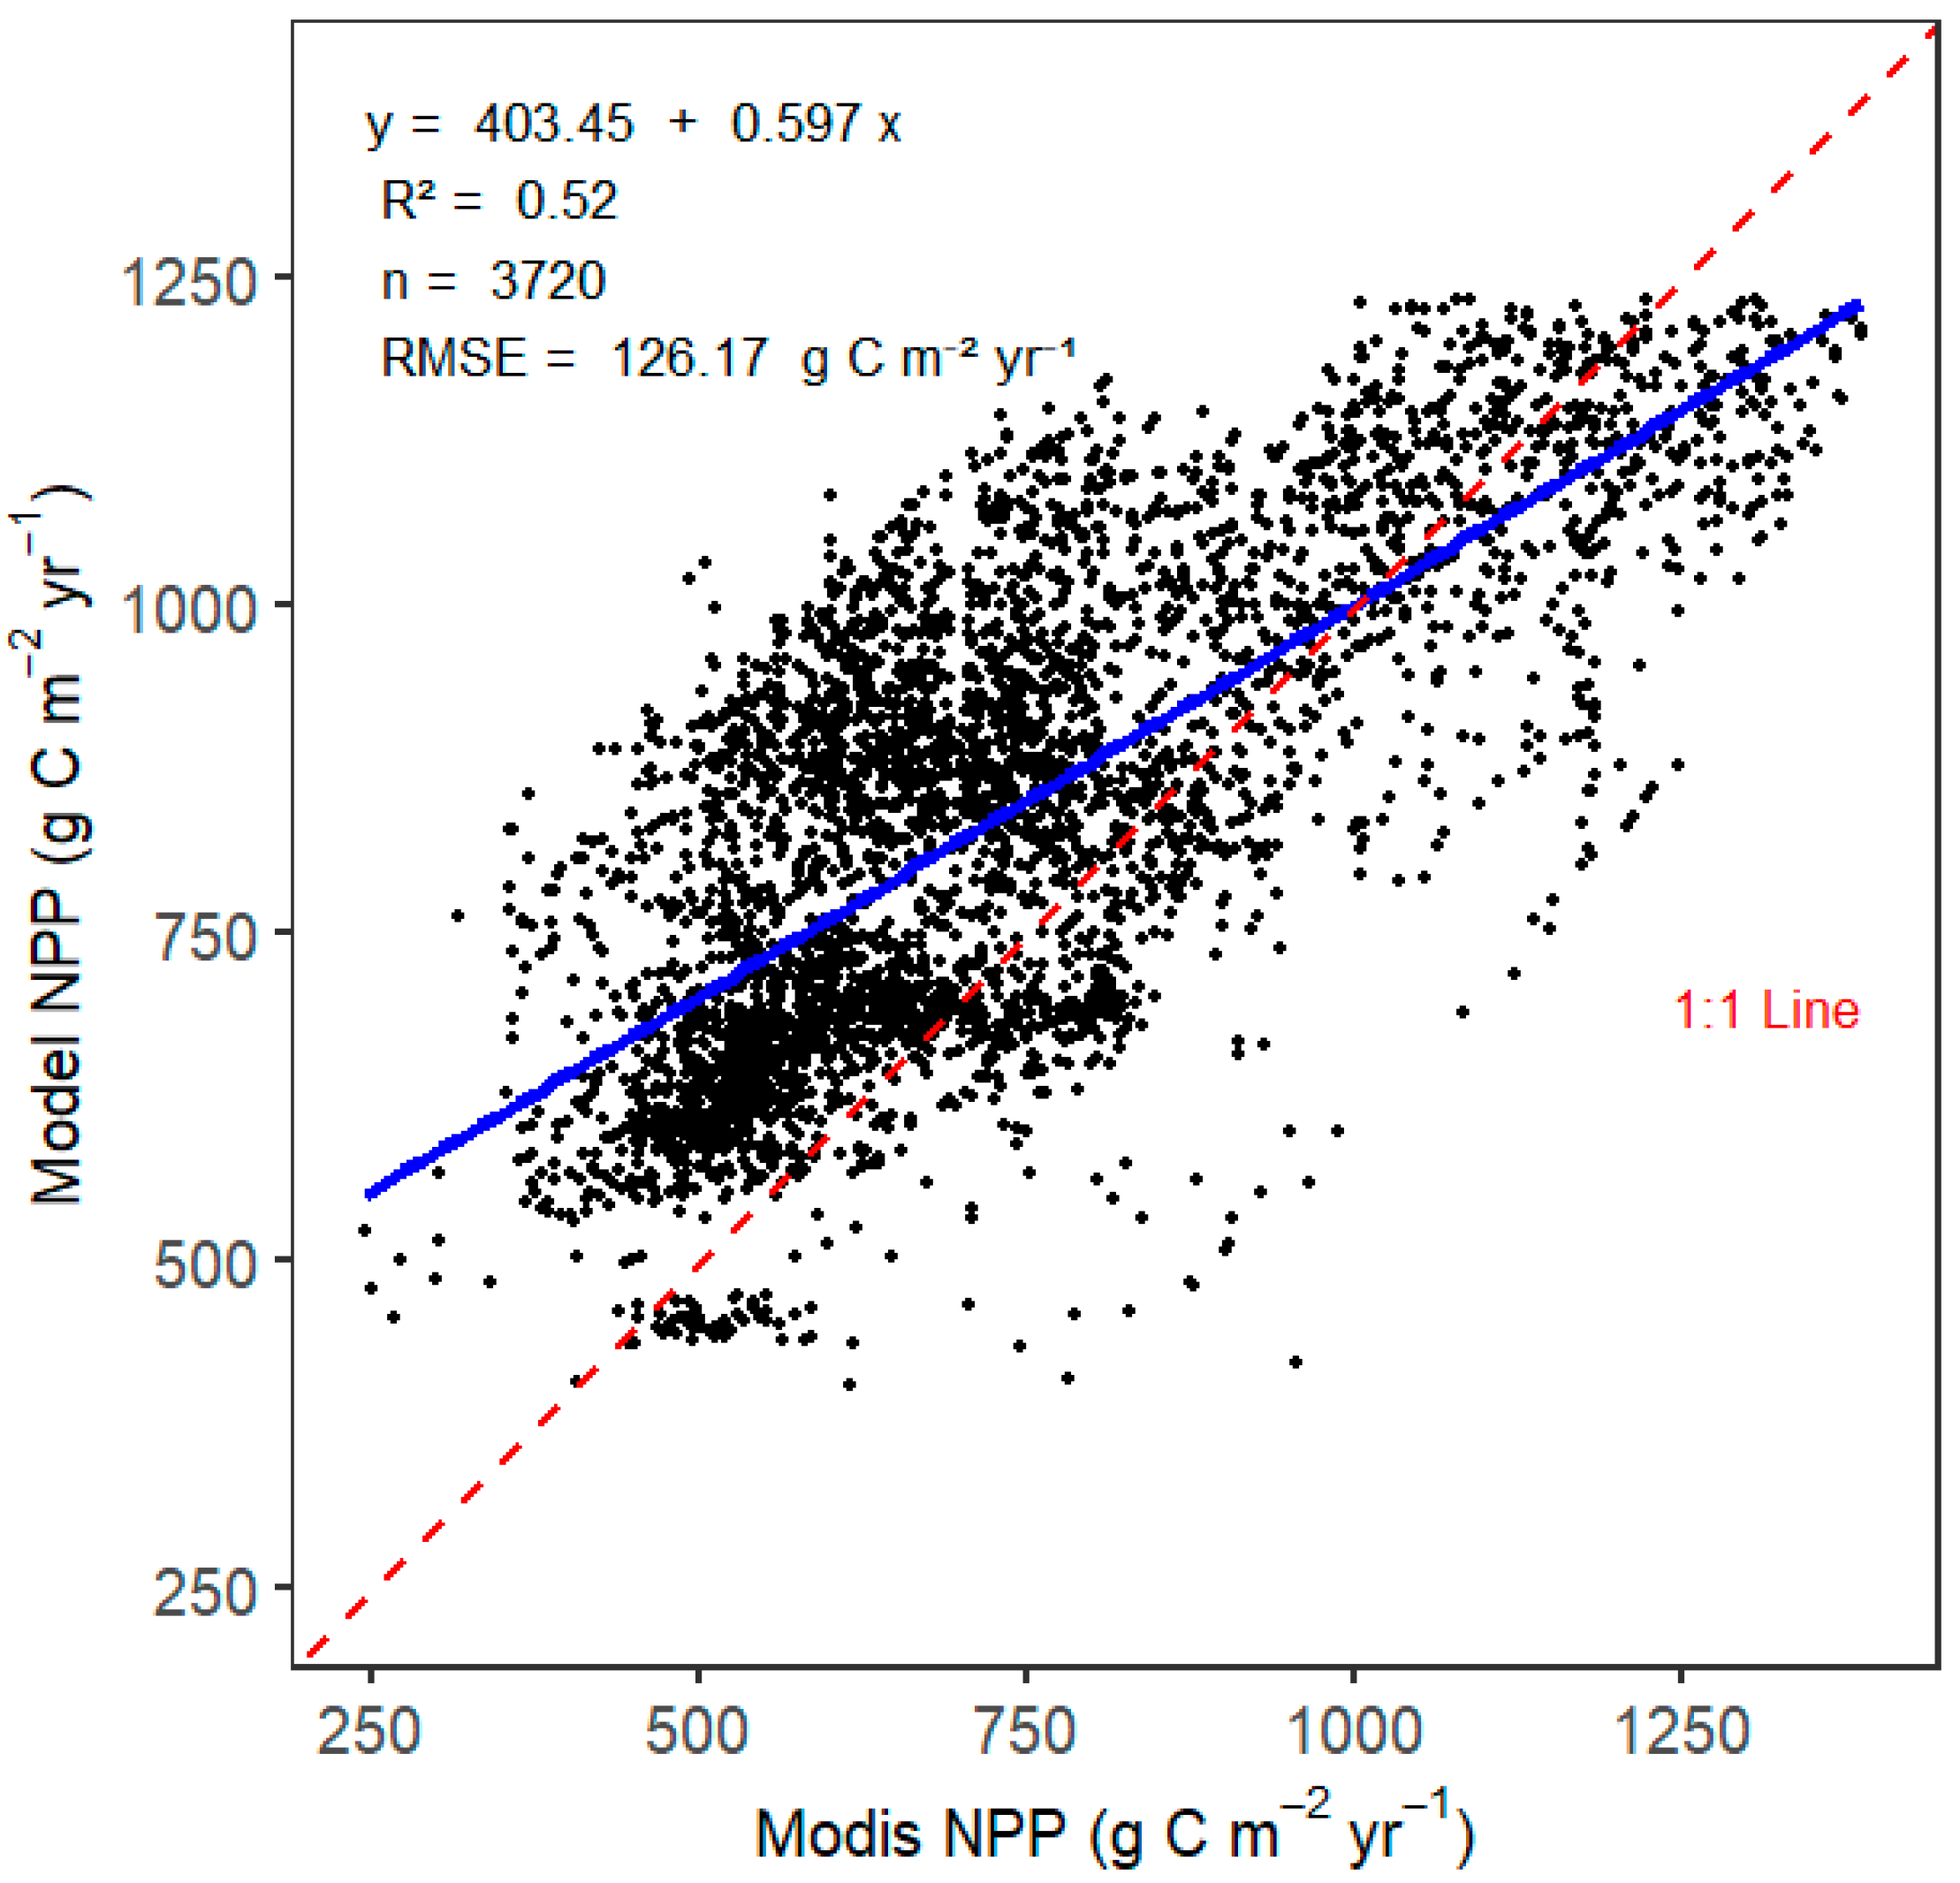
Statistical measures of R-squared (R2) and root mean square error (RMSE) were calculated to assess the accuracy of the simulated NPP and estimated R h . Using a sample size of 3720, a moderate positive correlation was found between the model NPP and MODIS NPP, with an R2 value of 0.52 and RMSE of 126.17 gC·m−2·yr−1, as shown in Figure 2, suggesting that the model is reasonably accurate. At lower NPP values (<1000 gC·m−2·yr−1), many points fall above the 1:1 line, suggesting model overestimation, particularly in northeastern and central China. In contrast, at higher NPP values (>1000 gC·m−2·yr−1), fewer points fall below the 1:1 line, suggesting underestimation, while several points cluster around the 1:1 line, reflecting a good model fit. The gap between the blue and red lines widens as MODIS NPP increases, highlighting the model’s difficulty in accurately representing high-productivity forests, especially in southern China. This gap arises due to limitations in model parameterization, missing soil factors, and uncertainties in remote sensing data.
Average forest NPP from the 3-PGS model was estimated to be 870 gC·m−2·yr−1. Across forest vegetation types, EBF had 1114.22 gC·m−2·yr−1, which exhibited the highest level of NPP, while ENF, MF, DBF, and DNF showed progressively lower values of 863.92, 837.92, 733.07, and 448.08 gC·m−2·yr−1, respectively. The subtropical and tropical environments of southern China are dominated by abundant rainfall and extended growing seasons, enhancing photosynthesis and boosting EBF and ENF productivity. Conversely, DNF, found in northern China and high-altitude areas, has the lowest NPP due to harsh temperatures and short growing seasons.
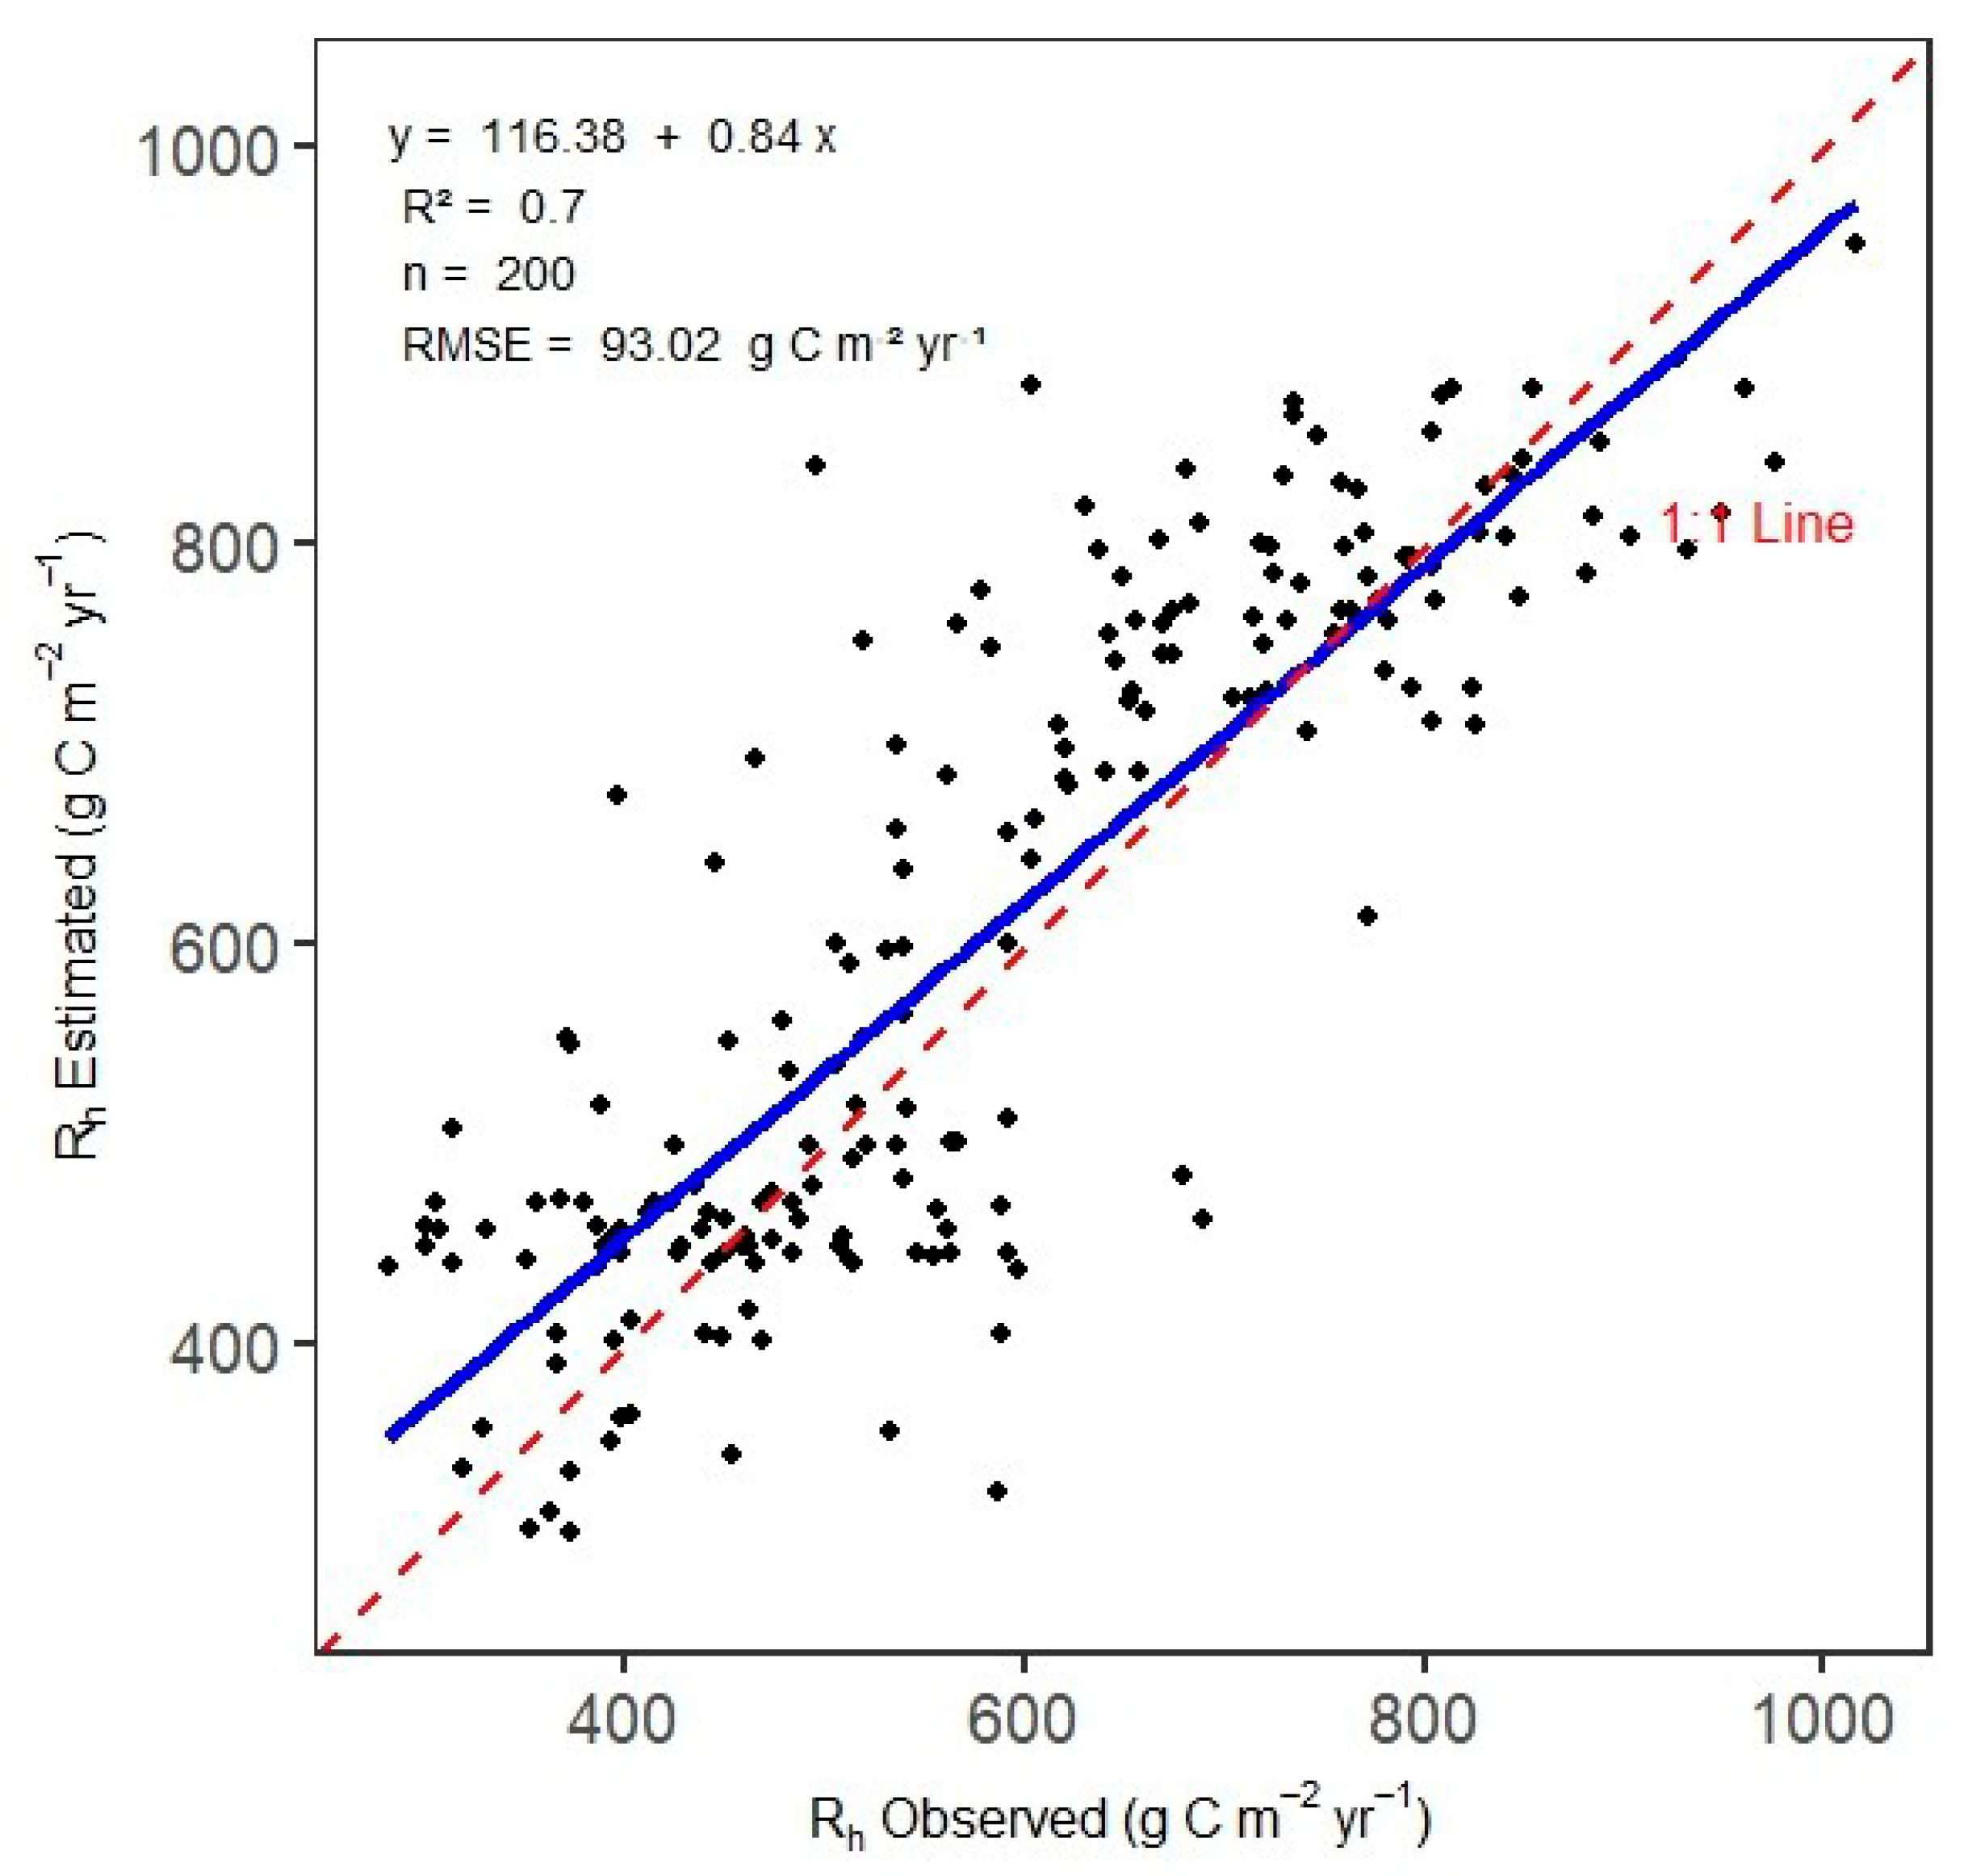
The soil heterotrophic respiration ( R h ) estimated results indicate a strong agreement, with observed R2 and RMSE of 0.70 and 93.02 gC·m−2·yr−1, respectively, using a 200 sample size, with many sample points closely aligned along the 1:1 line (Figure 3), signifying minimal bias and high consistency ( R h ) in estimations.
The soil microbial ecosystem structure and function, with favorable precipitation and temperature conditions, are key factors driving variations of R h . According to the results, R h shows variation among different forest types. EBF exhibited the highest R h at 805.62 gC·m−2·yr−1, MF had 590.07 gC·m−2·yr−1, and ENF at 526.60 gC·m−2·yr−1. Lower R h estimates were shown by DBF and DNF, with 481.87 gC·m−2·yr−1 and 296.87 gC·m−2·yr−1, respectively. The decrease in R h across forest types appears to follow latitudinal gradients.
The annual soil respiration (RS) estimated in this study was relatively high, averaging 997.36 ± 27.032 gC·m−2·yr−1, compared to previous studies: 851.88 ± 12.75 gC·m−2·yr−1 [35], 917.73 gC·m−2·yr−1 [36], and 975.50 gC·m−2·yr−1 [62]. However, our estimate remains within the reported range of 0.1 and 1.6 kgC·m−2·yr−1 [52], demonstrating the reliability of this study. The elevated RS value observed here reflects recent ecosystem responses captured by the updated climate dataset spanning 2013 to 2023, highlighting potential increases in microbial activity and soil carbon flux under current climatic conditions.

3.2. NEP Spatiotemporal Variation in China’s Forests

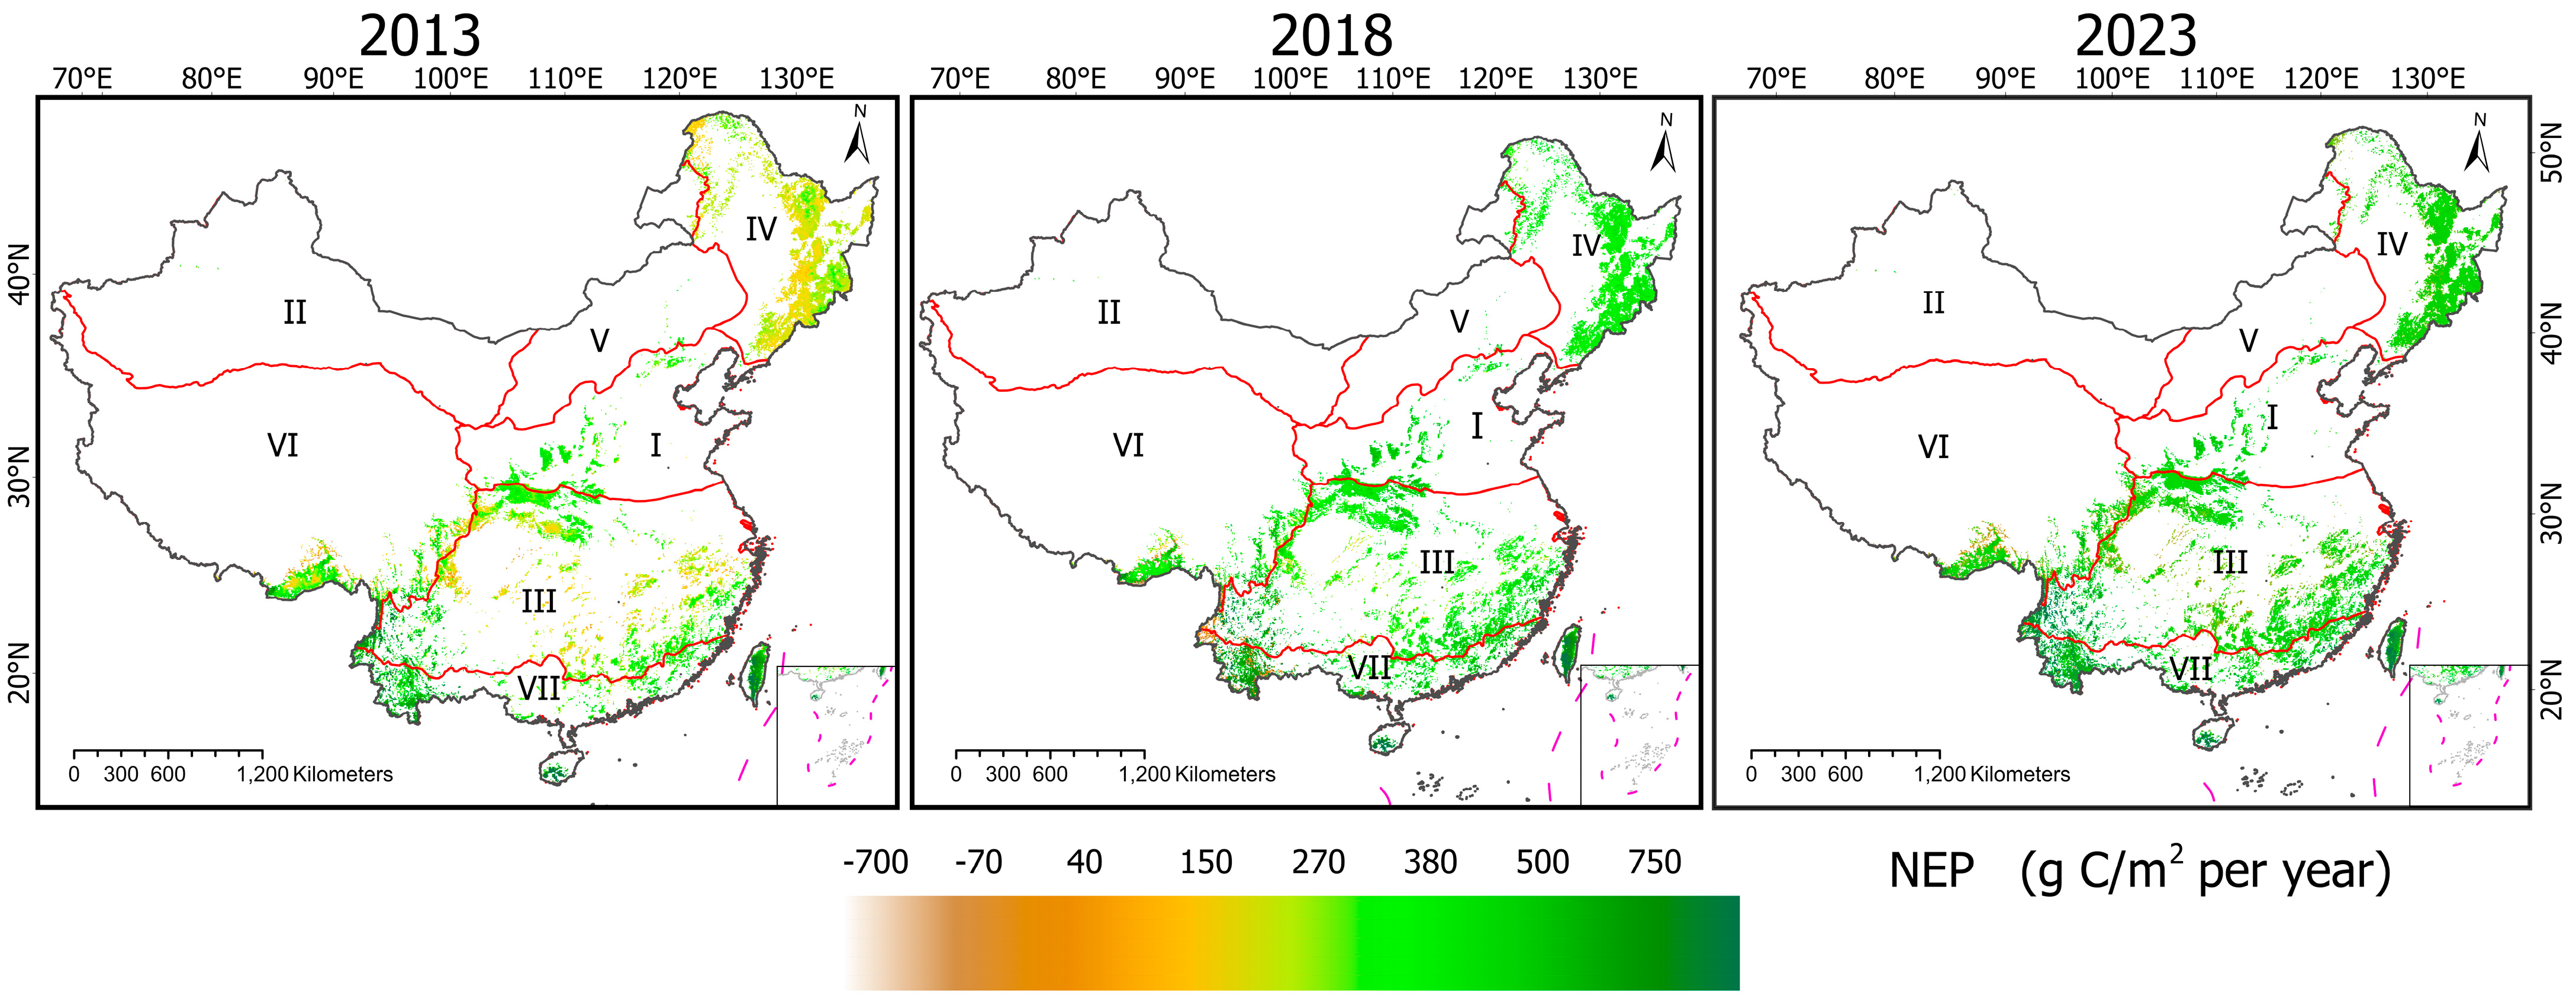
Carbon sinks and sources spatial distributions were estimated at a 5 km resolution from 2013 to 2023 (Figure S3) based on Equation (5). Over this period, China’s forests operated as carbon sinks, fixing a net amount of 1.71 ± 0.09 PgC with an annual average of 0.156 ± 0.0071 PgC (155.86 TgC/year). It also indicated that the majority of forest regions function as sinks annually, corresponding to 275.32 gC·m−2. Figure 4 illustrates the spatial distribution of NEP over a 5-year interval.
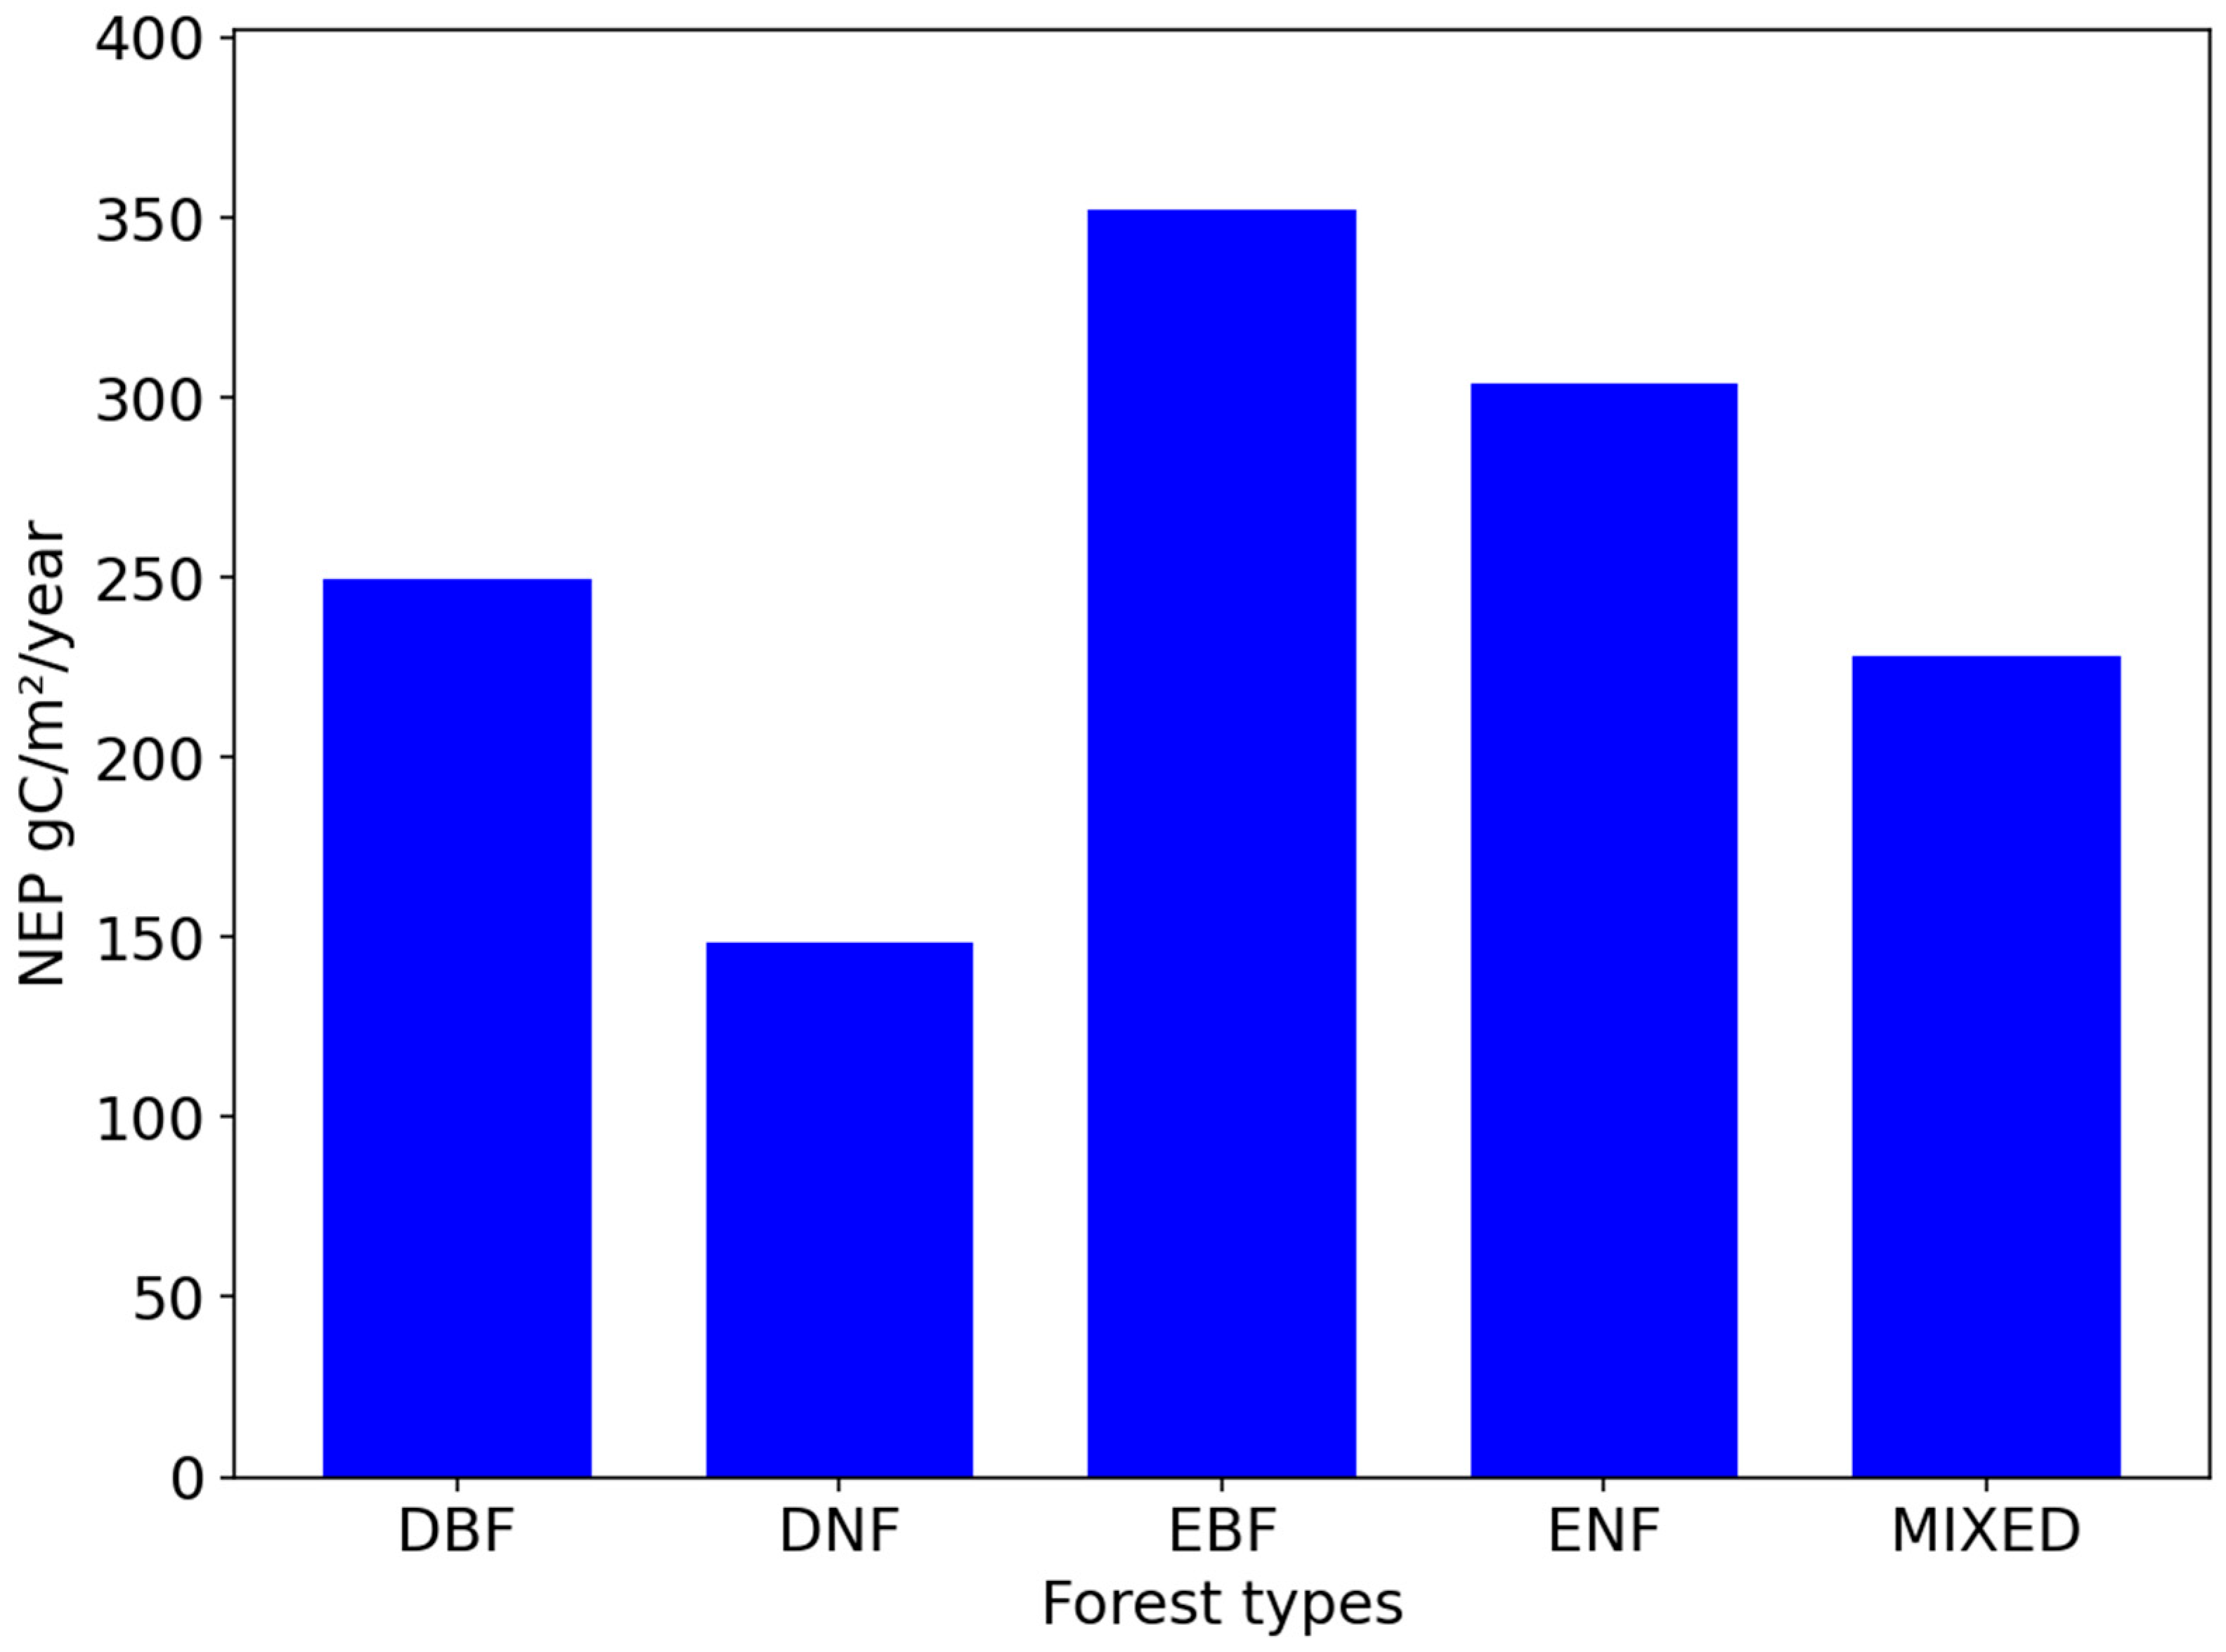
Despite variations in annual Net Ecosystem Production (NEP) among forest types, all exhibited positive NEP values over 100 gC·m−2. EBF and ENF had the highest values, exceeding 300 gC·m−2, reflecting greater carbon sequestration capacity. In contrast, DNF showed the lowest annual NEP (148.31 gC m−2), followed by MF and DBF, indicating a comparatively smaller contribution to annual carbon storage (Figure 5). These differences are likely driven by variations in physiological traits, growth rates, and climatic adaptability. In addition, broadleaf forests contributed over 70% of total NEP (1.23 PgC), attributed to their high productivity, long growing season, and dense foliage, which enhances carbon uptake.
The total amount of carbon released during the study was found to be 0.045 PgC, with an average of 4.07 TgC released each year. More than half of this release came from MF, followed by EBF at around 40%, while other forest types present a minor contribution. Although DNF and DBF showed minimal carbon source, they demonstrated greater stability and resilience in maintaining carbon balance compared to other forest ecosystems.
From 2013 to 2023, net carbon fixation across China’s climatic regions exhibited notable spatial variability. The northern subtropical humid region (III) contributed the largest contribution at 0.531 PgC (31%), followed closely by the mid-temperate semi-humid region (IV) at 0.526 PgC (30.68%). The marginal tropical humid region (VII) contributed 0.313 PgC (18.29%), while the plateau temperate semi-arid region (VI) and warm temperate semi-humid region (I) contributed 0.187 PgC (10.91%) and 0.149 PgC (8.69%), respectively. Contributions from other regions (II and V) were comparatively minor at less than 2%. Although Regions III and IV exhibited similar levels of net carbon sequestration, their carbon source profiles differed significantly, with Region III showing substantially higher emissions. Among all regions, Region VI had the highest carbon source at 25.39 TgC (56.75%), followed by Region III with 13.50 TgC (30.17%) and Region VII with 5.78 TgC (12.93%). In contrast, Region IV contributed only 0.059 TgC (0.13%), and Regions I, II, and V had very low carbon source contributions. These regional dynamics are illustrated in Figure 6a.
On an annual average, all regions exhibited NEP values exceeding 200 g C/m2. Region VII recorded the highest NEP (432.88 g C/m2), followed by Region I (326.18 g C/m2) and Region V (280.95 g C/m2). Region III showed an NEP of 275.75 g C/m2, while the remaining regions fell below 250 g C/m2. These patterns suggest that Region VII is predominantly characterized by EBF, while DBF and DNF are concentrated in Region IV, contributing to a lower average NEP of 233.51 g C/m2 (Figure 6b). While forests are more widespread in Regions III and IV, Region V has a higher average NEP due to concentrated areas with strong carbon sequestration. Its forests exhibit fewer but higher NEP values and lower carbon sources, boosting the average, whereas Regions III and IV have more dispersed, moderate NEP levels. Additionally, Region V’s distribution of ENF (Figure 1) further elevates its NEP, explaining its superior sink performance despite smaller forest coverage.
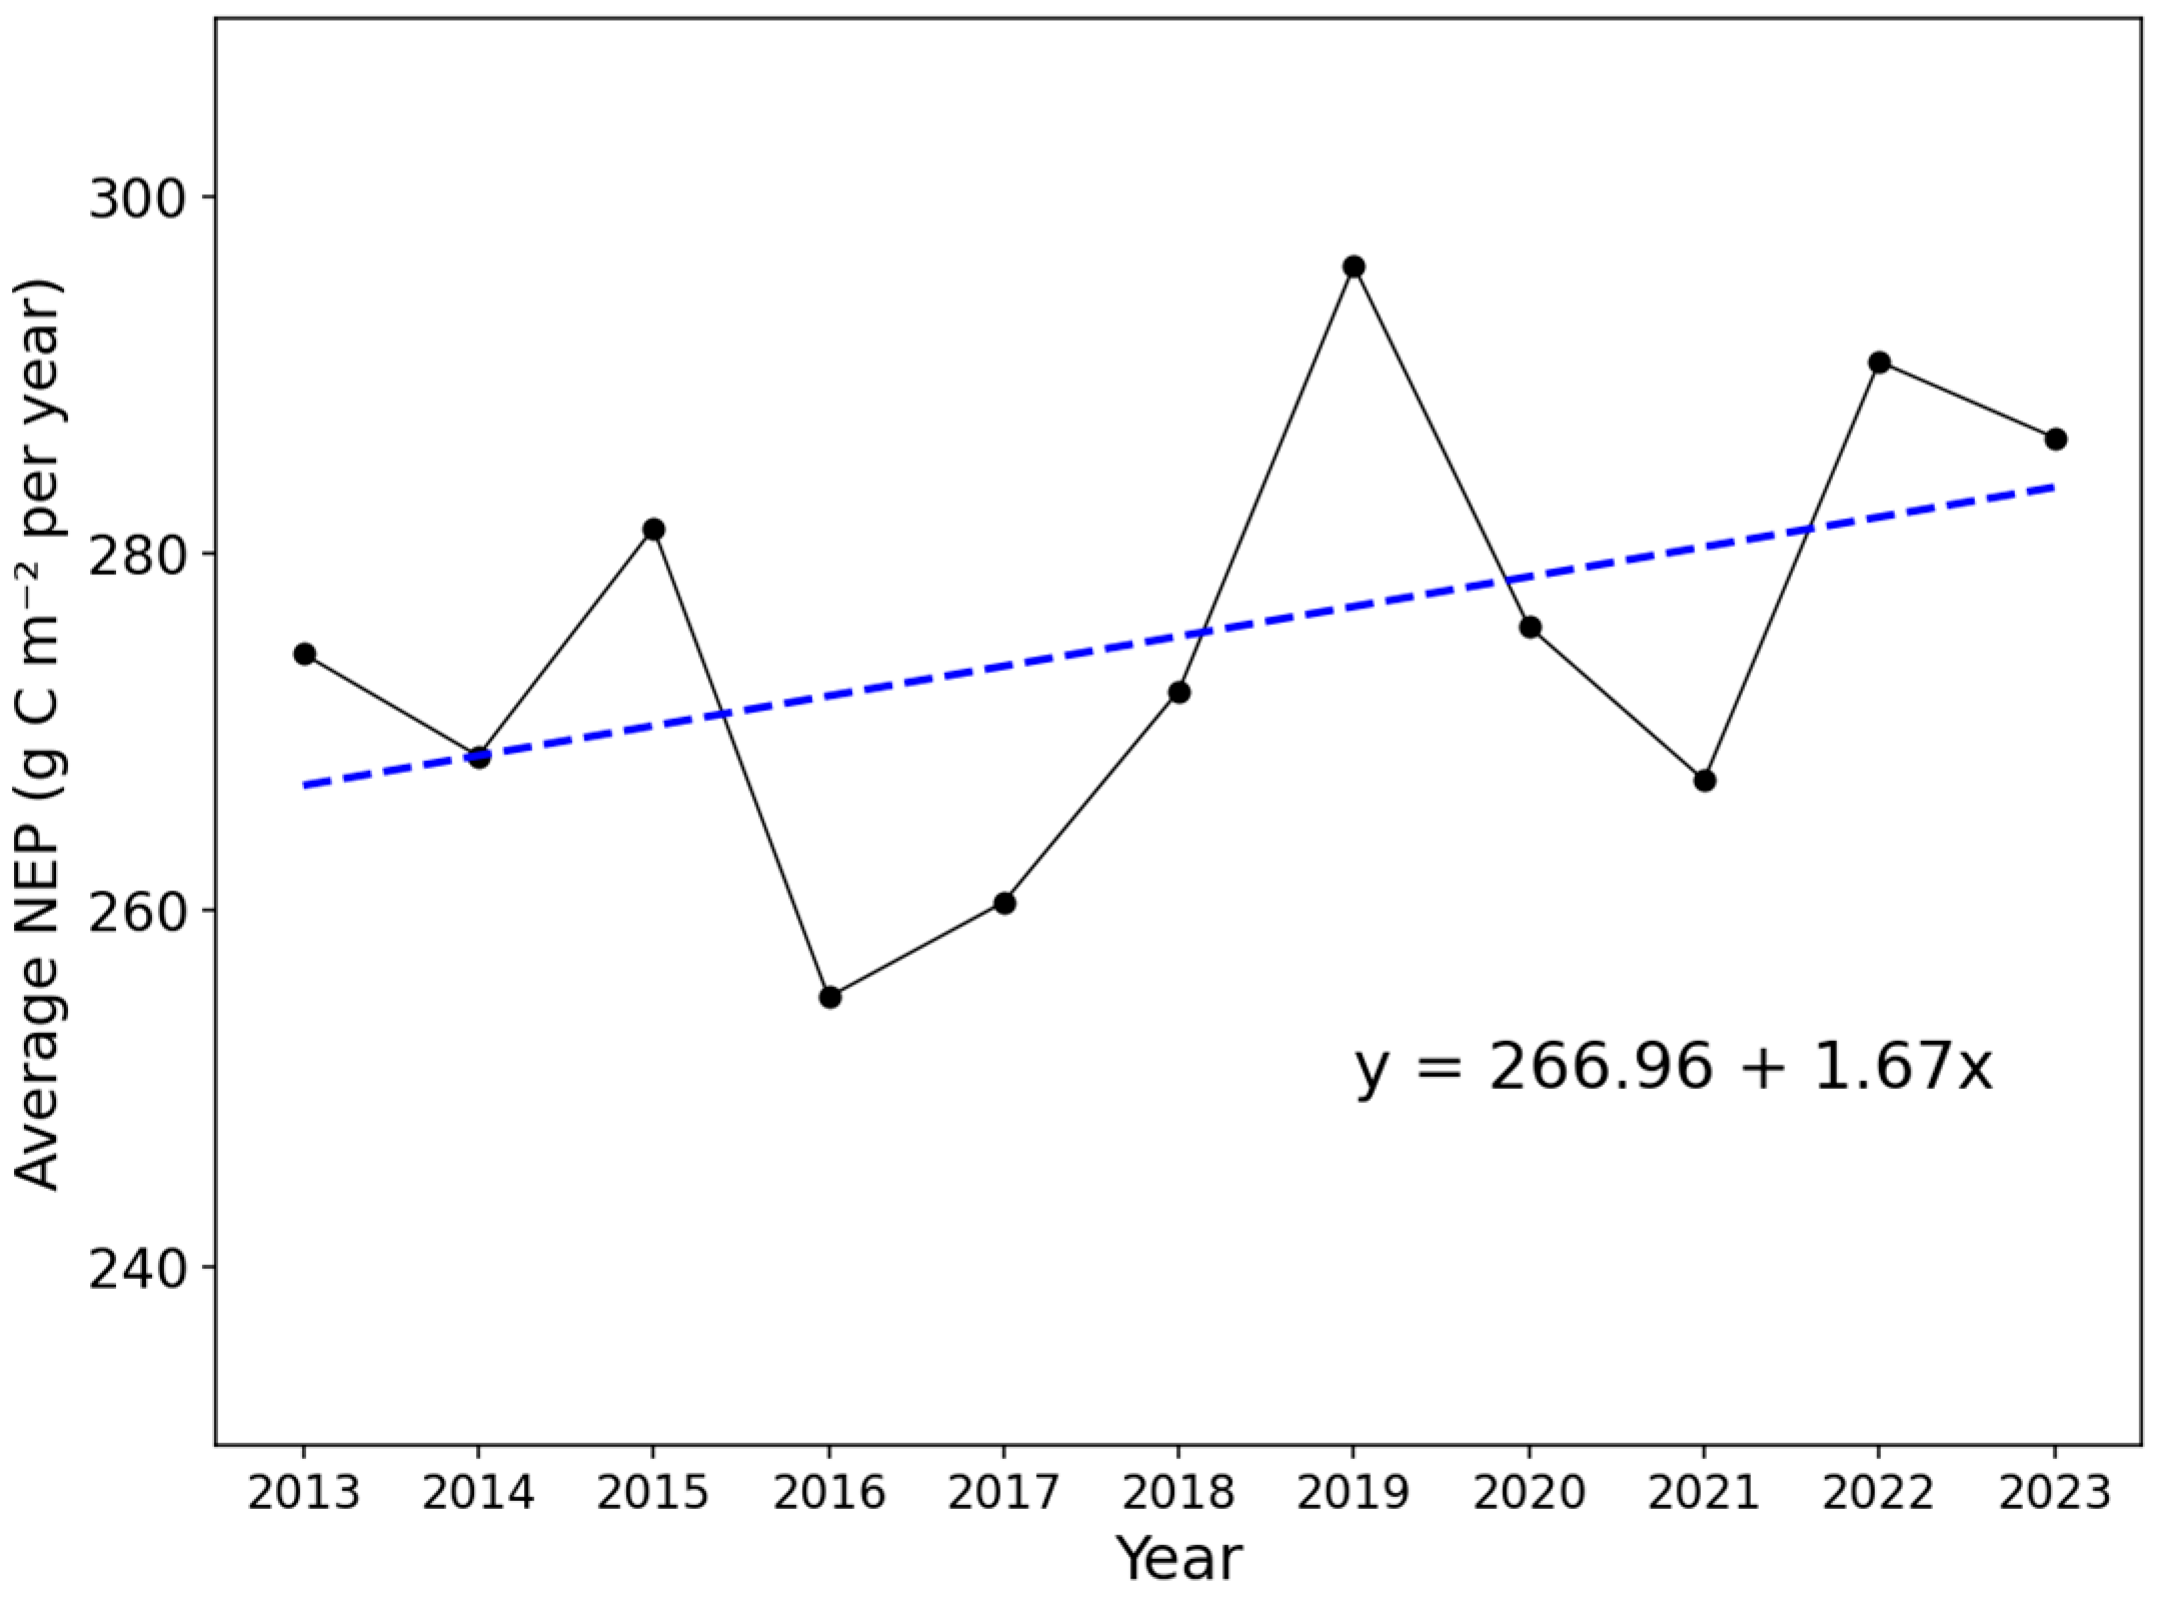
Figure 7 shows the average annual NEP variation for China’s forests from 2013 to 2023. As NEP became more variable over time, the growth rate was estimated to be 1.67 gC·m−2 per year, with the lowest value observed in 2016 (255.09 gC·m−2) while the highest was recorded in 2019 (296.10 gC·m−2), resulting in a mean of 275.32 gC·m−2.

3.3. Climatic Factors Contribution to NEP Variation

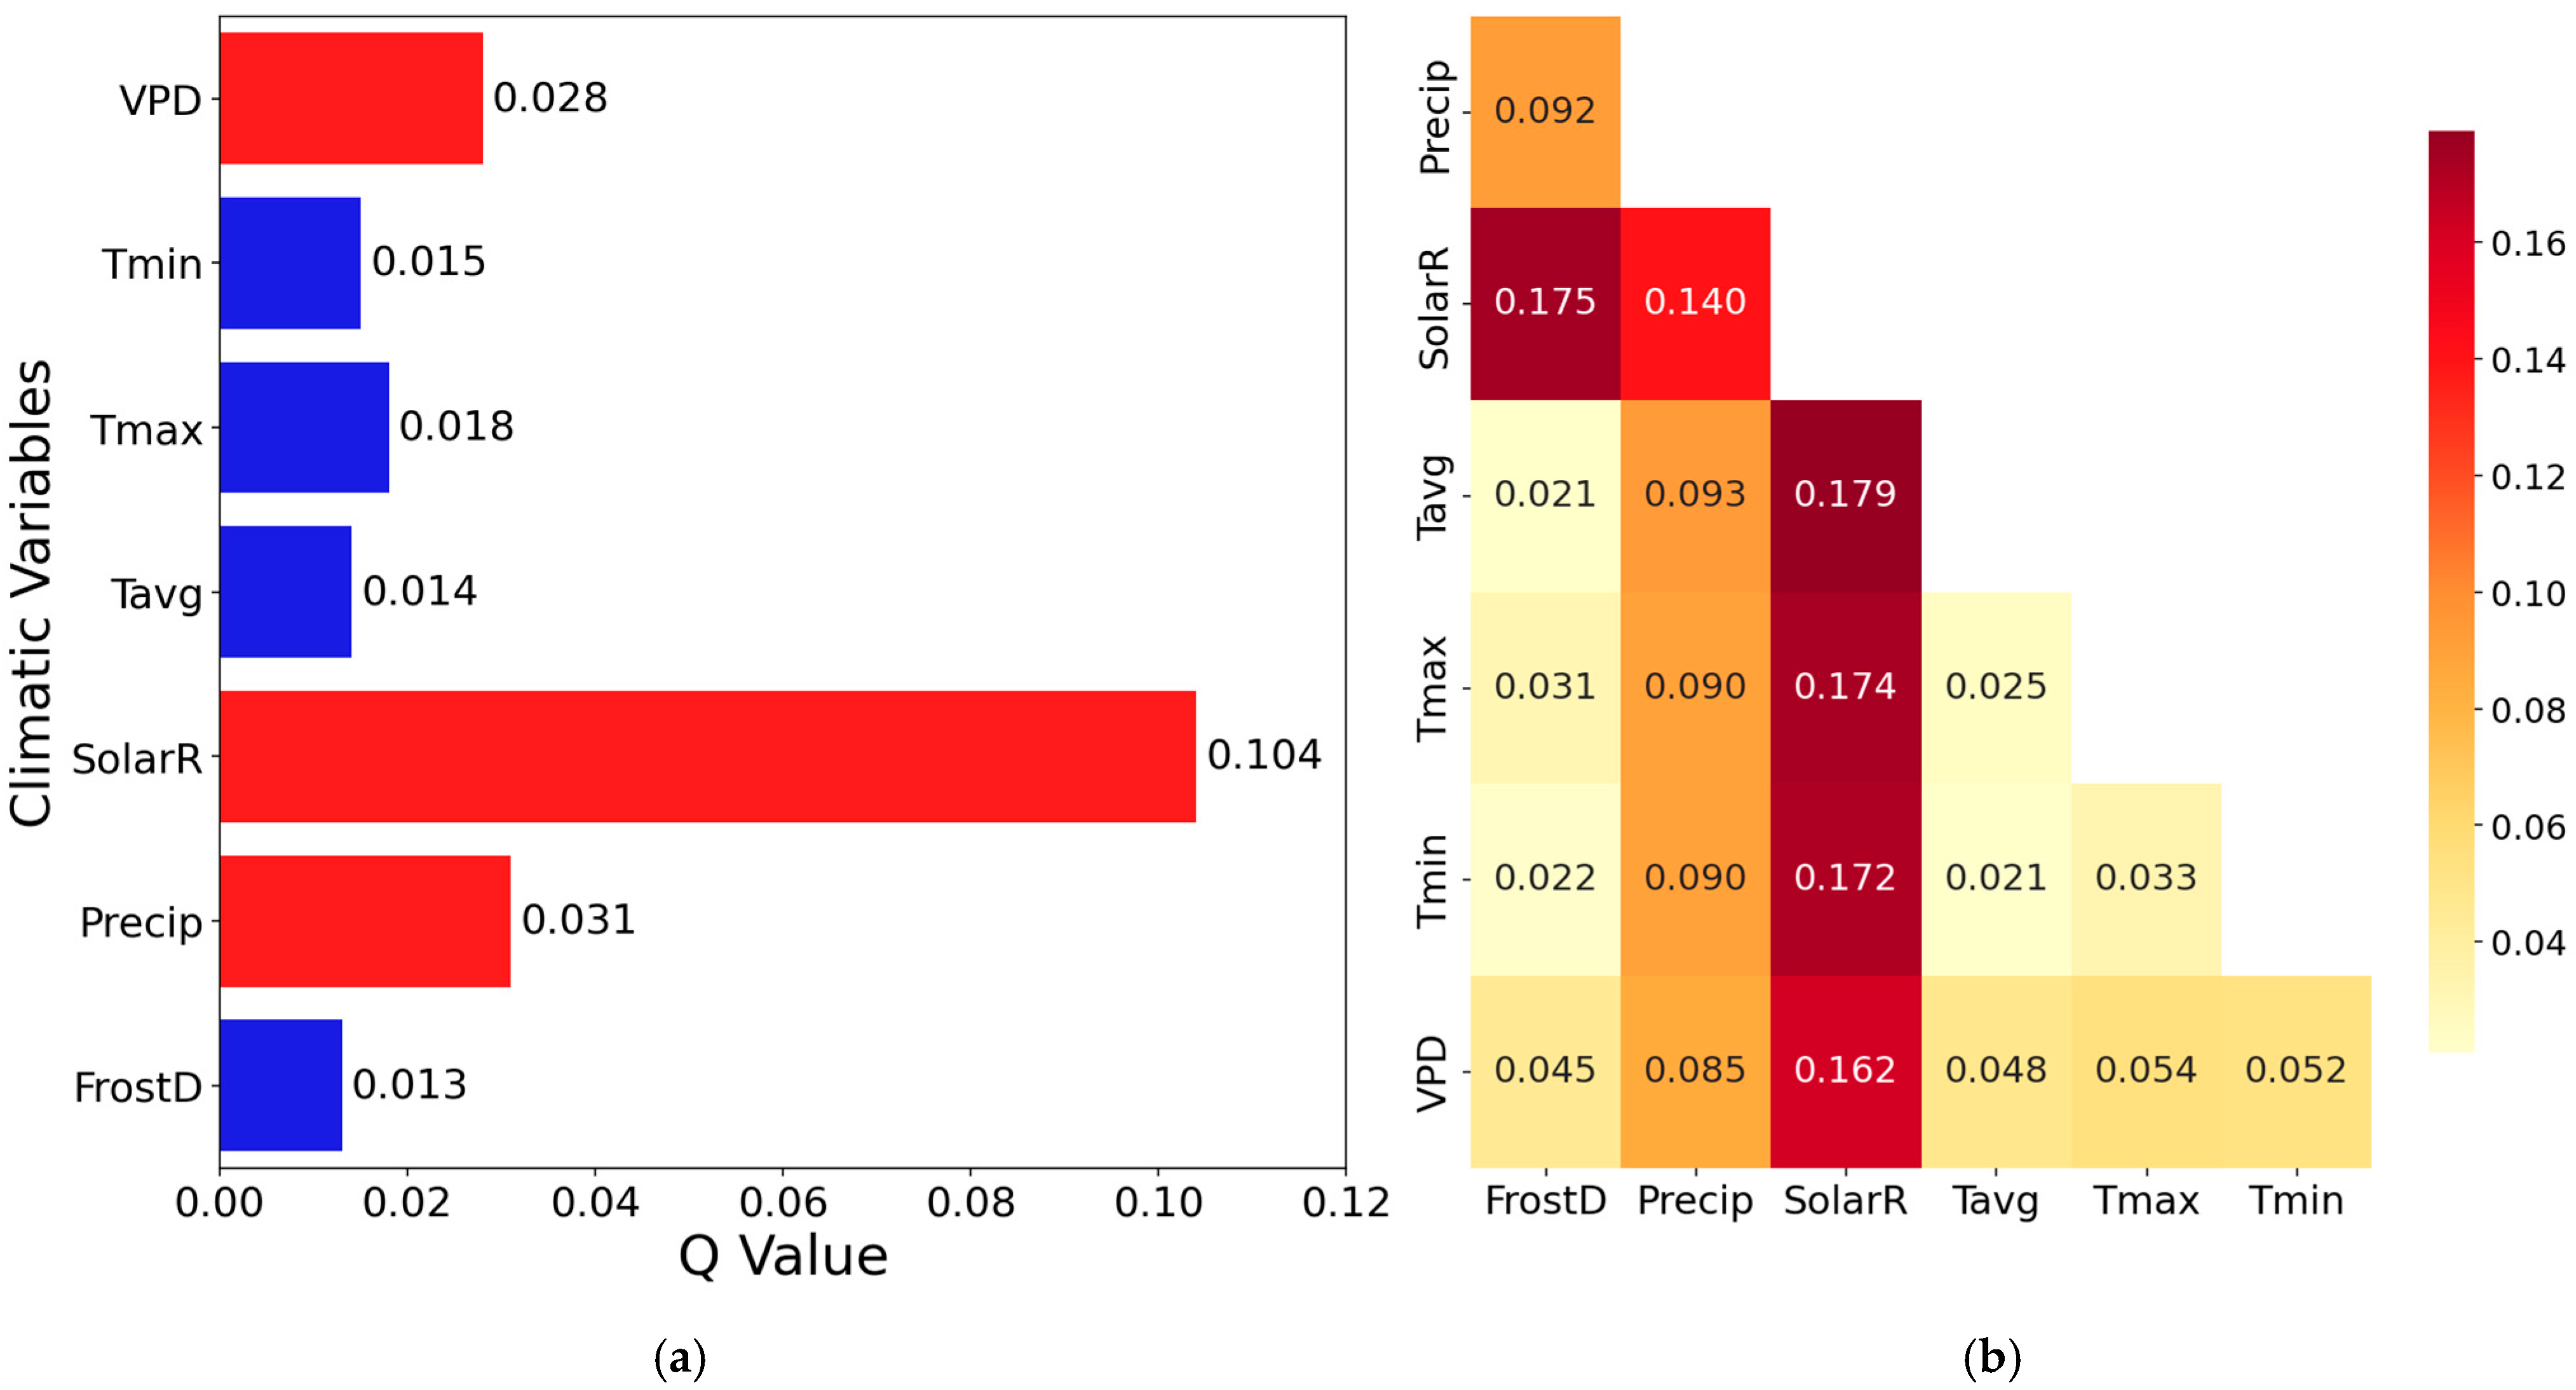
First case: The GD model assessed the influence of seven climatic variables on NEP in forest ecosystems over the entirety of China. In the GD model, all variables significantly impacted NEP change at a p-value of < 0.01, indicating a clear relationship between the climatic factors and NEP. Solar radiation, precipitation, and VPD were recognized as the key drivers of temporal NEP variations in China’s forests from 2013 to 2023. Solar radiation showed the highest impact, having a 0.104 q-value, followed by precipitation at 0.031 and VPD at 0.028. Other climatic variables, such as frost days (0.013), Tavg (0.014), Tmin (0.015), and Tmax (0.018), had relatively weaker effects on NEP, as illustrated in Figure 8a.
The interaction detector estimated q-values for pairs of climatic variables as illustrated in Figure 8b. Factor interaction had higher q-statistic values than individual factors, indicating that NEP dynamics are driven mainly by combined influences. The interaction of the solar radiation and Tavg (0.179) had the strongest effect on vegetation productivity, followed by solar radiation and frost days (0.175), and solar radiation and Tmax (0.174). Other interactions are as follows: solar radiation and Tmin (0.172), solar radiation and VPD (0.162), and solar radiation and precipitation (0.14). Other climate factor interactions had a contribution of <0.1 q-value, indicating that their effects are very low in influencing NEP change. The interaction between solar radiation, temperature, and precipitation is vital for plant growth and carbon sequestration. The results also showed that all factor pairs, except four that showed bivariate enhancement (FrostD + Tavg (0.021), FrostD + Tmin (0.022), Tavg + Tmax (0.025), and Tavg + Tmin (0.021), exhibited nonlinear enhanced interactions. This suggests that NEP dynamics are influenced by complex climatic interdependencies rather than isolated drivers.
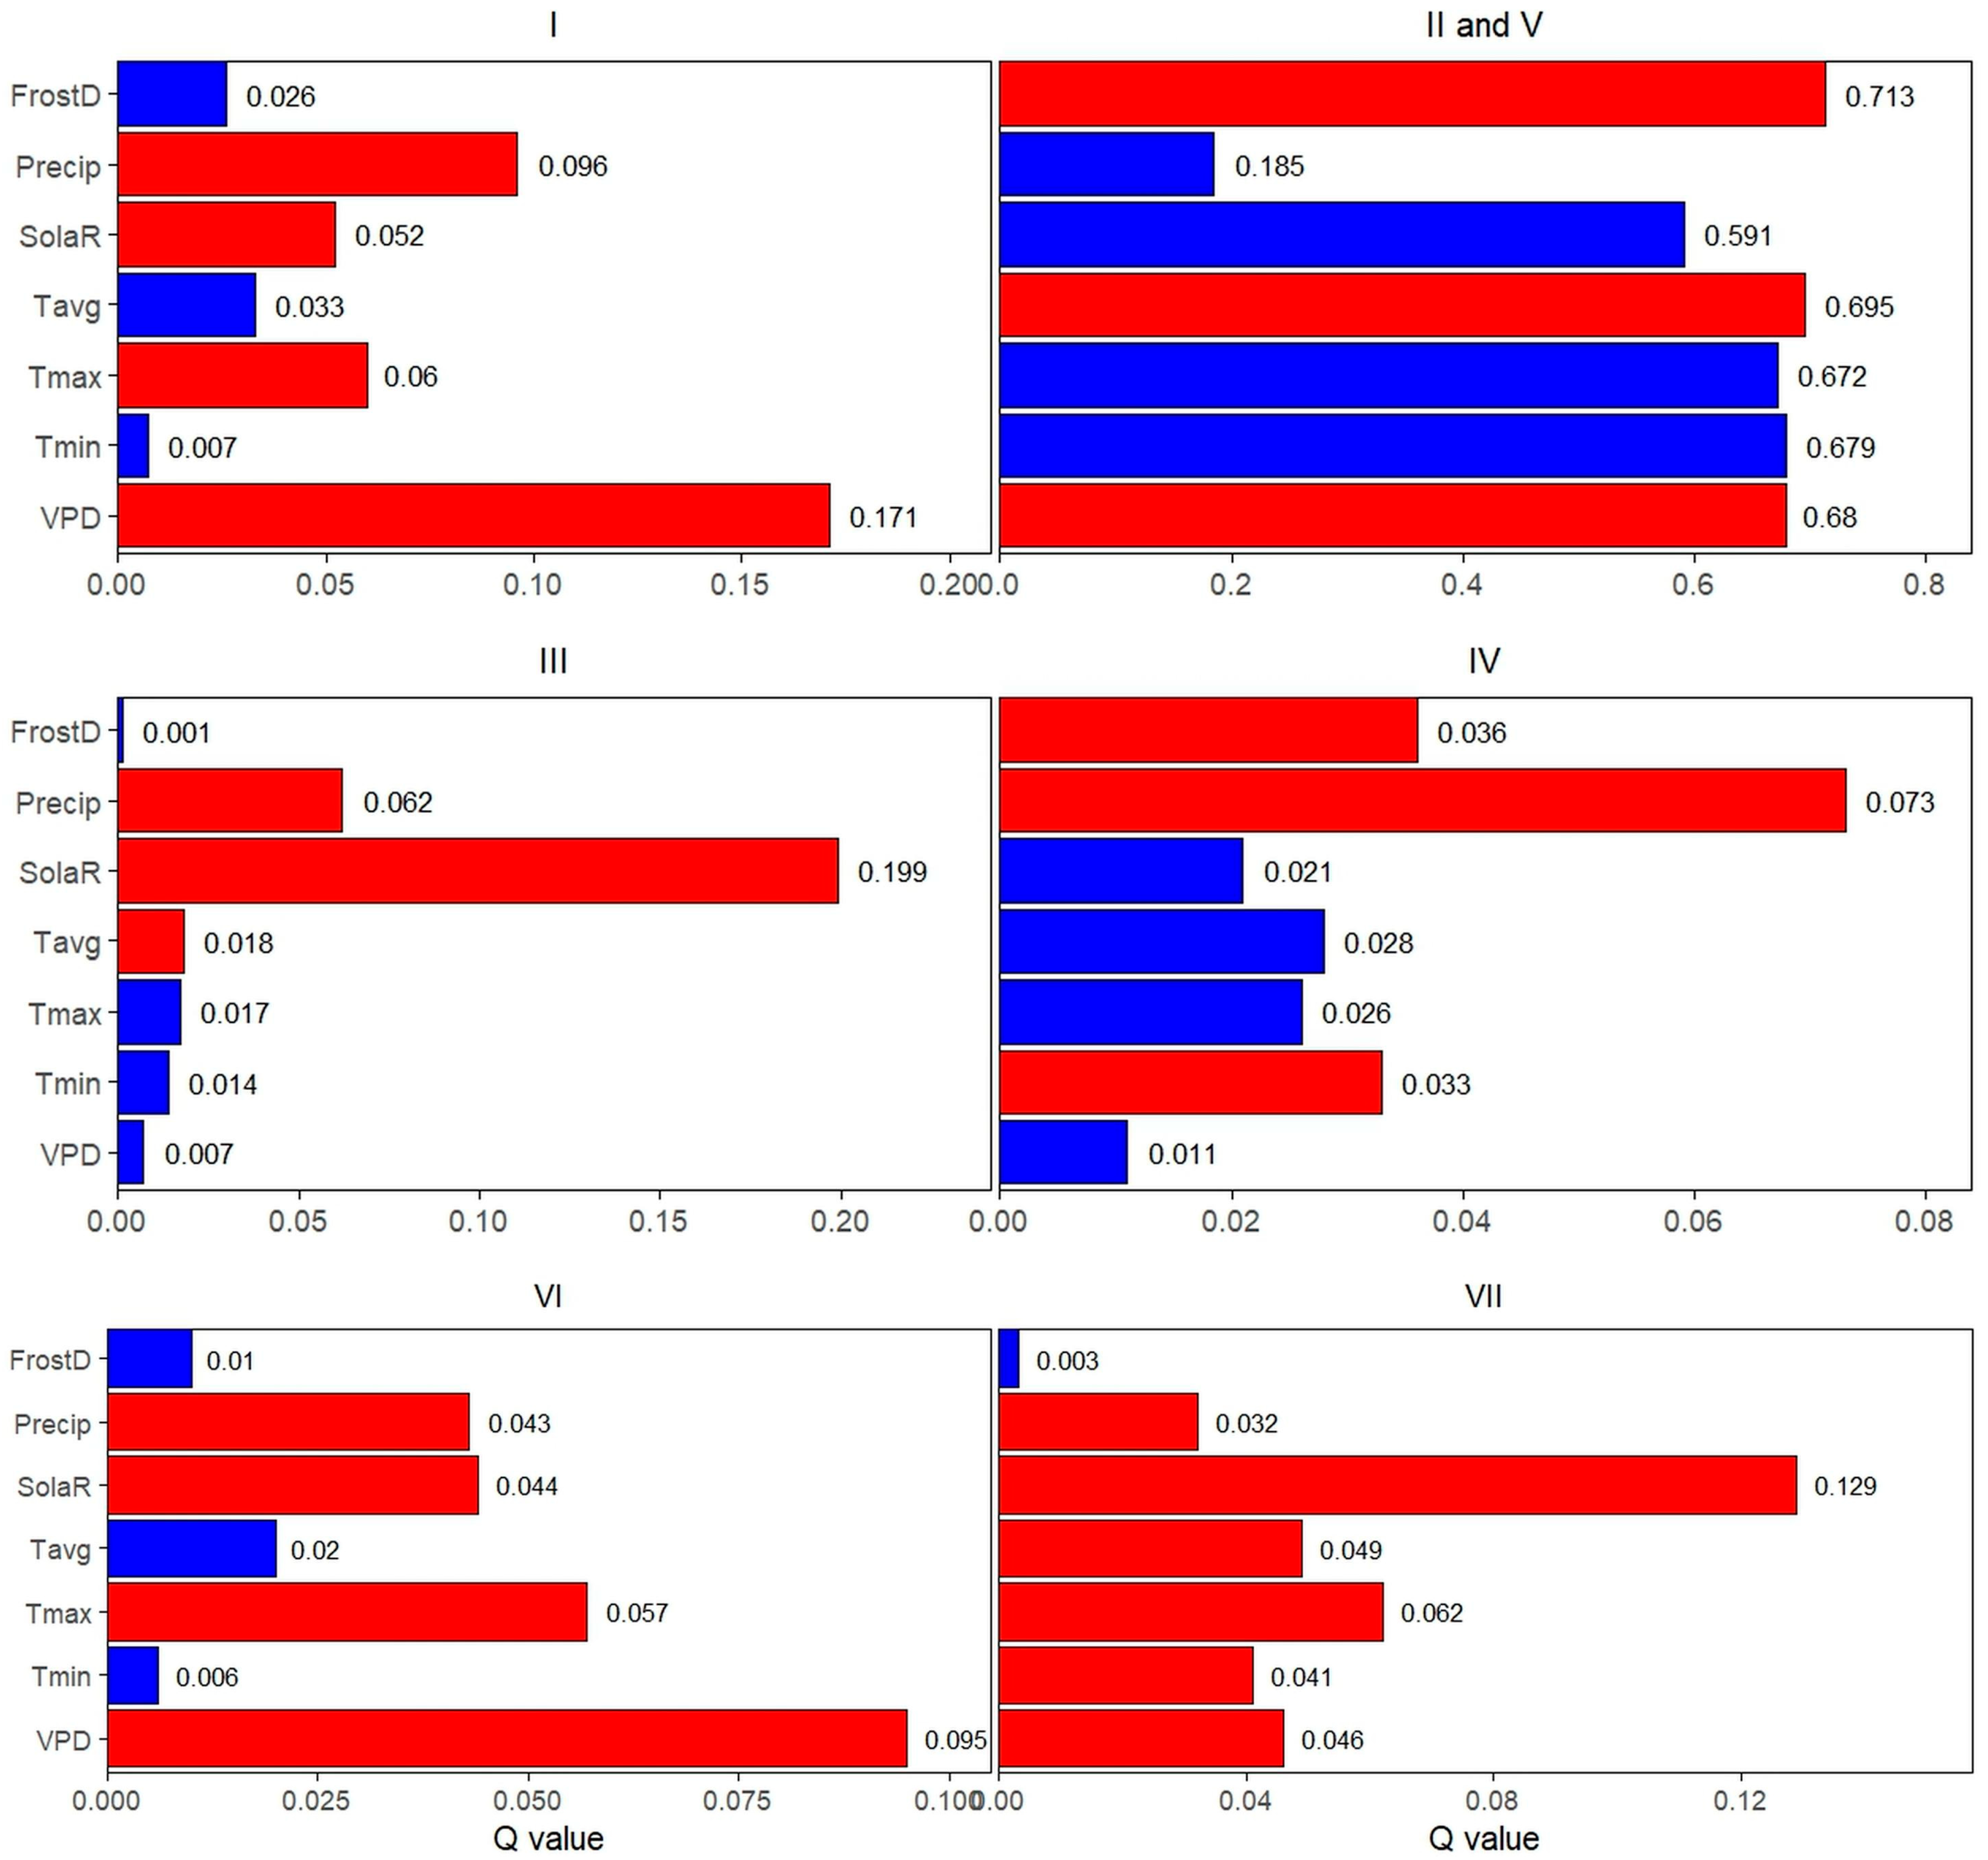
Second case: The GD model was applied to each climatic region in China to assess the impact of climatic variables on NEP of forest ecosystems (Figure 9). Region I: VPD (0.171), precipitation (0.096), Tmax (0.06), and solar radiation (0.052) exhibit the highest q-values (>0.05), indicating a stronger influence on NEP in this region. Tavg (0.033), frost days (0.026), and Tmin (0.007) show a relatively smaller but still notable impact. This is consistent with the fact that as latitude increases, the effect of these three factors tends to strengthen, especially in higher latitudes where temperature variation and frost conditions become more prominent. Region II and V: To ensure the GD model runs effectively, sufficient observations are needed. Therefore, Region II was combined with Region V due to its very small forest cover. Then, frost days (0.713), Tavg (0.695), and VPD (0.68) showed a strong effect on NEP. Frost days had a higher q-value as most of the region experiences winter conditions. Meanwhile, other factors such as precipitation, Tmax, Tmin, and solar radiation play a more significant role in influencing the ecosystem’s carbon dynamics, particularly during the summer and spring seasons. Region III: Solar radiation (0.199), precipitation (0.062), and Tavg (0.018) are the dominant factors influencing NEP, highlighting the significant roles of sunlight and moisture in driving forest ecosystem productivity. Minimal effects have been observed from Tmax (0.017), Tmin (0.014), and VPD (0.007), suggesting that temperature is less of a limiting factor in this region’s ecosystem dynamics. Similarly, frost days (0.001) shows a negligible impact, indicating that the frost factor is not as influential in this climate zone. Region IV: Precipitation (0.073) remains a key factor supporting forest productivity, providing essential moisture during and after winter for biological processes. Frost days (0.036) and Tmin (0.033) play a crucial role in limiting biological activity and NEP, especially since the northern part of this climate region experiences winter conditions. Other factors (Solar radiation, Tmax, Tavg, and VPD) have a notable effect on NEP. Region VI: VPD (0.095), Tmax (0.057), solar radiation (0.044), and precipitation (0.043) have the highest q-values, making them the most influential factors on NEP in this region. On the other hand, Tavg (0.02), Tmin (0.006), and frost days (0.01) have weaker effects on NEP, with q-values less than 0.03, suggesting that temperature-related factors, although still important, are less critical in limiting forest productivity compared to moisture-related factors in this region. Region VII: The factors influencing NEP are solar radiation (0.129), Tmax (0.062), Tavg (0.049), VPD (0.046), Tmin (0.041), and precipitation (0.032). Among these, solar radiation stands out with the highest q-value, indicating its dominant role in influencing NEP in this region. Tmax, Tavg, VPD, and Tmin have moderate impacts, suggesting that temperature-related factors also influence the growing season and ecosystem dynamics. Precipitation is another significant factor, showing the importance of rainfall in supporting photosynthesis and forest growth. Lastly, frost days has the least influence, reflecting that frost is not a major limiting factor for NEP in this region, likely due to milder winter conditions.
The interaction effects of climate variables on NEP in China’s forest ecosystems for each climate region were analyzed, providing clear evidence that paired factors have a greater influence than isolated ones (Figure S5).

4. Discussion

This research simulates China’s forests’ Net Primary Productivity (NPP) from 2013 to 2023, offering valuable insights into the fundamental carbon balance. The study’s average NPP estimate of 870 gC·m−2·yr−1 is higher compared to earlier estimates of around 840 gC·m−2·yr−1 [63,64]. Although the average differences in NPP across studies are not large, the slight difference of 30 gC·m−2·yr−1 between this study and previous research highlights the advancement brought about by the use of the 3-PGS model, which accounts for a broad range of physiological, environmental, and ecological mechanisms that may not have been incorporated in other models. This suggests that China’s forest ecosystems have made a more significant contribution to carbon storage than previously understood, improving our ability to model and predict their role in the global carbon cycle. The difference in NPP estimates can largely be attributed to the use of more recent climate, moderate-resolution data from the years 2013 to 2023, enabling the model to incorporate the latest climatic conditions, forest management practices, and ecosystem dynamics. As latitude increases, climatic factors limit carbon production, lowering NPP. Warmer and more humid environments in the south promote higher forest productivity, while the colder, drier north reduces it, reflecting the strong influence of climate on forest carbon storage [65,66]. The 3-PGS model’s process-based approach is a major strength, allowing it to model physiological processes such as photosynthesis, transpiration, and overall growth, which directly influence NPP and are sensitive to climatic variability. Additionally, Mao et al. [67] found that the long-term overall average NPP for various forest types, accurately represented by models, is above 500 gC·m−2·yr−1. When comparing with the current estimate of 870 gC·m−2·yr−1, which comfortably exceeds Mao et al. [67]’s estimation, this provides strong evidence that China’s forests have recently made a significant contribution to carbon sequestration. The 3-PGS model also demonstrates significant improvements, as shown by the comparison of the annual average NPP and its range for each forest type with previous research [64,67,68,69] as summarized in Table 1.
The wider range of the model’s NPP values (i.e., 256.74–1518.63 gC·m−2·yr−1 for EBF, 176.20–1304.74 gC·m−2·yr−1 for ENF, and 6.82–1417.33 gC·m−2·yr−1 for MF) in this study compared to other estimate ranges further reflects the flexibility and adaptive nature of the 3-PGS model. The wide range observed here emphasizes the model’s ability to represent the heterogeneity in forest conditions across China, which other models might not have captured. The variability in NPP values across different forest types reflects real-world differences in forest structure, species diversity, and environmental influences that are fundamental to understanding forest productivity and carbon sequestration. The wide range observed here emphasizes the model’s ability to represent the heterogeneity in forest conditions across China, which other models might not have captured.
Understanding the carbon cycle in ecosystems, particularly in forests, requires knowledge of NEP estimation [70,71]. NEP provides a measure of an ecosystem’s capacity to both sequester and emit carbon, thereby serving as a valuable metric for assessing its ecological integrity across diverse regions. Evaluating carbon sequestration and emission processes is key to understanding whether an ecological structure serves as a carbon sink or source, and ongoing assessments of these processes are essential for projecting global carbon flow [11,72,73]. By providing more precise NEP estimates for China’s forests, this research helps refine the global carbon budget and supports the design of more targeted mitigation strategies for addressing global climate change.
Our annual average NEP estimate of 0.156 ± 0.0071 PgC (or 155.86 TgC) for China’s forests from 2013 to 2023 is higher compared to earlier studies that employed process-based models and various multi-source spatial data in evaluating China’s NEP status, including estimates by He et al. (0.118 PgC/yr) [19], Yang et al. (0.11 PgC/yr) [74], and Zhang et al. (0.134 PgC/yr) [54]. Our estimate also falls within the reported range of 0.10 to 0.24 PgC/yr [3,21,75] for model-based approaches, thereby confirming the high accuracy of this study. The Global Carbon Project, 2023 (https://globalcarbonatlas.org/emissions/carbon-emissions/, accessed on 26 August 2025) provides China’s annual data on anthropogenic CO2 emissions at 11.903 Gt CO2. This closely corresponds with the 11.4 Gt CO2 (or 3.1 Gt C) projection for 2022 presented by Friedlingstein et al. (2022) [76]. Our analysis of forest Net Ecosystem Production (NEP) reveals an annual carbon sink of 155.86 Tg C yr−1, which offsets approximately 4.8% of the total emissions. This forest-specific estimate is within the 3–8% range indicated by ecosystem process models, although it is lower than that derived from inventory approaches (~10%) [21,77] and that proposed by atmospheric inversions, which reaches up to 45% [78].
The increased annual NEP value observed in this study, compared to earlier research, can primarily be attributed to the Chinese government’s large-scale vegetation restoration initiatives implemented in the late 20th century [22]. Efforts such as afforestation, farmland restoration to forests, and ecological protection policies have collectively led to notable enhancements in carbon sequestration nationwide [79,80]. The Global Canopy Program’s soil erosion control in the Loess Plateau and natural forest conservation projects are among the initiatives implemented to combat land degradation, desertification, and soil erosion [81]. These initiatives have substantially increased China’s carbon sequestration capacity by enhancing forest cover, mitigating soil erosion, and rehabilitating degraded lands. As a result, the ecosystem’s ability to sequester and store carbon has improved, directly supporting China’s strategic goal of achieving carbon neutrality. The elevated NEP estimates in this study provide empirical evidence of the effectiveness of these ecological restoration efforts, demonstrating that China’s terrestrial ecosystems are functioning as increasingly robust carbon sinks [82]. This progress underscores China’s commitment to reducing net carbon emissions and highlights the vital role of forest and land management in advancing toward national carbon neutrality targets [83]. The study suggests that these efforts need to be intensified, particularly in areas that have been less affected by large-scale restoration.
To measure China’s climate’s influence on forest NEP during 2013–2023, the GD model was utilized due to its ability to effectively elucidate causal relationships between two variables, which are in two dimensions [56]. Variations in NEP across China’s forests are primarily driven by solar radiation, precipitation, and VPD, with temperature and frost days playing a less significant role.
Due to cold temperatures, solar radiation has little influence in Region IV during the winter months, but plants can efficiently use radiation to boost productivity in spring and summer [84]. In Region VII and the southern part of Region VI, high humidity and cloud cover influence solar radiation by enhancing its penetration into the forest canopy, which improves light use efficiency (LUE) when direct sunlight is limited. The enhanced LUE under these conditions contributes to the high productivity of carbon sequestration observed in tropical and subtropical areas year-round [85,86,87]. The consistent rainfall in southern China (Regions III, VI, and VII) sustains tropical and subtropical vegetation, resulting in high NEP as plants have continuous access to water throughout the year. Conversely, the northern part of Region V experiences lower precipitation, particularly during winter, leading to seasonal droughts that restrict forest growth and overall productivity [88].
In arid regions, including I, II, and V, high VPD due to low humidity and fluctuating temperatures accelerates evapotranspiration, which in turn reduces soil moisture and plant producing capacity [89]. VPD has minimal impact on NEP in Regions VII, III, and southeastern VI, where frequent rainfall and high humidity support both consistent moisture retention and NEP [88]. Although warmer spring and summer temperatures typically enhance the growing season, the low temperatures in Region IV limit NEP by diminishing soil microbial respiration rates. In Regions V and I, higher temperatures lead to increased VPD, which subsequently reduces absorption efficiency [90]. While warmer temperatures in Regions VII, III, and southeastern VI generally enhance Net Ecosystem Productivity (NEP), extreme heat and drought conditions can diminish carbon storage capabilities [91]. The occurrence of frosts significantly impacts northern and high-altitude forests, specifically in Regions I, II, IV, and V, by shortening the growing season and thereby reducing NEP [92]. These findings suggest that climate change mitigation strategies should include regional assessments of temperature thresholds to better understand how different ecosystems may respond to future climate scenarios. The application of the GD model in this study, along with its corresponding results, aligns closely with findings reported in previous research [17,19,93], reinforcing the model’s reliability in assessing climate–NEP relationships. A key advancement of this study lies in the application of the 3-PGS model on simulating the current NEP estimate, which supports the significant success of China’s ongoing initiatives to increase forest cover, achieve carbon neutrality, and realize its goal of establishing a fully developed green, low-carbon, and circular economy by 2060 [94]. Our findings not only validate the effectiveness of large-scale ecological restoration programs but also offer actionable insights for optimizing policies to enhance carbon sequestration. Also, the use of the GD model at both the national scale and across distinct climatic zones enables a more comprehensive and spatially resolved understanding of how NEP in China’s forest ecosystems responds to diverse climate conditions. Future research should investigate the long-term impacts of disturbances, including land-use changes and fire risk, on carbon storage, and refine models to integrate finer-scale remote sensing data along with additional climate and soil variables, such as the effects of nitrogen, in order to provide more precise NEP estimates.

Limitation

The model’s reliability was confirmed by the Net Primary Productivity (NPP) validation, which proved reasonable performance with an R2 of 0.52 and an RMSE of 126.17 gC m−2 for a sample size (n) of 3720. However, despite this moderate agreement between the model and MODIS data, the model’s limitations must still be acknowledged. The 3-PGS model has limited capacity to incorporate the effects of disturbances, including fires, pest outbreaks, and land use changes. Since these factors can significantly alter forest carbon dynamics, their exclusion may reduce the model’s predictive accuracy. To improve NEP estimation, it is important to account for disturbances like fires, land use changes, and pest outbreaks. Additionally, using high-resolution climate, soil, and vegetation data will help reduce errors and improve model accuracy.

5. Conclusions

Combining the 3-PGS, soil heterotrophic respiration, and GD models allowed for the simulation of forests’ NEP distribution across China, while also addressing the influence of climate variables on NEP changes from 2013 to 2023. The main conclusions are as follows:
  • This study provides a comprehensive assessment of China’s forest carbon sequestration potential from 2013 to 2023, with a focus on Net Ecosystem Production (NEP). The findings indicate that China’s forests accumulated 1.71 ± 0.09 PgC over the study period, with an annual average NEP of 0.156 ± 0.0071 PgC (155.86 TgC/year). These results highlight significant variability in NEP across different forest types, with southern China contributing over 45% of the total sequestration. This underscores the influence of regional climate and ecological conditions on forest productivity. The findings also demonstrate the growing role of China’s forests as carbon sinks, emphasizing their capacity to mitigate carbon emissions. While the increase in NEP over time highlights the effectiveness of China’s forest ecosystems in carbon sequestration, the study also reveals that forest-based sequestration alone cannot fully offset the country’s total emissions. This highlights the necessity of a comprehensive, integrated approach to achieving China’s carbon neutrality goals by 2060. Forest management must be combined with other ecosystem-based solutions, including afforestation, sustainable agriculture, and advancements in carbon capture technologies.
  • The study further identifies solar radiation, precipitation, and vapor pressure deficit (VPD) as the primary climatic drivers of NEP variations in China’s forests, with temperature and frost days playing a secondary role. The interaction between these climatic factors underscores the importance of region-specific strategies for climate-resilient forest management. Given the variability in forest productivity across China, targeted interventions should prioritize areas with low carbon sequestration potential, aiming to enhance carbon storage in these regions while also optimizing carbon sequestration in areas with high potential, particularly in tropical and subtropical zones.
  • This study’s findings not only contribute to China’s carbon neutrality strategies but also enhance global understanding of forest carbon dynamics. The insights provided will be valuable for policymakers seeking to optimize forest management practices, inform regional climate strategies, and contribute to global carbon cycle models. As such, this research lays the foundation for future efforts aimed at maximizing the role of forests in mitigating climate change and achieving long-term environmental sustainability.

Supplementary Materials

The following supporting information can be downloaded at: https://www.mdpi.com/article/10.3390/f16091398/s1.

Author Contributions

Conceptualization, F.J.M. and Y.Y.; paper writing, F.J.M.; paper reviewing and editing, F.J.M., Y.Y. and X.Y.; supervision, Y.Y. and X.Y.; funding acquisition, W.F. All authors have read and agreed to the published version of the manuscript.

Funding

Special Science Fund for Carbon Neutrality of Northeast Forestry University (HFW220100054); The National Key Research and Development Program of China (2023YFD2201704).

Data Availability Statement

All the data used in this study are publicly and freely available.

Acknowledgments

I express my gratitude to Nicholas Coops for his assistance in utilizing the data to execute the model. The guidance provided was absolutely essential.

Conflicts of Interest

The authors declare no conflicts of interest.

References

  1. Ritchie, H.; Rosado, P.; Roser, M. Greenhouse Gas Emissions. Our World Data 2020. Available online: https://ourworldindata.org/greenhouse-gas-emissions (accessed on 26 August 2025).
  2. Piao, S.; He, Y.; Wang, X.; Chen, F. Estimation of China’s Terrestrial Ecosystem Carbon Sink: Methods, Progress and Prospects. Sci. China Earth Sci. 2022, 65, 641–651. [Google Scholar] [CrossRef]
  3. Tian, H.; Melillo, J.; Lu, C.; Kicklighter, D.; Liu, M.; Ren, W.; Xu, X.; Chen, G.; Zhang, C.; Pan, S. China’s Terrestrial Carbon Balance: Contributions from Multiple Global Change Factors. Glob. Biogeochem. Cycles 2011, 25, GB1007. [Google Scholar] [CrossRef]
  4. The Chinese Foreign Ministry (TCFM). Statement by Xi Jinping, President of the People’s Republic of China, at the General Debate of the 75th Session of the United Nations General Assembly; The Chinese Foreign Ministry (TCFM): Beijing, China, 2021.
  5. Masson-Delmotte, V.; Zhai, P.; Pörtner, H.-O.; Roberts, D.; Skea, J.; Shukla, P.R. Global Warming of 1.5 C: IPCC Special Report on Impacts of Global Warming of 1.5 C Above Pre-Industrial Levels in Context of Strengthening Response to Climate Change, Sustainable Development, and Efforts to Eradicate Poverty; Cambridge University Press: Cambridge, UK, 2022; ISBN 1009157949. [Google Scholar]
  6. Xu, D.-F.; Wang, R.-H.; Li, Y.-X.; Hui, Z. Review on Carbon Cycle in Terrestrial Ecosystem and Its Influenced Factors. Chin. J. Agrometeorol. 2009, 30, 519. [Google Scholar]
  7. Zhang, P.; He, J.; Hong, X.; Zhang, W.; Qin, C.; Pang, B.; Li, Y.; Liu, Y. Carbon Sources/Sinks Analysis of Land Use Changes in China Based on Data Envelopment Analysis. J. Clean. Prod. 2018, 204, 702–711. [Google Scholar] [CrossRef]
  8. Lü, F.C.; Ma, J.Y.; Cao, Y. Carbon Fluxes Simulation of China′ s Typical Forest Ecosystem Based on FORCCHN Model. Acta Ecol. Sin. 2022, 42, 2810–2821. [Google Scholar]
  9. Zhang, C.; Huang, N.; Wang, L.; Song, W.; Zhang, Y.; Niu, Z. Spatial and Temporal Pattern of Net Ecosystem Productivity in China and Its Response to Climate Change in the Past 40 Years. Int. J. Environ. Res. Public Health 2022, 20, 92. [Google Scholar] [CrossRef]
  10. Woodwell, G.M.; Whittaker, R.H.; Reiners, W.A.; Likens, G.E.; Delwiche, C.C.; Botkin, D.B. The Biota and the World Carbon Budget: The Terrestrial Biomass Appears to Be a Net Source of Carbon Dioxide for the Atmosphere. Science 1978, 199, 141–146. [Google Scholar] [CrossRef]
  11. Pathak, K.; Malhi, Y.; Sileshi, G.W.; Das, A.K.; Nath, A.J. Net Ecosystem Productivity and Carbon Dynamics of the Traditionally Managed Imperata Grasslands of North East India. Sci. Total Environ. 2018, 635, 1124–1131. [Google Scholar] [CrossRef]
  12. Qi, S.; Zhang, H.; Zhang, M. Net Primary Productivity Estimation of Terrestrial Ecosystems in China with Regard to Saturation Effects and Its Spatiotemporal Evolutionary Impact Factors. Remote Sens. 2023, 15, 2871. [Google Scholar] [CrossRef]
  13. Wang, J.; Wu, C.; Wang, X.; Zhang, X. A New Algorithm for the Estimation of Leaf Unfolding Date Using MODIS Data over China’s Terrestrial Ecosystems. ISPRS J. Photogramm. Remote Sens. 2019, 149, 77–90. [Google Scholar] [CrossRef]
  14. Field, C.B.; Behrenfeld, M.J.; Randerson, J.T.; Falkowski, P. Primary Production of the Biosphere: Integrating Terrestrial and Oceanic Components. Science 1998, 281, 237–240. [Google Scholar] [CrossRef] [PubMed]
  15. Zheng, D.; Prince, S.; Wright, R. Terrestrial Net Primary Production Estimates for 0.5 Grid Cells from Field Observations—A Contribution to Global Biogeochemical Modeling. Glob. Change Biol. 2003, 9, 46–64. [Google Scholar] [CrossRef]
  16. Chen, P.F. Monthly NPP Dataset Covering China’s Terrestrial Ecosystems at North of 18° N (1985–2015). J. Glob. Change Data Discov. 2019, 3, 34–41. [Google Scholar]
  17. Chen, Y.; Xu, Y.; Chen, T.; Zhang, F.; Zhu, S. Exploring the Spatiotemporal Dynamics and Driving Factors of Net Ecosystem Productivity in China from 1982 to 2020. Remote Sens. 2023, 16, 60. [Google Scholar] [CrossRef]
  18. Ma, X.; Wu, L.; Zhu, Y.; Wu, J.; Qin, Y. Simulation of Vegetation Carbon Sink of Arbor Forest and Carbon Mitigation of Forestry Bioenergy in China. Int. J. Environ. Res. Public Health 2022, 19, 13507. [Google Scholar] [CrossRef] [PubMed]
  19. He, H.; Wang, S.; Zhang, L.; Wang, J.; Ren, X.; Zhou, L.; Piao, S.; Yan, H.; Ju, W.; Gu, F. Altered Trends in Carbon Uptake in China’s Terrestrial Ecosystems under the Enhanced Summer Monsoon and Warming Hiatus. Natl. Sci. Rev. 2019, 6, 505–514. [Google Scholar] [CrossRef] [PubMed]
  20. Liu, S.; Zhou, T.; Wei, L.; Shu, Y. The Spatial Distribution of Forest Carbon Sinks and Sources in China. Chin. Sci. Bull. 2012, 57, 1699–1707. [Google Scholar] [CrossRef]
  21. Piao, S.; Fang, J.; Ciais, P.; Peylin, P.; Huang, Y.; Sitch, S.; Wang, T. The Carbon Balance of Terrestrial Ecosystems in China. Nature 2009, 458, 1009–1013. [Google Scholar] [CrossRef]
  22. Zhou, Y.; Li, X.; Liu, Y. Land Use Change and Driving Factors in Rural China during the Period 1995–2015. Land. Use Policy 2020, 99, 105048. [Google Scholar] [CrossRef]
  23. Sun, Q.; Miao, C.; Duan, Q. Extreme Climate Events and Agricultural Climate Indices in China: CMIP5 Model Evaluation and Projections. Int. J. Climatol. 2016, 36, 43–61. [Google Scholar] [CrossRef]
  24. Qin, H.; Jin, X.; Guo, K. An Overview of China’s Vegetation and Plant Diversity. In Conservation and Reintroduction of Rare and Endangered Plants in China; Springer: Singapore, 2020; pp. 3–19. [Google Scholar]
  25. National Forestry and Grassland Administration. China Forest Resources Report 2014–2018; China Forestry Publishing House: Beijing, China, 2019; pp. 357–469. [Google Scholar]
  26. Muñoz-Sabater, J.; Dutra, E.; Agustí-Panareda, A.; Albergel, C.; Arduini, G.; Balsamo, G.; Boussetta, S.; Choulga, M.; Harrigan, S.; Hersbach, H. ERA5-Land: A State-of-the-Art Global Reanalysis Dataset for Land Applications. Earth Syst. Sci. Data 2021, 13, 4349–4383. [Google Scholar] [CrossRef]
  27. Didan, K. MODIS/Terra Vegetation Indices Monthly L3 Global 0.05 Deg CMG V061. Available online: https://www.earthdata.nasa.gov/data/catalog/lpcloud-mod13c2-061 (accessed on 26 August 2025).
  28. Holben, B.N. Characteristics of Maximum-Value Composite Images from Temporal AVHRR Data. Int. J. Remote Sens. 1986, 7, 1417–1434. [Google Scholar] [CrossRef]
  29. Tian, J.; Zhu, X.; Chen, J.; Wang, C.; Shen, M.; Yang, W.; Tan, X.; Xu, S.; Li, Z. Improving the Accuracy of Spring Phenology Detection by Optimally Smoothing Satellite Vegetation Index Time Series Based on Local Cloud Frequency. ISPRS J. Photogramm. Remote Sens. 2021, 180, 29–44. [Google Scholar] [CrossRef]
  30. Friedl, M.; Sulla-Menashe, D. MODIS/Terra+ Aqua Land Cover Type Yearly L3 Global 0.05 Deg CMG V061. Available online: https://www.earthdata.nasa.gov/data/catalog/lpcloud-mcd12c1-061 (accessed on 26 August 2025).
  31. Zeng, T.; Zhang, Z.; Zhao, X.; Wang, X.; Zuo, L. Evaluation of the 2010 MODIS Collection 5.1 Land Cover Type Product over China. Remote Sens. 2015, 7, 1981–2006. [Google Scholar] [CrossRef]
  32. Xie, Y.; Wang, H.; Lei, X. Application of the 3-PG Model to Predict Growth of Larix Olgensis Plantations in Northeastern China. Ecol. Manag. 2017, 406, 208–218. [Google Scholar] [CrossRef]
  33. Feng, X.; Liu, G.; Chen, J.M.; Chen, M.; Liu, J.; Ju, W.M.; Sun, R.; Zhou, W. Net Primary Productivity of China’s Terrestrial Ecosystems from a Process Model Driven by Remote Sensing. J. Environ. Manag. 2007, 85, 563–573. [Google Scholar] [CrossRef]
  34. Running, S.; Zhao, M. MOD17A3HGF MODIS/Terra Net Primary Production Gap-Filled Yearly L4 Global 500 m SIN Grid V006. Available online: https://www.earthdata.nasa.gov/data/catalog/lpcloud-mod17a3hgf-006 (accessed on 26 August 2025).
  35. Sun, H.; Xu, Z.; Jia, B. A Compiled Soil Respiration Dataset at Different Time Scales for Forest Ecosystems across China from 2000 to 2018. Earth Syst. Sci. Data 2022, 14, 2951–2961. [Google Scholar] [CrossRef]
  36. Song, X.; Peng, C.; Zhao, Z.; Zhang, Z.; Guo, B.; Wang, W.; Jiang, H.; Zhu, Q. Quantification of Soil Respiration in Forest Ecosystems across China. Atmos. Environ. 2014, 94, 546–551. [Google Scholar] [CrossRef]
  37. Kumar, L.; Mutanga, O. Google Earth Engine Applications since Inception: Usage, Trends, and Potential. Remote Sens. 2018, 10, 1509. [Google Scholar] [CrossRef]
  38. Tamiminia, H.; Salehi, B.; Mahdianpari, M.; Quackenbush, L.; Adeli, S.; Brisco, B. Google Earth Engine for Geo-Big Data Applications: A Meta-Analysis and Systematic Review. ISPRS J. Photogramm. Remote Sens. 2020, 164, 152–170. [Google Scholar] [CrossRef]
  39. Gorelick, N.; Hancher, M.; Dixon, M.; Ilyushchenko, S.; Thau, D.; Moore, R. Google Earth Engine: Planetary-Scale Geospatial Analysis for Everyone. Remote Sens. Environ. 2017, 202, 18–27. [Google Scholar] [CrossRef]
  40. Coops, N.C.; Waring, R.H.; Landsberg, J.J. Assessing Forest Productivity in Australia and New Zealand Using a Physiologically-Based Model Driven with Averaged Monthly Weather Data and Satellite-Derived Estimates of Canopy Photosynthetic Capacity. For. Ecol. Manag. 1998, 104, 113–127. [Google Scholar] [CrossRef]
  41. Landsberg, J.J.; Waring, R.H. A Generalised Model of Forest Productivity Using Simplified Concepts of Radiation-Use Efficiency, Carbon Balance and Partitioning. Ecol. Manag. 1997, 95, 209–228. [Google Scholar] [CrossRef]
  42. Coops, N.C.; Waring, R.H. Estimating Forest Productivity in the Eastern Siskiyou Mountains of Southwestern Oregon Using a Satellite Driven Process Model, 3-PGS. Can. J. Res. 2001, 31, 143–154. [Google Scholar] [CrossRef]
  43. McMurtrie, R.E.; Gholz, H.L.; Linder, S.; Gower, S.T. Climatic Factors Controlling the Productivity of Pine Stands: A Model-Based Analysis. Ecol. Bull. 1994, 43, 173–188. [Google Scholar]
  44. Sellers, P.J. Canopy Reflectance, Photosynthesis, and Transpiration, II. The Role of Biophysics in the Linearity of Their Interdependence. Remote Sens. Environ. 1987, 21, 143–183. [Google Scholar] [CrossRef]
  45. Kumar, M.; Monteith, J.L. Remote Sensing of Plant Growth. In Plants and the Daylight Spectrum; Smith, H., Ed.; Academic Press: London, UK, 1982. [Google Scholar]
  46. Landsberg, J.J.; Waring, R.H.; Williams, M. The Assessment of NPP/GPP Ratio. Tree Physiol. 2020, 40, 695–699. [Google Scholar] [CrossRef] [PubMed]
  47. Zhang, Y.; Yu, G.; Yang, J.; Wimberly, C.; Zhang, X.; Tao, J.; Jiang, Y.; Zhu, J. Climate-Driven Global Changes in Carbon Use Efficiency. Glob. Ecol. Biogeogr. 2014, 23, 144–155. [Google Scholar] [CrossRef]
  48. Ryan, M.G.; Law, B.E. Interpreting, Measuring, and Modeling Soil Respiration. Biogeochemistry 2005, 73, 3–27. [Google Scholar] [CrossRef]
  49. Xie, W.; Chen, S.-T.; Hu, Z.-H. Factors Influencing the Variability in Soil Heterotrophic Respiration from Terrestrial Ecosystem in China. Huan Jing Ke Xue 2014, 35, 334–340. [Google Scholar]
  50. Shi, Z. Spatial-Temporal Simulation of Vegetation Carbon Sink and Its Influential Factors Based on CASA and GSMSR Model in Shaanxi Province. Ph.D. Thesis, Northwest A&F University, Xianyang, China, 2015. [Google Scholar]
  51. Bond-Lamberty, B.; Wang, C.; Gower, S.T. A Global Relationship between the Heterotrophic and Autotrophic Components of Soil Respiration? Glob. Change Biol. 2004, 10, 1756–1766. [Google Scholar] [CrossRef]
  52. Chen, S.; Huang, Y.; Zou, J.; Shi, Y.; Lu, Y.; Zhang, W.; Hu, Z. Interannual Variability in Soil Respiration from Terrestrial Ecosystems in China and Its Response to Climate Change. Sci. China Earth Sci. 2012, 55, 2091–2098. [Google Scholar] [CrossRef]
  53. Xie, X.L.; Sun, B.; Zhou, H.Z.; Li, Z.P.; Li, A.B. Estimation and Spatial Distribution Analysis of Soil Organic Carbon Density and Storage in China. Acta Pedol. Sin. 2004, 1, 35–43. [Google Scholar]
  54. Zhang, M.; Huang, X.J.; Chuai, X.; Xie, X.; Zhu, Z.; Wang, Y. Spatial Distribution and Changing Trends of Net Ecosystem Productivity in China. Geogr. Geo-Inf. Sci. 2020, 36, 69–74. [Google Scholar]
  55. Fang, J.; Chen, A.; Peng, C.; Zhao, S.; Ci, L. Changes in Forest Biomass Carbon Storage in China between 1949 and 1998. Science 2001, 292, 2320–2322. [Google Scholar] [CrossRef]
  56. Wang, J.F.; Xu, C.D. Geodetector: Principle and Prospective. Acta Geogr. Sin. 2017, 72, 116–134. [Google Scholar]
  57. Wang, J.F.; Li, X.H.; Christakos, G.; Liao, Y.L.; Zhang, T.; Gu, X.; Zheng, X.Y. Geographical Detectors-Based Health Risk Assessment and Its Application in the Neural Tube Defects Study of the Heshun Region, China. Int. J. Geogr. Inf. Sci. 2010, 24, 107–127. [Google Scholar] [CrossRef]
  58. Wang, J.-F.; Zhang, T.-L.; Fu, B.-J. A Measure of Spatial Stratified Heterogeneity. Ecol. Indic. 2016, 67, 250–256. [Google Scholar] [CrossRef]
  59. Wang, J.F.; Hu, Y. Environmental Health Risk Detection with GeogDetector. Environ. Model. Softw. 2012, 33, 114–115. [Google Scholar] [CrossRef]
  60. Jenks, G.F. The Data Model Concept in Statistical Mapping. Int. Yearb. Cartogr. 1967, 7, 186–190. [Google Scholar]
  61. Liu, Y.S.; Yang, R. The Spatial Characteristics and Formation Mechanism of the County Urbanization in China. Acta Geogr. Sin. 2012, 67, 1011–1020. [Google Scholar]
  62. Chen, G.S.; Yang, Y.S.; Lv, P.P.; Zhang, Y.P.; Qian, X.L. Regional Patterns of Soil Respiration in China’s Forests. Acta Ecol. Sin. 2008, 28, 1748–1761. [Google Scholar]
  63. Zhuang, Q.; Zhang, T.; Xiao, J.; Luo, T. Quantification of Net Primary Production of Chinese Forest Ecosystems with Spatial Statistical Approaches. Mitig. Adapt. Strat. Glob. Change 2009, 14, 85–99. [Google Scholar] [CrossRef]
  64. Ji, Y.; Zhou, G.; Luo, T.; Dan, Y.; Zhou, L.; Lv, X. Variation of Net Primary Productivity and Its Drivers in China’s Forests during 2000–2018. Ecosystems 2020, 7, 15. [Google Scholar] [CrossRef]
  65. Gu, F.; Zhang, Y.; Huang, M.; Tao, B.; Guo, R.; Yan, C. Effects of Climate Warming on Net Primary Productivity in China during 1961–2010. Ecol. Evol. 2017, 7, 6736–6746. [Google Scholar] [CrossRef]
  66. Yuan, Z.; Wang, Y.; Xu, J.; Wu, Z. Effects of Climatic Factors on the Net Primary Productivity in the Source Region of Yangtze River, China. Sci. Rep. 2021, 11, 1376. [Google Scholar] [CrossRef] [PubMed]
  67. Mao, J.; Dan, L.; Wang, B.; Dai, Y. Simulation and Evaluation of Terrestrial Ecosystem NPP with M-SDGVM over Continental China. Adv. Atmos. Sci. 2010, 27, 427–442. [Google Scholar] [CrossRef]
  68. Zhu, W.-Q.; Pan, Y.-Z.; Zhang, J.-S. Estimation of Net Primary Productivity of Chinese Terrestrial Vegetation Based on Remote Sensing. Chin. J. Plant Ecol. 2007, 31, 413. [Google Scholar]
  69. Liang, L.; Wang, Q.; Qiu, S.; Geng, D.; Wang, S. NEP Estimation of Terrestrial Ecosystems in China Using an Improved CASA Model and Soil Respiration Model. IEEE J. Sel. Top. Appl. Earth Obs. Remote Sens. 2023, 16, 10203–10215. [Google Scholar] [CrossRef]
  70. Aubinet, M.; Hurdebise, Q.; Chopin, H.; Debacq, A.; De Ligne, A.; Heinesch, B.; Manise, T.; Vincke, C. Inter-Annual Variability of Net Ecosystem Productivity for a Temperate Mixed Forest: A Predominance of Carry-over Effects? Agric. Meteorol. 2018, 262, 340–353. [Google Scholar] [CrossRef]
  71. Zhao, J.; Ma, J.; Zhu, Y. Evaluating Impacts of Climate Change on Net Ecosystem Productivity (NEP) of Global Different Forest Types Based on an Individual Tree-Based Model FORCCHN and Remote Sensing. Glob. Planet. Change 2019, 182, 103010. [Google Scholar] [CrossRef]
  72. Bloom, A.A.; Exbrayat, J.-F.; Van Der Velde, I.R.; Feng, L.; Williams, M. The Decadal State of the Terrestrial Carbon Cycle: Global Retrievals of Terrestrial Carbon Allocation, Pools, and Residence Times. Proc. Natl. Acad. Sci. USA 2016, 113, 1285–1290. [Google Scholar] [CrossRef] [PubMed]
  73. Zhang, J.; Hao, X.; Hao, H.; Fan, X.; Li, Y. Climate Change Decreased Net Ecosystem Productivity in the Arid Region of Central Asia. Remote Sens. 2021, 13, 4449. [Google Scholar] [CrossRef]
  74. Yang, Y.; Ma, Y.; Jiang, H.; Zhu, Q.; Liu, J.; Peng, C. Evaluating the Carbon Budget Pattern of Chinese Terrestrial Ecosystem from 1960 to 2006 Using Integrated Biosphere Simulator. Acta Ecol. Sin. 2016, 36, 3911–3922. [Google Scholar] [CrossRef]
  75. Zeng, J.; Zhou, T.; Wang, Q.; Xu, Y.; Lin, Q.; Zhang, Y.; Wu, X.; Zhang, J.; Liu, X. Spatial Patterns of China’s Carbon Sinks Estimated from the Fusion of Remote Sensing and Field-Observed Net Primary Productivity and Heterotrophic Respiration. Ecol. Inf. 2023, 76, 102152. [Google Scholar] [CrossRef]
  76. Friedlingstein, P.; O’sullivan, M.; Jones, M.W.; Andrew, R.M.; Gregor, L.; Hauck, J.; Le Quéré, C.; Luijkx, I.T.; Olsen, A.; Peters, G.P. Global Carbon Budget 2022. Earth Syst. Sci. Data 2022, 14, 4811–4900. [Google Scholar] [CrossRef]
  77. Liu, S.; Yang, Y.; Shen, H.; Hu, H.; Zhao, X.; Li, H.; Liu, T.; Fang, J. No Significant Changes in Topsoil Carbon in the Grasslands of Northern China between the 1980s and 2000s. Sci. Total Environ. 2018, 624, 1478–1487. [Google Scholar] [CrossRef]
  78. Wang, J.; Feng, L.; Palmer, P.I.; Liu, Y.; Fang, S.; Bösch, H.; O’Dell, C.W.; Tang, X.; Yang, D.; Liu, L.; et al. Large Chinese Land Carbon Sink Estimated from Atmospheric Carbon Dioxide Data. Nature 2020, 586, 720–723. [Google Scholar] [CrossRef]
  79. Shi, Y.; Zhang, B.; Liang, L.; Wang, S.; Zhang, H.; Sun, H.; Han, X. Unfolding the Effectiveness of Ecological Restoration Programs in Enhancing Vegetation Carbon Sinks across Different Climate Zones in China. Resour. Conserv. Recycl. 2025, 212, 107974. [Google Scholar] [CrossRef]
  80. Yue, C.; Xu, M.; Ciais, P.; Tao, S.; Shen, H.; Chang, J.; Li, W.; Deng, L.; He, J.; Leng, Y.; et al. Contributions of Ecological Restoration Policies to China’s Land Carbon Balance. Nat. Commun. 2024, 15, 9708. [Google Scholar] [CrossRef]
  81. Li, J. A Simulation Approach to Optimizing the Vegetation Covers under the Water Constraint in the Yellow River Basin. Policy Econ. 2021, 123, 102377. [Google Scholar] [CrossRef]
  82. Zhang, X.M.; Brandt, M.; Yue, Y.M.; Tong, X.W.; Wang, K.L.; Fensholt, R. The Carbon Sink Potential of Southern China after Two Decades of Afforestation. Earths Future 2022, 10, e2022EF002674. [Google Scholar] [CrossRef]
  83. Zhang, Y.; Zhao, Y.; Chen, Q.; Zhu, Y.; Liu, B.; Zhang, X.; Yin, X. Capacity of Forests and Grasslands to Achieve Carbon Neutrality in China. Forests 2024, 15, 1060. [Google Scholar] [CrossRef]
  84. Piao, S.; Fang, J.; He, J. Variations in Vegetation Net Primary Production in the Qinghai-Xizang Plateau, China, from 1982 to 1999. Clim. Change 2006, 74, 253–267. [Google Scholar] [CrossRef]
  85. Rap, A.; Scott, C.E.; Reddington, C.L.; Mercado, L.; Ellis, R.J.; Garraway, S.; Evans, M.J.; Beerling, D.J.; MacKenzie, A.R.; Hewitt, C.N.; et al. Enhanced Global Primary Production by Biogenic Aerosol via Diffuse Radiation Fertilization. Nat. Geosci. 2018, 11, 640–644. [Google Scholar] [CrossRef]
  86. Zhang, X.; Zhou, Y.; He, W.; Ju, W.; Liu, Y.; Bi, W.; Cheng, N.; Wei, X. Land Cover Change Instead of Solar Radiation Change Dominates the Forest GPP Increase during the Recent Phase of the Shelterbelt Program for Pearl River. Ecol. Indic. 2022, 136, 108664. [Google Scholar] [CrossRef]
  87. Sun, Z.; Wang, X.; Yamamoto, H.; Tani, H.; Zhong, G.; Yin, S.; Guo, E. Spatial Pattern of GPP Variations in Terrestrial Ecosystems and Its Drivers: Climatic Factors, CO2 Concentration and Land-Cover Change, 1982–2015. Ecol. Inf. 2018, 46, 156–165. [Google Scholar] [CrossRef]
  88. Ye, X.; Liu, F.; Zhang, Z.; Xu, C.; Liu, J. Spatio-Temporal Variations of Vegetation Carbon Use Efficiency and Potential Driving Meteorological Factors in the Yangtze River Basin. J. Mt. Sci. 2020, 17, 1959–1973. [Google Scholar] [CrossRef]
  89. Xie, S.; Mo, X.; Hu, S.; Liu, S. Contributions of Climate Change, Elevated Atmospheric CO2 and Human Activities to ET and GPP Trends in the Three-North Region of China. Agric. Meteorol. 2020, 295, 108183. [Google Scholar] [CrossRef]
  90. Keenan, T.F.; Gray, J.; Friedl, M.A.; Toomey, M.; Bohrer, G.; Hollinger, D.Y.; Munger, J.W.; O’Keefe, J.; Schmid, H.P.; Wing, I.S.; et al. Net Carbon Uptake Has Increased through Warming-Induced Changes in Temperate Forest Phenology. Nat. Clim. Change 2014, 4, 598–604. [Google Scholar] [CrossRef]
  91. Piao, S.; Sitch, S.; Ciais, P.; Friedlingstein, P.; Peylin, P.; Wang, X.; Ahlström, A.; Anav, A.; Canadell, J.G.; Cong, N. Evaluation of Terrestrial Carbon Cycle Models for Their Response to Climate Variability and to CO2 Trends. Glob. Change Biol. 2013, 19, 2117–2132. [Google Scholar] [CrossRef] [PubMed]
  92. Wang, T.; Fan, G.; Zhang, H.; Shen, X. Temporal and Spatial Variability of Ground Frost Indices in Northeast China. Atmosphere 2024, 15, 817. [Google Scholar] [CrossRef]
  93. Zhou, Y.; Wei, X.; Wang, Y.; He, W.; Dong, Z.; Zhang, X.; Liu, Y.; Nguyen, N.T.; Ju, W. Solar Radiation Variation Weakened the Boost of Gross Primary Production by Vegetation Restoration in China’s Most Forestry Engineering Areas during 2001–2020. Environ. Res. Lett. 2024, 19, 014082. [Google Scholar] [CrossRef]
  94. Wang, Y.; Guo, C.; Chen, X.; Jia, L.; Guo, X.; Chen, R.; Zhang, M.; Chen, Z.; Wang, H. Carbon Peak and Carbon Neutrality in China: Goals, Implementation Path and Prospects. China Geol. 2021, 4, 720–746. [Google Scholar] [CrossRef]
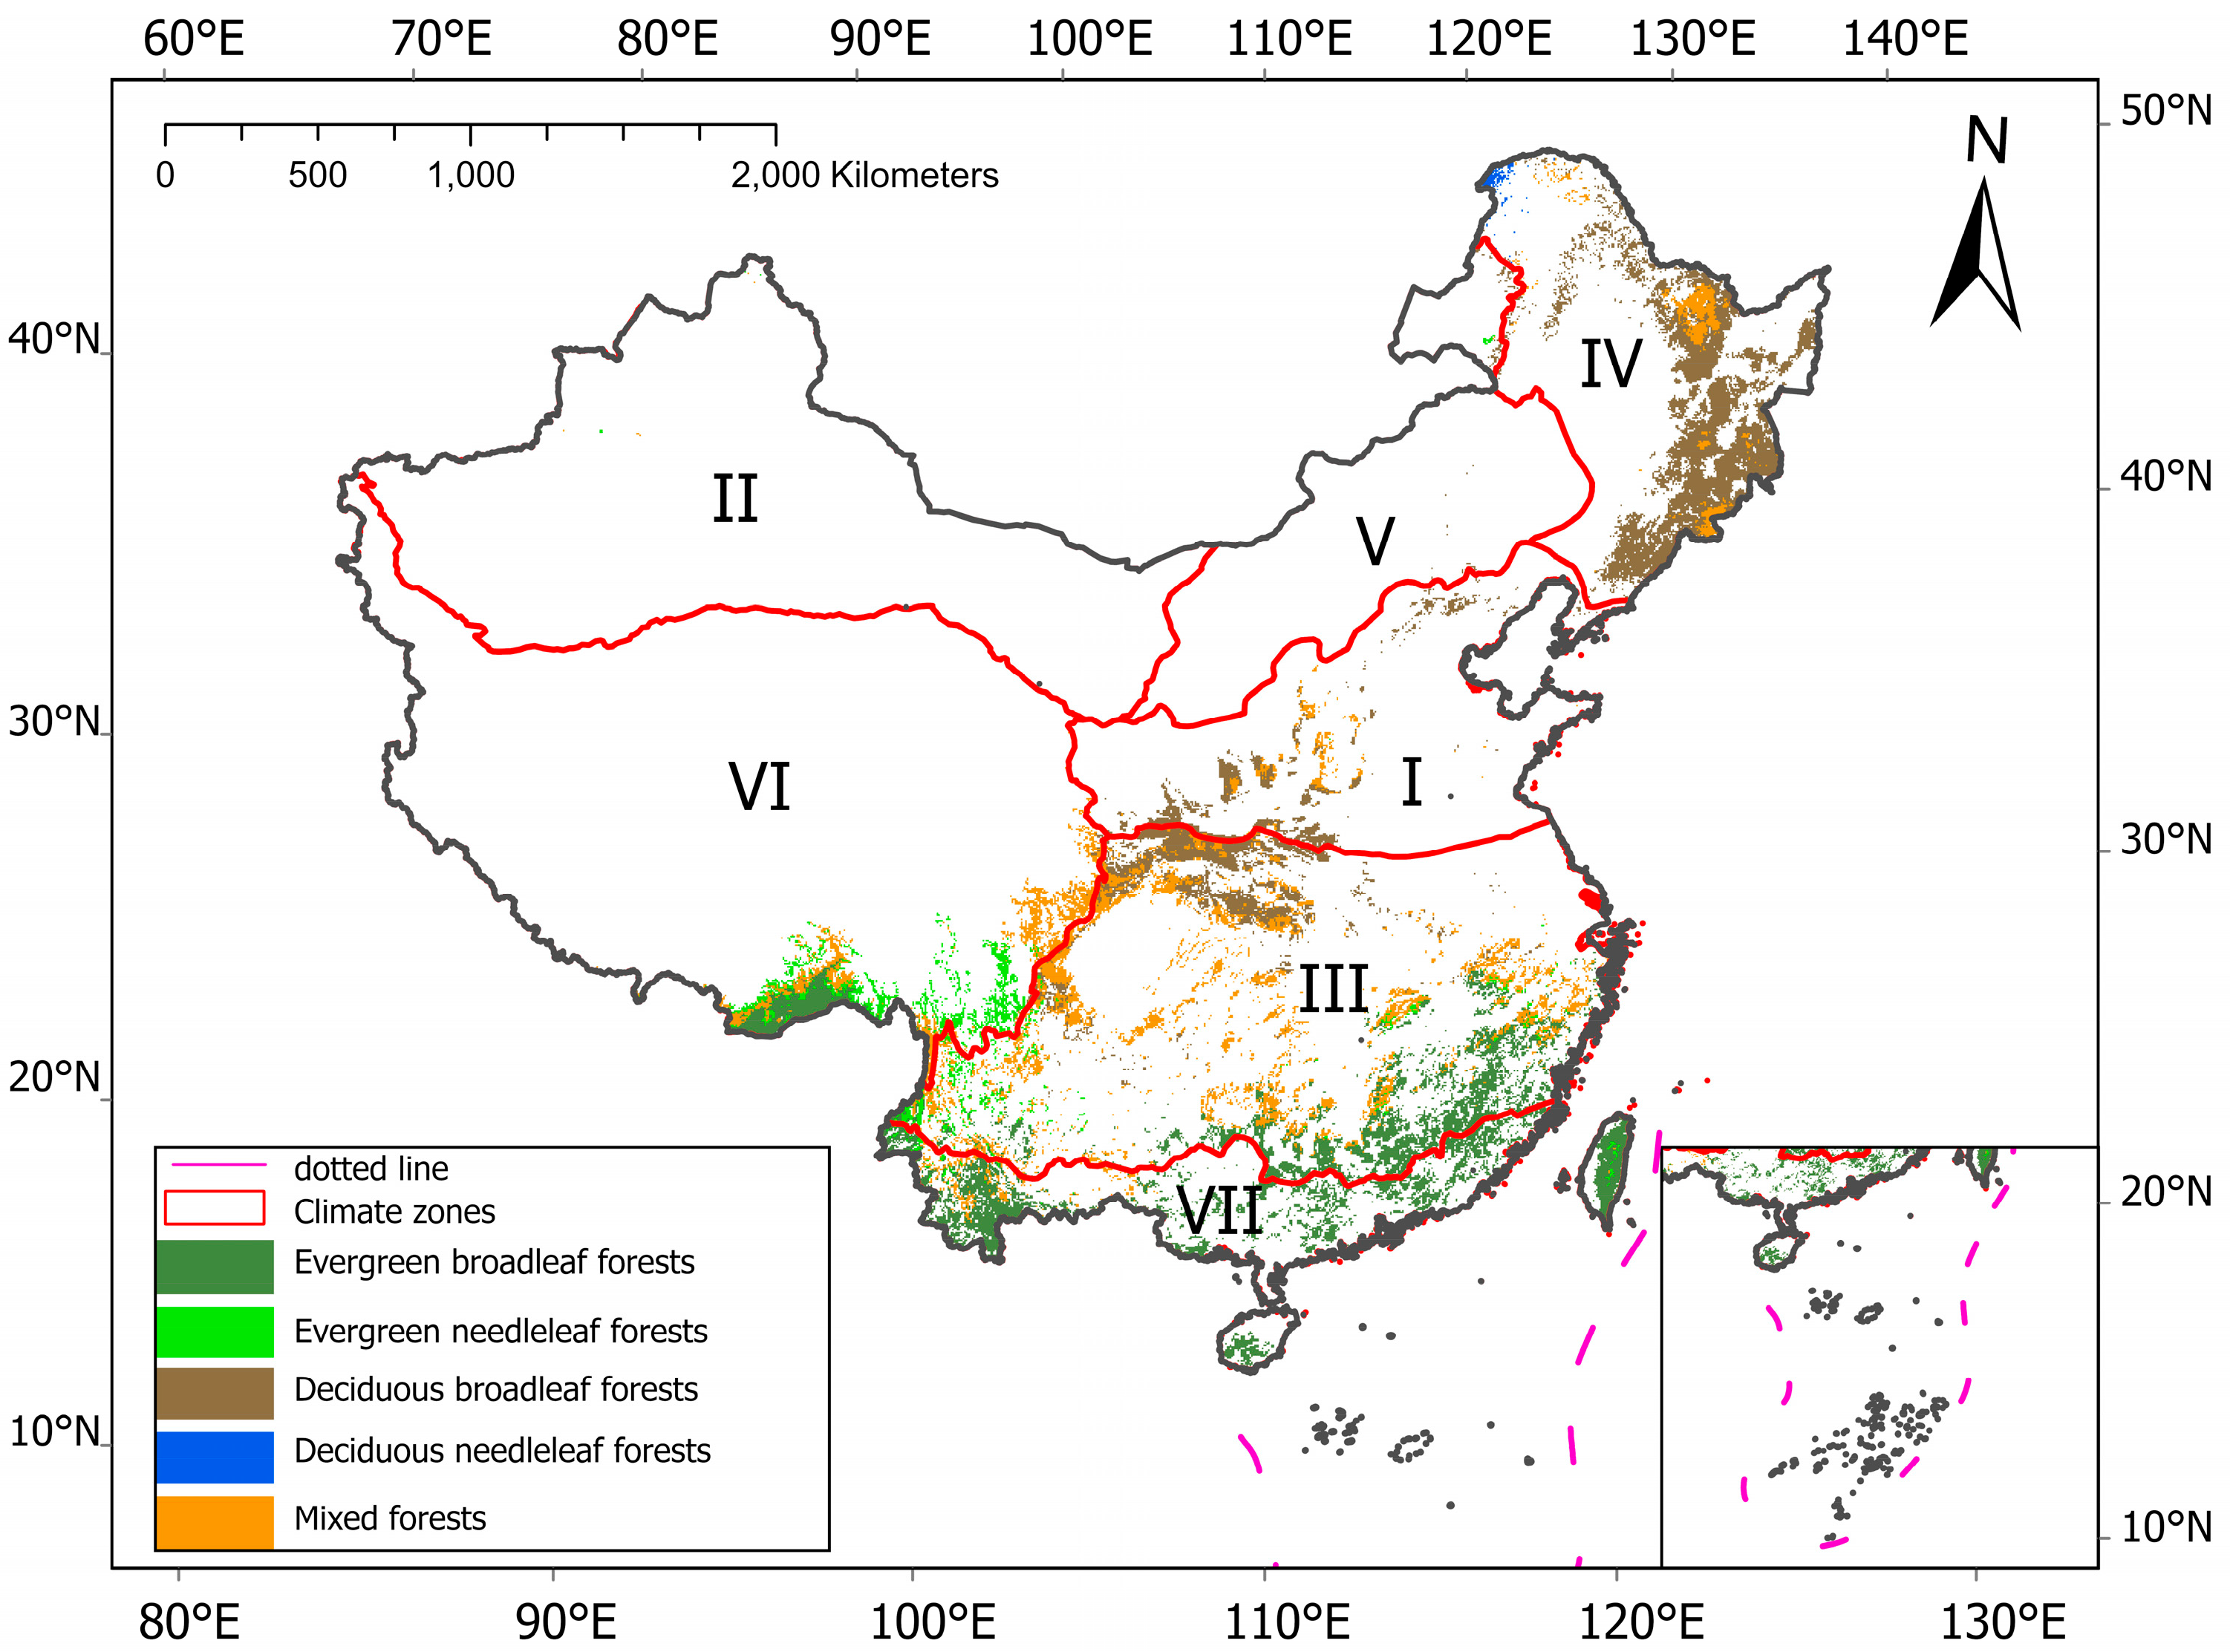
Figure 1. Forest Cover in China and Climate Zones Map.
Forests 16 01398 g001
Figure 2. Validation of the NPP results.
Forests 16 01398 g002
Figure 3. Validation of the soil heterotrophic respiration results.
Forests 16 01398 g003
Figure 4. Spatial distribution of NEP in 2013, 2018, and 2023.
Forests 16 01398 g004
Figure 5. Annual NEP of each forest type.
Forests 16 01398 g005
Figure 6. (a) NEP contribution by climatic regions; (b) annual NEP of each climatic region.
Forests 16 01398 g006
Figure 7. Average annual NEP of forest in China during 2013–2023.
Forests 16 01398 g007
Figure 8. Results of geographical detector model. (a) Factor detector; (b) interaction detector.
Forests 16 01398 g008
Figure 9. Factor detector results for climatic regions in China.
Forests 16 01398 g009
Table 1. Average annual NPP comparison between this study, MODIS NPP, and other findings.
Forest Type
EBFENFMixedDBFDNF
This study1114.22
(256.74–1518.63)
863.92
(176.20–1304.74)
837.92
(6.82–1417.33)
733.07
(340.69–1368.23)
448.08
(287.06–491.58)
MOD17A3HGF.061 [34]1087.83
(211.86–1913.64)
813.84
(48.19–1860.58)
752.49
(60.6–1846.42)
631.08
(117.56–1509.74)
508.23
(354.73–613.15)
Ji et al., 2020 [64]1058
(942–1211)
934
(851–1053)
860
(790–960)
759
(699–810)
590
(568–618)
Zhu et al., 2007 [68]986
(407–1913)
367
(179–806)
257–1098643
(114–1669)
439
(179–824)
Liang et al., 2023 [69]893.00948.90530.10495.70352.70
Mao et al., 2010 [67]891510-743546
Disclaimer/Publisher’s Note: The statements, opinions and data contained in all publications are solely those of the individual author(s) and contributor(s) and not of MDPI and/or the editor(s). MDPI and/or the editor(s) disclaim responsibility for any injury to people or property resulting from any ideas, methods, instructions or products referred to in the content.