Article

Study on Historical Vegetation Dynamics in the Artificial Forest Area of Bashang, China: Implications for Modern Ecological Restoration

1
Experiment and Practice Teaching Center, Hebei GEO University, Shijiazhuang 050031, China
2
College of Earth Sciences, Hebei GEO University, Shijiazhuang 050031, China
3
National Center of Comprehensive Natural Resources Survey, China Geological Survey, Beijing 100055, China
*
Authors to whom correspondence should be addressed.
Forests 2025, 16(9), 1392; https://doi.org/10.3390/f16091392
Submission received: 2 July 2025 / Revised: 20 August 2025 / Accepted: 26 August 2025 / Published: 1 September 2025
(This article belongs to the Section Forest Ecology and Management)

Abstract

In recent years, China has invested substantial funds in ecological restoration, achieving significant accomplishments. The forest coverage rate in the Chengde Bashang area, located in the transitional zone between the monsoon and non-monsoon regions, has now reached 82%. However, the area has also encountered a series of environmental issues, including lake shrinkage, soil salinization, and large-scale die-offs of planted forests. Whether the forests in this region can achieve sustainable development in the future, and whether ecological restoration should prioritize tree planting or grass cultivation, are critical questions that require attention. By studying the historical vegetation dynamics in afforested areas, we can better understand the relationship between climatic environmental changes and vegetation, providing baseline data for future ecological restoration. This study utilized AMS 14C dates to establish a chronological framework for the core and employed pollen to investigate vegetation dynamics over the past 5000 years in the artificial Larix Mill. forest area. The vegetation and environmental history of this core can be divided into three zones: Zone 1 (5100–4100 a B.P.): vegetation was dominated by pine and spores, with low herbaceous pollen content. Zone 2 (4100–1400 a B.P.): vegetation was primarily herbaceous. Zone 3 (1400 a B.P.–present): arboreal pollen content increased slightly, but herbaceous plants remained dominant. This period included the warm–dry Medieval Warm Period (1400–900 a B.P.), the cold–humid Little Ice Age (900–300 a B.P.), and the recent 300 years of anthropogenic disturbance. Notably, the large-scale afforestation efforts in recent decades are clearly reflected in the profile. A comparative analysis of records from the monsoon–non-monsoon transition zone reveals that, except for Angulinao Lake, other records were dominated by herbaceous vegetation over the past 2000 years. Additionally, the Mu Us Sandy Land, Hunshandake Sandy Land, Hulunbuir Sandy Land, and Horqin Sandy Land in China have experienced aeolian sand accumulation over the same period. Given the anticipated warming–desiccation trend, phytoremediation strategies should favor xerophytic shrubs and herbaceous over monospecific forest plantations.

1. Introduction

Since the 18th National Congress of the Communist Party of China, ecological civilization construction has become a vital component of national development. In recent years, China has invested substantial funds in ecological restoration, achieving significant milestones in ecological and environmental protection. For instance, the forest coverage rate in the Bashang region of Chengde—located in the transitional zone between monsoon and non-monsoon climates—has now reached 82%. However, the area also faces a series of environmental challenges, including lake shrinkage [1], seasonal drought-induced dry layers, which are observed in forest and grassland soils [2], soil salinization [3], and large-scale degradation or die-off of plantation forests [2]. Anguli Nur, the largest lake in the Bashang region, began to shrink gradually in 2000 and had almost completely dried up by August 2004. After briefly holding water again in 2005, it dried up once more in 2006 and 2007 [4]. Currently, the area has been converted into an artificial grassland oasis. The Moon Lake area decreased from 0.43 km2 in 1993 to 0.03 km2 in 2018 [1]. In the Bashang region of Zhangjiakou, the artificial forest Populus simonii has shown significant signs of degradation, with degraded areas accounting for 4/5 of the total area [5]. A study by Xiao revealed that from 2010 to 2018, the degraded area of plantation forests in the undulating plateau of Zhangbei Bashang reached 70,000 mu (approximately 4667 hectares) [6].
Many studies have been conducted on the vegetation dynamics in the Bashang region. In recent decades, vegetation changes were primarily investigated using fixed-point observations and remote sensing techniques. Sun et al. utilized the MODIS NDVI index to study vegetation changes in the Bashang region from 2000 to 2012, revealing that 22.97% of the area experienced vegetation degradation [7]. Su et al. examined vegetation changes in the Bashang region from 2005 to 2015, finding that 38.67% of the area was potentially degraded, while 1.04% exhibited continuous degradation [8]. Long-term vegetation dynamics research mainly focused on lake areas [9,10] and grassland vegetation dynamics [11], with limited studies on artificial forests. And there has been little research on the historical vegetation dynamics of Larix forests in the Bashang region.
In historical ecology, palynology is usually used to reveal long-term vegetation dynamics, climate change, biodiversity and human activities. Penny et al. [12] used pollen data to trace 8000 years of vegetation change, revealing the impacts of climate, land use, and shifts in woodland extent on the taxonomic, functional, and phylogenetic diversity of plants. Liu [13] employed pollen records to reconstruct the evolution of East Asian summer monsoon precipitation since 14 ka BP. Zhao studied plant diversity on the Chinese Loess Plateau [14]. Pollen data and other data were used by Schwörer to quantify the impact of early humans on mountain forest dynamics in the Alps [15]. In restoration ecology, palynology provides baseline targets and scientific evidence for ecological restoration, guiding vegetation recovery and landscape management. Jiang et al. studied the vegetation of Chinese Loess Plateau since the Last Glacial Maximum and proposed that herbs should be considered a priority in ecological restoration [16].
According to the Intergovernmental Panel on Climate Change (IPCC) report, the Earth’s average temperature has risen by 1.1 °C over the past century, and it is projected to increase by 2.5–4 °C by 2100 [17]. This raises concerns about whether the forests in this region can achieve sustainable development in the future, as well as whether afforestation or grassland restoration should be prioritized in ecological rehabilitation efforts. By studying the historical vegetation dynamics in plantation areas, we can better understand the relationship between climatic–environmental changes and vegetation, providing baseline data for future ecological restoration. This paper aims to investigate the vegetation dynamics of Larix forests over the past 5000 years, offering foundational data and restoration recommendations for future ecological rehabilitation efforts.

2. Materials and Methods

2.1. Site Description

The research area is located in the northwestern part of Weichang County, Chengde City, Hebei Province (Figure 1). The sampling site (Y1) is located at the Moon lakeside planted larch plantations (Larix spp.) (117.378660616 E, 42.351869198 N). This region has a continental monsoon climate. According to long-term meteorological data from the Saihanba station, the average temperature in January is −21.77 °C, while in July, it is 16.29 °C. Annual precipitation ranges between 260 and 653 mm. However, the potential evapotranspiration is over 850 mm. Geomorphologically, the area lies at the convergence zone between the southeastern edge of the Inner Mongolia Plateau and the mountainous region of northwestern Hebei. The study site’s surrounding vegetation is dominated by five association according to the Braun–Blanquet classification [18]:
One is the artificial coniferous forest association (Ass. Picea spp.—Larix spp.), with diagnostic species being Picea spp. and Larix principis-rupprechtii. These were primarily planted during afforestation projects after the 1960s. This association is characterized by high canopy closure in most stands, leading to shrub and herb layers being typically absent. However, in areas with lower canopy closure, the following species can be observed. Preferential species: Spiraea salicifolia and Potentilla fruticose. Selective species: Carex spp., Viola philippica, and Polygonatum odoratum. Accidental species: Thymus mongolicus, Limonium bicolor, and Taraxacum mongolicum. Occasional species: Iris lactea, Vicia sepium and Plantago asiatica. Species composition varying significantly depending on canopy density and management history.
The secondary birch-aspen forest association (Ass. Betula platyphyllaPopulus davidiana) is characterized by the following species composition. Diagnostic species: dominant species—Betula platyphylla; subdominant species—Populus davidiana. Preferential species: Corylys mandshurica and Viola philippica. Selective species: Quercus mongolica and Spiraea spp. Companion species: Thymus mongolicus and Limonium bicolor.
The wetland herbaceous community exhibits the following characteristic species composition. Diagnostic species: Phragmites australis and Typha spp. Preferential species: Cyperus spp., Carex spp. and Iris spp. Selective species: Polygonum spp. and Juncus effusus. Companion species: Echinochloa crus-galli and Oenanthe javanica. Accidental species: Drosera spp. and Lemna minor.
The shrub-steppe community demonstrates the following characteristic species composition. Diagnostic species: Caragana spp., Potentilla fruticose. Preferential species: Hippophae rhamnoides, Artemisia frigida. Selective species: Leymus chinensis, Stipa spp. Companion species: Thymus mongolicus, Limonium bicolor. Occasional species: Taraxacum mongolicum, Iris lacteal.
The Mongolian oak-Siberian apricot open-woodland community exhibits the following floristic composition. Diagnostic species: Quercus mongolica, Armeniaca sibirica. Preferential species: Ostryopsis davidiana, Rhododendron micranthum. Selective species: Stipa grandis, Thymus mongolicus. Companion species: Limonium bicolor, Artemisia frigida. Occasional species: Hippophae rhamnoides, Carex spp.

2.2. Materials and Experimental Design

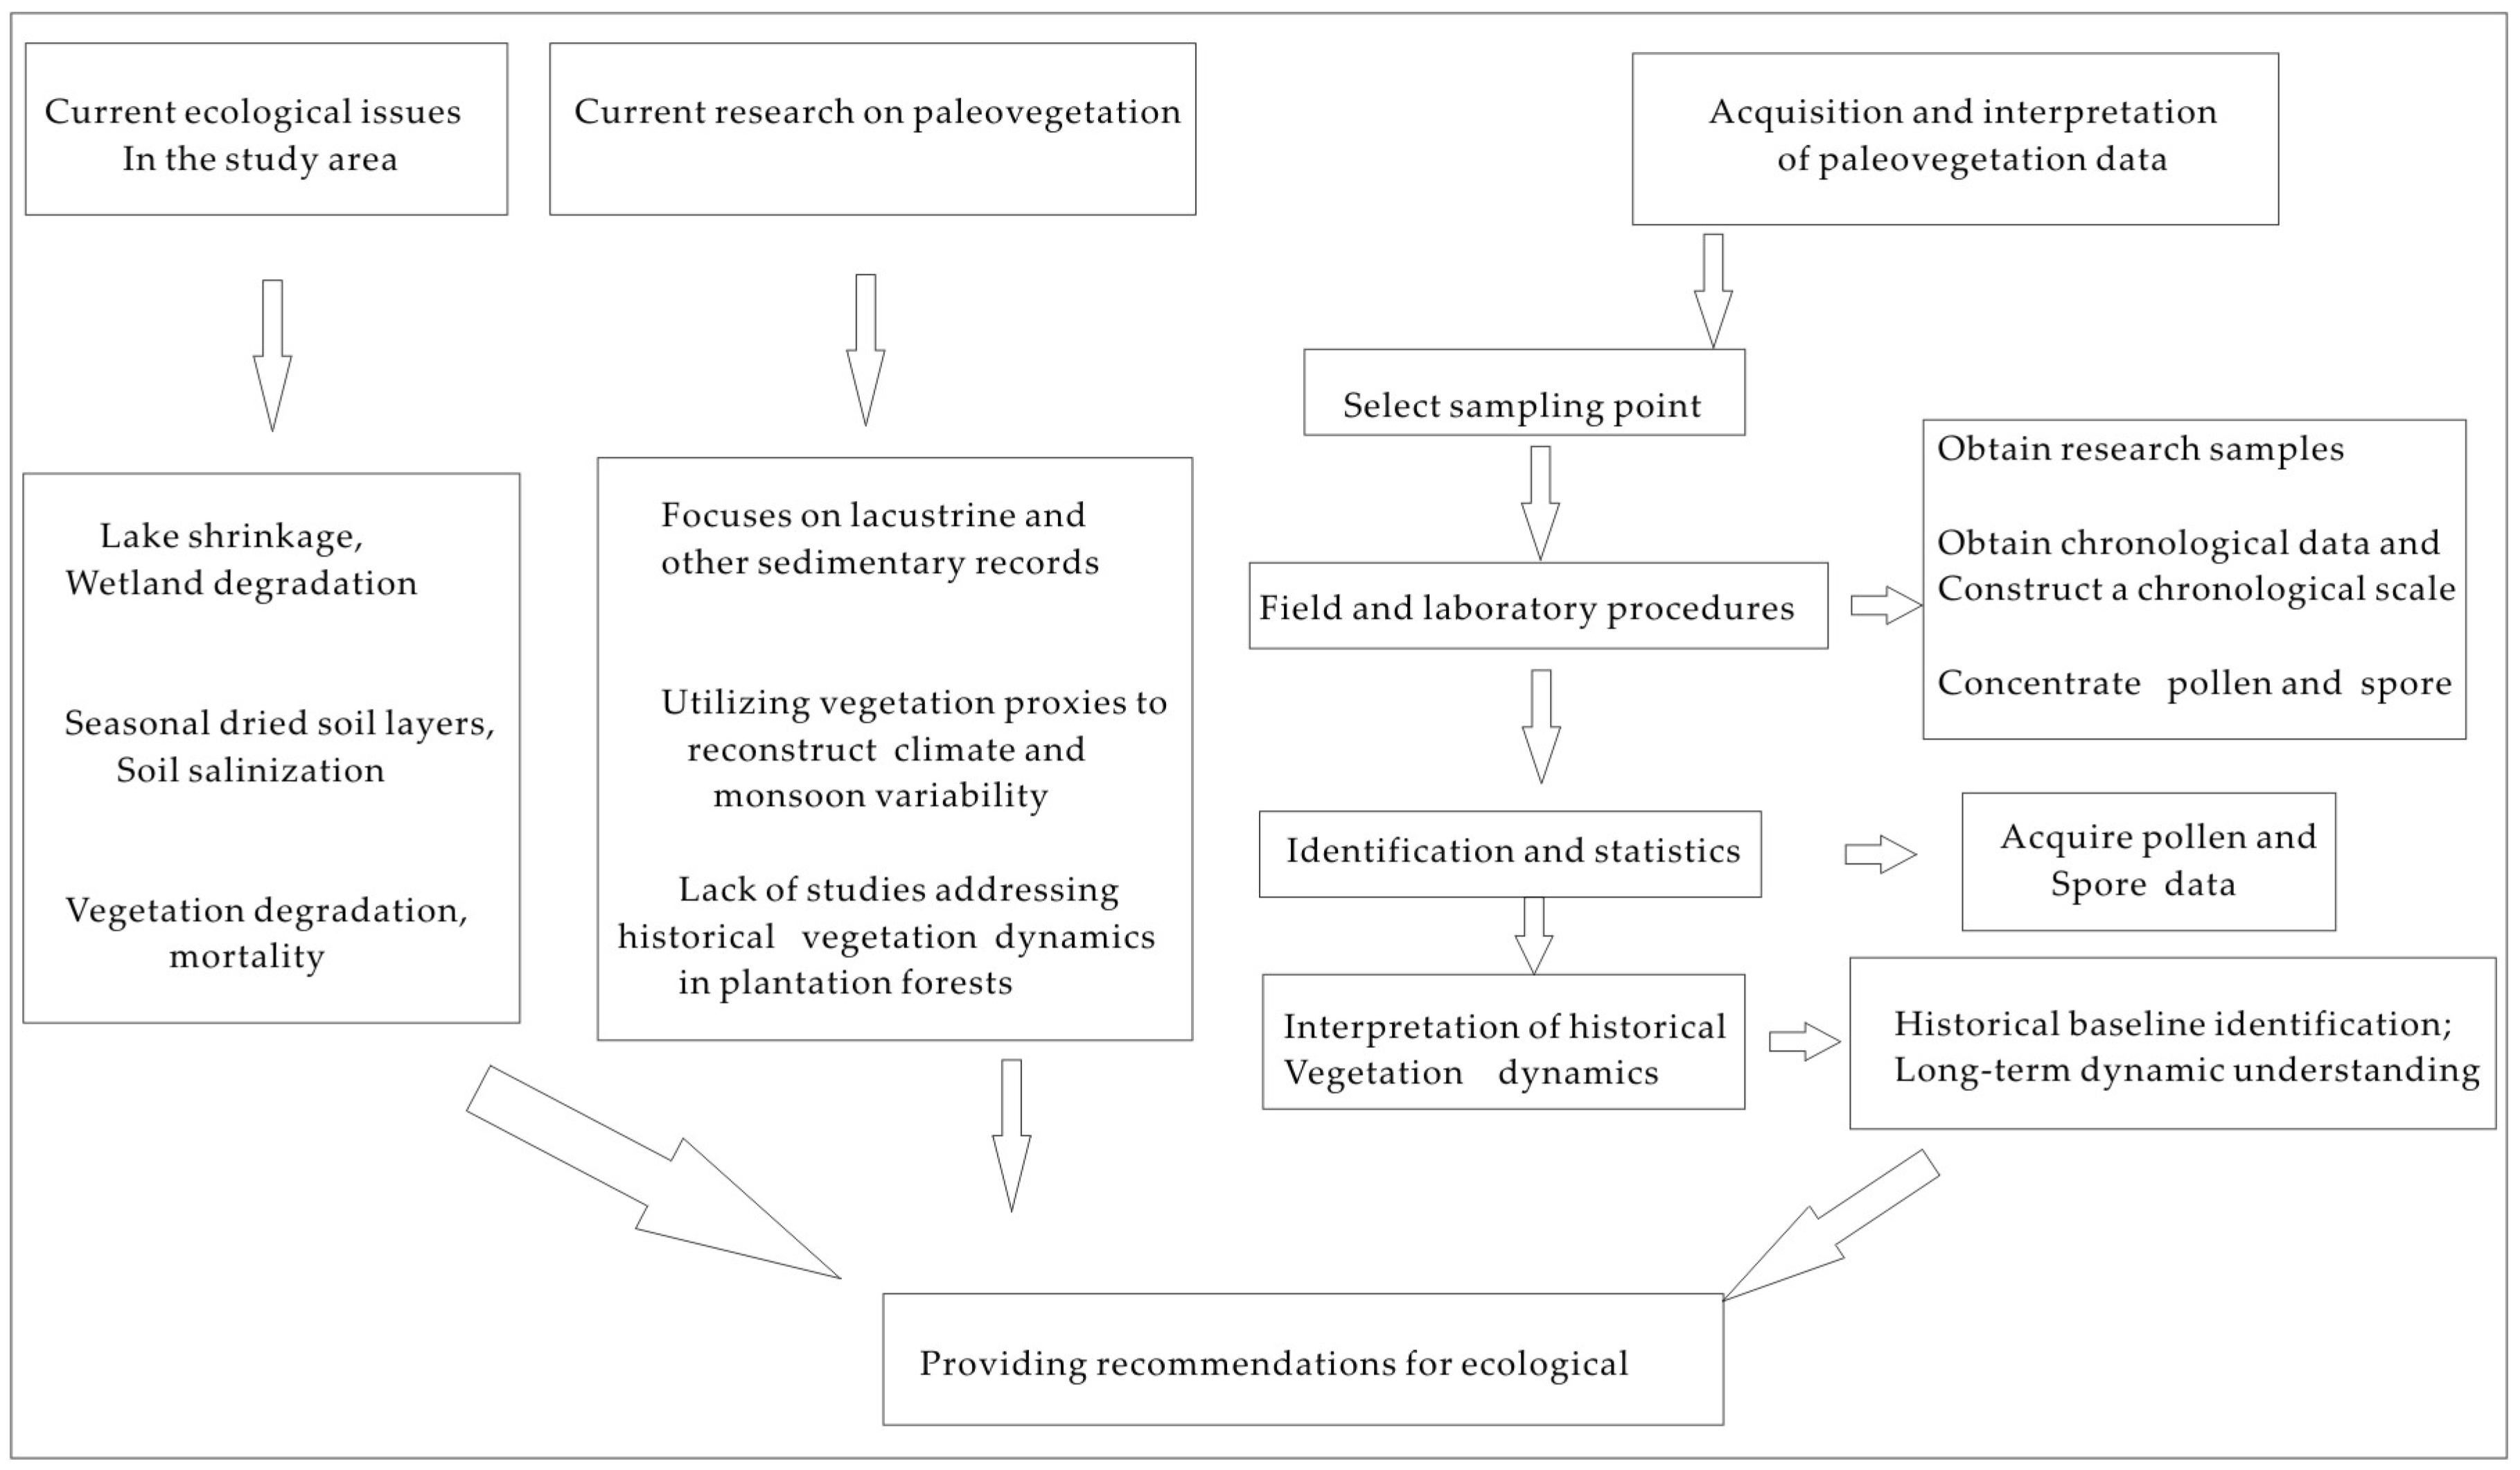
The overall research process is illustrated in Figure 2. The drilling samples collected from the plantation forest area were for palynological analyses. The samples were air-dried, and 5 g of each sample was taken for pollen extraction. One Lycopodium tablet was added as a tracer and to calculate the concentration. The pollen was then extracted using the HCl–NaOH–HF method [19], with each step followed by washing with distilled water until neutrality. After sieving and heavy liquid separation, the residue was treated with a 9:1 mixture of acetic anhydride and concentrated sulfuric acid for 5 min under heating, rinsed to neutrality, and preserved in a 1:1 glycerol solution for subsequent identification. Slides were prepared and identification was carried out under a Nikon microscope at 400× g magnification. Most samples were counted over 300 grains, while individual samples were identified to a minimum of over 200 grains. Identification was conducted with reference to previous palynological atlases [20] and the laboratory’s own reference collection. Pollen experiments were conducted at the Palynology Laboratory of Hebei GEO University. Pollen diagrams were constructed using Tilia software1.7.16 [21]. CONISS was used for constraint cluster analysis [22]. The core chronology was determined through radiocarbon dating at Beta Analytic Laboratory (USA), with age–depth modeling performed in R version 4.5.0 [23] using Bayesian interpolation methods.

3. Results

3.1. Chronology

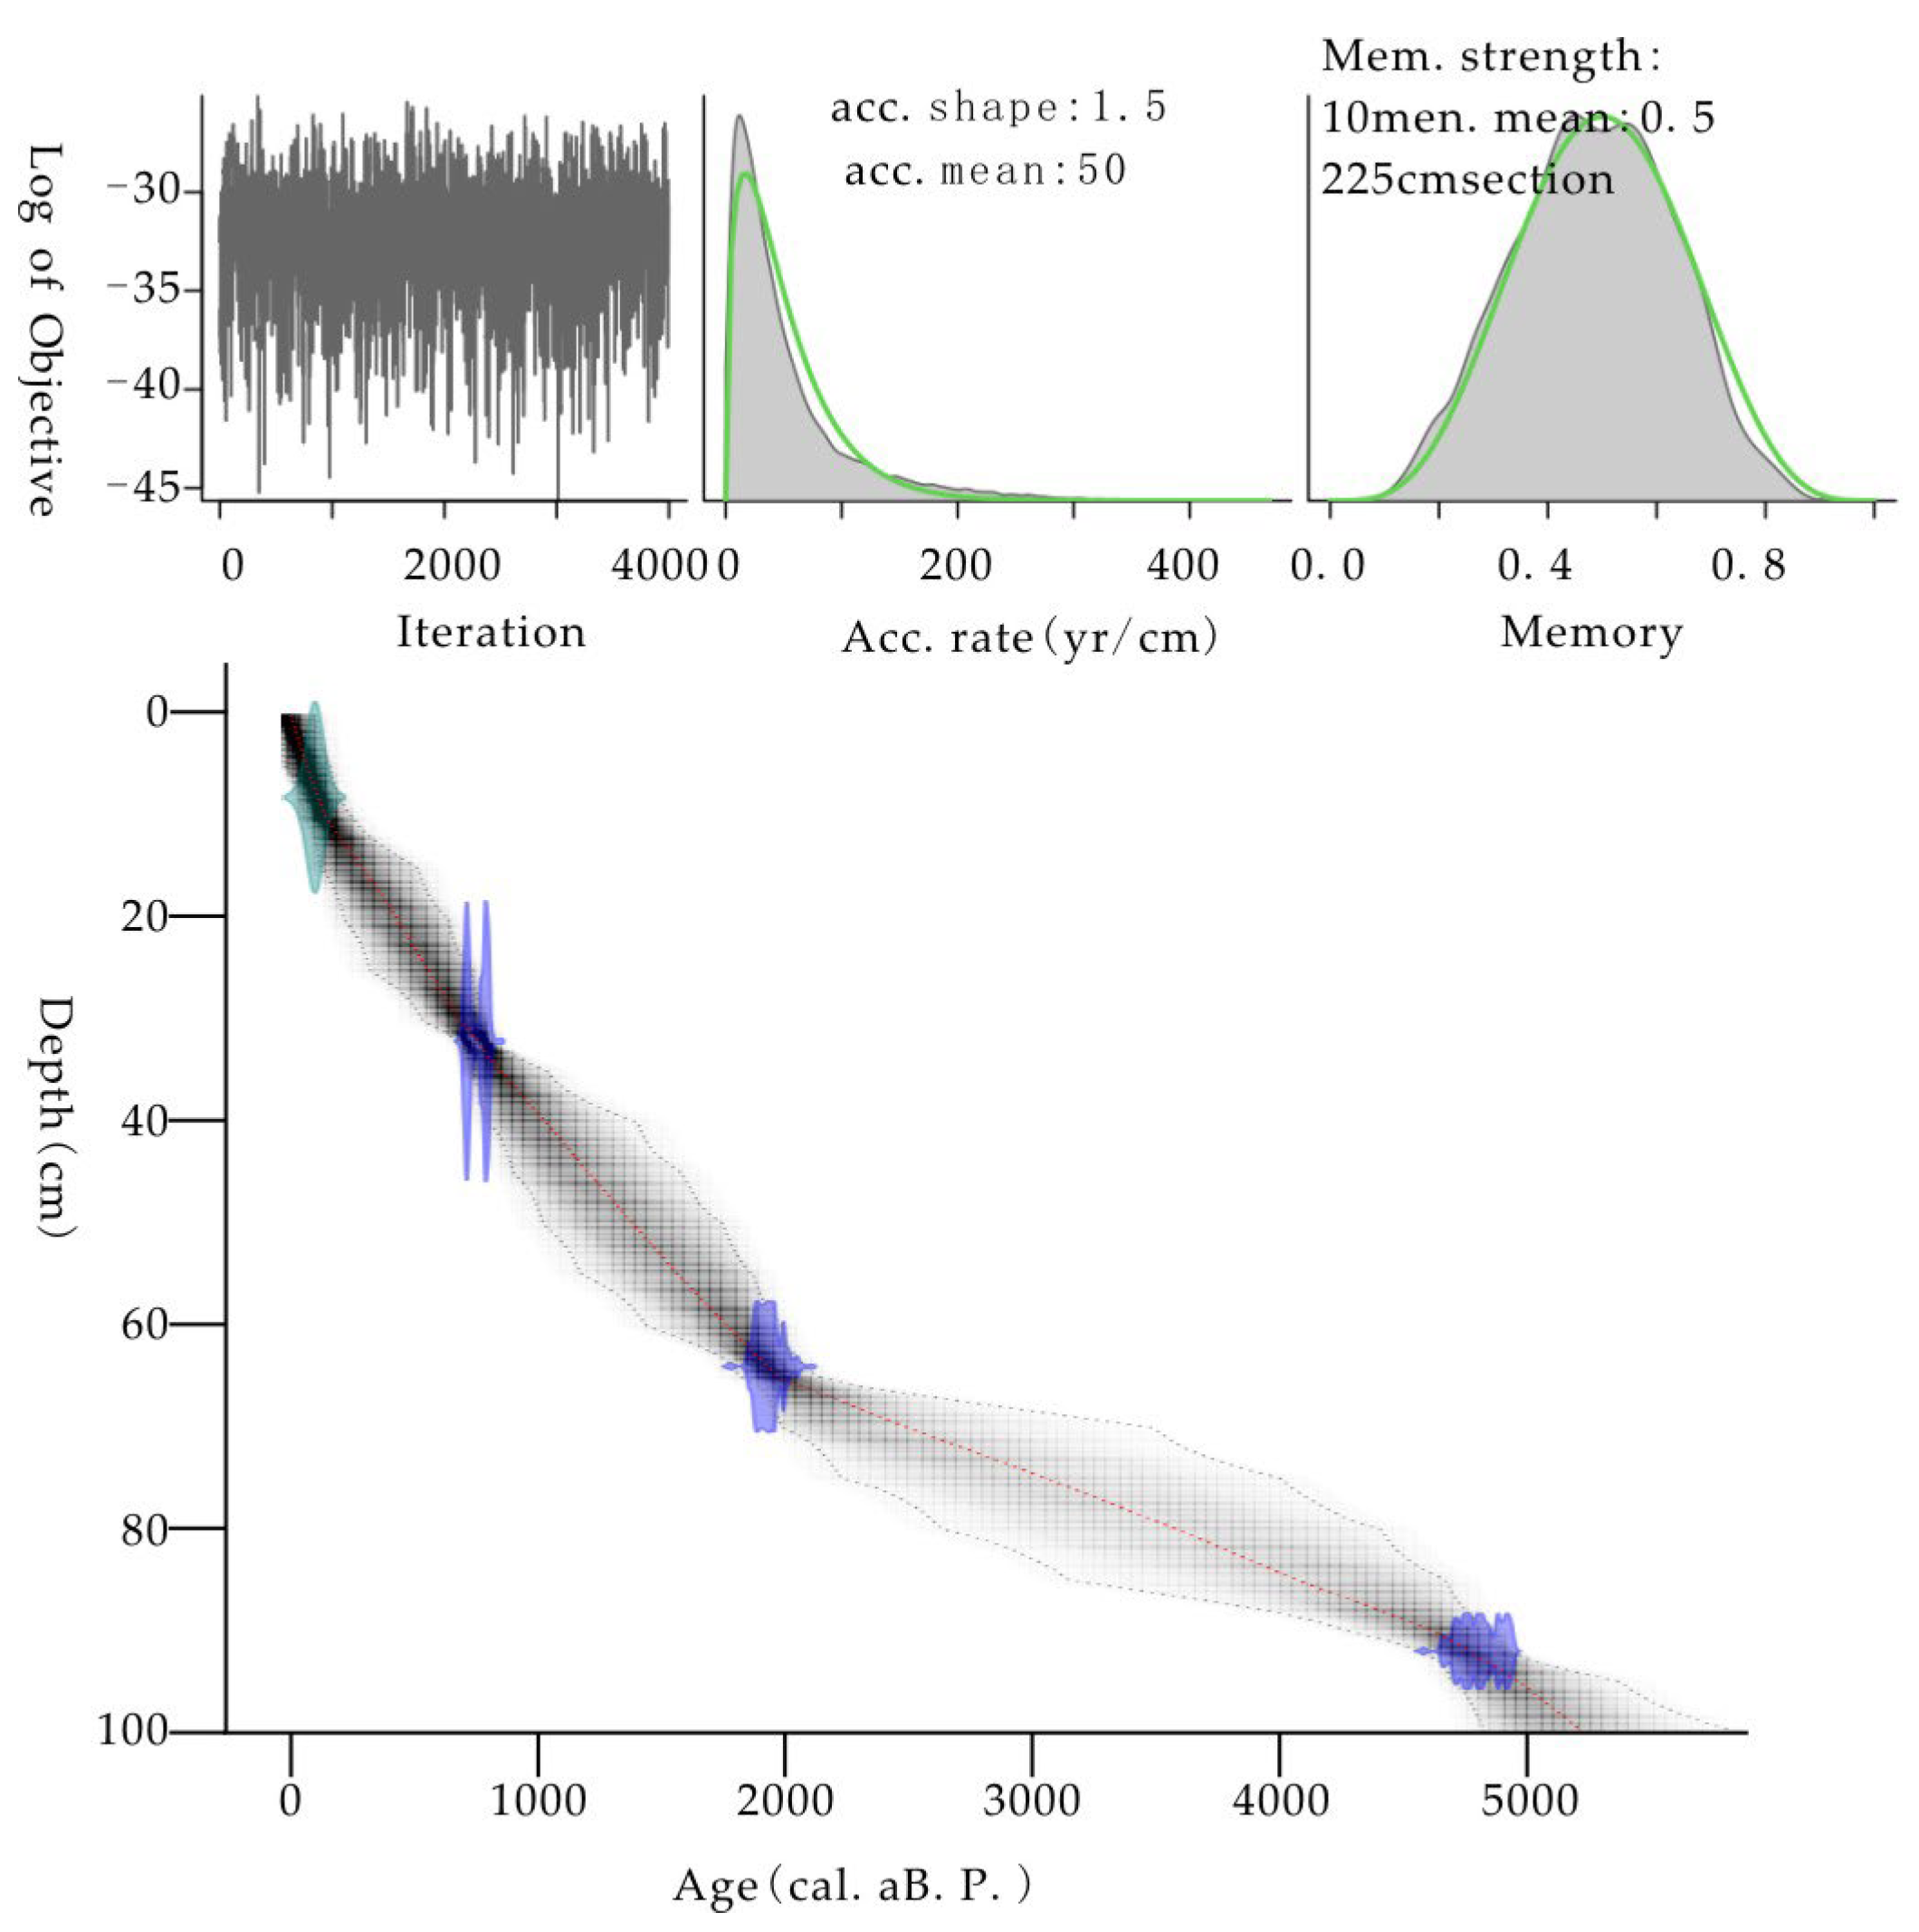
The AMS 14C data are listed in Table 1. The chronology of the core was calibrated to calendar years using INTCAL20 [24]. After Bayesian interpolation, a depth–age model for the section was obtained (Figure 3). The age of the bottom is estimated to be approximately 5000 cal. a B.P.

3.2. Palynological Results

A total of 40 palynomorph types were identified in the profile. Taxa with percentages greater than 1% are listed separately in the diagram, while those below 1% are grouped as “Others”. Based on the age–depth model, the pollen zones can be divided into three main zones (Figure 4):
Zone 1 (5100–4650 a B.P.)
This is a zone dominated by Pinus L. and monolete spores. In this zone, the arboreal pollen (AP) shows that Pinus initially had low percentages before reaching its peak, while deciduous broadleaved components such as Quercus L. and Betula L. were high at first but later declined. Among the herbaceous plants, Artemisia L. was high initially but decreased later, and Poaceae was relatively abundant in this stage, though it represents one of the lower phases in the entire profile. Spores, including monolete and trilete types, reached their highest percentages in this zone.
Zone 2 (4650–1400 a B.P.)
This is a zone dominated by Artemisia, Chenopodiaceae, small Poaceae, Cyperaceae, Aster-type, and monolete spores. This zone can be further subdivided into three subzones:
Subzone 2-1 (4650–4100 a B.P.): Compared with Zone 1, this subzone shows a decrease in arboreal and shrub pollen percentages, as well as a decline in spore content, while herbaceous pollen increases significantly. Among the arboreal taxa, Pinus decreases notably. Among shrubs, Ephedra L. remains relatively stable, while Elaeagnus L. decreases. Among herbs, Artemisia, small Poaceae, and Fabaceae are abundant, while Aster-type, large Poaceae, Polygonaceae, Caryophyllaceae, and Ranunculaceae increase. Cyperaceae is less abundant, and spore content is slightly lower than in the previous zone.
Subzone 2-2 (4100–2000 a B.P.): Compared with Subzone 2-1, arboreal pollen and spore content decrease, while herbaceous pollen increases. Among shrubs, Ephedra increases. Herbs are still dominated by Artemisia, Chenopodiaceae, small Poaceae, Cyperaceae, and Aster-type, with small Poaceae and Cyperaceae showing significant increases. Aster-type and Caryophyllaceae are low at the base but increase toward the top. Spore content decreases slightly.
Subzone 2-3 (2000–1400 a B.P.): Compared with Subzone 2-2, arboreal pollen fluctuates, decreasing first and then increasing. Shrubs such as Ephedra and Elaeagnus are abundant. Artemisia remains stable, while Chenopodiaceae, small Poaceae, Aster-type, and Cyperaceae decrease. Polygonaceae, Caryophyllaceae, and Geraniaceae increase. Spore content rises, with monolete spores showing a notable increase.
Zone 3 (1400–50 a B.P.)
Compared with Zone 2, arboreal pollen increases, herbaceous pollen decreases slightly, and spore content is the lowest in the profile. This zone can be further divided into three subzones.
Subzone 3-1 (1400–900 a B.P.): Pinus and Larix decrease, while Ephedra is abundant. Among herbs, Chenopodiaceae increases significantly, small Poaceae is low at the base but high at the top, and Artemisia and Cyperaceae decrease. Spore content is low.
Subzone 3-2 (900–300 a B.P.): Ephedra, Chenopodiaceae, and Caryophyllaceae decrease, while Cyperaceae increases notably. Other pollen types remain relatively stable, and Selaginella sinensis increases. Total spore content decreases.
Subzone 3-3 (300–50 a B.P.): Arboreal and shrub pollen increases, while spore content decreases, though herbs still dominate. Warm-adapted taxa such as Quercus, Betula, and Carpinus L. increase, with a notable rise in plantation Larix pollen at the top. Among shrubs, Rosaceae increases. Among herbs, Chenopodiaceae and Cyperaceae decrease significantly, while Ranunculaceae, Typha L., Fabaceae, and Geraniaceae increase.

4. Discussion

4.1. Interpretation of the Pollen Data

Palynological assemblages, specific spore–pollen type changes and their ratios are often utilized as indicators of climate change. For example, studies in Northeast China have shown that pollen concentrations of typical mixed coniferous–broadleaf forest species (e.g., Alnus, Betula, Larix, and Salix L.) exhibit positive correlations with mean annual precipitation, while steppe elements (e.g., Poaceae, Chenopodiaceae, Cyperaceae, Artemisia, Ranunculaceae, and Rosaceae) show positive correlations with mean annual temperature [25]. A high abundance of Pinus suggests cool climatic conditions, whereas a high proportion of Quercus implies warm conditions [26]. Xu Qinghai et al. noted that Pinus pollen dominates in mixed coniferous–broadleaf forests, and the Pinus/Artemisia ratio (P/A) can effectively distinguish between forest and steppe vegetation zones [27].
The Artemisia pollen is a steppe or desert steppe indicator, while Chenopodiaceae characterize deserts and frequently colonize salty soils of the lake margins [28]. Large amounts of Artemisia indicate more moisture environment, whereas more Chenopodiaceae indicates a more arid environment [29]. In arid and semi-arid regions, the Artemisia/Chenopodiaceae (A/C) ratio is commonly utilized as a robust proxy for effective moisture conditions. A lower A/C ratio indicates a more arid environment [30,31]. The authors also emphasize that when applying this indicator, the combined percentage of Artemisia and Chenopodiaceae pollen should exceed 50% of the total pollen count [31]. An A/C ratio < 0.5 suggests a desert environment, whereas an A/C ratio of 0.5–1.2 generally indicates a desert steppe environment. An A/C ratio > 1 indicates a steppe environment [30,32].
The temperature fluctuation amplitude in the Bashang region over the past 5000 years is approximately 2–3.5 °C. The sampling site of this study is located near the lakeshore, and the altitude of sampling site has shown little change over the past five millennia. The 2–3.5 °C temperature variation has had limited impact on the appearance and disappearance of tree species in this area. However, as this region is situated at the transitional zone between monsoon and non-monsoon climates, moisture variation has been more significant. In the short term, precipitation changes rather than temperature fluctuations would have been the primary factor affecting tree populations in this region. For herbaceous plants, the influences of both temperature and precipitation are significantly amplified. The integrated application of multiple proxies enables the reconstruction of historical vegetation and climate conditions.

4.2. Vegetation and Climate Changes in the Study Area

5100–4650 a B.P.: the vegetation was savanna, with an overall relatively humid climate and fluctuating temperatures that were initially warm and later cold.
Palynology was dominated by Pinus and spores. Among arboreal plants, Pinus content was initially low and later high, while deciduous broadleaf components such as Quercus and Betula were initially high and later low. The high content of moisture-loving spores, A/C and P/A ratio and low herbaceous content—especially the low presence of drought-indicating Chenopodiaceae pollen—suggests that this period was generally relatively humid, with temperatures fluctuating from warm to cold.
4650–1400 a B.P.: the vegetation was grassland, with significant climate fluctuations.
Sub-phase 4650–4100 a B.P.: the vegetation was grassland, with significant climate fluctuations.
The percentage of woody plant pollen and spores decreased, while herbaceous pollen increased significantly. The vegetation likely transitioned from savanna to grassland. Among herbaceous plants, mesophytic and hygrophytic pollen, as well as typical plateau grassland vegetation, increased, while the content of drought-tolerant Chenopodiaceae remained relatively unchanged. Humidity was slightly lower than in Zone 1 but still relatively humid overall.
Sub-phase 4100–2000 a B.P.: the vegetation was grassland, with an overall drier climate.
The content of woody pollen and spores decreased, while herbaceous pollen increased, suggesting meadow steppe vegetation. Drought-tolerant plants such as Ephedra and Chenopodiaceae increased in percentage, while mesophytic grasses and typical plateau species like Cyperaceae and Asteraceae remained high. The overall low pollen concentration, A/C and P/A ratio indicate a generally drier climate.
Sub-phase 2000–1400 a B.P.: the vegetation was grassland, with occurrences of extremely dry and cold events.
Woody pollen content initially decreased and then increased, spore content rose, and herbaceous content declined but remained dominant. In the later part of this subzone, cold-tolerant Pinus pollen increased, while warmth-loving deciduous trees were scarce, and drought-tolerant Ephedra content rose in certain intervals, indicating occurrences of extremely dry and cold events during this period.
1400–50 a B.P: The vegetation remained grassland-type, with scattered trees and shrubs on the surrounding hills. Only at the very top did the pollen of artificially planted Larix increase significantly, indicating a shift from natural vegetation to cultivated vegetation.
Sub-phase 1400–900 a B.P.: a warm and dry period.
The content of Pinus and Larix pollen decreased compared to the top of the previous sub-zone, while pollen from warmth-favoring species such as Quercus and Betula increased. Drought-tolerant species like Ephedra and Chenopodiaceae showed higher percentages and concentrations, whereas moisture-preferring Artemisia, Cyperaceae and spores decreased. This phase is inferred to have been warm and dry, corresponding to the Medieval Warm Period.
Sub-phase 900–300 a B.P.: a relatively cold and humid period.
Woody pollen and spore contents were low, while herbaceous pollen content was high.
Drought-tolerant Ephedra and Chenopodiaceae decreased, as did Caryophyllaceae (pinks), while Cyperaceae increased significantly. Other pollen types showed little change, and the content of Selaginella sinensis (a spikemoss) increased, indicating a relatively cold and humid climate during this period.
Sub-phase 300–50 a B.P.: strongly influenced by human activity.
Pollen of arbors and shrubs increased, while spore content decreased, though herbaceous plants remained dominant. Warmth-favoring species such as Quercus, Betula, and Carpinus increased, especially with a notable rise in cultivated forest Larix pollen at the top. Among herbaceous plants, Chenopodiaceae and Cyperaceae decreased significantly, while Ranunculaceae, Typha, Fabaceae and Geraniaceae increased. This period was strongly influenced by human activity: during the Qing Dynasty, the area was a royal enclosed garden, and in recent decades, large-scale planting of artificial larch forests has taken place.

4.3. Comparison with Regional Vegetation and Paleoclimate Records

During 5100–4650 a B.P., Pinus and spore content dominated, with vegetation characterized by a savanna, indicating a relatively humid climate and fluctuating temperatures that shifted from warm to cold. At Hulun Lake (6400–4400 a B.P.), xerophytic herbs increased, precipitation decreased, and temperatures declined [33]. At Dali lake, high percentages of Artemisia and Chenopodiaceae indicate that dry steppe dominated the hilly lands and lacustrine plains [34]. In the Hunshandake Sandy Land, at the Gaoximag site (5010–4040 a B.P.), the vegetation was dominated by Betula and Artemisia pollen, indicating a warm and relatively humid climate [35]. The TB section (5800–4680 a B.P.) developed lacustrine-swamp facies, indicating a humid climate with abundant precipitation [36]. The Xilinhaote section (5200–4500 a B.P.) showed a gradual decrease in coarse particles, suggesting a weakening winter monsoon [37]. The pollen assemblage of Anguli Nur was overwhelmingly dominated by woody plants with relatively few herbs, reflecting a humid climate, followed by a cold event around 4500 a B.P. [38]. At Huangqihai, the vegetation type was a mixed coniferous–broadleaf forest–steppe, indicating a temperate and humid climate [39]. During the period of 5100–4800 a B.P, Artemisia pollen increased significantly, while Pinus and Quercus pollen decreased, reflecting a mild and slightly humid climate at Daihai Lake [40]. Subsequently, from 4800 to 4450 a B.P., the forest vegetation expanded, grasslands contracted, and the climate became relatively more humid [41]. Figure 5 shows that all profiles recorded a low herbaceous content during this stage. Overall, a significant vegetation and climatic transition occurred between 4700 and 4400 a B.P.
In 4650–4100 a B.P., the vegetation transitioned from trees and ferns to herbaceous plants, with significant climate fluctuations. The humidity slightly decreased but remained relatively moist overall. However, Hulun Lake witnessed extensive growth of drought-tolerant Chenopodiaceae plants, indicating lake desertification and an extremely arid climate [33]. At Dali Lake, in 4650–4100 a B.P., although the authors did not further subdivide the pollen zones, an increase in herbaceous pollen content can be observed from the pollen spectrum according to Wen et al. [34]. In the Hunshandake Sandy Land, vegetation records vary across different lakes. At Chagan Nur, the vegetation transitioned to steppe-desert [42], while pollen assemblages from the Gaoximag lakeshore terraces were dominated by Betula and Artemisia; a Betula forest may have existed in that region [35]. Bahan Nur (4780–4207 a B.P) featured a mixed Pinus–Quercus forest, representing a warm, humid, and stable climatic optimum [43]. The TB profile showed low fine-particle content from 4680 to 4100 a B.P., suggesting enhanced winter monsoon intensity and a shift from warm–humid to cold–arid conditions [36]. Meanwhile, the Xilinhot profile recorded a gradual increase in coarse particles and enhanced winter monsoon activity between 4500 and 3700 a B.P. [37]. Anguli Nur’s pollen assemblages were overwhelmingly dominated by woody plants with relatively few herbs, reflecting humid conditions [38]. Huangqihai remained a coniferous–broadleaf forest–steppe ecotone [39]. In contrast, Daihai experienced large-scale forest retreat, grassland expansion, and a cool–dry climate in 4450–3900 a B.P, marking a significant cold–arid event [41].
In 4100–2000 a B.P., the study area was characterized by grassland vegetation and arid climatic conditions. Most sites in Figure 4 showed domination by herbaceous plant abundance. At Hulun Lake, an extremely arid climate prevailed from 4400 to 3350 a B.P., followed by partial recovery of grassland vegetation with slightly increased precipitation and rising temperatures between 3350 and 2050 a B.P. [33]. According to Wen et al. [34], in 4100–2000 a B.P., the herbaceous plants were predominantly Artemisia, with an increase in Chenopodiaceae content and a decrease in Pinus pollen in Dali Lake. The Hunshandake Sandy Land showed some regional variations—xerophytic pollen dominated at Gaoximag Lake terrace (4040–1820 a B.P.), suggesting grassland predominance [35], while Chagan Nur Lake studies revealed desert–steppe vegetation [42]. The Xilinhot profile recorded declining coarse particles (3700–3100 a B.P.), indicating weakening winter monsoon, followed by increasing coarse particles (3100–1700 a B.P.), signaling strengthened winter winds [37]. Anguli Nur maintained woody plant dominance (4000–3070 a B.P.) reflecting humid conditions, before a herb increase (3070–2000 a B.P.) [38]. Qigai Nuur deteriorated to steppe under cool–dry conditions (4000–2800 a B.P.), and then saw a significant expansion of Pinus-dominated coniferous forests (2800–850 a B.P.) [44]. At Huangqihai, coniferous forest–steppe vegetation indicated cool–temperate semi-arid conditions (3687–1659 a B.P.) [39]. Daihai Lake exhibited different vegetation patterns: mixed coniferous–broadleaf forest dominated in 3950–3500 a B.P., followed by decreased woody plants and increased herbs, indicating arid conditions (3500–2900 a B.P.), and ultimately herb-dominated vegetation under a cold–dry climate (2900–1700 a B.P.) [41]. The Nihewan Basin studies showed near-disappearance of forest vegetation (5500–2000 a B.P.), with only small broadleaf shrub patches in favorable microhabitats, forming typical steppe or dry-steppe vegetation [45].
During 2000–1400 a B.P., the study area showed a pattern of an initial decrease followed by an increase in arboreal pollen content, with rising spore counts and declining (yet still dominant) herbaceous pollen. At Hulun Lake (2050–1000 a B.P.), Artemisia vegetation declined, while montane pine forests expanded, coinciding with the coldest temperatures of the Holocene [33]. The Hunshandake Sandy Land recorded an abrupt decrease in total pollen concentrations in 2000–1460 a B.P. [35]. Daihai exhibited partial forest recovery between 1700 and 1350 cal. a B.P., accompanied by rising temperatures and increased precipitation [40,41]. Except c (Dali Lake), other records in Figure 5 recorded a decline in herbaceous pollen percentage during the late part of this stage, suggesting increased humidity during this period.
From 1400 to 50 a B.P., the pollen content of woody plants increased, while herbaceous pollen slightly decreased, though it remained dominant. Spore content reached the lowest level in the profile, indicating that the local vegetation was still grassland-type, with trees and shrubs potentially scattered on surrounding hills. Only at the very top did the pollen of artificially planted larch increase significantly, marking a distinct shift from natural vegetation to cultivated vegetation. Between 1400 and 900 a B.P. was a warm and dry phase, corresponding to the Medieval Warm Period. In 900–300 a B.P., the climate turned relatively cold and humid, aligning with the Little Ice Age. The period of 300–50 a B.P. was significantly influenced by human activity. The last 1000 a B.P. of Hulun Lake were characterized by increased Chenopodiaceae and Poaceae pollen, reflecting intensified human impact [33]. According to Wen et al. [34], over the past 1000 years, the pollen of trees in Dali Lake has slightly increased, while the content of herbaceous Artemisia pollen has decreased and that of Chenopodiaceae pollen has increased, with herbaceous plants remaining dominant overall. From 1280 a B.P. to the present, Chagan Nur was characterized by steppe vegetation with dramatic lake-level fluctuations—high stands during the Medieval Warm Period and low stands in the Little Ice Age [42]. From 1490 a B.P. to the present, the TB profile gradually shifted from warm–wet conditions to aridification, approaching modern climates [36]. The pollen record from Anguli Nur shows similar patterns to our study: In 1120–800 a B.P., decreased herbaceous pollen content and increased A/C ratio indicate enhanced precipitation. From 800 to 270 cal. a B.P., the rising proportion of herbaceous pollen in the assemblage suggests a gradual cooling trend. Since 270 cal. a B.P., the climate has shifted toward warmer and more humid conditions [38]. In 1659–0 cal a B.P., Huangqihai was steppe-dominated under cool–temperate semi-arid climates [39]. The Yanshan Mountains were characterized broadleaf forest–steppe with pine participation in 1600–700 a B.P. From 700 a B.P. to the present, the natural forest cover has declined significantly as the climate became progressively warmer and drier, leading to notable expansion of Artemisia-dominated steppe vegetation [46]. At Daihai Lake, intensified human activities between 1350 and 0 a B.P. caused degradation of forest vegetation [41].
Original pollen spectra from multiple drill cores and profiles (Figure 5) reveal that although there are minor discrepancies in the vegetation–climate phase divisions among different sites (likely due to dating uncertainties), except Anguli Nur, a consistent pattern emerges: herbaceous pollen has dominated since approximately 2000 years ago, indicating the regional plant was grassland and coniferous trees scattered in mountainous areas. Research shows that the Mu Us Sandy Land, Hunshandake Sandy Land, Hulunbuir Sandy Land, and Horqin Sandy Land in China have experienced aeolian sand accumulation over the past 2000 years [47]. Yin [48] has compared the YLH record with other records. These multi-proxy comparisons demonstrate a regional drying trend over the past 500 years.
Under projected future warming and drying conditions, large-scale afforestation appears ecologically unsuitable for this region. Instead, ecological restoration efforts should prioritize native shrubs and herbaceous plants adapted to local climatic conditions.

5. Conclusions

5.1. Vegetation Transformation and Current Ecological Status

The vegetation record from the Y1 core can be divided into three periods based on age–depth relationships. Period 1 (5100–4100 a B.P.): dominated by Pinus and spores, with low herbaceous pollen content, reflecting a relatively warm and humid climate. Period 2 (4100–1400 a B.P.): the vegetation shifted to herb dominance, primarily Artemisia, Chenopodiaceae, small Poaceae, Cyperaceae, and Aster-type, with monolete spores being the most common, indicating a relatively arid climate. Period 3 (1400–50 a B.P.): the vegetation remained grassland-type, with scattered trees and shrubs on the surrounding hills. In 1400–900 a B.P. (corresponding to the Medieval Warm Period), arboreal vegetation showed some recovery. Between 900 and 300 a B.P. (corresponding to the Little Ice Age), Ephedra, Chenopodiaceae and Caryophyllaceae decreased, while Cyperaceae increased significantly. From 300 to 50 a B.P., arboreal and shrub pollen increased, while spore content decreased, though herbs still dominated. Only at the very top of the record did pollen from artificially planted Larix increase markedly, indicating a transition from natural to cultivated vegetation.
Over the past five millennia, the vegetation in this region has undergone a successional transition from savanna to grassland and finally to plantation forests. Notably, large-scale afforestation is a recent phenomenon occurring only in recent decades. Paleoecological records confirm that the historical vegetation for this area has consistently been herbaceous-dominated ecosystems over the past 2000 years.

5.2. Emerging Environmental Challenges and Restoration Recommendations

The region currently exhibits multiple environmental stressors: progressive vegetation degradation, accelerated lake shrinkage, and development of seasonal dry soil layers. Under projected warming scenarios, ecological restoration strategies should avoid extensive monoculture plantations, implement mixed community structures combining trees, shrubs and herbaceous vegetation, and prioritize native shrub and grassland restoration.

Author Contributions

Conceptualization, H.J.; methodology, H.J., H.W. and Z.Y.; investigation, H.J.; writing—original draft preparation, H.J. and Z.Y.; funding acquisition, H.J., H.W. and Z.Y. All authors have read and agreed to the published version of the manuscript.

Funding

This research was funded by the National Natural Science Foundation of China (grant No. U2344227), and the Science and Technology Innovation Team Project of Hebei GEO University (No. KJCXTD-2021-02).

Data Availability Statement

The data presented in this paper are available on request from the corresponding authors.

Acknowledgments

We are grateful to Saihanba machinery forest farm of Hebei Province for kindly sharing the detailed temperature and precipitation references.

Conflicts of Interest

The submitted manuscript has been approved by all authors and there are no conflicts of interest by any of the authors.

References

  1. Yin, Z.; Zhao, L.; Liu, W.; Li, R.; Shao, H.; Peng, C.; Tian, Y. Shrinkage reasons and countermeasures of Moon Lake area in the eastern part of Bashang Plateau, Chengde City. Hydrogeol. Eng. Geol. 2020, 47, 57–64. (In Chinese) [Google Scholar]
  2. Jia, H. Investigation report on the current situation and influencing factors of carbon sink in different forest communities at Bashang area. 2022; (In Chinese, Project Report, Unpublished). [Google Scholar]
  3. Jia, H. Research Report on Ecological Degradation and Suitability Assessment of Typical Vegetation Communities in the Ruyi River Basin. 2023; (In Chinese, Project Report, Unpublished). [Google Scholar]
  4. Zhao, Y. Dynamic Monitoring on Water Level of Angulinao Lake and the Causes of Its Drying up. J. Geoinf. Sci. 2009, 11, 312–318. (In Chinese) [Google Scholar] [CrossRef]
  5. Liu, Y.; Xin, Z.; Li, Z.; Keyimu, M. Climate effect on the radial growth of Populus simonii in Northwest of Hebei for last four decades. Acta Ecol. Sin. 2020, 40, 9108–9119, (In Chinese with English abstract). [Google Scholar]
  6. Xiao, C.; Nie, H.; Liu, J.; Yuan, G.; Kang, Y.; Wang, A.; Song, B. Ecological and geological interaction model: The coupling of supergene geological processes and ecological characteristics. Geol. Surv. China 2021, 8, 9–24. [Google Scholar]
  7. Sun, L.; Liu, J.; Xu, Q. Remote sensing based temporal and spatial analysis of vegetation cover changes in Bashang area of Hebei Province. Remote Sens. Nat. Resour. 2014, 26, 167–172, (In Chinese with English abstract). [Google Scholar]
  8. Su, W.; Li, Z.; Chen, S.; Li, H. Evolution trend of vegetation coverage and its risk assessment in the Bashang region in Hebei Province. Arid. Zone Res. 2018, 35, 686–694, (In Chinese with English abstract). [Google Scholar]
  9. Yang, X.; Zhang, R.; Zhang, Z.; Liu, L.; Wang, R.; Gao, S. Environmental change since 5000cal.a B.P. in the Anguli-Nuur Lake area based on palynological and geochemical records. Quat. Sci. 2017, 37, 130–142, (In Chinese with English abstract). [Google Scholar]
  10. Qi, H.; Liu, X.; Li, H.; Li, J.; Cao, X.; Ulrike, H. The vegetation and climate changes since the late glacial period inferred from pollen record of a sediment core in Anguli-Nuur Lake, Hebei Province. Quat. Sci. 2018, 38, 1203–1210, (In Chinese with English abstract). [Google Scholar]
  11. Liu, Y.; Tian, Y.; Liu, A.; Yang, Q.; Yang, Z.; Zhou, Y.; Guo, Z.; Sun, L. Variation of Paleovegetation and Paleoclimate since the Mid-Holocene in the Yudaokou Area of Weichang County, Hebei Province. South North Water Transf. Water Sci. Technol. 2014, 12, 69–72, 93, (In Chinese with English abstract). [Google Scholar]
  12. Penny, A.M.; Chao, A.; Davies, A.L.; Magurran, A.E. Applying a unified framework to compare taxonomic, functional and phylogenetic diversity in Holocene pollen records. J. Ecol. 2025, 1–18. [Google Scholar] [CrossRef]
  13. Liu, J. Evolution and Mechanism of East Asian Summer Monsoon Since Last Deglacial Recorded by Gonghai Lake. Ph.D. Dissertation, Lanzhou University, Lanzhou, China, 2015. (In Chinese with English abstract). [Google Scholar]
  14. Zhao, S.; Ding, Z. Changes in Plant Diversity On the Chinese Loess Plateau Since the Last Glacial Maximum. Sci. Bull. 2014, 59, 4096–4100. [Google Scholar] [CrossRef]
  15. Schwörer, C.; Colombaroli, D.; Kaltenrieder, P.; Rey, F.; Tinner, W.; Austin, A. Early Human Impact (5000–3000 BC) Affects Mountain Forest Dynamics in the Alps. J. Ecol. 2015, 103, 281–295. [Google Scholar] [CrossRef]
  16. Jiang, W.; Cheng, Y.; Yang, X.; Yang, S. Chinese Loess Plateau vegetation since the Last Glacial Maximum and its implications for vegetation restoration. J. Appl. Ecol. 2013, 50, 440–448. [Google Scholar] [CrossRef]
  17. IPCC. AR6 Synthesis Report: Climate Change. 2023. (ipcc.ch). Available online: https://www.ipcc.ch/report/ar6/syr/ (accessed on 20 March 2023).
  18. Ivanova, N. Global Overview of the Application of the Braun-Blanquet Approach in Research. Forests 2024, 15, 937. [Google Scholar] [CrossRef]
  19. Faegri, K.; Kaland, P.E.; Krzywinski, K. Textbook of Pollen Analysis, 4th ed.; Wiley: Chichester, UK, 1989. [Google Scholar]
  20. Wang, F.; Chien, N.; Zhang, Y.; Yang, H. Pollen Flora of China, 2nd ed.; Science Press: Beijing, China, 1995. (In Chinese) [Google Scholar]
  21. Grimm, E.C. Tilia Software, version 1.7.16; Illinois State Museum Research and Collections Center: Springfield, IL, USA, 2011.
  22. Grimm, E.C. CONISS: A FORTRAN 77 program for stratigraphically constrained cluster analysis by the method of incremental sum of squares. Comput. Geosci. 1987, 13, 13–35. [Google Scholar] [CrossRef]
  23. R Core Team. _R: A Language and Environment for Statistical Computing_. R Foundation for Statistical Computing, Vienna, Austria. 2025. Available online: https://www.R-project.org/ (accessed on 25 August 2025).
  24. Reimer, P.J.; Austin, W.E.N.; Bard, E.; Bayliss, A.; Blackwell, P.G.; Ramsey, C.B.; Butzin, M.; Cheng, H.; Edwards, R.L.; Friedrich, M.; et al. The IntCal20 Northern Hemisphere Radiocarbon Age Calibration Curve (0–55 cal k BP). Radiocarbon 2020, 62, 725–757. [Google Scholar] [CrossRef]
  25. Cui, Q.; Zhao, Y.; Qin, F.; Liang, C.; Li, Q.; Geng, R. Characteristics of the modern pollen assemblages from different vegetation zones in Northeast China: Implications for pollen-based climate reconstruction. Sci. China Earth Sci. 2019, 62, 1564–1577. [Google Scholar] [CrossRef]
  26. Xu, D.; Lu, H.; Chu, G.; Wu, N.; Shen, C.; Wang, C.; Mao, L. 500-year climate cycles stacking of recent centennial warming documented in an East Asian pollen record. Sci. Rep. 2014, 4, 3611. [Google Scholar] [CrossRef]
  27. Xu, Q.; Li, Y.; Yang, X.; Zheng, Z. Surface pollen assemblages of some major forest types in northern china. Quat. Sci. 2005, 25, 585–597, (In Chinese with English abstract). [Google Scholar]
  28. Yan, S. The characteristics of Quaternary sporopollen assemblage and the vegetation succession in Xinjiang. Arid. Land. Geogr. 1991, 2, 1–9, (In Chinese with English abstract). [Google Scholar]
  29. Liu, H.; Wang, Y.; Wang, H. Spatial patterns of surface pollen in the semi-arid region of central Inner Mongolia and their implications for desertification driving factors. In Proceedings of the 7th First Academic Conference of the Chinese Palynological Society, Guangzhou, China, 23–26 June 2005. [Google Scholar]
  30. El-Mosilimany, A.P. Ecological significance of common non-arboreal pollen: Examples from drylands of the Middle East. Rev. Palaeobot. Palynol. 1990, 64, 343–350. [Google Scholar] [CrossRef]
  31. Sun, X.; Du, N.; Weng, C.; Lin, R.; Wei, K. Paleovegetation and paleoenvironment of Manas Lake, Xinjiang, northwestern China during the last 14000 years. Quat. Sci. 1994, 3, 239–248, (In Chinese with English abstract). [Google Scholar]
  32. Weng, C.; Sun, X.; Chen, Y. Numerical characteristics of pollen assemblages of surface samples from west Kunlun Mountains. Acta Bot. Sin. 1993, 35, 69–79. [Google Scholar]
  33. Wen, R.; Xiao, J.; Chang, Z.; Zhai, D.; Zhou, L.; Xu, Q.; Li, Y. Holocene vegetation and climate changes reflected by the pollen record of Hulun Lake, north-eastern Inner Mongolia. Quat. Sci. 2010, 30, 1105–1115. [Google Scholar]
  34. Wen, R.; Xiao, J.; Fan, J.; Zhang, S.; Yamagata, H. Pollen evidence for a mid-Holocene East Asian summer monsoon maximum in northern China. Quat. Sci. Rev. 2017, 176, 29–35. [Google Scholar] [CrossRef]
  35. Li, C.; Xu, Z.; Kong, Z. A preliminary investigation on the holocene vegetation changes from pollen analysis in the gaoximage section, hunshandak sandy land. Acta Phytoecol. Sin. 2003, 27, 797–804, (In Chinese with English abstract). [Google Scholar]
  36. Han, R. Climate Change in Otindag Sandy Land During the Holocene. Master’s Thesis, Shanxi University, Taiyuan, China, 2020. [Google Scholar]
  37. Zhang, H.; Jin, H.; Su, Z.; Sun, Z. Climate changes revealed by grain-size cycles of holocene in hunshandake desert. J. Desert Res. 2005, 25, 1–7. [Google Scholar]
  38. Liu, L.; Li, C.; Jie, D.; Zhang, R.; Wang, J.; Zhang, Y.; Mao, X.; Jiang, G.; Wang, P. Paleoclimate recorded by phytolith in anguli-nuur lake since mid-late holocene. Earth Sci. 2018, 43, 4138–4148. [Google Scholar]
  39. Zhao, Z. The Climatic and Environmental Evolution Since the Mid-Holocene in Huangqihai, Inner Mongolia. Master’s Thesis, Chinese Academy of Geological Sciences, Beijing, China, 2011. [Google Scholar]
  40. Xiao, J.; Xu, Q.; Nakamura, T.; Yang, X.; Liang, W.; Inouchi, Y. Holocene vegetation variation in the Daihai Lake region of north central China: A direct indication of the Asian monsoon climatic history. Quat. Sci. Rev. 2004, 23, 1669–1679. [Google Scholar] [CrossRef]
  41. Xu, Q.; Xiao, J.; Nakamura, T.; Yang, X.; Inouchi, Y. Pollen evidence of vegetation and climate changes in daihai lake area during the Holocene. J. Glaciol. Geocryol. 2004, 26, 73–80. [Google Scholar]
  42. Niu, Z. Vegetation and Climate Changes During the Holocene Reflected by Lacustrine Records in Chagan nur Otindag Sandy Land. Master’s Thesis, Inner Mongolia University, Hohhot, China, 2018. [Google Scholar]
  43. Huang, C.; Feng, H.; Ma, Y.; Guo, L.; Wan, W. Holocene palaeoenvironment changes recorded by pollen of Baahar Nuur Lake. J. Lanzhou Univ. Nat. Sci. 2009, 45, 7–12. [Google Scholar]
  44. Sun, A.; Feng, Z. Holocene climatic reconstructions from the fossil pollen record at Qigai Nuur in the southern Mongolian Plateau. Holocene 2013, 23, 1391–1402. [Google Scholar] [CrossRef]
  45. Hu, Y. Climate Environment Change of the Record on the Holocene Pollen of the Jijitan Profiles in the Nihewan Basin. Master’s Thesis, Hebei Normal University, Shijiazhuang, China, 2015. [Google Scholar]
  46. Xu, Q.; Yang, X.; Yang, Z.; Liang, W.; Sun, L. Reconstruction of climatic changes of Yansan mountain area since 5000 a B.P. inferred from Pollen Data. Sci. Geogr. Sin. 2004, 24, 339–345. [Google Scholar]
  47. Yang, X.; Liang, P.; Zhang, D.; Li, H.; Rioual, P.; Wang, X.; Xu, B.; Ma, Z.; Liu, Q.; Ren, X.; et al. Holocene aeolian stratigraphic sequences in the eastern portion of the desert belt (sand seas and sandy lands) in northern China and their palaeoenvironmental implications. Sci. China Earth Sci. 2019, 62, 1302–1315. [Google Scholar] [CrossRef]
  48. Yin, Z.; Jia, H.; Peng, C.; Qin, X.; Zhang, H.; He, A.; Wang, L. Palaeoenvironmental changes since the last deglaciation recorded at moon lake on the bashang plateau, northern china: Implications for the future sustainability of regional forests. Palaeogeogr. Palaeocl 2024, 649, 112314. [Google Scholar] [CrossRef]
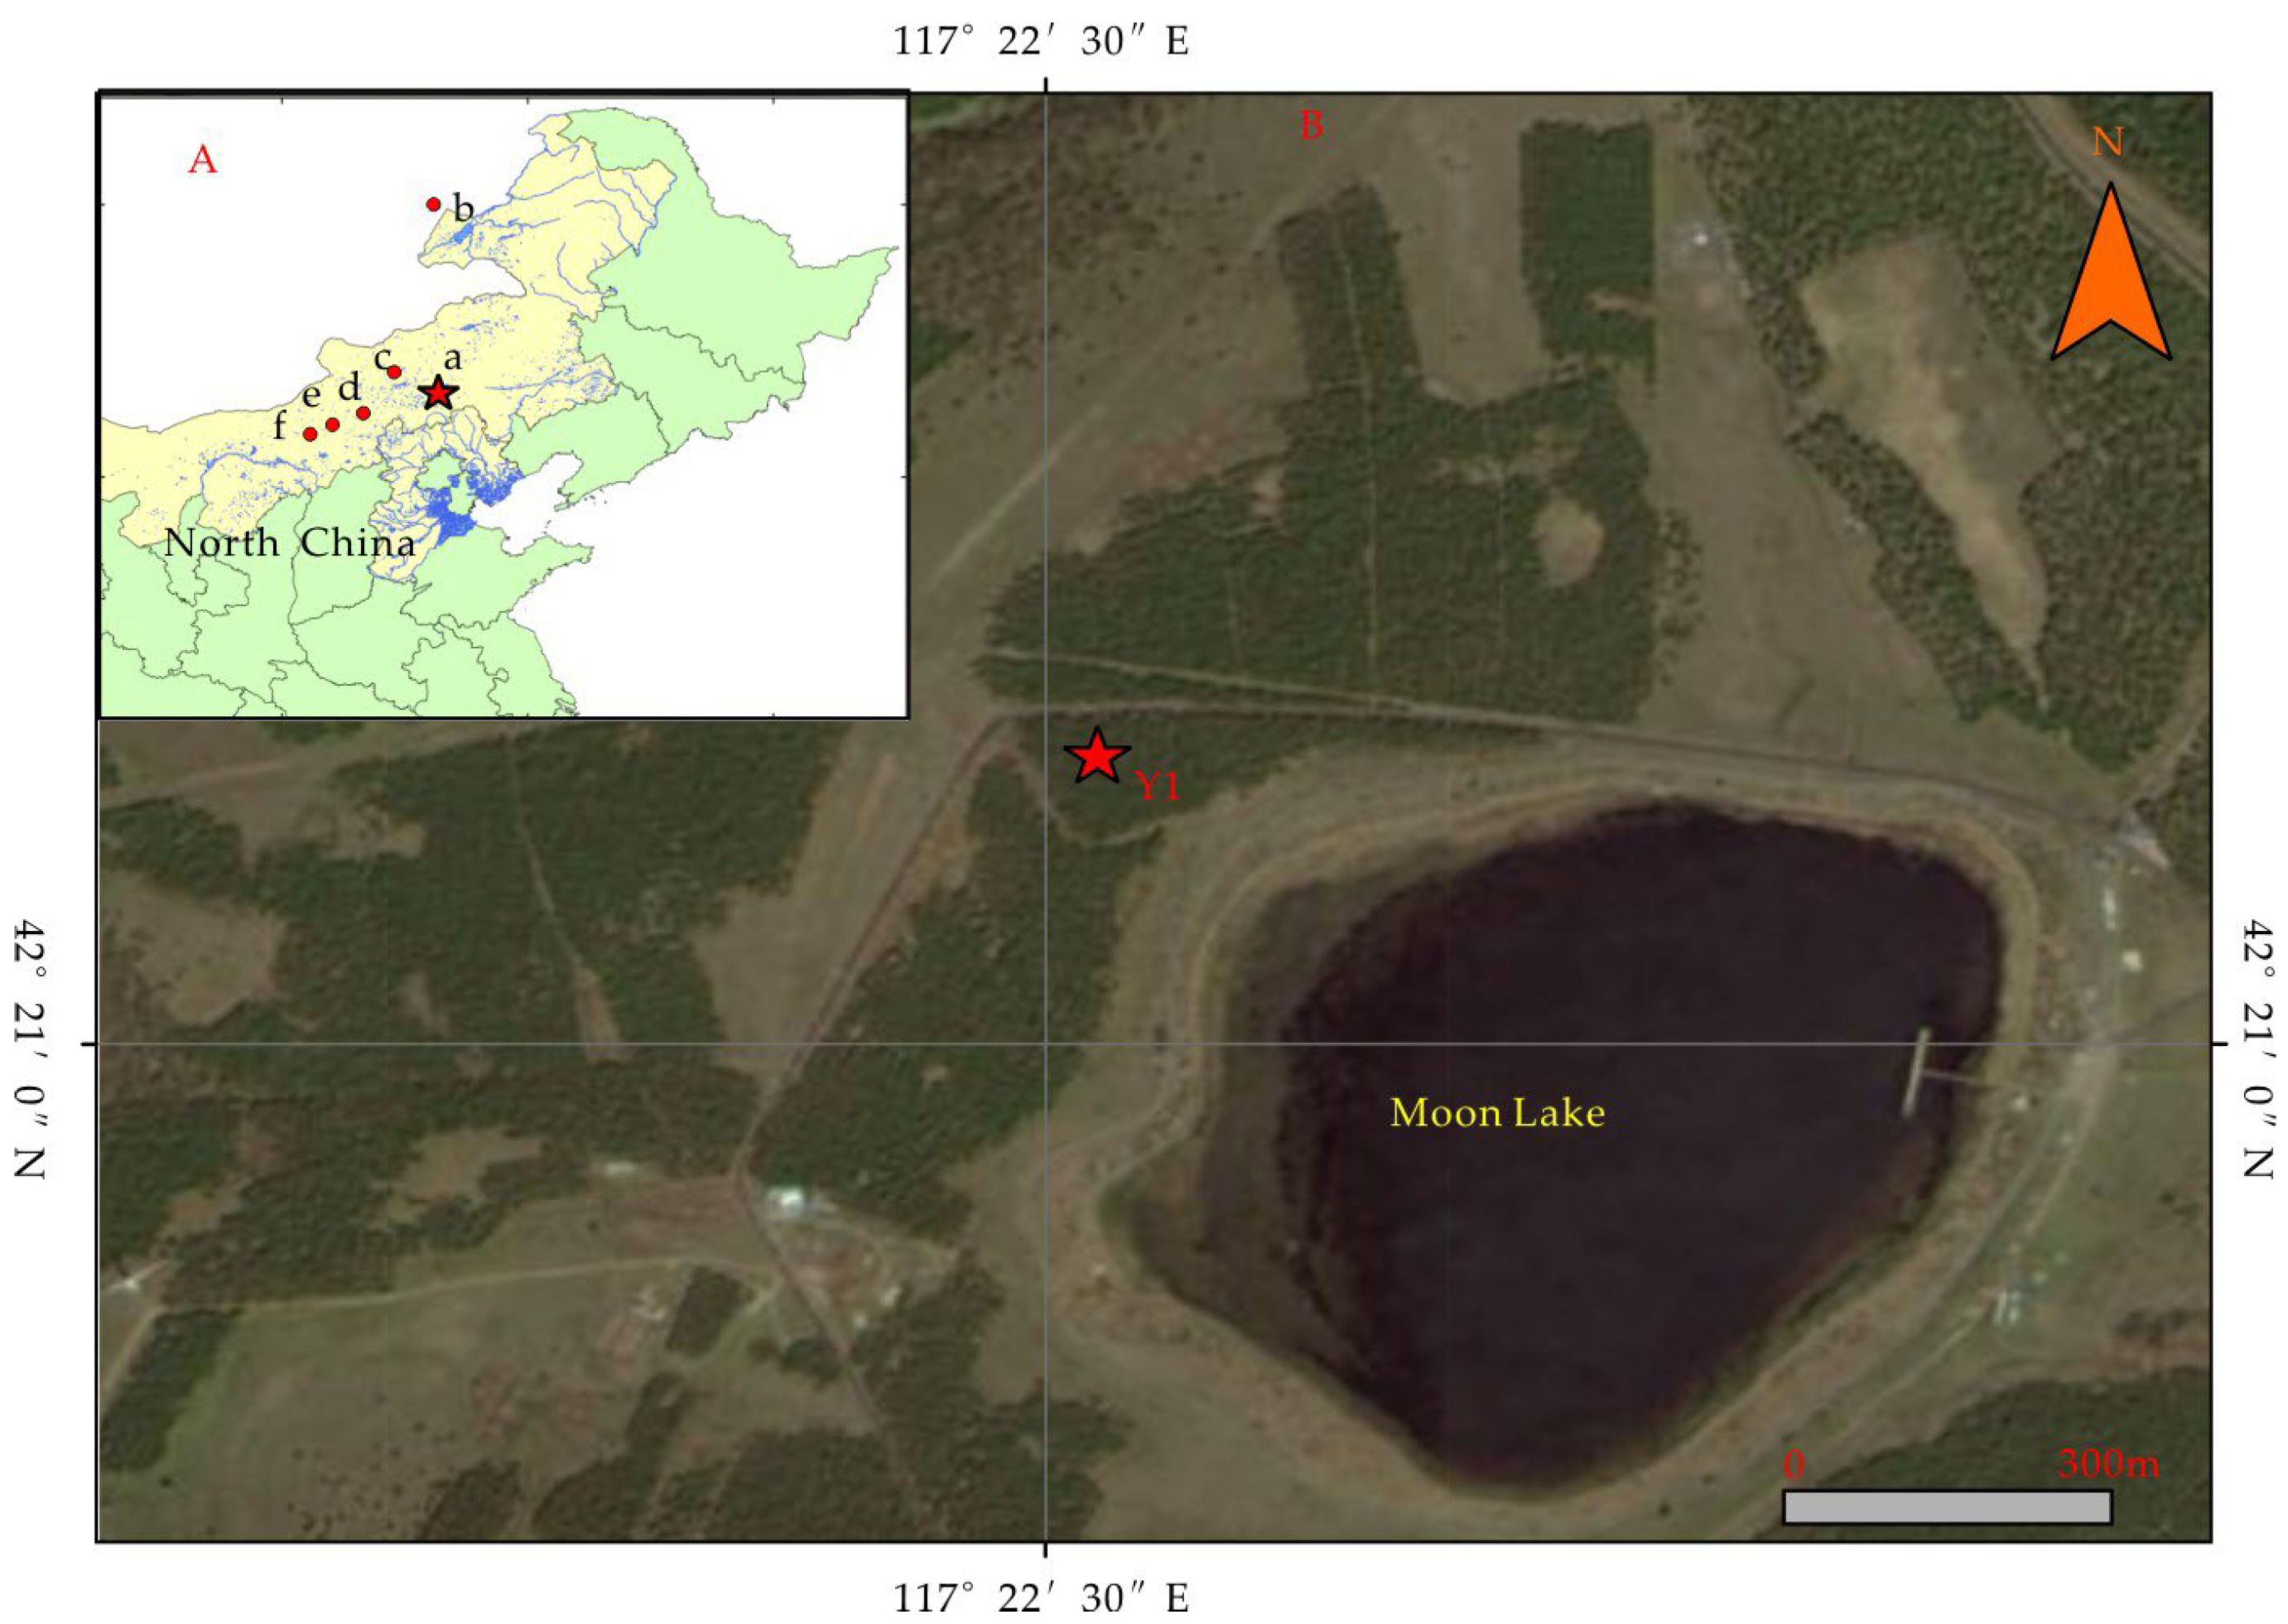
Figure 1. Geographical map of study area ((A) North China with sample site and comparison sites. a: the red star is Y1 core, b: Hunlun Lake, c: Dali Lake, d: Gaoximage section, e: Anguli Nur, f: Huangqihai. (B) the red star isY1 core location).
Forests 16 01392 g001
Figure 2. Research methodology flowchart.
Forests 16 01392 g002
Figure 3. Age–depth model of the Y1 core.
Forests 16 01392 g003
Figure 4. Percentage and concentration of total land pollen and spore of Y1 core, together with the CONISS results and the pollen zones (A/C: Artemisia/Chenopodiaceae, P/A: Pinus/Artemisia ratio, concentration: ×103 grains/gram).
Forests 16 01392 g004
Figure 5. Comparison of pollen records from different locations. (a) Herb percentage of Y1 core (this study); (b) herb percentage of Hunlun Lake [33]; (c) herb percentage at Dali Lake in the southern Hunshandak sandy land [34]; (d) herb percentage of Gaoximage section Hunshandak sandy land [35]; (e) herb concentration of Anguli Nur [38]; (f) herb concentration of Huangqihai [39]; (g) herb percentage at Daihai Lake in the southern Hunshandak sandy land [40].
Forests 16 01392 g005
Table 1. AMS 14C dating results and calibrated ages of the Y1 section.
Lab No.Depth (cm)Dated MaterialConventional Radiocarbon Age
(a B.P.)
Calibrated Age
(cal aB.P.)
δ13C
(‰)
Beta-6498418Bulk organic−40+/−30−5–−6 (48.7%)
−69–−70 (45.9%)
−68 (0.8%)
−25.9
Beta-64984232Bulk organic670+/−30673–628 (53.1%)
594–558 (42.3%)
−25.0
Beta-64984364Bulk organic1890+/−301874–1718 (95.4%)−24.6
Beta-64984492Bulk organic4140+/−304824–4571 (93.1%)
4549–4533 (2.3%)
−23.5
Disclaimer/Publisher’s Note: The statements, opinions and data contained in all publications are solely those of the individual author(s) and contributor(s) and not of MDPI and/or the editor(s). MDPI and/or the editor(s) disclaim responsibility for any injury to people or property resulting from any ideas, methods, instructions or products referred to in the content.