Abstract
The rapid expansion of transportation infrastructure on Hainan Island has intensified ecological pressures such as landscape fragmentation and decreased connectivity, threatening the environmental integrity of Hainan Tropical Rainforest National Park. As China’s only tropical island national park, it is important to maintain biodiversity and ecological resilience. Therefore, this study attempts to examine the park and its 5 km buffer zone to assess how transport expansion from 2003 to 2023 has altered land use patterns and landscape connectivity. Through the analysis of multi-period land use data, the land use changes are tracked by using ArcGIS and Fragstats 4.3 software, and the landscape dynamics are quantified. We linked these patterns to ecological processes via a resistance-surface model, which is further refined by spatial structural indices to better reflect ecological realism. Ecological sources were subsequently identified through morphological analysis and ecosystem service evaluation, and circuit theory was applied to delineate potential corridors and construct an ecological security network. The results indicate that (1) transportation development has significantly increased landscape fragmentation and ecological resistance, particularly along major highways; (2) while core forest areas inside the park remain relatively intact, the buffer zones show accelerating degradation; and (3) Although there are many ecological conflict points between the transportation network and the ecological corridor, the construction of animal channels in combination with bridges, tunnels and culverts can effectively improve ecological connectivity and protect the integrity of animal habitat. These findings highlight the vulnerability of ecological integrity as the network expands. The proposed modeling framework provides a more realistic assessment of infrastructure impact and offers a scientific basis for coordinating ecological protection and transport planning in tropical island national parks.
1. Introduction
National parks are a major form of protected area worldwide and serve as critical areas for conserving ecological integrity, maintaining biodiversity, and sustaining ecosystem services, yet human-induced disturbances increasingly threaten them. Among these threats, the rapid expansion of transportation infrastructure has emerged as a main driver of habitat fragmentation, species isolation, and ecological disruption, undermining the very integrity that national parks are designed to protect [1,2,3,4].
Against this backdrop, national parks have become a cornerstone of global conservation. Since the establishment of the first national park in the 19th century—Yellowstone National Park in the United States—national parks have grown to cover over 8.3% of the world’s terrestrial area nowadays [5,6], offering essential habitats for endangered species and serving as key components in the global ecological security framework. International initiatives such as the Convention on Biological Diversity and the “30 × 30” target further highlight the importance of strengthening connectivity among protected areas to secure ecological integrity [7,8]. In China, the creation of the national park system in 2013 appears to represent a substantial institutional reform, with ten national parks and pilot zones established to date. Among them, Hainan Tropical Rainforest National Park (HTRNP) is particularly significant: As China’s only tropical island ecosystem, it plays an important role as an ecological security barrier and a key site for biodiversity conservation and the development of ecological civilization (a policy concept emphasizing harmony between humans and nature in China) [9]. However, given the complexity of these theoretical relationships, as Hainan’s socio-economic development continues, regional transportation networks are being expanded. Notably, projects such as the Central Highway have evidently increased disturbances, raising urgent concerns about landscape fragmentation.
On this basis, numerous studies have documented the detrimental effects of road networks on ecosystem connectivity, emphasizing their role in landscape fragmentation and habitat loss [10,11]. In tropical regions, road density has been shown to correlate with forest degradation intensity, making transportation infrastructure one of the primary drivers of tropical forest loss [12,13]. Research conducted in tropical island ecosystems, such as Borneo, Madagascar, and the Philippines [14,15], have reported similar trends, where road development disrupts ecological corridors and reduces biodiversity.
Although valuable insights have been gained from studies in other tropical regions, there remains a notable research gap regarding the temporal impacts of transportation infrastructure in tropical national parks [16]. Most studies assess the impact of infrastructure at one point in time, neglecting the cumulative and evolving effects of transportation network expansion over multiple decades [17,18,19]. Moreover, existing approaches are often limited by their reliance on static landscape indicators, a lack of scenario-based comparisons, and the absence of integrated resistance modeling, all of which constrain their ability to capture dynamic ecological processes. Given this gap, there is a pressing need for research that examines the long-term and dynamic impacts of transportation infrastructure on landscape connectivity and ecosystem fragmentation in tropical protected areas. To address this gap, this study investigates how the expansion of transportation networks over the past two decades has altered landscape connectivity and fragmentation within HTRNP, with the aim of developing an ecological security pattern model to guide conservation and infrastructure planning. Based on this objective, we hypothesize that the expansion of transportation infrastructure significantly increases landscape fragmentation and reduces ecological connectivity within HTRNP.
Specifically, we focus on HTRNP and its 5 km buffer zone to evaluate the spatiotemporal impacts of transportation infrastructure expansion on ecological processes. By using landscape analysis and ecological modeling, we aim to assess landscape dynamics under various stages of transportation disturbance. A multi-factor ecological resistance surface is created to simulate the response of ecological processes to infrastructure expansion.
This research is significant for its focus on the dynamic evolution of landscape patterns within tropical rainforest national parks at different stages of transportation development. Combining scenario-based landscape analysis with ecological resistance modeling, it fills a gap in spatiotemporal studies of transportation impacts. The findings will provide key insights for adaptive ecological protection strategies and coordinated planning of transportation infrastructure and ecological security frameworks. Unlike previous descriptive or static analyses, this study integrates MSPA, resistance modeling, and scenario analysis into a dynamic framework, thereby providing both theoretical advances and practical strategies for balancing infrastructure development with ecological security in tropical island national parks.
2. Overview of the Research Area
Hainan Tropical Rainforest National Park, located in the central–southern part of Hainan Island (108°44′–110°04′ E, 18°33′–19°14′ N), covers a total area of 4269 km2, accounting for approximately one-seventh of the island’s land area. Within this broader analytical framework, a 5 km buffer zone surrounding the park was included to assess potential ecosystem changes associated with transportation expansion (Figure 1). This zone represents a transitional area between conservation and development, where ecological processes are highly sensitive to anthropogenic disturbance. The buffer width aligns with the typical extent of ecological edge effects [20], ensuring ecological relevance.
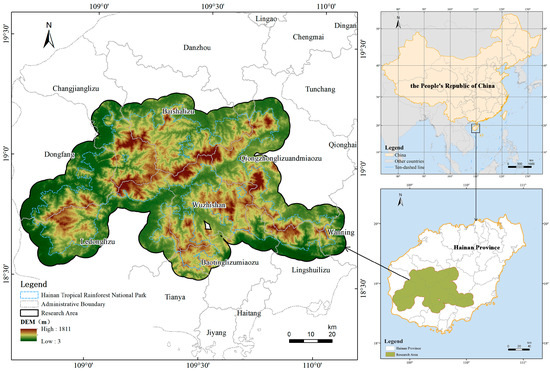
Figure 1.
Overview of the research area.
The park’s topography is characterized by higher elevations in the center and lower elevations along the edges, with complex terrain and pronounced altitude gradients. This makes it a typical example of a tropical rainforest ecosystem, while also providing a heterogeneous terrain that amplifies the spatial variability of transportation impacts. The park maintains an exceptionally high forest coverage rate of 95.56%, with natural forests covering 3294.36 km2, accounting for 74.85% of its total area [21]. Such extensive and continuous forest cover offers a critical baseline for evaluating how transportation development fragments large, intact ecosystems. The region harbors a diverse range of vegetation types and is recognized as one of the most biodiverse regions in China, playing a vital role in biodiversity conservation and ecosystem service provision. Its unique insular geography and steep altitudinal gradients amplify ecological vulnerability, making it an ideal case to study transportation–ecosystem interactions. Insights derived from HTRNP are not only critical for local conservation but also transferable to other tropical protected areas facing similar pressures in Southeast Asia and South America [22,23].
3. Research Methods
3.1. Data Sources and Processing
This study utilized multiple geospatial datasets (Table 1), including land use, road networks, digital elevation models (DEMs), mean annual precipitation and temperature, soil texture, distribution of natural and plantation forests, vegetation net primary productivity (NPP), nighttime light intensity, and the normalized difference vegetation index (NDVI).

Table 1.
Data sources and descriptions.
Land use and road network data from three representative years—2003, 2013, and 2023—were selected based on data availability and the phased nature of transportation network development. For the major transportation developments, we have chosen a ten-year interval for analysis, which provides sufficient time for the landscape pattern to respond to changes.
To investigate the response mechanisms of landscape patterns under varying levels of transportation disturbance, three disturbance scenarios were constructed: the natural state (State 1), the conventional road state (State 2), and the full-element road state (State 3). Each scenario was applied to three land use phases (2003, 2013, and 2023), resulting in a total of nine land use map combinations. These maps were rasterized at a 30 m spatial resolution, which balances the need to detect fine-scale road-induced fragmentation with computational feasibility; prior pan-tropical studies using Landsat-scale (30 m) products show that this resolution reliably captures landscape pattern changes in tropical rainforests—especially fragmentation and edge dynamics—whereas coarser grids tend to under-detect small fragments [26,27]. The natural state excludes all transportation infrastructure and serves as the ecological baseline before human interference. The traditional road conditions cover highways and railways on the baseline, simulate typical traffic disturbances, and are usually evaluated in ecological studies. The full-element road condition includes additional infrastructure such as bridges and tunnels, thereby maximizing the spatial range of the transportation system and reflecting the overall intensity of ecological disturbances.
3.2. Spatiotemporal Analysis of Land Use
Spatiotemporal changes in land use [28] were analyzed using overlay analysis of land use datasets for 2003, 2013, and 2023 to derive land use transition matrices and quantify change dynamics.
Land use transition matrices capture the mutual conversions among land use types within the same region across different periods [29,30,31], forming a two-dimensional matrix that reflects the gains and losses of each land category between the start and end of each period. The land use dynamic index reflects both the rate and intensity of land use change, providing a basis for trend forecasting [32,33,34].
3.3. Landscape Pattern Indices
Landscape pattern index analysis is a widely applied approach in landscape ecology, used to characterize the response of landscape patterns to external disturbances by examining their evolution under varying study conditions [35]. In this study, Fragstats4.3 was employed to analyze three disturbance states for the HTRNP in 2003, 2013, and 2023. Analyses were conducted at the patch, class, and landscape metrics to reveal the dynamic evolution of landscape patterns and their relationship with transportation network development.
Following established applications in tropical and mountainous ecosystems [22,35,36,37,38], eight representative landscape pattern indices were selected for analysis: Patch Density (PD), Contagion Index (CONTAG), Shannon Diversity Index (SHDI), edge density (ED), Largest Patch Index (LPI), Cohesion Index (COHESION), Fractal Dimension (FRAC), and Proximity Index (PROX). These indices collectively capture fragmentation, connectivity, dominance, and morphological complexity. The selected landscape pattern index, its ecological significance, and interpretations are shown in Table 2.
Subsequent spatial analyses were performed using ArcGIS 10.8 to identify areas of high fragmentation and low connectivity. These spatial patterns were then overlaid with transportation networks to evaluate their impacts on landscape pattern changes [39,40,41].


Table 2.
Selection and ecological interpretation of landscape pattern indices.
Table 2.
Selection and ecological interpretation of landscape pattern indices.
| Analytical Scale | Index Name | Ecological Significance | Interpretation in This Study |
|---|---|---|---|
| Landscape Metrics | Shannon’s Diversity Index (SHDI) | Reflects landscape richness and evenness in distribution | Used to assess changes in diversity under different levels of traffic interference [38] |
| Contagion Index (CONTAG) | Indicates spatial aggregation of landscape types; lower values reflect fragmentation | Reveals the spatial disruption of connectivity caused by road networks [42] | |
| Edge Density (ED) | Measures edge length per unit area; higher values indicate fragmentation | Captures the edge effects directly caused by road-induced landscape segmentation | |
| Patch Density (PD) | Number of patches per unit area; also reflects fragmentation | Highlights the patch proliferation associated with road network expansion | |
| Class Metrics | Largest Patch Index (LPI) | Ratio of the largest patch area to total landscape area within a class; reflects dominance. | Measures how road development disrupts dominant landscape patches |
| Cohesion Index (COHESION) | Reflects the physical connectedness of patches within the same class | Evaluates how roads function as ecological barriers and disrupt connectivity | |
| Patch Metrics | Fractal Dimension Index (FRAC) | Reflects the geometric complexity of patch boundaries | Quantifies the irregularity of patch shapes caused by transportation development [43] |
| Proximity Index (PROX) | Measures spatial proximity among patches of the same type | Assesses the isolation effect of roads on species movement and patch adjacency [22] |
3.4. Ecological Security Pattern Construction
Ecological sources were identified using Morphological Spatial Pattern Analysis (MSPA). In addition, the evaluation of ecosystem service importance was comprehensively conducted under the standards of the national land spatial planning “Double Evaluation” framework [44,45]. Combining these results with circuit theory methods, this study can systematically construct the ecological security pattern of Hainan Tropical Rainforest National Park.
3.4.1. Delineation of Ecological Sources
- (1)
- Landscape Pattern Analysis Based on MSPA
MSPA is an image processing technique that employs mathematical morphological principles to identify, measure, and analyze the spatial characteristics of raster images. In this study, the 2023 land use data for Hainan Province was converted into a binary base map for the study area and imported into Guidos 3.0 software, where it was reclassified into seven landscape categories [25,46,47].
Since forests dominate the study area and tend to be concentrated in contiguous patches, they were further subdivided into artificial and natural forests to facilitate the re-extraction of core areas.
Given that traditional land use data cannot effectively distinguish ecological differences between natural and artificial forests, and high-resolution forest type data for 2023 are not yet publicly available, this study used forest type data from 2021 at a 30 m resolution as a substitute. This approach enabled more precise identification of ecologically valuable natural forest patches and prevented the overestimation and excessive aggregation of core areas caused by mixed forest types. Although the forest type data year does not fully correspond to 2023, no large-scale deforestation or afforestation occurred in HTRNP between 2021 and 2023; therefore, the temporal mismatch has a limited impact on the results.
To further support this assumption, we analyzed forest cover data for 2010, 2015, and 2020 [24], which shows a gradual but slowing decline in the proportion of natural forests in the study area: from 51.86% in 2010 to 44.71% in 2020 [48]. Given the slowing rate of change over the past decade, it is reasonable to assume that the change in forest cover between 2021 and 2023 was minimal. Furthermore, insights from local experts and scholars, as well as interviews with staff members of the Hainan Tropical Rainforest National Park, indicate that the transition from artificial forests to natural forests is a complex and slow process, which further supports the assumption that no significant land cover changes occurred from 2021 to 2023 [24]. Furthermore, expert interviews and local ecological reports consistently emphasize that this transformation typically spans a decade or longer, further verifying the assumption that the short-term changes were minimal from 2021 to 2023.
- (2)
- Evaluation of Ecosystem Service Importance
Ecological source areas are critical regions within ecosystems that support species dispersal and uphold the continuity of ecological processes and functions. They provide essential ecological services and serve as important spatial units for maintaining landscape patterns and ensuring regional ecological security [49,50].
In this study, the importance of ecosystem service functions in the study area was comprehensively assessed based on the Technical Guidelines for the Evaluation of Resource and Environmental Carrying Capacity and the Suitability of Territorial Space Development and related research [9,25,51]. The evaluation system focuses on three core ecological services: water conservation, soil and water retention, and biodiversity protection. Corresponding quantitative evaluation models were developed for each service to quantify the role intensity of ecological spaces in ecological processes and to determine their protection priority.
The water conservation capacity index was calculated using the following equation:
where represents the water conservation service capacity index; denotes the multi-year average net primary productivity of vegetation; is the soil infiltration capacity factor; is the multi-year average precipitation factor; and refers to the slope factor.
The soil retention capacity index was computed as follows:
where is the soil retention service capacity index; is the soil erodibility factor, derived from the wind erosion equation; and and are defined as above.
The biodiversity conservation capacity index was determined as follows:
where indicates the biodiversity conservation service capacity index; and refer to the multi-year mean temperature and elevation factors, respectively; and and retain their previous definition [52].
All raster-based indicators were subsequently reclassified and assigned standardized values. These layers were then integrated into a new composite raster representing the spatial importance of ecosystem services. The resulting raster output was clipped using a spatial mask and filtered to retain only the highest priority zones, which were ultimately designated as the core ecological source areas [42,53].
3.4.2. Construction and Correction of the Ecological Resistance Surface
- (1)
- Ecological Resistance Surface
Species migration and dispersal are essential components of ecosystem functioning and are highly influenced by land cover and human disturbances. Constructing an ecological resistance surface and identifying ecological corridors are critical steps in delineating an ecological security pattern [54].
In this study, commonly used natural factors—including land use type, elevation, and slope—were chosen to construct the basic ecological resistance surface [25,55,56]. These factors greatly affect species movement routes and dispersal patterns. The resistance coefficients and the weights of different factors are shown in Table 3.

Table 3.
Ecological resistance coefficient [25] and baseline weights.
To better measure human disturbance intensity, the Human Settlement Index (HSI) was incorporated [57]. This composite index integrates nighttime light data and land use intensity to quantitatively assess the extent of landscape degradation and disturbance caused by human activities throughout the study area.
The natural factors were classified into different levels and assigned corresponding resistance values. To reduce the potential subjectivity in manual resistance assignment, the HSI was employed to adjust the base resistance surface. This adjustment improves the model’s sensitivity to ecological flow by incorporating resistance from both natural and human disturbances.
where represents the normalized nighttime light data; denotes the maximum value of the normalized difference vegetation index (NDVI); and refers to the Human Settlement Index.
The resistance coefficient corrected by the HSI is calculated as follows:
where is the ecological resistance coefficient of grid cell i after correction by the Human Settlement Index; is the Human Settlement Index value of grid cell ; is the mean Human Settlement Index for landscape type associated with cell ; and is the baseline ecological resistance coefficient assigned to landscape type .
- (2)
- Resistance Surface Modification Based on Landscape Pattern Indices
To improve the spatial responsiveness of the ecological resistance surface, this study incorporates landscape pattern indices as factors of disturbance. Eight core indicators representing fragmentation, heterogeneity, and reduced connectivity caused by transportation infrastructure were integrated to construct a modified resistance model that captures spatial structural disturbances [35,57,58].
First, a global analysis was performed using ordinary least squares regression (OLS) to assess relationships among variables. The variance inflation factor (VIF) was calculated to detect multicollinearity, and core variables with high representativeness and low redundancy were retained. To further reduce dimensionality, principal component analysis (PCA) was applied to the selected indicators. Component selection follows the Kaiser criterion (eigenvalue > 1), with a cumulative interpretation variance threshold of approximately 70%, ensuring that the principal components capture most of the information contained in the original variables. Principal component analysis transforms multiple related variables into orthogonal principal components, effectively reducing redundancy while maintaining the original information structure. This method helps to alleviate collinearity and facilitates subsequent spatial modeling.
Following PCA, a geographically weighted regression (GWR) model was constructed. The comprehensive resistance surface was set as the response variable, with the principal components (PC1 and PC2) as explanatory variables. An adaptive Gaussian kernel was used, and the optimal bandwidth was determined using the corrected Akaike Information Criterion (AICc) to achieve the best local fit. Diagnostic metrics, including local R2 values and residual space autocorrelation, are used to evaluate the explanatory power and stability of the model. The GWR model captured local spatial variability in the relationships between landscape patterns and resistance, revealing spatial differences in traffic disturbance intensity across regions. Finally, predicted GWR values were converted to raster format and used as resistance correction coefficients. These were overlaid on the original resistance surface to generate a spatially heterogeneous comprehensive resistance model. This integrative method—combining landscape indices, PCA, and GWR—extends the resistance surface from static ecological factors to dynamic spatial structural perception, enhancing its sensitivity and adaptability to traffic disturbance effects.
As a stationary baseline, we fitted a global OLS using the retained landscape-metric components to explain the comprehensive resistance and computed standard diagnostics (AICc, R2, F), heteroskedasticity and normality tests (Koenker–BP; Jarque–Bera). Given evidence of heteroskedasticity, inference was based on heteroskedasticity-robust standard errors. (These diagnostics provide the baseline for comparison with GWR and are reported in Section 4.3.2).
3.4.3. Extraction and Identification of Ecological Corridors Based on Circuit Theory
Circuit theory, inspired by the random walk behavior of electrons in electrical circuits, provides an effective framework for simulating species movement across landscapes. Ecological corridors play a vital role in maintaining energy flows and landscape connectivity within ecosystems and are essential components of ecological security networks [21,59]. In this study, we employed the “Build Network and Map Linkages” module from the “Linkage Pathways” toolbox in ArcGIS 10.8 software to compute least-cost paths and identify key ecological corridors.
3.4.4. Spatial Conflict Identification Between Transportation Networks and Ecological Security Patterns
To find spatial conflicts between transportation infrastructure and ecological corridors, a GIS-based overlay analysis was conducted between the identified corridors and both existing and planned transportation networks. Particular attention was given to areas where corridors intersect, overlap with, or are situated close to roads, from which critical conflict nodes and interference zones were extracted.
During the conflict identification process, emphasis was placed on whether ecological corridors exhibited narrowing, fragmentation, or detour patterns when crossing high-intensity traffic routes such as expressways and national or provincial roads [60,61]. Additionally, spatial patterns of transportation-induced ecological resistance were analyzed to detect potential conflict zones and sensitive nodes within the broader ecological security pattern [43].
In summary, the methodological framework combines multi-phase land use analysis, landscape pattern quantification, resistance surface modeling, and ecological corridor identification. This integrative approach enables the assessment of landscape responses under varying transportation scenarios and supports the construction of a spatially adaptive ecological security pattern.
4. Results
4.1. Spatiotemporal Changes in Land Use Types and Intensity
Land use patterns in 2003, 2013, and 2023 are shown in Figure 2. Based on these data, land use transitions for the periods 2003–2013 and 2013–2023 were quantified and visualized through transfer maps (Figure 3) and transfer matrix chordal graphs (Figure 4). These results reveal not only the structural characteristics of land conversions, such as the magnitude and direction of transitions among land categories, but also the temporal dynamics of change, captured through the land use dynamic index (K). Accordingly, the following subsections present the characteristics of land use transitions and the rates and intensities of land use dynamics.
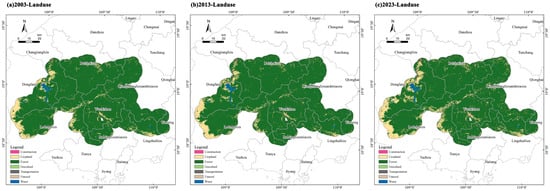
Figure 2.
Land use map from 2003 to 2023.
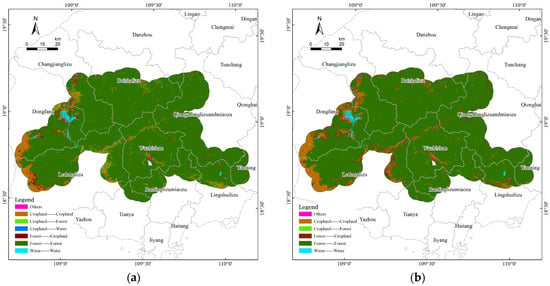
Figure 3.
(a) 2003–2013 land use transfer map; (b) 2013–2023 land use transfer map.
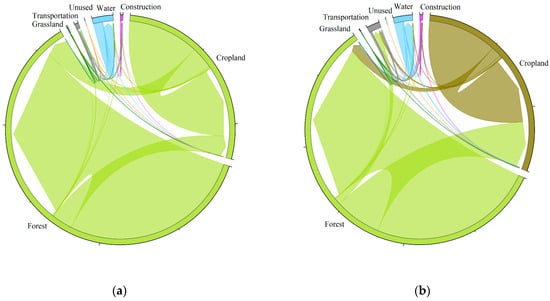
Figure 4.
(a) 2003–2013 land use transfer matrix chordal graph; (b) 2013–2023 land use transfer matrix chordal graph.
- (1)
- Characteristics of Land Use Change
During the first decade, forest resources remained relatively stable, yet localized conversions were evident. Approximately 134.99 km2 of forest was converted to cropland, indicating persistent agricultural encroachment along forest edges, while 145.32 km2 of cropland was reforested, likely due to the implementation of reforestation or land retirement policies. Construction and transportation land expanded modestly (2.92 km2 and 8.16 km2, respectively), but their spatial clustering around urban fringes and corridors indicates early stages of infrastructure-driven landscape fragmentation.
In the second decade, the conversion of forests into cropland intensified, with 335.56 km2 lost compared to 73.47 km2 of cropland restored. Cropland thus became the dominant “recipient” of land transitions, while built-up and transportation land steadily encroached upon both cropland and forests. The cumulative effect of these shifts points to a structural reallocation of land resources from ecological to production and infrastructure functions.
- (2)
- Changes in Land Use Dynamics
The land use dynamic index (K) reflects the degree of acceleration of these processes. As shown in Figure 5, cropland showed a positive growth trend, with the land use dynamic index (K) shifting from −0.35% in the first decade to 4.17% in the second. Forests, initially stable, experienced a decline rate of −0.38% in the later period, indicating increased pressure on forest conservation. Grassland decreased rapidly throughout this study (K = −3.03% to −8.01%), reflecting worsening ecological vulnerability. Meanwhile, construction land exhibited steady growth, while transportation land showed the highest dynamic intensity, reflecting rapid infrastructure expansion and urbanization.
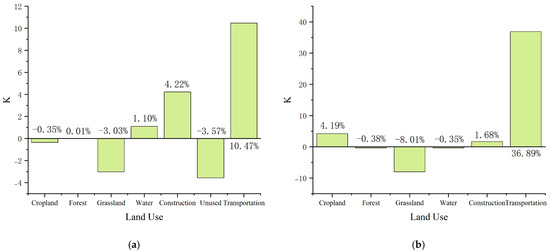
Figure 5.
(a) 2003–2013 land use dynamic degree; (b) 2013–2023 land use dynamic degree.
These dynamic patterns emphasize that the pace of land use transition is accelerating, with transportation infrastructure exerting the strongest and most immediate impacts on the tropical rainforest ecosystem. This contrasts with the structural analysis presented in the previous subsection, which focused on the absolute magnitude and direction of land conversions.
4.2. Spatiotemporal Variation in Landscape Pattern Indices
Based on landscape pattern data from three periods, this study compares changes in landscape indices under three transportation disturbance scenarios (as shown in Table 4 and Figure 6): no transportation, overlay of highway and railway networks only, and overlay of a comprehensive transportation network including roads, bridges, and tunnels. The results reveal a clear gradient effect of transportation infrastructure development on the landscape patterns of tropical rainforest ecosystems.

Table 4.
Table of changes in landscape pattern index from 2003 to 2023.
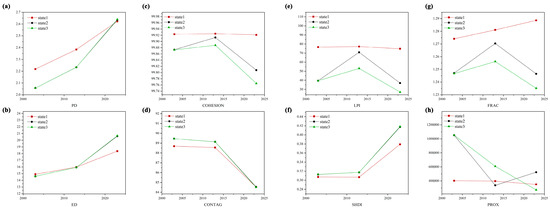
Figure 6.
Landscape pattern index change under three states from 2003 to 2023. (a) PD, (b) ED, (c) COHESION, (d) CONTAG, (e) LPI, (f) SHDI, (g) FRAC, (h) PROX over time for states 1, 2, and 3.
- (1)
- Landscape Fragmentation and Low Connectivity
Fragmentation metrics, including Patch Density (PD) and edge density (ED), increased from 2003 to 2023, suggesting intensified fragmentation (Figure 6). The expansion of the transportation network contributed to local increases in fragmentation, particularly near bridges and tunnels. At the same time, the Contagion Index (CONTAG) showed a consistent decline, indicating reduced landscape connectivity in these areas. These trends reflect measurable structural changes rather than implying a complete loss of habitat integrity.
- (2)
- Dominant Landscape and Spatial Configuration Evolution
The decrease in the Largest Patch Index (LPI) and Cohesion Index (COHESION) points to a subdivision of larger core patches into smaller patches, with a corresponding weakening of spatial aggregation. Nevertheless, the ecological system still maintains a degree of structural resilience, as indicated by the moderate decline in cohesion.
- (3)
- Landscape Heterogeneity and Morphological Complexity
An increase in the Shannon Diversity Index (SHDI), combined with a decrease in Fractal Dimension (FRAC), reflects a rise in landscape heterogeneity alongside a trend toward more regular patch shapes. The isolation effect of transportation elements is further evidenced by fluctuations in the Proximity Index (PROX), with the most pronounced barrier effects observed in areas surrounding tunnels and bridge crossings. Overall, transportation development appears to enhance landscape heterogeneity at the regional scale while simplifying patch geometry at the local scale.
- (4)
- Spatiotemporal Comparison of Landscape Metrics
By comparing landscape pattern variations under different transportation overlay states within the same period, this study reveals that transportation networks exert a gradient-like influence on the landscape patterns of HTRNP. The box plot (Figure 7) shows that the dispersion of indices widened substantially in 2023 under the comprehensive network overlay, reflecting a “polarization” effect in which some ecological units degrade rapidly while others remain relatively stable. This spatial divergence highlights the role of road density and intersection topology in producing localized ecological “islands” and edge-dominated zones.

Figure 7.
Box plot of landscape pattern index differences under three states from 2003 to 2023.
High road density and clustered intersections create localized ecological ‘islands’ and edge-dominated zones. Threshold-like responses may occur.
Indices show early buffering followed by connectivity loss as disturbance intensifies (Figure 8). This study confirms the gradual “time lag effect” linked to road construction. Transportation impacts develop over time rather than immediately. Once the critical point is reached, the degradation process will accelerate, which may lead to ecological obstacles. These influences go beyond physical fractures and affect key ecological processes such as species migration and the hydrological cycle.

Figure 8.
Heat maps of landscape pattern index changes from 2003 to 2023 under three states.
Impacts follow a phased progression rather than a linear trend. As pressure intensifies, fragmentation increases and connectivity declines, weakening key functions. This phased understanding provides a theoretical basis for designing ecological buffer zones, implementing green renovations of transportation infrastructure, and optimizing the layout of transportation networks in order to mitigate long-term ecological risks.
4.3. Construction of the Ecological Security Pattern
4.3.1. Identification of Ecological Sources
Based on Morphological Spatial Pattern Analysis (MSPA) and an integrated assessment of ecosystem service importance, ecological sources were extracted to ensure that selected patches possess high habitat quality and functional significance.
- (1)
- Ecological Sources Analysis Based on MSPA
According to the preliminary MSPA results based on 2023 land use data, core structures dominate approximately 85% of the study area, forming a single, expansive, and contiguous ecological patch; however, this apparent integrity masks fine-scale vulnerabilities along transportation corridors where edge proliferation erodes functional continuity. To improve spatial granularity, forest types were reclassified with natural forests as foreground and plantation forests as background, allowing for the differentiation of ecological patches based on vegetation composition (Figure 9). This reclassification exposes functional contrasts relevant to connectivity: natural forests act as permeability backbones, whereas plantations contribute to localized resistance and potential pinch points.
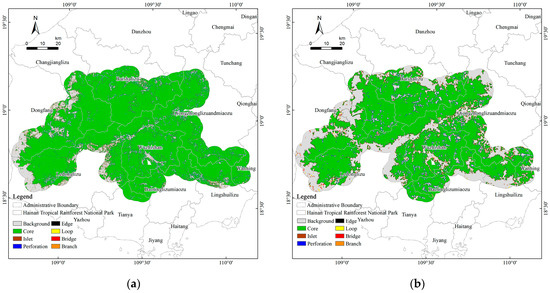
Figure 9.
(a) The MSPA identifies landscape types based on land use; (b) the MSPA identifies landscape types based on the classification of natural and artificial forests.
The advantage of this core structure indicates that the mountain rainforest ecosystem remains relatively intact on a macroscopic scale, but the differences between natural forests and artificial forests reveal fine-scale heterogeneity that may affect ecological functions. This difference provides a more realistic basis for identifying the true sources that maintain biodiversity and the resilience of ecosystems.
- (2)
- Evaluation of Ecosystem Service Importance
The spatial distribution of ecosystem service importance—specifically, water conservation, soil retention, and biodiversity maintenance—exhibited distinct patterns.
Evaluation results of the Importance of Ecosystem Functional Services are shown in Figure 10. Water conservation showed a general east–west gradient, with high-value zones concentrated in the central and southeastern areas; soil retention displayed relatively high values across the study area, with a mosaic of medium to high importance classes, while low-value areas were primarily located at the periphery and along major transportation corridors in the northeast–southwest; biodiversity conservation was strongest in the south, with higher values in the central region and lower values toward the east and west.
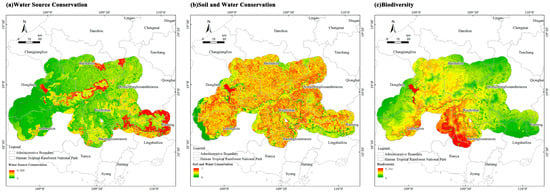
Figure 10.
Evaluation of the importance of ecosystem functional services.
We selected the top 50% (validated with wildlife data) and note that corridor design should integrate hydrology and biodiversity (Figure 11).

Figure 11.
The importance of functional services in patch ecosystems. (The numbers (1 to 26) in the figure represent 26 different ecological patches within the study area).
- (3)
- Results of Ecological Source Identification
A total of 28 core ecological sources were identified (Figure 12), primarily distributed across the mountainous rainforest regions of Wuzhishan, Baoting, and Qiongzhong. These sources are spatially contiguous, possess high ecological quality, and collectively cover key components of the central Hainan Island montane rainforest ecosystem and major water conservation zones. Their concentration in central mountainous regions highlights the influence of topography and precipitation gradients in maintaining ecosystem integrity. In contrast, the relative scarcity of sources in eastern lowlands suggests heightened exposure to road-induced edge effects and settlement expansion, and should be prioritized for riparian buffer reinforcement, reforestation of plantation margins, and routing constraints on new transport links.
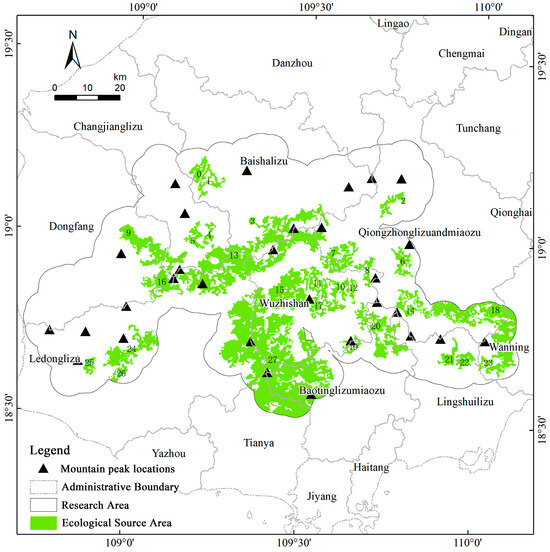
Figure 12.
Spatial distribution map of ecological source areas. (The numbers represent 26 patches within the study area).
4.3.2. Identification Results of the Integrated Resistance Surface
- (1)
- Integrated Resistance Surface
The initial ecological resistance surface was created using three natural factors: land use type, elevation, and slope. The resulting spatial distribution showed notable variation across different land use types. After applying corrections using the HSI, differences were observed in the resistance coefficients for each land use type (Figure 13). Notably, high-resistance zones were found to shift from the central high-altitude regions toward the southwest. These high-resistance areas were spatially extensive, characterized by intensive development, high levels of urbanization, and concentrated human activities, associated with reduced ecological connectivity and disrupted material exchanges. This transformation indicates that human interference—not topography—has become the dominant driver of ecological resistance, implying that mitigation should target anthropogenic gradients (urban clusters, arterial corridors) rather than elevation alone. Anthropogenic drivers are prioritized in resistance modeling.
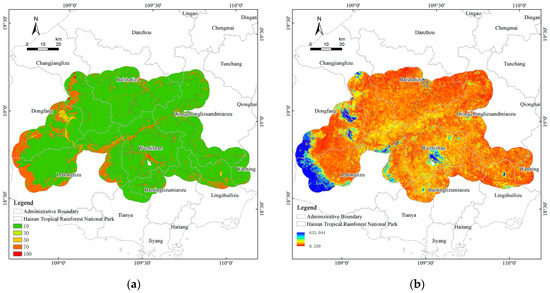
Figure 13.
(a) Basic resistance surface; (b) the HSI-corrected resistance surface.
- (2)
- Landscape Pattern Index Selection and Dimension Reduction
Eight landscape pattern metrics were initially selected for resistance correction. Multicollinearity testing via the variance inflation factor (VIF) led to the exclusion of PD, ED, SHDI, and COHESION due to high VIF values. The remaining four—CONTAG, LPI, PROX, and FRAC—were retained for subsequent modeling.
Principal component analysis (PCA) was performed to reduce dimensionality and avoid variable redundancy. The Kaiser–Meyer–Olkin (KMO) measure was 0.6 (>0.5), and Bartlett’s test of sphericity was significant (χ2 = 74.460, p < 0.001), indicating that the data were suitable for PCA. Two principal components (PC1 and PC2) with eigenvalues exceeding 1.0 were extracted, together explaining 76.7% of the total variance. PC1 reflected fragmentation and spatial adjacency; PC2 represented core patch dominance and cohesion. Operationally, high PC1 loadings flag fragmentation-pressure hotspots where corridor routing should avoid or require crossings, while high PC2 loadings delineate backbone zones that corridors should anchor to in order to maintain low-cost movement. The eigenvalues and variance explained by each component are summarized in Table 5, and the factor loadings of the four retained metrics are reported in Table 6. The loadings and validation results of the four selected landscape pattern indices are shown in Table 6 and Figure 14.

Table 5.
Principal component eigenvalues and variance contribution rates.

Table 6.
The rationality test of the landscape pattern index.
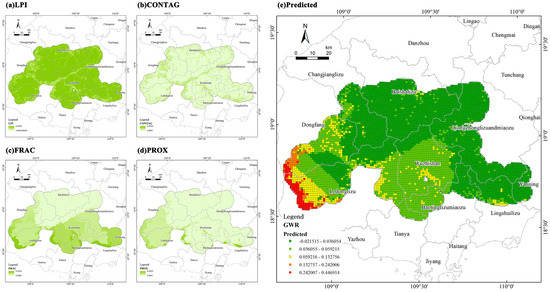
Figure 14.
Analysis of the landscape pattern on the resistance surface.
In addition to statistical suitability, the selection of these indices also highlights two key ecological processes: resistance driven by fragmentation (PC1) and connectivity driven by dominance (PC2). This indicates that ecological resistance is not only influenced by the structural attributes of patches but also by the spatial hierarchy between patches, which provides a more comprehensive perspective for explaining connectivity.
- (3)
- Spatial Modeling with Geographically Weighted Regression
The global OLS baseline achieved R2 = 0.2239 (adj. R2 = 0.2236) with AICc = 86,020.98, and a significant overall F statistic. Koenker’s heteroskedasticity test was significant (χ2 = 1628.00, p < 0.001), and the Jarque–Bera test indicated residual non-normality (JB = 95,757.16, p < 0.001); inference was therefore based on heteroskedasticity-robust standard errors. Multicollinearity was negligible (VIF ≈ 1.28–1.31). Under robust inference, PROX (b = 78.67, p < 0.001) and FRAC (b = 29.67, p < 0.001) were positively associated with the comprehensive resistance, whereas CONTAG was not significant (p = 0.939), and LPI lost significance (p = 0.247). For interpretability, the OLS baseline used the constituent indices, while the GWR specification employed the two orthogonal PCA components to mitigate collinearity and stabilize local estimates.
We used GWR with an adaptive Gaussian kernel (AICc-selected bandwidth) to model spatially varying links between the two PCA components and resistance. Diagnostics (local R2 and residual spatial autocorrelation) indicated moderate but highly heterogeneous explanatory power concentrated in fragmented or sensitive zones. We superimposed the GWR surface on the baseline to produce a more sensitive resistance raster. It highlights high-resistance edges, transport corridors, and coastal zones, while low resistance concentrates in contiguous forests. Moreover, the spatially varying GWR coefficients reveal that positive loadings of PC1 (fragmentation and edge density) correspond to increased ecological resistance in disturbed zones, while negative loadings of PC2 (core patch dominance and aggregation) indicate that larger, contiguous forests mitigate resistance locally. Practically, sites with high PC1 and low PC2 values coincide with the most acute connectivity risks and should be prioritized for wildlife passages, canopy bridges, or speed-management interventions.
To assess robustness, we used two diagnostics. First, we benchmarked the non-stationary GWR against the stationary OLS baseline (see Table S2): spatial non-stationarity proved substantive rather than a modeling artifact, with mean local R2 = 0.126 (range 0.001–0.535) concentrated in fragmented or sensitive zones (Table 7). Second, the corrected resistance raster preserved the large-scale contrast between core forest blocks and transportation corridors, while enhancing local heterogeneity at patch edges. This consistency across scales suggests that the main resistance contrast which elevated values along transportation corridors and reduced values within core forests remains stable under both stationary and non-stationary formulations (Figure 15).

Table 7.
Descriptive statistics of GWR coefficients (PC1, PC2) and local R2 values.
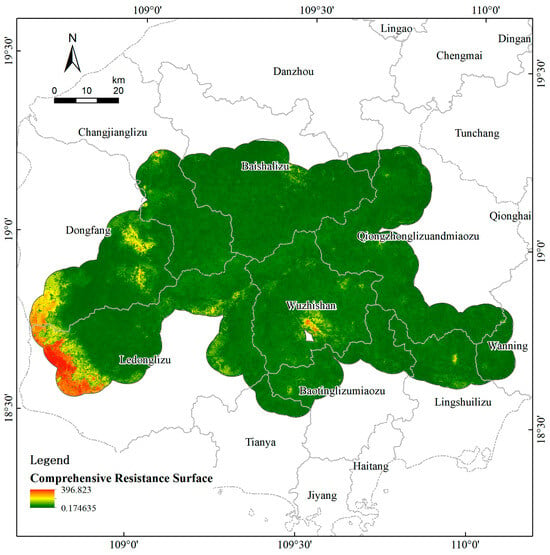
Figure 15.
The comprehensive resistance surface of the landscape pattern index correction.
4.3.3. Ecological Corridor Delineation
- (1)
- Identification of Key Ecological Corridors
Key ecological corridors connecting ecological source areas were identified using the Linkage Mapper tool, which enabled the creation of a regional-scale ecological network. A total of 64 ecological corridors linking 28 ecological source areas were delineated based on the identification of these sources and a comprehensive resistance surface. Modeled current flows indicate that connectivity is disproportionately maintained by a subset of corridors, implying vulnerability to single-point failures and the need to designate these links as protection priorities. This network effectively connects fragmented source patches, supporting the continuity and spatial integrity of ecological processes (Figure 16).
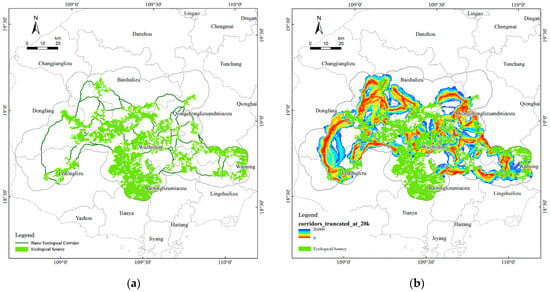
Figure 16.
(a) Research regional ecological corridor network; (b) ecological corridors truncated at 20 km.
This configuration not only provides a solid foundation for the ecological security framework but also offers a scientific basis for establishing ecological redlines, guiding ecological spatial governance, and developing targeted ecological restoration strategies within the framework of national territorial planning. Given their alignment with river valleys, riparian buffers and setback rules along these corridors would yield high returns by simultaneously protecting biodiversity movement and hydrological regulation. River valleys, as dual carriers of biodiversity and ecological flow, should be protected.
- (2)
- Identification of Conflict Zones Between Corridors and Transportation Networks
Based on the identified connectivity pathways, the 2023 transportation network was overlaid to detect potential ecological conflict points arising from intersections between ecological corridors and roads. These conflict points (Figure 17) are distributed across a wide area, with a concentration along the “Wuzhishan–Qiongzhong–Baoting” corridor, extending eastward to Wanning. A considerable number of these points occur within essential ecological corridors, potentially threatening regional ecological connectivity. The aggregation of conflicts along the east–west axis indicates that the main roads have become structural obstacles, and the north–south connections are fragmented. Priority measures include wildlife over or under-passes at clustered conflict nodes, fencing with guided crossings on high-speed segments, and speed-management or lane-narrowing where grade-separation is infeasible.
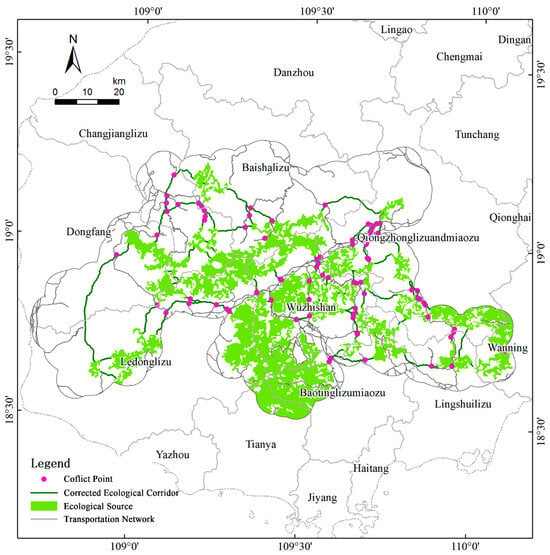
Figure 17.
Research on the distribution map of regional ecological conflict points.
- (3)
- Comparison of Ecological Corridor Identification Results Based on Different Resistance Surfaces
To evaluate the influence of landscape pattern index correction on ecological corridor delineation, connectivity pathway simulations were performed using both the original and the corrected resistance surfaces, under a consistent ecological source framework. Key corridor metrics were compared to assess differences. Although the spatial distributions of corridors derived from both resistance surfaces exhibited high overlap, core ecological connectivity indicators demonstrated (as shown in Figure 18 and Table 8) that the corrected resistance surface substantially improved ecological connectivity and path optimization. Notably, overlap occurs mainly in backbone routes, whereas divergence concentrates at edge-dominated zones—precisely where landscape indices indicate heightened fragmentation—underscoring the value of the corrected surface for targeting fine-scale mitigation.
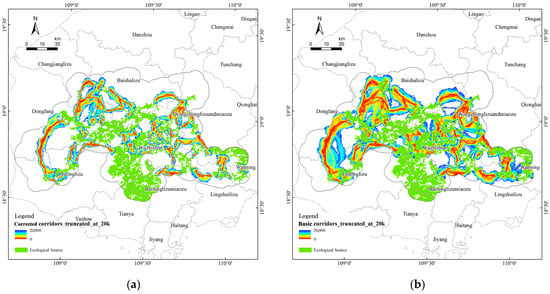
Figure 18.
Ecological corridors truncated at 20 km based on original resistance surface (a) and based on modified resistance surface incorporating landscape pattern indices (b).

Table 8.
Ecological corridor path efficiency metrics table.
Compared to the original model, the corrected resistance surface reduced the minimum connectivity cost by 48.05%, decreased path tortuosity (CWD/Euclidean ratio from 16.30 to 8.47), and lowered per-unit corridor cost from 11.61 to 6.03. These improvements highlight greater accessibility and ecological efficiency.
While the general spatial alignment of corridors remained consistent, the corrected resistance model more accurately highlighted ecological passage risks in regions characterized by high fragmentation and pronounced edge effects. Consequently, it significantly optimized the cost-efficiency of ecological processes simulation while maintaining core corridor alignments. This outcome demonstrates that including landscape indices allows the model to capture subtle fragmentation effects overlooked by uncorrected surfaces, thereby preventing the underestimation of ecological costs in heavily disturbed landscapes.
4.3.4. Results of Ecological Security Pattern Construction
As shown in Figure 19, based on the comprehensive resistance surface adjusted by landscape pattern indices and classified using the natural breakpoint method, the study area was divided into three resistance levels: low, medium, and high. Low-resistance zones are mainly concentrated in the natural forest core, closely corresponding to the spatial distribution of ecological source areas, which indicates high ecological connectivity and intact landscape structure. Medium-resistance zones are mainly distributed in agro-forest transition areas, where ecological functions are present but ecological stability is compromised due to the combined effects of transportation infrastructure and edge effects. High-resistance zones are concentrated in eastern coastal urban clusters and along major roads, characterized by severe ecological fragmentation, representing primary barriers to species migration and ecological process continuity. The coincidence of high-resistance areas with urban clusters illustrates that anthropogenic pressures increasingly outweigh natural gradients, emphasizing the need to integrate urban expansion control into ecological planning.
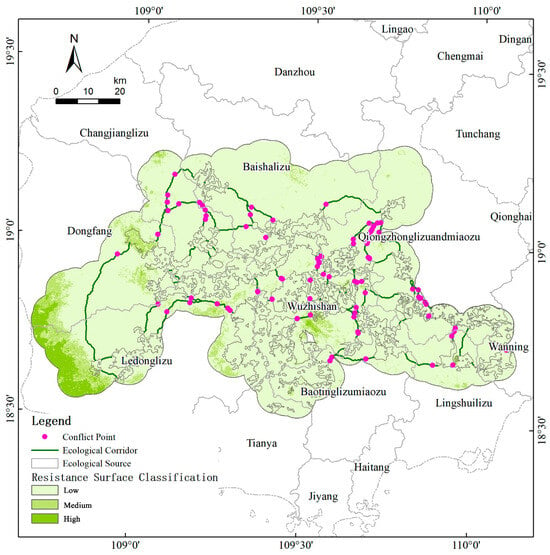
Figure 19.
Ecological security pattern map.
Based on the modified resistance surface, 64 key ecological corridors totaling 515 km were delineated. Numerous corridors intersect with major highways such as the G9811 and the eastern part of G98, creating multiple typical ecological conflict nodes. These nodes are mainly located at the boundaries between medium- and high-resistance zones, where resistance gradients display abrupt changes, local ecological sensitivity is elevated, and ecosystems are vulnerable to anthropogenic disturbances. Such areas should be prioritized for ecological restoration and conflict mitigation. Targeted interventions at these transition zones would yield disproportionate ecological benefits, as they serve as pressure points where small-scale restoration could unlock large-scale connectivity improvements.
Comparison of corridor identification results from different resistance surfaces shows that, although the overall corridor alignments remain stable, the modified resistance model substantially reduces ecological travel costs and enhances corridor efficiency. Taken together with the corridor-cost improvements and spatial diagnostics, these results indicate that the corrected resistance surface provides a more decision-ready basis for routing constraints and restoration targeting than the uncorrected baseline. Beyond methodological improvement, this validation indicates that future ecological network planning can rely on corrected resistance surfaces to balance realism and efficiency, thereby strengthening the applicability of ecological security patterns in territorial spatial governance [62].
5. Discussion
This study confirmed that transportation-induced fragmentation can be effectively captured by integrating landscape metrics into resistance modeling. To enhance clarity and interpretive depth, the discussion is organized into four subsections.
5.1. Fragmentation Captured by Landscape Metrics and Resistance Modeling
Key landscape metrics, such as increased PD and ED, alongside declines in CONTAG and LPI, indicate growing fragmentation and diminished structural integrity. The corrected resistance surface, informed by PCA and GWR, better captured edge fragmentation and connectivity bottlenecks, improving corridor delineation precision. By moving beyond static resistance values, the use of GWR accounted for spatially varying relationships between landscape structure and ecological constraints. This non-stationary modeling approach demonstrated improved explanatory power—particularly in disturbed or transitional areas—and aligned well with known ecological stress zones. The process of correcting the resistance surface significantly reduced the tortuosity of least-cost paths and minimized the cumulative ecological migration costs. This confirms the advantages of integrating spatial structure into resistance modeling.
These fragmentation trends not only reflect structural alterations of the landscape but also signal potential declines in key ecosystem services, including habitat availability, hydrological regulation, and biodiversity maintenance. By linking resistance surfaces to ecological function rather than configuration alone, the approach advances toward a more functional understanding of connectivity in tropical rainforest ecosystems. This indicates that fragmentation in Hainan is not merely a structural phenomenon but reflects underlying threshold dynamics that constrain ecosystem functionality.
5.2. Comparison with Global Practices
Comparative studies in other tropical regions, such as the Amazon and Southeast Asia, have reported similar impacts of infrastructure on habitat connectivity and landscape fragmentation. For instance, road expansions in Borneo and Sumatra have been proven to trigger widespread edge effects and the loss of biodiversity. Comparable evidence from other island ecosystems, including Madagascar and the Philippines, further demonstrates that road expansion can accelerate isolation of forest patches and necessitates corridor-based conservation planning [14,15]. These similarities emphasize the broad relevance of resistance modeling based on landscape information and its potential applicability in different tropical ecosystems. Although global case studies have highlighted the prevalence of transportation-driven fragmentation, the context of Hainan has emphasized the particular vulnerability of island rainforests [63,64], whose limited spatial scope has magnified the loss of connectivity. This indicates that the resistance-based model can not only be used for corridor division but also serves as a decision support tool for balancing the protection and development of tropical biodiversity hotspots. Thus, Hainan provides a critical testing ground for assessing the limits of connectivity in insular tropical rainforests, complementing global continental cases.
5.3. Limitations and Directions for Future Validation
Despite the progress made, several limitations still exist.
First, this study relies primarily on structural proxies such as land cover and landscape configuration to model resistance, without empirical validation of species movement. Future research should incorporate wildlife tracking (e.g., GPS collars), camera trapping, drone-based monitoring, or field surveys to assess the functional connectivity of corridors. Similar approaches have been successfully applied in Borneo and Sumatra to reveal road impacts on faunal dispersal and forest structure, suggesting that such data could significantly strengthen the validation of corridor models in Hainan.
Second, the PCA-GWR model, while improving spatial detail, remains deterministic and linear. Machine learning approaches (e.g., random forests or neural networks) may provide greater flexibility and capture nonlinear relationships between landscape features and resistance. Additionally, although land cover data used for the 2023 analysis were derived from 2021 datasets, it takes a long time for artificial forests to revert to natural rainforests through natural succession. And there is currently little research on this aspect of Hainan’s tropical rainforests, nor have effective measures been taken for ecological restoration in this regard. It is sufficient to conclude that the time lag in the data can be disregarded. Nonetheless, future analyses should include updated data and sensitivity testing to confirm model robustness.
Third, a sensitivity analysis of resistance assignments was not conducted due to data and scope constraints. Thus, the resistance values used here should be regarded as literature-informed estimates rather than empirically validated parameters. Future work could refine these assignments through local field data, expert elicitation, or cross-study validation.
5.4. Identification of High-Risk Zones and Management Implications
Local GWR results identified high-risk areas along fragmented patch edges, transport corridors, and coastal belts, with resistance hotspots on the eastern slopes of Wuzhishan and near Limu Mountain, and within the Qiongzhong–Baoting corridor. Additional sensitive zones were observed along the eastern coastal development belt, where intensive land conversion and transportation pressure exacerbate ecological resistance. From a management perspective, several practical strategies are recommended:
- (1)
- Optimize Road Alignment to Avoid Core Ecological Areas and Key Corridors
Future planning should integrate ecological sources and corridors into the preliminary route selection process, strictly avoiding ecologically sensitive zones with high connectivity and biodiversity [65]. Where crossing is unavoidable, design solutions such as edge bypasses, tunnels, or bridges should be prioritized to minimize habitat fragmentation and ecological process disruption.
- (2)
- Establish Ecological Buffer Systems to Maintain Corridor Continuity
Structural buffers should be deployed—such as culverts, overpasses, and reforested strips—around transport corridors, especially in high-conflict areas, to restore vertical connectivity and mitigate edge effects, as reflected in improved connectivity indices under intensive disturbance scenarios [66,67].
- (3)
- Hierarchical Ecological Restoration for Network Resilience
Core ecological sources in low-resistance zones should be strictly protected from development. In medium-resistance zones, artificial forests can be converted to near-natural ecosystems, and ecological agricultural corridors can be established to strengthen connectivity. In high-resistance zones, urban renewal and transport reforms should integrate ecological nodes and vertical greening to mitigate barrier effects.
- (4)
- Strengthen Integrated Governance of Transportation and Ecology for Fine-Scale Spatial Management
Cross-sectoral planning mechanisms that anticipate transport expansion while protecting ecological integrity should be developed [68]. Remote sensing and spatial big data should be used to dynamically monitor ecological–infrastructure interactions and guide adaptive policy, zoning, and restoration interventions [2,13].
6. Conclusions
This study demonstrates that integrating landscape indicators into resistance modeling provides an effective framework for identifying ecological corridors under transportation-induced fragmentation. The PCA–GWR approach enhances spatial sensitivity, reduces corridor tortuosity, and more accurately reflects the ecological constraints of the tropical rainforest landscape in Hainan.
Beyond methodological advancement, the findings have broader implications. First, they underscore the dual role of transportation networks as both drivers of fragmentation and potential targets for ecological integration, highlighting the importance of incorporating ecological considerations into infrastructure planning. Second, the proposed framework serves as a transferable tool for ecological security pattern construction, offering a scientific basis for reconciling conservation and development in tropical national parks and other biodiversity hotspots. Finally, by linking corridor delineation with management strategies, this study contributes to policy-oriented approaches that emphasize avoidance, buffering, and hierarchical restoration as complementary pathways to strengthen landscape resilience.
Supplementary Materials
The following supporting information can be downloaded at: https://www.mdpi.com/article/10.3390/f16091393/s1, Table S1: Data layers, roles, and theory-driven rationale; Table S2: OLS baseline diagnostics and robust inference; Table S3: Workflow summary of data processing and analysis.
Author Contributions
Conceptualization, L.Y., Y.P., and G.Z.; methodology, L.Y., Y.P., and G.Z.; software, L.Y.; validation, Y.P., F.Y., and J.F.; formal analysis, L.Y. and X.Z.; investigation, L.Y. and Y.P.; resources, L.Y., Y.P., F.Y., and J.F.; data curation, L.Y. and Y.P.; writing—original draft, L.Y.; writing—review and editing, L.Y., Y.P., and G.Z.; visualization, L.Y.; supervision, G.Z. and X.Z.; project administration, G.Z. and F.Y.; funding acquisition, G.Z. and J.F. All authors have read and agreed to the published version of the manuscript.
Funding
This work was supported by the National Natural Science Foundation of China (No. 42471119), the Hainan Provincial Transportation Technology Project (HNJTT-KXC-2024-2-27-01), the Humanities and Social Science Fund of the Ministry of Education of China (No. 24YJAZH245) and the Gansu Provincial Science and Technology Program Project (No.25ZYJA015).
Data Availability Statement
Data will be made available on request.
Conflicts of Interest
The authors declare no conflicts of interest.
Abbreviations
The following abbreviations are used in this manuscript:
| HTRNP | Hainan Tropical Rainforest National Park |
| PD | Patch Density |
| ED | Edge Density |
| CONTAG | Contagion Index |
| SHDI | Shannon Diversity Index |
| LPI | Largest Patch Index |
| COHESION | Cohesion Index |
| FRAC | Fractal Dimension |
| PROX | Proximity Index |
| MSPA | Morphological Spatial Pattern Analysis |
| HSI | Human Settlement Index |
| MCR | Minimum Cumulative Resistance |
| OLS | Ordinary Least Squares |
| VIF | Variance Inflation Factor |
| GWR | Geographically Weighted Regression |
| PCA | Principal Component Analysis |
References
- Zang, Z.; Ouyang, Z.; Xu, W.; Du, A. Improve the procedures for the creation and establishment of national parks, and promote the construction of national parks orderly. Natl. Park 2024, 2, 632–637. [Google Scholar] [CrossRef]
- Li, X. Achieving Integrated Protection in Important Ecological Zones. Natural Resources Management Report, 2021. [Google Scholar] [CrossRef]
- Chen, D.; Zhong, L.; Du, A.; Ouyang, Z. Review on the value assessment of cultural ecosystem services in national park. Acta Ecol. Sin. 2025, 45, 3021–3031. [Google Scholar] [CrossRef]
- Nanyang Forestry Hainan Tropical Rainforest National Park Master Plan (2023–2030). Available online: https://nyslyj.nanyang.gov.cn/2024/05-29/410513.html (accessed on 2 July 2025).
- Watson, J.E.M.; Dudley, N.; Segan, D.B.; Hockings, M. The Performance and Potential of Protected Areas. Nature 2014, 515, 67–73. [Google Scholar] [CrossRef] [PubMed]
- Protected Planet Report 2024. Available online: https://digitalreport.protectedplanet.net (accessed on 2 July 2025).
- Hosaka, T.; Yamada, T.; Okuda, T. Road-Networks, a Practical Indicator of Human Impacts on Biodiversity in Tropical Forests. IOP Conf. Ser. Earth Environ. Sci. 2014, 18, 012092. [Google Scholar] [CrossRef]
- Dinerstein, E.; Joshi, A.R.; Vynne, C.; Lee, A.T.L.; Pharand-Deschênes, F.; França, M.; Fernando, S.; Birch, T.; Burkart, K.; Asner, G.P.; et al. A “Global Safety Net” to Reverse Biodiversity Loss and Stabilize Earth’s Climate. Sci. Adv. 2020, 6, eabb2824. [Google Scholar] [CrossRef]
- Du, L.; Liu, H.; Liu, W.; Wang, H.; Zhang, Y.; Quan, Z. Spatial and Temporal Variation of Water Conservation and Driving Factor Analysis in Tropical Rainforests: A Case Study of Hainan Tropical Rainforest National Park. Res. Environ. Sci. 2023, 36, 1716–1727. [Google Scholar] [CrossRef]
- Forman, R.T.T.; Alexander, L.E. Roads And Their Major Ecological Effects. Annu. Rev. Ecol. Syst. 1998, 29, 207–231. [Google Scholar] [CrossRef]
- Bennett, V.J. Effects of Road Density and Pattern on the Conservation of Species and Biodiversity. Curr. Landsc. Ecol. Rep. 2017, 2, 1–11. [Google Scholar] [CrossRef]
- Laurance, W.F.; Goosem, M.; Laurance, S.G.W. Impacts of Roads and Linear Clearings on Tropical Forests. Trends Ecol. Evol. 2009, 24, 659–669. [Google Scholar] [CrossRef] [PubMed]
- Zheng, X.; Chen, J.; Zou, Z.; Zhen, S.; Liu, S.; Li, J.; Zuo, X.; Lin, S.; Wu, Z.; Zhang, L.; et al. Sprawling Roads Enhanced Tropical Forest Loss during the Period 2001–2020. Commun. Earth Environ. 2025, 6, 218. [Google Scholar] [CrossRef]
- Poor, E.E.; Jati, V.I.M.; Imron, M.A.; Kelly, M.J. The Road to Deforestation: Edge Effects in an Endemic Ecosystem in Sumatra, Indonesia. PLoS ONE 2019, 14, e0217540. [Google Scholar] [CrossRef] [PubMed]
- Ideris, N.; Jaafar, S.; Sukri, R. Impact of Road Construction on Tree Diversity and Forest Structure in an Intact Bornean Mixed Dipterocarp Forest. Reinwardtia 2025, 24, 1–15. [Google Scholar] [CrossRef]
- Xiong, G.; Yang, F.; Wang, T.; He, R.; Li, L. Impact of Road Infrastructure on Wildlife Corridors in Hainan Rainforests. Transp. Res. Part. Transp. Environ. 2025, 139, 104539. [Google Scholar] [CrossRef]
- Wu, T.; Yao, X.; Ren, M. Distribution Pattern of Roads and Its Impact on Landscape Integrity in Hainan Tropical Rainforest National Park. J. Trop. Biol. 2022, 13, 101–111. [Google Scholar] [CrossRef]
- Jia, L.; Yang, S.; Leung, K.W.; Wang, X.; Wang, J.; Hu, J. Amphibian Roadkill Patterns in an Asian Tropical Rainforest. Transp. Res. Part. Transp. Environ. 2024, 136, 104396. [Google Scholar] [CrossRef]
- Chen, L.; Jing, Y.; Sun, R. Urban eco-security pattern construction:targets, principles and basic framework. Acta Ecol. Sin. 2018, 38, 4101–4108. [Google Scholar]
- Haddad, N.M.; Brudvig, L.A.; Clobert, J.; Davies, K.F.; Gonzalez, A.; Holt, R.D.; Lovejoy, T.E.; Sexton, J.O.; Austin, M.P.; Collins, C.D.; et al. Habitat Fragmentation and Its Lasting Impact on Earth’s Ecosystems. Sci. Adv. 2015, 1, e1500052. [Google Scholar] [CrossRef]
- Xu, J.; Chao, B.; Peng, L.; Li, Z.; Zhang, B.; Guo, F.; Bian, F.; Yu, B.; Zou, Q. Ecological Corridor Construction of Hainan Tropical Rainforest National Park. J. Southwest. For. Univ. Sci. 2023, 43, 125–134. [Google Scholar]
- Chen, S.; Fu, H.; Du, Y.; Fu, G.; Chen, J. Landscape Pattern Changes in Hainan Tropical Rainforest National Park between 2015 and 2020. Guihaia 2023, 43, 1688–1699. [Google Scholar]
- Zhang, X.; Wang, L. Study on Ecological Landscape Patterns Along Expressways Based on GIS and Fragstats. J. Green. Sci. Technol. 2023, 25, 234–239. [Google Scholar] [CrossRef]
- Cheng, K.; Yang, H.; Guan, H.; Ren, Y.; Chen, Y.; Chen, M.; Yang, Z.; Lin, D.; Liu, W.; Xu, J.; et al. Unveiling China’s Natural and Planted Forest Spatial–Temporal Dynamics from 1990 to 2020. ISPRS J. Photogramm. Remote Sens. 2024, 209, 37–50. [Google Scholar] [CrossRef]
- Li, Q.; Tang, L.; Qiu, Q.; Li, S.; Xu, Y. Construction of urban ecological security pattern based on MSPA and MCR Model: A case study of Xiamen. Acta Ecol. Sin. 2024, 44, 2284–2294. [Google Scholar] [CrossRef]
- Ma, J.; Li, J.; Wu, W.; Liu, J. Global Forest Fragmentation Change from 2000 to 2020. Nat. Commun. 2023, 14, 3752. [Google Scholar] [CrossRef] [PubMed]
- Brinck, K.; Fischer, R.; Groeneveld, J.; Lehmann, S.; Dantas de Paula, M.; Pütz, S.; Sexton, J.O.; Song, D.; Huth, A. High Resolution Analysis of Tropical Forest Fragmentation and Its Impact on the Global Carbon Cycle. Nat. Commun. 2017, 8, 14855. [Google Scholar] [CrossRef] [PubMed]
- Wang, J.; Peng, P.; Liu, T.; Wang, J.; Zhang, S.; Niu, P. Revealing the Spatiotemporal Changes in Land Use and Landscape Patterns and Their Effects on Ecosystem Services: A Case Study in the Western Sichuan Urban Agglomeration, China. Land 2025, 14, 1012. [Google Scholar] [CrossRef]
- Deng, P. Analysis of land use and landscape type change in resource-depleted cities—A case study of Dongchuan District, Kunming City. Environ. Ecol. 2022, 4, 1–5. [Google Scholar]
- Wang, Z.; Hong, M.; Liu, X. Spatial and Temporal Change Pattern and Trend Prediction of Land Use in the Middle Reaches of the Yellow River. Remote Sens. Technol. Appl. 2025, 40, 748–760. [Google Scholar]
- Aznar-Sánchez, J.A.; Belmonte-Ureña, L.J.; López-Serrano, M.J.; Velasco-Muñoz, J.F. Forest Ecosystem Services: An Analysis of Worldwide Research. Forests 2018, 9, 453. [Google Scholar] [CrossRef]
- Liu, X.; Zheng, S.; Qiao, Z. Dynamic simulation of land use change and habitat quality in the Three River Source Region based on the PLUS-InVEST models. Arid. Zone Res. 2025, 42, 1080–1092. [Google Scholar] [CrossRef]
- Qiao, Q.; Zhang, Y.; Liu, J.; Gan, L.; Li, H. Study on the Extraction Method for Ecological Corridors under the Cumulative Effect of Road Traffic. Appl. Sci. 2023, 13, 6091. [Google Scholar] [CrossRef]
- Chang, S.-C.; Blanco, J.A.; Lo, Y.-H. Introductory Chapter: Land Use Change Ecosystem Services and Tropical Forests. In Tropical Forests-The Challenges of Maintaining Ecosystem Services while Managing the Landscape; Blanco, J.A., Chang, S.-C., Lo, Y.-H., Eds.; InTech: London, UK, 2016; ISBN 978-953-51-2758-1. [Google Scholar]
- Liao, L.; Lu, B.; Cao, Y. Spatial and Temporal Dynamics and Spatial Correlation Analysis of Landscape Pattern and Habitat Quality Surrounding Wuyishan National Park. Chin. Landsc. Archit. 2023, 39, 21–27. [Google Scholar] [CrossRef]
- Zhang, Q.; Zhu, L.; Fu, H. Spatiotemporal Correlation Analysis of Landscape Pattern and Habitat Quality in and Around China’s Tropical Rainforest National Park. Forests 2024, 15, 2070. [Google Scholar] [CrossRef]
- Zhang, X.; Wu, Y.; Huang, T.; Ou, G.; Shen, H. Response of Temporal and Spatial Dynamic Changes of Landscape Pattern to Human Disturbance in Kunming City. J. Southwest For. Univ. 2025, 45, 128–136. [Google Scholar]
- Wu, J.; Luo, K.; Zhao, Y. Evolution of Shenzhen’s Urban Landscape Pattern over the Past 20 Years and Its Driving Forces. Geogr. Res. 2020, 39, 1725–1738. [Google Scholar]
- Zhang, X.; Yao, L.; Luo, J.; Liang, W. Exploring Changes in Land Use and Landscape Ecological Risk in Key Regions of the Belt and Road Initiative Countries. Land 2022, 11, 940. [Google Scholar] [CrossRef]
- Frissell, C. Review of Ecological Effects of Roads on Terrestrial and Aquatic Communities. Conserv. Biol. 2000, 14, 18–30. [Google Scholar] [CrossRef]
- Zhang, Q.; Wen, W. Analysis on the spatial-temporal evolution characteristics of ecological environment sensitivity and landscape distribution pattern of national parks: Take Shennongjia National Park as an example. J. Cent. South. Univ. For. Technol. 2023, 43, 126–135,152. [Google Scholar] [CrossRef]
- Wu, T.; Chen, Y.; Chen, Z.; Lei, J.; Chen, X.; Li, Y. Analysis on the Spatial Distribution Characteristics of Representative Populations in Tropical Rainforest of Hainan. For. Grassl. Resour. Res. 2023, 2023, 133–141. [Google Scholar] [CrossRef]
- Hu, X.; Jia, T. Construction and Optimization of Ecological Security Pattern in Three-River-Source National Park Based on Ecological Sensitivity and Landscape Connectivity. Resour. Environ. Yangtze Basin 2023, 32, 1724–1735. [Google Scholar]
- Wang, X.; Dang, A.; Tong, B.; Liu, X. Construction and Optimization of Ecological Security Pattern in the Wuding River Basin of Human Settlements. Landsc. Archit. 2025, 32, 31–39. [Google Scholar] [CrossRef]
- Lin, X.; Fu, H. Optimization of Tropical Rainforest Ecosystem Management: Implications from the Responses of Ecosystem Service Values to Landscape Pattern Changes in Hainan Tropical Rainforest National Park, China, over the Past 40 Years. Front. For. Glob. Change 2023, 6, 1242068. [Google Scholar] [CrossRef]
- Li, Y.; Liang, Q.; Li, Q.; Yufang, J. Construction and Evaluation of Ecological Networks Based on Morphological Spatial Pattern Analysis and Circuit Theory:Taking Shenzhen as an Example. Land Resour. Her. 2024, 21, 116–125. [Google Scholar] [CrossRef]
- Chen, Y.; Zhang, C.-C.; Hu, F.; Hu, G.-H.; Lang, Y.; Huang, H.-L. Analysis of Ecological Network Evolution in Taihang Mountains Based on MSPA-InVEST Model. Environ. Sci. 2024. [Google Scholar] [CrossRef]
- Cheng, K.; Yang, H.; Tao, S.; Su, Y.; Guan, H.; Ren, Y.; Hu, T.; Li, W.; Xu, G.; Chen, M.; et al. Carbon Storage through China’s Planted Forest Expansion. Nat. Commun. 2024, 15, 4106. [Google Scholar] [CrossRef] [PubMed]
- Peng, W.; Yang, J.; Huang, S.; Wang, R.; Duan, Z. Effect of Close-to-Nature Management on the Growth Regeneration and Species Diversity in Acacia Mangium Plantation. Trop. For. 2022, 50, 13–17. [Google Scholar]
- Cui, W.; Wei, Y.; Su, H.; Liu, X.; Wu, D.; Zhang, N.; Ji, N. Research on Ecological Security Pattern Construction of Protection andDevelopment Belt of in Wuyishan National Park. Res. Environ. Sci. 2024, 37, 874–886. [Google Scholar] [CrossRef]
- Ren, B.; Wang, Q.; Zhang, R.; Zhou, X.; Wu, X.; Zhang, Q. Assessment of Ecosystem Services: Spatio-Temporal Analysis and the Spatial Response of Influencing Factors in Hainan Province. Sustainability 2022, 14, 9145. [Google Scholar] [CrossRef]
- Pan, X.; Chen, P.; Fu, S.; Wu, J.; Chen, Q. Landscape ecological risk assessment in Xiamen by landscape pattern analysis. J. Appl. Oceanogr. 2024, 43, 771–780. [Google Scholar]
- Chen, S.; Fu, H.; Fu, G.; Chen, J. Comparison of Spatial-Temporal Dynamics of the Landscape Patterns of 5 National Nature Reserves in Hainan Province. J. Northwest For. Univ. 2023, 38, 181–189. [Google Scholar]
- Yang, K.; Cao, Y.-G.; Feng, Z.; Geng, B.-J.; Feng, Y.; Wang, S.-F. Research Progress of Ecological Security Pattern Construction Based on Minimum Cumulative Resistance Model. J. Ecol. Rural. Environ. 2021, 37, 555–565. [Google Scholar] [CrossRef]
- Jiang, H.; Peng, J.; Liu, M.; Dong, J.; Ma, C. Integrating Patch Stability and Network Connectivity to Optimize Ecological Security Pattern. Landsc. Ecol. 2024, 39, 54. [Google Scholar] [CrossRef]
- Wei, L.; Li, M.; Ma, Y.; Wang, Y.; Wu, G.; Liu, T.; Gong, W.; Mao, M.; Zhao, Y.; Wei, Y.; et al. Construction of an Ecological Security Pattern for the National Park of Hainan Tropical Rainforest on the Basis of the Importance of the Function and Sensitivity of Its Ecosystem Services. Land 2024, 13, 1618. [Google Scholar] [CrossRef]
- Lu, D.; Tian, H.; Zhou, G.; Ge, H. Regional Mapping of Human Settlements in Southeastern China with Multisensor Remotely Sensed Data. Remote Sens. Environ. 2008, 112, 3668–3679. [Google Scholar] [CrossRef]
- Tian, X.; Yang, L.; Wu, X.; Wu, J.; Guo, Y.; Guo, Y.; Chen, H.; Li, J.; Lin, Y. Landscape Fragmentation and Spatial Autocorrelation of a Typical Watershed in the Wenchuan Earthquake-Affected Area—A Case Study in the Longxi River Basin. Forests 2023, 14, 2349. [Google Scholar] [CrossRef]
- Yan, M.; Duan, J.; Li, Y.; Yu, Y.; Wang, Y.; Zhang, J.; Qiu, Y. Construction of the Ecological Security Pattern in Xishuangbanna Tropical Rainforest Based on Circuit Theory. Sustainability 2024, 16, 3290. [Google Scholar] [CrossRef]
- MacDonald, M.A. The Role of Corridors in Biodiversity Conservation in Production Forest Landscapes: A Litterature Revie. Tasforests. 2003, 14, 41–52. [Google Scholar]
- Yao, X.; Zhou, L.; Wu, T.; Ren, M. Landscape dynamics and ecological risk of the expressway crossing section in the Hainan Rainforest National Park. Acta Ecol. Sin. 2022, 42, 6695–6703. [Google Scholar] [CrossRef]
- Wang, M.; Wu, Y.; Wang, Y.; Li, C.; Wu, Y.; Gao, B.; Wang, M. Study on the Spatial Heterogeneity of the Impact of Forest Land Change on Landscape Ecological Risk: A Case Study of Erhai Rim Region in China. Forests 2023, 14, 1427. [Google Scholar] [CrossRef]
- Engert, J.E.; Souza, C.M.; Kleinschroth, F.; Bignoli, D.J.; Costa, S.C.P.; Botelho, J.; Ishida, F.Y.; Nursamsi, I.; Laurance, W.F. Explosive Growth of Secondary Roads Is Linked to Widespread Tropical Deforestation. Curr. Biol. 2025, 35, 1641–1648.e4. [Google Scholar] [CrossRef] [PubMed]
- Caro, T. Roads through National Parks: A Successful Case Study. Trop. Conserv. Sci. 2015, 8, 1009–1016. [Google Scholar] [CrossRef]
- Zhai, D.; Xu, J.; Dai, Z.; Schmidt-Vogt, D. Lost in Transition: Forest Transition and Natural Forest Loss in Tropical China. Plant Divers. 2017, 39, 149–153. [Google Scholar] [CrossRef]
- Han, M.-W.; Zhang, S.-P.; Xu, Q.-X.; Dai, J.-F.; Huang, G.-L. Construction of Cross-basin Ecological Security Patterns Based on Carbon Sinks and Landscape Connectivity. Environ. Sci. 2024, 45, 5844–5852. [Google Scholar] [CrossRef]
- Zhang, X.; Mou, X.; Wang, X.; Zhu, Z.; Yu, Y.; Huang, J. Study on the Ecological Restoration Zoning of Territorial Space: Taking Hainan Island as An Example. Ecol. Econ. 2021, 37, 183–189. [Google Scholar]
- Zhai, J.; Hou, P.; Cao, W.; Yang, M.; Cai, M.; Li, J. Ecosystem Assessment and Protection Effectiveness of a Tropical Rainforest Region in Hainan Island, China. J. Geogr. Sci. 2018, 28, 415–428. [Google Scholar] [CrossRef]
Disclaimer/Publisher’s Note: The statements, opinions and data contained in all publications are solely those of the individual author(s) and contributor(s) and not of MDPI and/or the editor(s). MDPI and/or the editor(s) disclaim responsibility for any injury to people or property resulting from any ideas, methods, instructions or products referred to in the content. |
© 2025 by the authors. Licensee MDPI, Basel, Switzerland. This article is an open access article distributed under the terms and conditions of the Creative Commons Attribution (CC BY) license (https://creativecommons.org/licenses/by/4.0/).