Abstract
Light Detection and Ranging (LiDAR) has proved to be an effective technology for accurately extracting forest structural parameters. Unmanned Aerial Vehicles (UAVs) are characterized by its flexibility and low cost. Combining the advantages of both technologies, UAV-LiDAR exhibits great potential in the accurate surveying of large forests. However, for forests dominated by deciduous tree species, the accuracy of individual tree detection and height extraction is inevitably impacted by the leaf-on and leaf-off seasons when UAV-LiDAR scans point clouds. In this study, a planted forest of dawn redwood (Metasequoia glyptostroboides Hu & W. C. Cheng) in Ma’anxi Wetland Park of Chongqing, China, was chosen as the study object. The UAV-LiDAR was first leveraged to capture the point clouds of summer and winter seasons. Then, the canopy height models (CHMs) with different spatial resolutions were generated, based on which the tree quantity and individual heights were extracted. The achieved outcomes included the following: (1) The CHMs of the two seasons could be used to obtain the tree quantity, and the accuracy of individual tree detection from the point cloud scanned in the winter was relatively higher than that in the summer. (2) The spatial resolution of CHM impacted the accuracy of individual tree segmentation and height extraction, and the optimum spatial resolution was 0.3 m (approximately 1/10 of the average canopy diameter of the dawn redwoods). Therefore, to obtain more accurate individual tree heights of the deciduous forest, it is better to scan the point cloud using UAV-LiDAR in the leaf-off season and choose the appropriate spatial resolution of the CHM.
1. Introduction
Forests are a key component of the global terrestrial ecosystem. They play a vital role in water conservation, carbon storage, and maintenance of the balance of the ecosystem [1]. Trees are the foundation of forests, and their spatial structure is crucial for modeling and analyzing forest ecological functions. Hence, it is meaningful to acquire the accurate structural information such as heights of individual trees for the fine management of forest resources [2]. Furthermore, understanding the seasonal dynamics of individual tree structures is essential for precision forest management, long-term monitoring, and health assessment, particularly in deciduous stands where canopy phenology can substantially alter forest structure appearance [3,4].
Detecting and segmenting individual trees is the prerequisite step for extracting forest structural parameter information. Once individual trees are segmented, tree height, DBH (diameter at breast height), below-branch height, canopy width and volume, and other parameters of forest structures can be further acquired. Among them, individual height is one of the most important attributes of trees, which directly embodies their growth statuses [5]. Moreover, it can be used with other attributes to predict wood volumes, aboveground biomass, and carbon storage based on related allometric models [6]. However, it is difficult to use conventional methods for forestry survey to identify the positions of individual trees and measure their heights [7], as the results are greatly influenced by biological factors, landforms, and the errors made by persons or instruments [8]. In addition, the field investigations involving people are usually costly and time-consuming [9].
The rapid development of remote sensing technologies have provided favorable alternatives for surveying forest resources. Satellite optical remote sensing can capture the current information of a large area forest and the natural environment [10] and monitor their changes through continuous observations [11]. But it is difficult to obtain the metrics of individual trees from satellite-acquired images with low spatial resolution. In contrast, the information of individual trees can be soundly retrieved from airborne, remotely sensed images with sufficiently higher spatial resolution [12]. Nevertheless, the high cost and mandatory airspace application hinder the widespread application of manned aerial remote sensing in forest surveying [13,14].
Unmanned Aerial Vehicles (UAV) or drones are superior to satellite and manned-airborne remote sensing in terms of cost and flexibility. Furthermore, it raises the spatial resolution of acquired imagery to a higher level [15,16,17,18], which means it is possible to obtain the detailed structures of individual trees [19,20,21]. According to payloads, UAVs can be categorized into two kind of technologies in forest surveying, namely UAV Stereo Photogrammetry (USP) and UAV Laser Scanning (ULS). The payload of USP is generally a consumer-level digital camera, while that of ULS is Light Detection and Ranging (LiDAR), namely UAV-LiDAR. Both techniques can ultimately produce three dimensional (3D) point clouds, which are particularly suitable for extracting 3D structure parameters of forests [22]. Numerous scholars have compared the effectiveness of USP and ULS in extracting structural parameters of individual trees grown in various forest environments [23,24], including boreal forests, coastal forests [25], and subtropical artificial forests [26]. Most of them reached the conclusion that ULS generally achieved higher accuracies [27,28,29], because LiDAR has stronger penetration capability in dense forest and thus better reflected the vertical profiles of forests [30]. Recently, point clouds acquired by UAV-LiDAR across multiple seasons have been utilized to enhance individual tree detection accuracy [31] and investigate the influence of varying leaf coverage in deciduous forests on the precision of terrain and individual tree height extraction [32]. Existing researches have begun to explore how seasonal variations, particularly leaf-on and leaf-off canopy conditions, influence the segmentation and height estimation of individual trees using UAV-LiDAR [33,34]. These studies indicated that leaf-off season data facilitated segmentation in dense deciduous forests due to higher ground visibility and enhanced tree trunk detection capability, thereby demonstrating superiority in tree height estimation.
In addition, individual tree detection and height estimation can be conducted either directly from the raw point cloud or indirectly via raster-based canopy height models (CHMs) [35,36]. While point cloud-based methods preserve detailed 3D structure, CHM-based approaches simplify processing and enable compatibility with established image-analysis algorithms. The spatial resolution of CHM has been shown in some studies to influence detection accuracy, particularly in dense or heterogeneous forests, whereas other works have reported minimal sensitivity within certain resolution ranges [37,38,39]. A clearer understanding of these methodological differences, especially in relation to seasonal canopy conditions, is necessary to optimize UAV-LiDAR workflow for forest monitoring.
In this study, we aimed to evaluate the seasonal impacts on individual tree segmentation and height extraction using UAV-LiDAR. The point clouds of a planted dawn redwood (Metasequoia glyptostroboides Hu & W. C. Cheng) stand were acquired using UAV-LiDAR in summer and winter. The specific objectives include the following: (1) to segment individual tree canopies and extract their heights from the two season point clouds; (2) to assess the accuracies of extracted individual tree heights in the two seasons against on-site measured values; and (3) to determine the better season for scanning deciduous forest using the UAV-LiDAR and the optimal spatial resolution of CHMs for individual tree height extraction.
2. Study Area and Data
2.1. Study Area
As indicated in Figure 1a, the study area (106°24′56.42″–106°24′59.89″ E and 29°49′31.01″–29°49′34.08″ N) is situated in Ma’anxi Wetland Park of Beibei district, Chongqing, China. Beibei district lies in the parallel ridge valley of eastern Sichuan Basin. The park starts from the Longtanzi Reservoir and ends alongside the Jialing River. It has an elevation range from 57 m to 168 m above sea level (Figure 1b) and an area of approximately 0.73 km2. The local humid subtropical climate is mainly influenced by the monsoon current from Southeast Asia. With this, the annual mean temperature is 18.3 °C, and the mean yearly rainfall is 1105.4 mm.
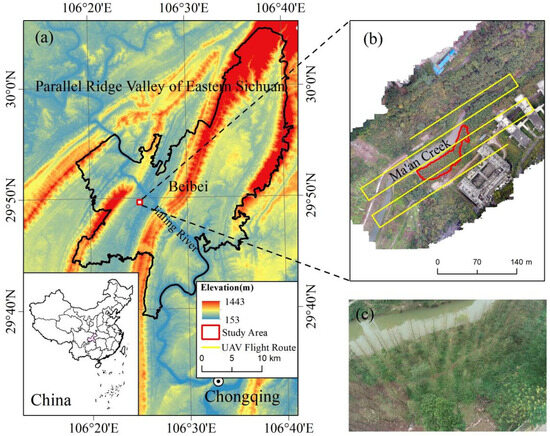
Figure 1.
(a) Location of Ma’anxi Wetland Park; (b) orthophoto of the study area with UAV flight routes; (c) aerial view of dawn redwood (Metasequoia glyptostroboides Hu & W. C. Cheng) stand in the study area.
Our study object was a planted stand of dawn redwood (Metasequoia glyptostroboides Hu & W. C. Cheng) growing in the Ma’anxi Wetland Park (Figure 1c). Dawn redwood is a deciduous tree species with the graceful silhouette. When it is young, its canopy looks like a steeple; as it becomes aged, the canopy will transform into a shape of large round hill. Dawn redwood has a long history and is only discovered in China. Dawn redwood trees tend to grow in the areas with mild climate where it frequently rains in winters and autumns. Most of dawn redwood trees are cultivated along rivers, moist slopes, or drains. Characterized by fast growth, great adaptability, and good greening effects, dawn redwood trees are widely planted in Chongqing [40]. As a deciduous coniferous tree species, dawn redwood is very appropriate for studying the seasonal impacts on individual tree detection and height extraction.
2.2. Point Clouds Acquired by UAV-LiDAR
In our study, the quad-copter Feima D2000 (FEIMA Robotics, Shenzhen, China) (Figure 2a) was used to capture point cloud data of the dawn redwood stand. The duration time of the drone loaded with a sensor can reach 50 min. It is typically equipped with the double differential GNSS system including RTK and PPK, so the centimeter-level positioning accuracy can be achieved. The loaded LiDAR system was Feima D-LiDAR2000 (FEIMA Robotics, Shenzhen, China) (Figure 2a), which has the scanning frequency of 240,000 points/s and the scanning accuracy of 5 cm. In addition, the DJI Phantom 4 RTK (DJI, Shenzhen, China) (Figure 2b) was used to acquire the orthophoto of the study area as the base map for presenting the locations and related information of dawn redwood trees.
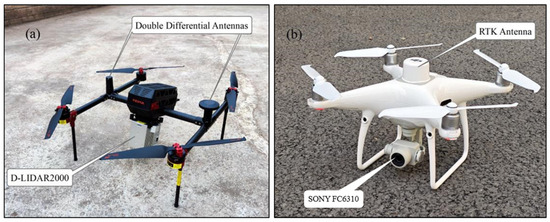
Figure 2.
UAV Systems. (a) Feima D2000 with D-LIDAR2000; (b) DJI Phantom 4 RTK with SONY FC6310 (Sony Corporation, Tokyo, Japan).
The two laser scanning tasks were carried out on 14 July 2021 (the summer, leaf-on) and 28 December 2021 (the winter, leaf-off). In both flights, the drone followed the same routes and adopted the same settings. The flight altitude was 90 m, the side overlap was 50%, and flight speed was 5 m/s. The weather were sunny for the two days, with almost no wind. The resulting point clouds of the two seasons were shown in Figure 3a,b. The average density of the two point clouds was approximately 1260 points/m2. The partial profiles of the two point cloud were indicated in Figure 3c,d, and their combined result was in Figure 3e.
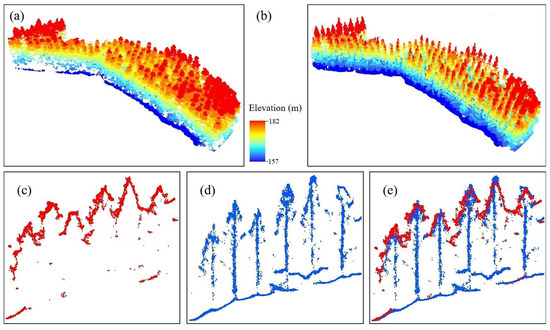
Figure 3.
(a) Point cloud acquired in summer; (b) point cloud acquired in winter; (c) partial profile of the point cloud in summer; (d) partial profile of the point cloud in winter; (e) combined point cloud of (c,d).
2.3. Field Measured Data
In the two days when the UAV-LiDAR conducted laser scanning operations, we used a total station to synchronously measure individual tree heights, which were achieved through trigonometric leveling [41]. For each tree, there were three metrics measured: (1) the horizontal distances between the total station and individual dawn redwood trees; (2) the elevation angles as the total station targeted individual treetops; and (3) the depression angles as the total station aimed at individual trunk bases. Then the true heights of individual trees were achieved in Table 1 using the trigonometric function.

Table 1.
Field-measured trees heights in the two seasons.
As dawn redwood is a deciduous tree species, the visibility in the stand is relatively poor when there are abundant branches and leaves in the summer and turns better as leaves fall in the winter. As a result, the heights of 33 trees were measured in July 2021 (Figure 4a), and the number of trees with measured heights increased to 54 in December 2021 (Figure 4b).
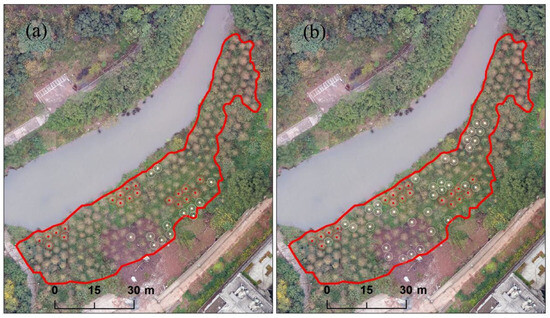
Figure 4.
(a) Locations of the trees whose heights were measured on 14 July 2021; (b) locations of the trees whose heights were measured on 28 December 2021. The red points denote tree locations where height measurements were performed in both summer and winter.
Meanwhile, a RTK GNSS (Figure 5a) was utilized to accurately measure the coordinates of the location of each tree in December, 2021. However, the signals of positioning satellites are easily blocked or weakened by tree canopies with dense leaves. Therefore, we conducted the tree location measurement in the winter when the leaves of dawn redwood trees had fallen. As a result, the position coordinates of 193 trees were accurately measured (Figure 5b). These data were used to verify whether the UAV-LiDAR can effectively extract the locations of individual trees. Although RTK GNSS measurements captured the positional coordinates of each tree, they did not directly target the trunk center. These coordinates were only used to verify the number of detected individual trees by judging whether they are contained in the boundaries of crowns extracted from CHM. Therefore, it did not require a high accuracy of the trunk position coordinates.
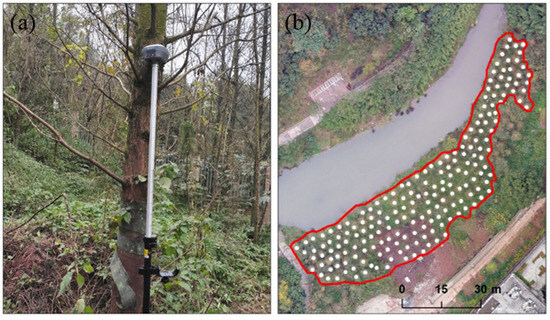
Figure 5.
(a) RTK GNSS; (b) spatial distribution of all the trees in the study area.
3. Methods
In this study, LiDAR360 V6.0 software was employed for point cloud processing and individual tree detection. First of all, the two point clouds of the dawn redwood stand scanned by the UAV-LiDAR in the two seasons underwent clipping and denoising. Secondly, the ground points and vegetation points were separated through classification of the remaining points. Thirdly, the ground points were used to create the DEMs, with the vegetation points to derive the DSMs. Then, the CHMs were acquired by subtracting the DEMs from the corresponding DSMs. Fourthly, the crown boundaries, trunk heights, and locations of the individual trees were acquired from the CHMs. Lastly, compared with the field measured values, the extracted individual tree heights in the two seasons were assessed separately according to the various metrics. The seasonal impacts on individual tree detection and height extraction were achieved. The detailed workflow of this study is illustrated in Figure 6.
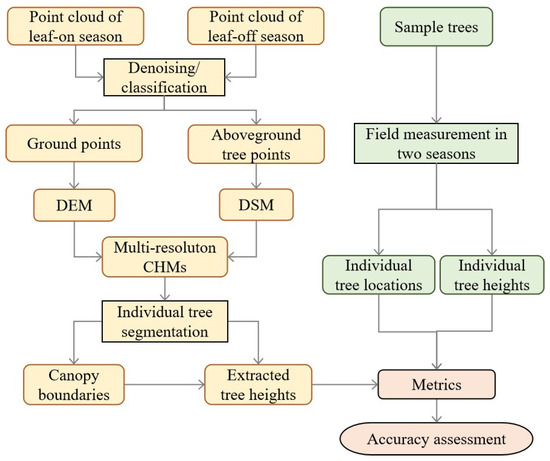
Figure 6.
The workflow for studying seasonal impacts on individual tree detection and height extraction using UAV-LiDAR.
3.1. Point Cloud Preprocessing and Classification
Before further processing, the two point clouds acquired in the two seasons were clipped to the spatial scope of the study area. Then, they were denoised to remove the highest points induced by articles in the low air and the lowest points produced by the multipath effect of the laser signals.
According to the field investigation, the dawn redwood is the only tree species in the study area, and there are only scattered low shrubs on the ground. Therefore, the two point clouds can be classified into the ground points and the vegetation points. The IPTD (improved progressive, triangulated, irregular network densification) [42] was adopted to extract the ground points. A sparse triangular network was first generated based on the seed points, and then the network was densified layer by layer through iterative processing till all the points meeting the criteria of the preset iteration angle and distance were found.
3.2. CHM Acquisition
CHM is a surface model that represents the distance between vegetation surface and the ground. It can be used to derive the key structure parameters of trees such as the canopy width and trunk height. In the study, the CHM is acquired as the difference between DSM and DEM (Equation (1)).
The DEM is generated by rasterizing the extracted ground points, representing the true undulations of the ground. The DSM generally includes the surface elevation information of buildings, trees, and other objects above the ground and is produced by rasterizing the extracted vegetation points or ground points if there is no vegetation in a certain location. To perform the difference operation, the DSM and DEM should share the same spatial resolution. According to Lin et al. [6], the pixel size influences the extraction of the canopy boundaries and seed point selection for individual tree segmentation. Therefore, it is necessary to conduct a series of experiments to find the optimal spatial resolution for tree canopy extraction.
3.3. Segmentation of Individual Tree Canopies
In order to extract the structure parameters of individual trees, it is first necessary to achieve tree positions through canopy segmentation. The dawn redwood is the only tree species in the study area, with a conical shape. Therefore, the watershed algorithm [43] is very suitable to accurately segment the individual trees from the CHMs.
First of all, Gaussian filtering is applied to the CHM to smooth local noise (low shrubs) while preserving tree apex features. For Gaussian filtering, the sigma (σ) parameter governs smoothing intensity, which is inversely proportional to CHM raster resolution. Secondly, local maxima filter is used to detect potential canopy apexes, which are filtered by a height threshold to remove non-tree signals. The remaining canopy apexes are the initial seed points. Thirdly, the CHM is converted into a topographic gradient map, where canopy apexes act as the minima of “catchment basin” and abrupt canopy edges form “watershed lines”. Fourthly, the water immersion process is simulated starting from seed points, with adjacent basin boundaries to isolate individual canopies. Finally, the over-segmented regions are merged, and the canopy gaps are filled using morphological closing operations.
3.4. Extraction of Individual Tree Heights
Typically, the tree height refers to the distance from the canopy apex to the ground. Therefore, the individual tree heights are determined as the pixels with the maximum values in the canopy boundaries. After canopy segmentation, the boundaries of individual trees are obtained. Then, the zonal statistics function of the ArcGIS toolbox 10.8 is adopted to find the maximum values (tree heights) of the pixels in the CHM within the boundaries of the individual trees.
3.5. Metrics for Accuracy Assessment
The accuracy of individual tree segmentation is evaluated using Equations (2)–(4) [44]:
where TP (True Positive) denotes the quantity of the individual trees correctly segmented, FN (False Negative) represents the individual trees not detected, and FP (False Positive) is the individual trees excessively detected. r (recall) denotes the rate of tree detection, p (precision) represents the correctness of tree segmentation, and F (F score) is the overall accuracy of the extracted tree contours.
The accuracy of extracted individual tree heights is assessed against field measured values using correlation coefficients (R2), root mean square error (RMSE), and bias. The latter two metrics, RMSE and bias, are calculated with Equations (5) and (6), respectively.
denotes the tree heights extracted from the CHM, and represents the tree heights measured onsite.
4. Results
4.1. Created CHMs of Two Seasons
After classification, the ground points in the summer and winter were presented in Figure 7a,c, and the remaining vegetation points (displayed with elevations) in the summer and winter were given in Figure 7b,d. It could be observed that the ground points in the summer were significantly sparser than those in the winter due to the obstruction of the lusher tree canopies. Therefore, the vegetation points in the summer were more suitable for outlining the canopies than those in the winter.
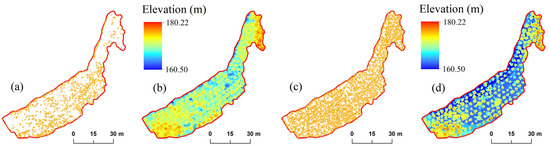
Figure 7.
(a) The ground points in the summer; (b) the vegetation points (displayed via height) in the summer; (c) the ground points in the winter; (d) the vegetation points in the winter.
When single trees are segmented from CHM, the spatial resolution of CHM significantly affects the extraction of the canopy boundaries [6,45,46]. Based on high spatial resolution CHM, the extraction of canopy boundaries may result in some small polygons, leading to over segmentation. With the increase in spatial resolution CHM, those small polygons will gradually disappear, causing the boundaries of adjacent tree canopies to merge and resulting in under segmentation. In the study, we separately generated CHMs for the two seasons with three spatial resolutions of 0.1 m, 0.3 m, and 0.5 m (Figure 8). As the CHM is achieved by subtracting DEM from DSM, to obtain CHM with different spatial resolutions, the DSMs and DEMs must been first rasterized into corresponding spatial resolutions.
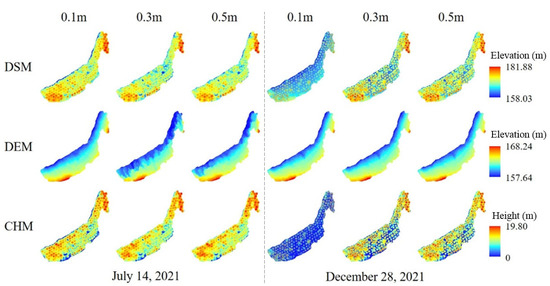
Figure 8.
DSMs, DEMs, and CHMs of the two seasons with different spatial resolutions.
It could be observed from Figure 8 that in the winter, as the leaves fell, the spatial scopes of the tree canopies decrease sharply, resulting in significant differences in DSMs between the two seasons. This ultimately led to differences in CHMs between the two seasons.
4.2. Segmented Individual Tree Canopies
According to the field investigations, all the dawn redwood trees of the study area were no shorter than 8 m, and the radiuses of their canopies were no greater than 3 m. Therefore, the height threshold of 2.5 m was adopted to filter out the low shrubs in the CHMs. The finer resolutions of CHM required larger σ (0.5–2.5) to mitigate over-segmentation, while coarser resolutions necessitated smaller σ (0.1–0.3) to preserve canopy structural details. These ensured that the remaining CHMs only contained the canopy apexes of dawn redwood trees, and the seed points for conducting watershed algorithm were correctly sought out. Thus, the impact of the low shrubberies on the extraction of the canopies of the individual trees was soundly removed.
The canopy apexes represented the positions of individual trees, and the identified quantities in the CHMs of different resolutions in the two seasons were assessed against those of the field measured trees. The experimental results indicated that, when the spatial resolution of CHM was 0.1 m, there was a significant deviation in the number of trees extracted from it. The number of trees extracted from summer CHM with a resolution of 0.1 m was 822, while that from winter CHM was 3914. It was because excessively high spatial resolution can display subtle undulations on the surface of CHM, which caused over-segmentation of most tree canopies and under-segmentation of a small portion (Figure 9a). Therefore, the number of identified trees was significantly larger than the field measured value (193). Meanwhile, due to the shedding of leaves in winter, the fluctuation of the winter CHM surface were greater, resulting in a much larger number of trees extracted from winter CHM than that from summer CHM. When the CHM resolution was 0.5 m, the main problem was under-segmentation (Figure 9c).
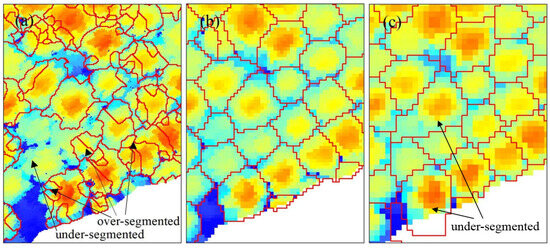
Figure 9.
Illustration of the segmented canopies from CHM with various spatial resolutions. (a) 0.1 m; (b) 0.3 m; (c) 0.5 m.
Therefore, only the CHMs with spatial resolutions of 0.3 m and 0.5 m in the summer and winter were used to segment canopy boundaries and detect tree apexes. The results were presented in Figure 10. Furthermore, the accuracies of individual trees detected from the summer and winter CHMs with 0.3 m and 0.5 m spatial resolutions were assessed against the field positioned trees. The specific metric values were listed in Table 2.
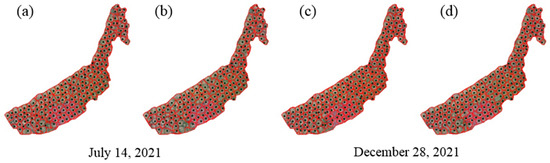
Figure 10.
Segmented canopy boundaries and detected apexes from the two season CHMs with different resolutions. (a) The result of 0.3 m in the summer; (b) the result of 0.5 m in the summer; (c) the result of 0.3 m in the winter; (d) the result of 0.5 m in the winter.
Table 2.
Accuracies of individual trees detected from summer and winter CHMs with spatial resolutions of 0.3 m and 0.5 m.
As shown in Table 2, all F-scores of detected trees in the four CHMs exceeded 0.90. The tree detection achieved the highest F-score (0.98) from both summer and winter CHMs with a spatial resolution of 0.3 m. It meant that, with this spatial resolution, the impact of leaf shedding on individual tree detection was almost negligible. In contrast, the F-score (0.97) of tree detection from winter CHM with 0.5 m spatial resolution was much higher than that (0.93) from summer CHM with the same spatial resolution. In addition, there was relatively smaller discrepancy between the accuracies of tree detection from the two season CHMs with the spatial resolution of 0.3 m. The number of detected trees from winter and summer CHMs were 197 vs. 188, and the true positives were 191 versus 186. But the gap became larger with 0.5 m spatial resolution, with the number of detected trees from winter and summer CHMs being 186 vs. 169, and the true positives were 184 vs. 168.
4.3. Extracted Individual Tree Heights
After the individual trees were detected, the heights of each tree were extracted. The accuracies of individual tree heights extracted from summer and winter CHMs with spatial resolutions of 0.3 m and 0.5 m were assessed against the field measured heights (Figure 11).
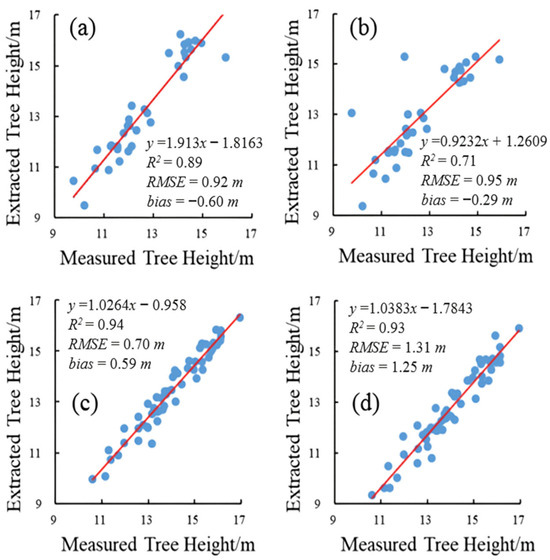
Figure 11.
Correlations of measured and extracted individual tree heights. (a) 0.3 m summer CHM; (b) 0.5 m summer CHM; (c) 0.3 m winter CHM; (d) 0.5 m winter CHM.
The metric values of extracted tree heights from the CHMs with the four combinations of seasons and spatial resolutions were comparatively analyzed. The lowest bias (−0.29 m) and the lowest R2 (0.71) was achieved from the summer CHM with the spatial resolution of 0.5 m. This seemed a bit contradictory. It was probably because the bias did not take into account the sample distribution. As indicated in Figure 11b, some sample points were largely scattered from the regression line, so the bias did not truly reflect the sample quality. As seen in Figure 11c, the extracted tree heights from the winter CHM with the spatial resolution of 0.3 m achieved the lowest RMSE (0.70 m) and the highest R2 (0.94). In contrast, the highest RMSE (1.31 m) and the highest bias (0.94) were obtained from the winter CHM with the spatial resolution of 0.5 m. According to Figure 11a, the metric values obtained from the summer CHM with the spatial resolution of 0.3 m did not have any significant differences. In summary, the possibility of extracting high-precision tree heights from the winter CHM was the highest, but an appropriate spatial resolution must be selected. Otherwise, the extracted tree heights might not be as accurate as those from the summer CHMs.
5. Discussion
5.1. Influence of Leaf Abundance on Remote Sensing Techniques
Related studies indicated that, when point cloud data were used to extract tree heights, leaf abundance had varying degrees of impact on the results. Among them, UAV/drone photogrammetry was most affected, as it was difficult to obtain point clouds of tree canopies when leaves fell in winter [47]. This was determined by the principle of photogrammetry, matching tie points from adjacent images. As for a manned Aerial Laser Scanner (ALS), the point cloud density obtained is usually ranging from tens to hundred points/m2 [48], making it difficult to capture information of all branches and leaves, resulting in incomplete tree canopies. As leaves fall in winter, this effect may intensify [49]. With the capability of capturing high-density point clouds, UAV-borne LiDAR is usually able to accurately extract structure parameters of tree canopies [34,50]. In this study, the point cloud density obtained by UAV-LiDAR was 1260 points/m2. Even if the leaves of dawn redwood trees fell off in winter, the remaining canopy shapes were still well characterized by the high-density point clouds. As listed in Table 2, seasonal changes had little effect on the canopy segmentation of individual trees. Due to the shedding of leaves, the overlaps between adjacent trees canopies were reduced, and the accuracy of canopy segmentation was slightly improved. Similarly, due to the increment in the number of laser beams that could reach the ground surface after the leaves fell off, the accuracy of the acquired DEM increased, and the corresponding accuracy of the extracted individual tree heights also improved (see Figure 11).
5.2. Appropriate Spatial Resolution for CHM Rasterization
In the study, as the point clouds were rasterized to obtain CHM, selection of the appropriate spatial resolution for rasterization became a key factor which impacted the outcomes [45]. In general, the details that can be perceived from a raster image are directly proportional to its resolution [46]. However, through experiments we found that it was not always the case while segmenting individual tree canopies. For instance, the accuracy of extracted individual tree canopies from the CHM of 0.3 m resolution was slightly higher than that from the CHM of 0.1 m resolution. Based on the CHM generated from the point cloud acquired in the deciduous season, the gap in accuracies of individual tree canopy extraction became greater at different resolutions. One possible reason was that as resolution increased, the image details were amplified, bringing too many ditches on the surfaces of the CHMs. Compared with the onsite observations, the tree canopies were either excessively or deficiently segmented from the CHM of higher resolution (Figure 9a). When the spatial resolution was low, the nearby tree canopies would mutually overlap, and the lower trees tended to merge into the higher ones. This phenomenon was especially apparent in the CHM generated from the point cloud acquired in the summer, when the trees had rich leaves. Therefore, it was essential to conduct onsite observations and measurements to determine a proper spatial resolution of the CHM [51]. According to our study, the extracted canopy contours (Table 2) and heights (Figure 11) of the individual trees achieved the highest accuracies from the CHM with a spatial resolution of 0.3 m both in winter and summer. According to the onsite investigations, the average canopy radius of the dawn redwood trees in the study area was approximately 3.2 m. Hence, the optimum spatial resolution of the CHM was approximately 1/10 of the average canopy diameter of the dawn redwoods trees.
5.3. Contributions and Limitations
In recent years, the leaf-off and leaf-on point clouds acquired by UAV-LiDAR have been increasingly used in individual tree segmentation and height estimation. Chen et al. [31] fused leaf-off and leaf-on point clouds to assess the synergetic benefits for individual tree segmentation and tree height estimation by comparing different segmentation algorithms in the dense deciduous forests of Northeast China. However, due to the relatively low point cloud density, tree apices were not detected in the leaf-off season. Moreover, tree height estimates from both leaf-on and leaf-off datasets were significantly overestimated, and the natural growth of tree heights during the study period was not taken into account. As indicated in Table 1, the heights of the same sample trees in situ measured in winter were usually slightly higher than those in summer. In our study, the individual tree heights extracted from point clouds in summer and winter were assessed against the corresponding field measured values in the two seasons. Therefore, the influence of natural growth on individual tree height extraction was reduced to the greatest extent. Pu et al. [34] improved initial individual tree segmentation via selecting the seed points from the point cloud taken during the leaf-off season. The object of this study was a deciduous broad-leaved forest, and it was directly assumed that the leaf-off point cloud was conducive to individual tree detection. In our study, we conducted experiments to quantitatively prove this assumption. Lin et al. [32] compared leaf-off, partial leaf-cover, and full leaf-cover UAV-LiDAR surveys in forest plantations and found that the normalized height point clouds derived from different leaf conditions were highly consistent. The results indicated that terrain models (DTMs) remained comparable across seasons and that tree detection achieved the highest F-score under leaf-off conditions, but dropped under partial leaf cover, and failed entirely under full leaf cover due to canopy occlusion. Although this work provided strong evidence for the robustness of UAV-LiDAR in leaf-off conditions, it did not analyze tree height accuracy in terms of RMSE or bias nor did it evaluate the effect of various CHM spatial resolutions. In contrast, our study quantitatively assessed the combined effects of leaf phenology and CHM resolution on both individual tree detection and height extraction accuracy.
In this study, we evaluated the seasonal impacts on the accuracy of individual tree detection and height extraction and analyzed the effects of CHMs with various spatial resolutions on the results. However, there are still some limitations. Firstly, as a deciduous coniferous tree species, dawn redwood has a relatively simple morphology with a single trunk and a pointed crown. In reality, the diverse forms of deciduous tree species pose significant challenges for individual tree canopy segmentation and height extraction. Secondly, the selected time points for collecting point clouds in the summer and winter could not guarantee that the leaves were the most lush and completely shed (actually with a small amount of leaves), which inevitably had a certain impact on the results. Thirdly, the specific site conditions including a relatively small terrain change, a single tree species, relatively uniform planting density, etc., might affect the universality of the conclusions. Although the evaluation results and causal analyses of the seasonal impacts on individual canopy detection and height extraction were reasonable, further quantitative analyses are needed on the influence of other environmental factors in future studies. For example, Li et al. [29] proved that the illumination had a certain effect on individual tree height extraction. Although we chose to carry out point cloud scanning both on sunny days, there were inevitably slight differences in illumination in the summer and winter. Therefore, the effects of various factors should be quantitatively analyzed via reasonable experiments in future studies on this topic.
6. Conclusions
Nowadays, UAV-borne LiDARs are widely used in forest surveys. However, the impact of forest point cloud data acquired in different seasons on the accuracies of individual tree structure parameters is not yet clear. In this study, we used the UAV-LiDAR to obtain the high-density point clouds of a deciduous dawn redwood stand in summer and winter and extracted the individual canopies and heights. Additionally, the spatial resolutions for CHM rasterization on the accuracies of individual tree height extraction were also analyzed. The major drawn conclusions were as follows:
- 1.
- The quantities of individual tree canopies detected from the point clouds acquired using UAV-LiDAR in the summer and winter were of high accuracy, with all F-scores exceeding 0.93.
- 2.
- Appropriate selection of spatial resolution for CHM could significantly reduce the seasonal impact on the accuracy of individual tree height extraction. The optimum spatial resolution for CHM was approximately 1/10 (0.3 m) of the average canopy diameter.
- 3.
- For deciduous forests, winter was a better season to obtain point clouds using UAV-LiDAR, when the accuracies of individual canopy detection and height extraction were relatively higher.
However, this study was only a primary trial on the topic, and the conclusions were drawn from our limited tests including tree species, degree of leaf shedding, site conditions, and so forth. There are still other factors affecting the accuracy of individual tree detection and height extraction, such as the interference of understory vegetation and the effects of other environmental and meteorological factors. In practical applications, one should select the proper season for scanning point cloud data using UAV-LiDAR according to leaf abscission phases of specific tree species. In the future researches, more rigorous and diverse experiments for individual tree crown detection and height extraction using UAV-LiDAR are necessary to be conducted. For example, the optimum CHM spatial resolution of 1/10 of the average canopy diameter should be further verified to determine if it is applicable to other deciduous tree species. Additionally, it was found that, when leaves had fallen in the winter, the high-density point clouds could accurately reflect the profiles and positions of the trunks. Therefore, it is worthy to study whether structural parameters such as Diameter at Breast Height (DBH) can be extracted from point clouds acquired using UAV-LiDAR during leaf-off season.
Author Contributions
Conceptualization, J.L.; methodology, W.W.; validation, Z.L. and X.N.; formal analysis, W.W.; investigation, J.L. and X.N.; data curation, Z.L. and X.N.; writing—original draft preparation, W.W.; writing—review and editing, J.L.; supervision, J.L.; project administration, J.L.; funding acquisition, J.L. and W.W. All authors have read and agreed to the published version of the manuscript.
Funding
This research was funded by the National Natural Science Foundation of China, grant number 32071678 and the Central Universities of China, grant number XDJK2014C012.
Data Availability Statement
The data presented in this study are available on request from the corresponding author. The data are not publicly available due to confidentiality of the data.
Conflicts of Interest
The authors declare no conflicts of interest.
References
- Zhao, P.; Lu, D.; Wang, G.; Liu, L.; Li, D.; Zhu, J.; Yu, S. Forest aboveground biomass estimation in Zhejiang Province using the integration of Landsat TM and ALOS PALSAR data. Int. J. Appl. Earth Obs. Geoinf. 2016, 53, 1–15. [Google Scholar] [CrossRef]
- Zhang, Y.; Schauer, J.J.; Zhang, Y.; Zeng, L.; Wei, Y.; Liu, Y.; Shao, M. Correction to Characteristics of Particulate Carbon Emissions from Real-World Chinese Coal Combustion. Environ. Sci. Technol. 2017, 51, 4734. [Google Scholar] [CrossRef] [PubMed]
- Knusel, S.; Peters, R.L.; Haeni, M.; Wilhelm, M.; Zweifel, R. Processing and Extraction of Seasonal Tree Physiological Parameters from Stem Radius Time Series. Forests 2021, 12, 765. [Google Scholar] [CrossRef]
- Song, L.; Tang, Z.; Zhang, X.; Wang, Z.; Hong, B. Assessing effects of seasonal variations in 3D canopy structure characteristics on thermal comfort in urban parks. Urban For. Urban Green. 2025, 112, 20. [Google Scholar] [CrossRef]
- Lutz, J.A.; Furniss, T.J.; Johnson, D.J.; Davies, S.J.; Allen, D.; Alonso, A.; Anderson-Teixeira, K.J.; Andrade, A.; Baltzer, J.; Becker, K.M.L.; et al. Global importance of large-diameter trees. Glob. Ecol. Biogeogr. 2018, 27, 849–864. [Google Scholar] [CrossRef]
- Lin, J.Y.; Chen, D.C.; Wu, W.J.; Liao, X.H. Estimating aboveground biomass of urban forest trees with dual-source UAV acquired point clouds. Urban For. Urban Green. 2022, 69, 127521. [Google Scholar] [CrossRef]
- Vaglio Laurin, G.; Ding, J.; Disney, M.; Bartholomeus, H.; Herold, M.; Papale, D.; Valentini, R. Tree height in tropical forest as measured by different ground, proximal, and remote sensing instruments, and impacts on above ground biomass estimates. Int. J. Appl. Earth Obs. Geoinf. 2019, 82, 101899. [Google Scholar] [CrossRef]
- Hunter, M.O.; Keller, M.; Victoria, D.; Morton, D.C. Tree height and tropical forest biomass estimation. Biogeosciences 2013, 10, 8385–8399. [Google Scholar] [CrossRef]
- Clark, N.A.; Wynne, R.H.; Schmoldt, D.L.; Winn, M. An assessment of the utility of a non-metric digital camera for measuring standing trees. Comput. Electron. Agric. 2000, 28, 151–169. [Google Scholar] [CrossRef]
- Ke, Y.; Quackenbush, L.J. A review of methods for automatic individual tree-crown detection and delineation from passive remote sensing. Int. J. Remote Sens. 2011, 32, 4725–4747. [Google Scholar] [CrossRef]
- Wulder, M.A.; White, J.C.; Stinson, G.; Hilker, T.; Kurz, W.A.; Coops, N.C.; St-Onge, B.; Trofymow, J.A.T. Implications of differing input data sources and approaches upon forest carbon stock estimation. Environ. Monit. Assess. 2010, 166, 543–561. [Google Scholar] [CrossRef]
- Hirata, Y.; Tabuchi, R.; Patanaponpaiboon, P.; Poungparn, S.; Yoneda, R.; Fujioka, Y. Estimation of aboveground biomass in mangrove forests using high-resolution satellite data. J. For. Res. 2014, 19, 34–41. [Google Scholar] [CrossRef]
- Muhammad, K.; Kasper, J.; Muhammad, K.; Kasper, J. Explicit area-based accuracy assessment for mangrove tree crown delineation using Geographic Object-Based Image Analysis (GEOBIA). In Proceedings of the Earth Resources and Environmental Remote Sensing/GIS Applications VIII, Warsaw, Poland, 11–14 September 2017; Volume 10428. [Google Scholar] [CrossRef]
- Kamal, M.; Phinn, S.; Johansen, K. Object-Based Approach for Multi-Scale Mangrove Composition Mapping Using Multi-Resolution Image Datasets. Remote Sens. 2015, 7, 4753–4783. [Google Scholar] [CrossRef]
- Anderson, K.; Gaston, K.J. Lightweight unmanned aerial vehicles will revolutionize spatial ecology. Front. Ecol. Environ. 2013, 11, 138–146. [Google Scholar] [CrossRef]
- Guo, Q.; Su, Y.; Hu, T.; Zhao, X.; Wu, F.; Li, Y.; Liu, J.; Chen, L.; Xu, G.; Lin, G.; et al. An integrated UAV-borne lidar system for 3D habitat mapping in three forest ecosystems across China. Int. J. Remote Sens. 2017, 38, 2954–2972. [Google Scholar] [CrossRef]
- Pádua, L.; Vanko, J.; Hruška, J.; Adão, T.; Sousa, J.J.; Peres, E.; Morais, R. UAS, sensors, and data processing in agroforestry: A review towards practical applications. Int. J. Remote Sens. 2017, 38, 2349–2391. [Google Scholar] [CrossRef]
- Torresan, C.; Berton, A.; Carotenuto, F.; Di Gennaro, S.F.; Gioli, B.; Matese, A.; Miglietta, F.; Vagnoli, C.; Zaldei, A.; Wallace, L. Forestry applications of UAVs in Europe: A review. Int. J. Remote Sens. 2017, 38, 2427–2447. [Google Scholar] [CrossRef]
- Goodbody, T.R.H.; Coops, N.C.; Marshall, P.L.; Tompalski, P.; Crawford, P. Unmanned aerial systems for precision forest inventory purposes: A review and case study. For. Chron. 2017, 93, 71–81. [Google Scholar] [CrossRef]
- Li, D.; Guo, H.; Wang, C.; Li, W.; Chen, H.; Zuo, Z. Individual Tree Delineation in Windbreaks Using Airborne-Laser-Scanning Data and Unmanned Aerial Vehicle Stereo Images. IEEE Geosci. Remote Sens. Lett. 2016, 13, 1330–1334. [Google Scholar] [CrossRef]
- Panagiotidis, D.; Abdollahnejad, A.; Surový, P.; Chiteculo, V. Determining tree height and crown diameter from high-resolution UAV imagery. Int. J. Remote Sens. 2017, 38, 2392–2410. [Google Scholar] [CrossRef]
- Bohlin, J.; Wallerman, J.; Fransson, J.E.S. Forest variable estimation using photogrammetric matching of digital aerial images in combination with a high-resolution DEM. Scand. J. For. Res. 2012, 27, 692–699. [Google Scholar] [CrossRef]
- Iqbal, I.A.; Musk, R.A.; Osborn, J.; Stone, C.; Lucieer, A. A comparison of area-based forest attributes derived from airborne laser scanner, small-format and medium-format digital aerial photography. Int. J. Appl. Earth Obs. Geoinf. 2019, 76, 231–241. [Google Scholar] [CrossRef]
- Wallace, L.; Lucieer, A.; Malenovský, Z.; Turner, D.; Vopěnka, P. Assessment of Forest Structure Using Two UAV Techniques: A Comparison of Airborne Laser Scanning and Structure from Motion (SfM) Point Clouds. Forests 2016, 7, 62. [Google Scholar] [CrossRef]
- White, J.C.; Stepper, C.; Tompalski, P.; Coops, N.C.; Wulder, M.A. Comparing ALS and Image-Based Point Cloud Metrics and Modelled Forest Inventory Attributes in a Complex Coastal Forest Environment. Forests 2015, 6, 3704–3732. [Google Scholar] [CrossRef]
- Cao, L.; Liu, H.; Fu, X.; Zhang, Z.; Shen, X.; Ruan, H. Comparison of UAV LiDAR and Digital Aerial Photogrammetry Point Clouds for Estimating Forest Structural Attributes in Subtropical Planted Forests. Forests 2019, 10, 145. [Google Scholar] [CrossRef]
- Mielcarek, M.; Kamińska, A.; Stereńczak, K. Digital Aerial Photogrammetry (DAP) and Airborne Laser Scanning (ALS) as Sources of Information about Tree Height: Comparisons of the Accuracy of Remote Sensing Methods for Tree Height Estimation. Remote Sens. 2020, 12, 1808. [Google Scholar] [CrossRef]
- Noordermeer, L.; Bollandsås, O.M.; Ørka, H.O.; Næsset, E.; Gobakken, T. Comparing the accuracies of forest attributes predicted from airborne laser scanning and digital aerial photogrammetry in operational forest inventories. Remote Sens. Environ. 2019, 226, 26–37. [Google Scholar] [CrossRef]
- Li, T.; Lin, J.; Wu, W.; Jiang, R. Effects of Illumination Conditions on Individual Tree Height Extraction Using UAV LiDAR: Pilot Study of a Planted Coniferous Stand. Forests 2024, 15, 758. [Google Scholar] [CrossRef]
- Hyyppä, E.; Hyyppä, J.; Hakala, T.; Kukko, A.; Wulder, M.A.; White, J.C.; Pyörälä, J.; Yu, X.; Wang, Y.; Virtanen, J.; et al. Under-canopy UAV laser scanning for accurate forest field measurements. ISPRS J. Photogramm. Remote Sens. 2020, 164, 41–60. [Google Scholar] [CrossRef]
- Chen, Q.; Gao, T.; Zhu, J.; Wu, F.; Li, X.; Lu, D.; Yu, F. Individual Tree Segmentation and Tree Height Estimation Using Leaf-Off and Leaf-On UAV-LiDAR Data in Dense Deciduous Forests. Remote Sens. 2022, 14, 2787. [Google Scholar] [CrossRef]
- Lin, Y.; Liu, J.; Fei, S.; Habib, A. Leaf-Off and Leaf-On UAV LiDAR Surveys for Single-Tree Inventory in Forest Plantations. Drones 2021, 5, 115. [Google Scholar] [CrossRef]
- Ahmadi, S.A.; Ghorbanian, A.; Golparvar, F.; Mohammadzadeh, A.; Jamali, S. Individual tree detection from unmanned aerial vehicle (UAV) derived point cloud data in a mixed broadleaf forest using hierarchical graph approach. Eur. J. Remote Sens. 2022, 55, 520–539. [Google Scholar] [CrossRef]
- Pu, Y.; Xu, D.; Wang, H.; Li, X.; Xu, X. A New Strategy for Individual Tree Detection and Segmentation from Leaf-on and Leaf-off UAV-LiDAR Point Clouds Based on Automatic Detection of Seed Points. Remote Sens. 2023, 15, 1619. [Google Scholar] [CrossRef]
- Popescu, S.C.; Wynne, R.H.; Nelson, R.F. Estimating plot-level tree heights with lidar: Local filtering with a canopy-height based variable window size. Comput. Electron. Agric. 2002, 37, 71–95. [Google Scholar] [CrossRef]
- Zhang, C.; Zhou, Y.; Qiu, F. Individual Tree Segmentation from LiDAR Point Clouds for Urban Forest Inventory. Remote Sens. 2015, 7, 7892–7913. [Google Scholar] [CrossRef]
- Zhen, Z.; Quackenbush, L.J.; Zhang, L. Trends in Automatic Individual Tree Crown Detection and Delineation—Evolution of LiDAR Data. Remote Sens. 2016, 8, 333. [Google Scholar] [CrossRef]
- Yao, W.; Krzystek, P.; Heurich, M. Tree species classification and estimation of stem volume and DBH based on single tree extraction by exploiting airborne full-waveform LiDAR data. Remote Sens. Environ. 2012, 123, 368–380. [Google Scholar] [CrossRef]
- Mielcarek, M.; Stereńczak, K.; Khosravipour, A. Testing and evaluating different LiDAR-derived canopy height model generation methods for tree height estimation. Int. J. Appl. Earth Obs. Geoinf. 2018, 71, 132–143. [Google Scholar] [CrossRef]
- Wang, X.; Guo, B. Protection of Metasequoia glyptostroboides Hu et Cheng in China. For. Stud. China 2009, 11, 249. [Google Scholar] [CrossRef]
- Xie, H.; Wen, Z.; Zhong, S.; Yang, M.; Li, C.; Li, Z.; Ye, J. Measure method research of tree height and tree crown by non-prism total station. J. Cent. South Univ. For. Technol. 2011, 31, 53–58. [Google Scholar] [CrossRef]
- Zhao, X.; Guo, Q.; Su, Y.; Xue, B. Improved progressive TIN densification filtering algorithm for airborne LiDAR data in forested areas. ISPRS J. Photogramm. Remote Sens. 2016, 117, 79–91. [Google Scholar] [CrossRef]
- Chen, Q.; Baldocchi, D.; Gong, P.; Kelly, M. Isolating individual trees in a savanna woodland using small footprint lidar data. Photogramm. Eng. Remote Sens. 2006, 72, 923–932. [Google Scholar] [CrossRef]
- Li, W.; Guo, Q.; Jakubowski, M.K.; Kelly, M. A New Method for Segmenting Individual Trees from the Lidar Point Cloud. Photogramm. Eng. Remote Sens. 2012, 78, 75–84. [Google Scholar] [CrossRef]
- Picos, J.; Bastos, G.; Miguez, D.; Alonso, L.; Armesto, J. Individual Tree Detection in a Eucalyptus Plantation Using Unmanned Aerial Vehicle (UAV)-LiDAR. Remote Sens. 2020, 12, 885. [Google Scholar] [CrossRef]
- Yin, D.; Wang, L. Individual mangrove tree measurement using UAV-based LiDAR data: Possibilities and challenges. Remote Sens. Environ. 2019, 223, 34–49. [Google Scholar] [CrossRef]
- Huang, H.; He, S.; Chen, C. Leaf Abundance Affects Tree Height Estimation Derived from UAV Images. Forests. 2019, 10, 931. [Google Scholar] [CrossRef]
- García, M.; Riaño, D.; Chuvieco, E.; Danson, F.M. Estimating biomass carbon stocks for a Mediterranean forest in central Spain using LiDAR height and intensity data. Remote Sens. Environ. 2010, 114, 816–830. [Google Scholar] [CrossRef]
- Lefsky, M.A.; Cohen, W.B.; Parker, G.G.; Harding, D.J. Lidar Remote Sensing for Ecosystem Studies: Lidar, an emerging remote sensing technology that directly measures the three-dimensional distribution of plant canopies, can accurately estimate vegetation structural attributes and should be of particular interest to forest, landscape, and global ecologists. Bioscience 2002, 52, 19–30. [Google Scholar] [CrossRef]
- Dittmann, S.; Thiessen, E.; Hartung, E. Applicability of different non-invasive methods for tree mass estimation: A review. For. Ecol. Manag. 2017, 398, 208–215. [Google Scholar] [CrossRef]
- Yu, X.; Hyyppä, J.; Vastaranta, M.; Holopainen, M.; Viitala, R. Predicting individual tree attributes from airborne laser point clouds based on the random forests technique. ISPRS J. Photogramm. Remote Sens. 2011, 66, 28–37. [Google Scholar] [CrossRef]
Disclaimer/Publisher’s Note: The statements, opinions and data contained in all publications are solely those of the individual author(s) and contributor(s) and not of MDPI and/or the editor(s). MDPI and/or the editor(s) disclaim responsibility for any injury to people or property resulting from any ideas, methods, instructions or products referred to in the content. |
© 2025 by the authors. Licensee MDPI, Basel, Switzerland. This article is an open access article distributed under the terms and conditions of the Creative Commons Attribution (CC BY) license (https://creativecommons.org/licenses/by/4.0/).