Article

Elemental Stoichiometry of Tropical Peatland Trees: Implications for Adaptation and Carbon Sequestration †

by
Moh Syukron Ismail
1,
Sulistijorini Sulistijorini
2,
Mafrikhul Muttaqin
2,
Zakaria Al Anshori
3,
Muhammad Rifki Rizaldi
2,
Lahiru Wijedasa
4,5,
Jared Moore
6,
Randi Agusti
7,
Sanjay Swarup
8 and
Triadiati Triadiati
2,9,*
1
Plant Biology Study Program, Faculty of Mathematics and Natural Sciences, IPB University, Dramaga Campus, Bogor 16680, Indonesia
2
Department of Biology, Faculty of Mathematics and Natural Sciences, IPB University, Darmaga Campus, Bogor 16680, Indonesia
3
Yayasan Botani Tropika Indonesia (Botanika), Bogor 16112, Indonesia
4
ConservationLinks, 100, Commonwealth Crescent, #08-80, Singapore 140100, Singapore
5
Integrated Tropical Peatland Programme (INTPREP), NUS Environmental Research Institute, Singapore 138602, Singapore
6
Department of Geography, National University of Singapore, Singapore 117570, Singapore
7
Nusantara Climate Initiative, 18 Office Park, lv. 22, Jl. TB Simatupang, Pasar Minggu, Jakarta Selatan 12520, Indonesia
8
NUS Environment Research Institute, National University of Singapore, Singapore 117570, Singapore
9
Biotech Center, IPB University, Dramaga, Bogor 16690, Indonesia
*
Author to whom correspondence should be addressed.
This manuscript is part of a Master thesis by the author Moh Syukron Ismail, available online at https://repository.ipb.ac.id/.
Forests 2025, 16(9), 1379; https://doi.org/10.3390/f16091379
Submission received: 30 July 2025 / Revised: 16 August 2025 / Accepted: 19 August 2025 / Published: 28 August 2025
(This article belongs to the Section Forest Soil)

Abstract

Indonesia has 13.43 million hectares of tropical peatlands, the largest in Southeast Asia, which are crucial for carbon sequestration. This function is influenced by vegetation nutrient content, particularly carbon (C), nitrogen (N), phosphorus (P), and potassium (K), which regulate biogeochemical cycles and peat formation. This study analyzed stoichiometric profiles of tree species in South Sumatra peatlands based on (1) C:N ratios across roots, stems, twigs, and leaves, and identified species with traits associated with high carbon sequestration potential, and (2) leaf N:P:K stoichiometry to infer nutrient limitations. Research was conducted in a 1-hectare primary peatland plot within the PT. Tri Pupa Jaya conservation area. C, N, P, and K contents were measured using Kjeldahl distillation, spectrophotometry, flame photometry, and the Walkley–Black method following acid digestion. Stoichiometric distribution was visualized with violin-box plots and species grouped through hierarchical clustering. Among 153 identified species, stems showed the highest mean C:N ratio (314.9 ± 210.8), while leaves had the lowest (29.7 ± 13.0). Species were grouped into three clusters by C:N ratios across four organs, with six in clusters 1 and 2 showing high carbon sequestration potential. Leaf N:P:K stoichiometry suggested nitrogen, phosphorus, or combined N + P limitations.

1. Introduction

Peatlands cover about 423 million hectares (ha) globally and serve as significant carbon stores [1,2,3]. Indonesia hosts the largest area of tropical peatlands in Southeast Asia, covering 13.43 million ha, with Sumatra holding the largest area (5.85 million ha) [4]. Unfortunately, these ecosystems are increasingly threatened by deforestation, drainage, and agricultural conversion. Nearly half of Southeast Asia’s peatlands, about 12.9 million ha, had been deforested by 2006 [5]. In Indonesia, rapid land-use change since 2000 has resulted in a 28.89% reduction of peatland extent by 2014, with Sumatra experiencing the greatest loss [6]. The scale of degradation highlights the need to protect the ecological functions of peatlands, which include storing carbon and regulating climate.
Tropical peatlands are vital for carbon sequestration, storing vast amounts of “irrecoverable carbon” that cannot be rapidly replaced once released to the atmosphere [7]. Indonesia’s peatlands store an estimated 28.1 gigatons of carbon, with Sumatra contributing around 50% [8,9]. Peatlands help mitigate climate change by reducing atmospheric CO2 [4]. These processes are tied to the characteristics of peatlands, where partially decomposed organic matter accumulates in waterlogged, acidic, and oxygen-poor soils greatly slowing the decomposition of plant material [10,11,12]. Peat composition varies with plant species composition, as different species influence the rate and nature of peat formation [13,14]. Tropical peatlands are dominated by dense forests, where peat is derived from woody materials such as fallen trunks, branches, and roots [15]. The slow decomposition in these ecosystems results from both environmental constraints and the intrinsic chemical and structural defenses of plant tissues [16].
Recent reforestation efforts in tropical peatlands have often prioritized fast-growing native species to accelerate canopy closure [17,18,19]. This focus may overlook species-specific nutrient dynamics, such as tissue stoichiometry, that influence microbial activity, nutrient mineralization, and carbon storage [20,21]. Plant nutrient stoichiometry examines the relative proportions of chemical elements in plant tissues, and understanding these stoichiometric profiles can reveal species’ adaptation strategies and functional roles within ecosystems. In peatlands, carbon (C), nitrogen (N), and phosphorus (P) are key elements driving biogeochemical cycles and peat formation [22]. The C:N ratio, for example, is strongly linked to decomposition and nutrient cycling where species with higher ratios decompose more slowly and promote carbon accumulation [23], while lower ratios accelerate decomposition by increasing nitrogen availability for microbes [24,25]. While most decomposition studies assess C:N in senesced plant litter, recent evidence shows that C:N in living tissues better predicts microbial respiration, as it reflects persistent chemical traits influencing decomposition throughout plant life [26]. This highlights a critical gap in current peatland restoration research, where C:N stoichiometry has rarely been incorporated into species selection frameworks.
In addition to C:N, another key indicator of plant function is the N:P ratio. These ratios have emerged as reliable indicators of nutrient limitation [27,28]. Expanding on this approach, Venterink et al. [29] incorporated potassium (K) and introduced a ternary diagram to distinguish nutrient limitation and proposed threshold values of N:P = 14.5, N:K = 2.1, and K:P = 3.4 as critical ratios derived from fertilization experiments in temperate herbaceous wetlands. Although these thresholds were not developed for tropical ecosystem, they have been applied in several tropical wetland studies [30,31]. This information offers a useful approximation for identifying potential nutrient limitations in peatland tree communities and may also help guide nutrient management strategies in tropical peatland restoration.
Recent work by Yanbuaban et al. [32] analyzed the concentrations of these nutrients in the leaves of plants growing in Thailand’s tropical peatlands. However, their study did not examine stoichiometric relationships or nutrient ratios such as C:N or N:P:K. Research conducted in temperate peatlands has shown an average leaf C:N:P:K ratio of 445:14:1:9 during the peak growing season [33]. Unlike temperate peatlands, research into the nutrient stoichiometry of vegetation in tropical peatlands remains limited. Considering the vital role of tropical peatlands and the significance of plant nutrient stoichiometry, this study aims to analyze the stoichiometric profiles of tree species in the peatlands of South Sumatra based on (1) C:N ratios across multiple organs (roots, stems, twigs, and leaves) and identified species with traits associated with high soil carbon sequestration potential, and (2) leaf N:P:K stoichiometry, and to infer potential nutrient limitations in peatland tree species. In this study, we address whether nutrient stoichiometry in tropical peatlands differs from that in other ecosystems, particularly temperate peatlands. We further hypothesize that tree species with higher tissue C:N ratios across multiple organs will exhibit greater carbon sequestration potential.

2. Materials and Methods

2.1. Study Area

The research was conducted from October 2021 to July 2022 on PT. Tri Pupa Jaya (TPJ) property, Musi Banyuasin Regency, South Sumatra Province (1°44′16.24″ S, 104°12′16.08″ E), Indonesia. The site is located near an active production forest concession (Acacia and Eucalyptus pellita for wood fiber) with some natural forest conservation areas. The site was characterized by an average soil pH of 3.08.

2.2. Sampling

Sampling was conducted within a 1 ha permanent plot in primary peatland forest. All trees with a diameter at breast height (DBH) > 10 cm were identified to species level. From each species recorded in the inventory, one representative individual was purposively selected based on healthy morphological condition and accessibility for sampling. From the selected individuals, roots, stems, twigs, and leaves were collected for nutrient analysis. Root samples, with a maximum diameter of 0.5 cm, were excavated from a soil depth of 30–50 cm. Stem samples were obtained at DBH using an increment borer to a depth of 20 cm, with bark discarded. Twigs with a diameter of 2–5 cm were selected for sampling. Leaf samples consisted of sun-exposed mature leaves from the outer crown of each tree.

2.3. Sample Preparation and Extraction

Samples were prepared at the Department of Biology, IPB University. Plant samples were cleaned with deionized water and then dried in an oven at 70 °C until a constant dry weight was achieved. The dried samples were ground using a wood grinder with a 0.5 mm filter. Following this, the refined samples were extracted. The extraction followed the wet ashing method with H2SO4 and the wet ashing method with HNO3 and HClO4 as described in the Technical Guidelines for Chemical Analysis of Soil, Plants, Water, and Fertilizers by Balai Penelitian Tanah. Chemical analyses were performed at the Soil, Plant, Fertilizer, and Water Laboratory, Balai Penelitian Tanah [34].
For the wet ashing method with H2SO4, 0.250 g of plant samples was combined with 1 g selenium catalyst and 2.5 mL concentrated H2SO4 in a digestion tube and left overnight. The mixture was heated at 350 °C until white fumes appeared, then cooled to room temperature. The digest was diluted with ion-free water to 50 mL, homogenized, and left overnight to settle. The extract was used for N analysis.
For the wet ashing method with HNO3 and HClO4, 0.500 g of sample was mixed with 5 mL concentrated HNO3 and left overnight. Digestion proceeded at 100 °C for 1 h, then at 150 °C until yellow fumes ceased, and finally at 200 °C until white vapors formed and approximately 0.5 mL of clear extract was obtained. After cooling, the digest was diluted with ion-free water to 50 mL and homogenized. This extract was used for P and K analysis.

2.4. Nutrient Analyses

Chemical analyses were performed at the Soil, Plant, Fertilizer, and Water Laboratory, Balai Penelitian Tanah, accredited under ISO 17025:2017 [35] (standard for testing and calibration laboratories), following the Technical Guidelines for Chemical Analysis of Soil, Plants, Water, and Fertilizers published by the institute [34].
Nitrogen concentrations were determined using the Kjeldahl distillation method. A 10 mL sample extract was mixed with deionized water, boiling stones, and 10 mL of 40% NaOH in a distillation flask. The mixture was distilled into a receiving flask containing 10 mL of 1% boric acid and two drops of Conway indicator. The distillate (50–75 mL) was then titrated with 0.050 N H2SO4, and titration volumes were recorded for both the sample (Vs) and blank (Vb). The following equation was used to determine the N content:
Nitrogen content (%) = (Vs − Vb) × N × 28 × cf
where N is the normality of the H2SO4 solution and cf is the water correction factor = 100/(100 − % water content) [34]. The term cf in Equations (2)–(4) refers to the same definition.
Phosphorus concentration was quantified using a colorimetric staining method. One milliliter of sample extract and PO4 standard solutions (0–20 ppm) were each diluted 10-fold with deionized water. Two milliliters of the diluted solutions were transferred to test tubes, mixed with 10 mL of ascorbic acid P dye reagent, homogenized, and left to stand for 30 min. Absorbance was measured at 693 nm using a spectrophotometer. Determination of the P content was based on this equation:
Phosphorus   content   ( % )   =   ppm   curve   ×   0.1   ×   31 95   ×   cf
where the ppm curve is the concentration of the sample as determined from a calibration curve between the standard series levels and their readings after blank correction.
Potassium concentration was measured by flame photometry. One milliliter of the sample extract and K standard series was mixed with 9 mL of 0.25% La solution to ensure homogeneity. The K concentration was measured using a flame photometer, referencing the standard series for comparison. The amount of K content was determined through the following equation:
Potassium content (%) = ppm curve × 0.1 × cf
Carbon was analyzed using the Walkley–Black method. A 0.05–0.1 g sample was added to 5 mL of 2 N K2Cr2O7 and 7 mL of concentrated H2SO4 (98%), shaken until homogeneous and left overnight. The solution’s absorbance was measured at 651 nm using a spectrophotometer, referencing a 0–250 ppm carbon standard series.
C-organic   content   ( % ) = ppm   curve   ×   100 m g   o f   s a m p l e   ×   cf
All element ratios were expressed as mass ratios, calculated by directly dividing the percentage content of one element by another.

2.5. Data Analysis

Violin-box plots were used to show the distribution and variability of C:N ratios across plant organs and N:P, N:K, and K:P ratios in leaves, with the coefficient of variation (CV) calculated to quantify relative variability.
Hierarchical cluster analysis was performed using Ward’s method on a distance matrix to group species based on their nutrient ratios, without data normalization to retain the interpretive meaning of the ratios. The optimal number of clusters for each dataset was determined by evaluating silhouette scores and stability profiles using the adjusted Rand index (ARI) and normalized mutual information (NMI). The C:N ratio across organs was grouped into three clusters (silhouette score = 0.436, mean ARI = 0.834, NMI = 0.807), while the leaf NPK stoichiometry data were grouped into four clusters (silhouette score = 0.379, mean ARI = 0.650, NMI = 0.687). Nutrient distribution patterns within each cluster were further examined using heatmaps, based on Min–Max normalized data by organ for the C:N analysis and by nutrient ratio for the NPK stoichiometry analysis. Because the assumptions for ANOVA were not met, a Kruskal–Wallis test was used to compare ratios among clusters followed by Dunn’s post hoc test for pairwise comparisons.
An UpSet plot was used to identify overlapping species with high C:N ratios across multiple organs based on the top 25% (above the 75th percentile) of C:N values for each organ. This approach was selected over conventional Venn diagrams because it allows clearer representation of intersections among more than three sets. A triaxial diagram was used to assess nutrient deficiencies based on leaf NPK percentages, using critical ratio values of N:P (14.5), N:K (2.1), and K:P (3.4) as proposed by Venterink et al. [29]. All statistical analyses were conducted using R software (version 3.5.1).

3. Results

3.1. C:N Ratios in Plant Organs and N:P:K Stoichiometry in Leaves

The distribution of C:N ratios across roots, stems, twigs, and leaves of 153 peatland tree species is presented in Figure 1A. Among the four organs, stems exhibited the highest mean C:N ratio but also the greatest variability, as reflected by both their wide distribution in the plot and the highest CV. In contrast, leaves had the lowest mean C:N ratio and the most compact distribution. Twigs and roots showed intermediate means with moderate CV. These patterns reflected organ-specific differences in carbon and nitrogen allocation, which are likely linked to their distinct physiological functions.
Figure 1B shows the distribution of N:P, N:K, and K:P ratios in the leaves of 153 peatland tree species. Among the three ratios, N:P exhibited the highest mean value while N:K had the lowest. Although the N:P ratio appeared to have the widest distribution in the violin-box plot, it showed the lowest CV, indicating lower relative dispersion. In contrast, the N:K ratio displayed the narrowest visual spread but had a higher CV, reflecting greater relative variability in proportion to its smaller mean. The K:P ratio had an intermediate mean value but it exhibited the highest CV.

3.2. Hierarchical Clustering Based on C:N Ratios Across Four Organs

Cluster analysis based on nutrient stoichiometry is particularly important in peatland ecosystems, where environmental factors have been shown to exert a stronger influence on organ stoichiometry than genetic factors [36]. Hierarchical clustering based on C:N ratios across four plant organs from 153 species resulted in three distinct clusters (Figure 2). The clusters were largely distinguished by stem C:N ratios: high (Clusters 1), moderate (Clusters 2), and low (Clusters 3). Cluster 1 not only had high stem C:N ratios but also showed high C:N ratios in root and twig compared to the other clusters. Within Cluster 2, some species exhibited relatively high twig C:N ratios, while others displayed low to moderate values. Cluster 3 consistently showed the lowest C:N ratios across all organs (Table 1). C:N ratios differed significantly among clusters for roots, stems, and twigs (Kruskal–Wallis, p < 0.05), but no significant difference was observed for leaves (p > 0.05).
Several plant families were commonly found in specific clusters, such as Calophyllaceae (3 species) in Cluster 1, Dipterocarpaceae and Euphorbiaceae (5 species each) in Cluster 2, and Lauraceae (8 species) and Annonaceae (7 species) in Cluster 3. Several genera occurred in more than one cluster, such as Syzygium, Ficus, and Litsea.

3.3. Species with the Highest C:N Ratios

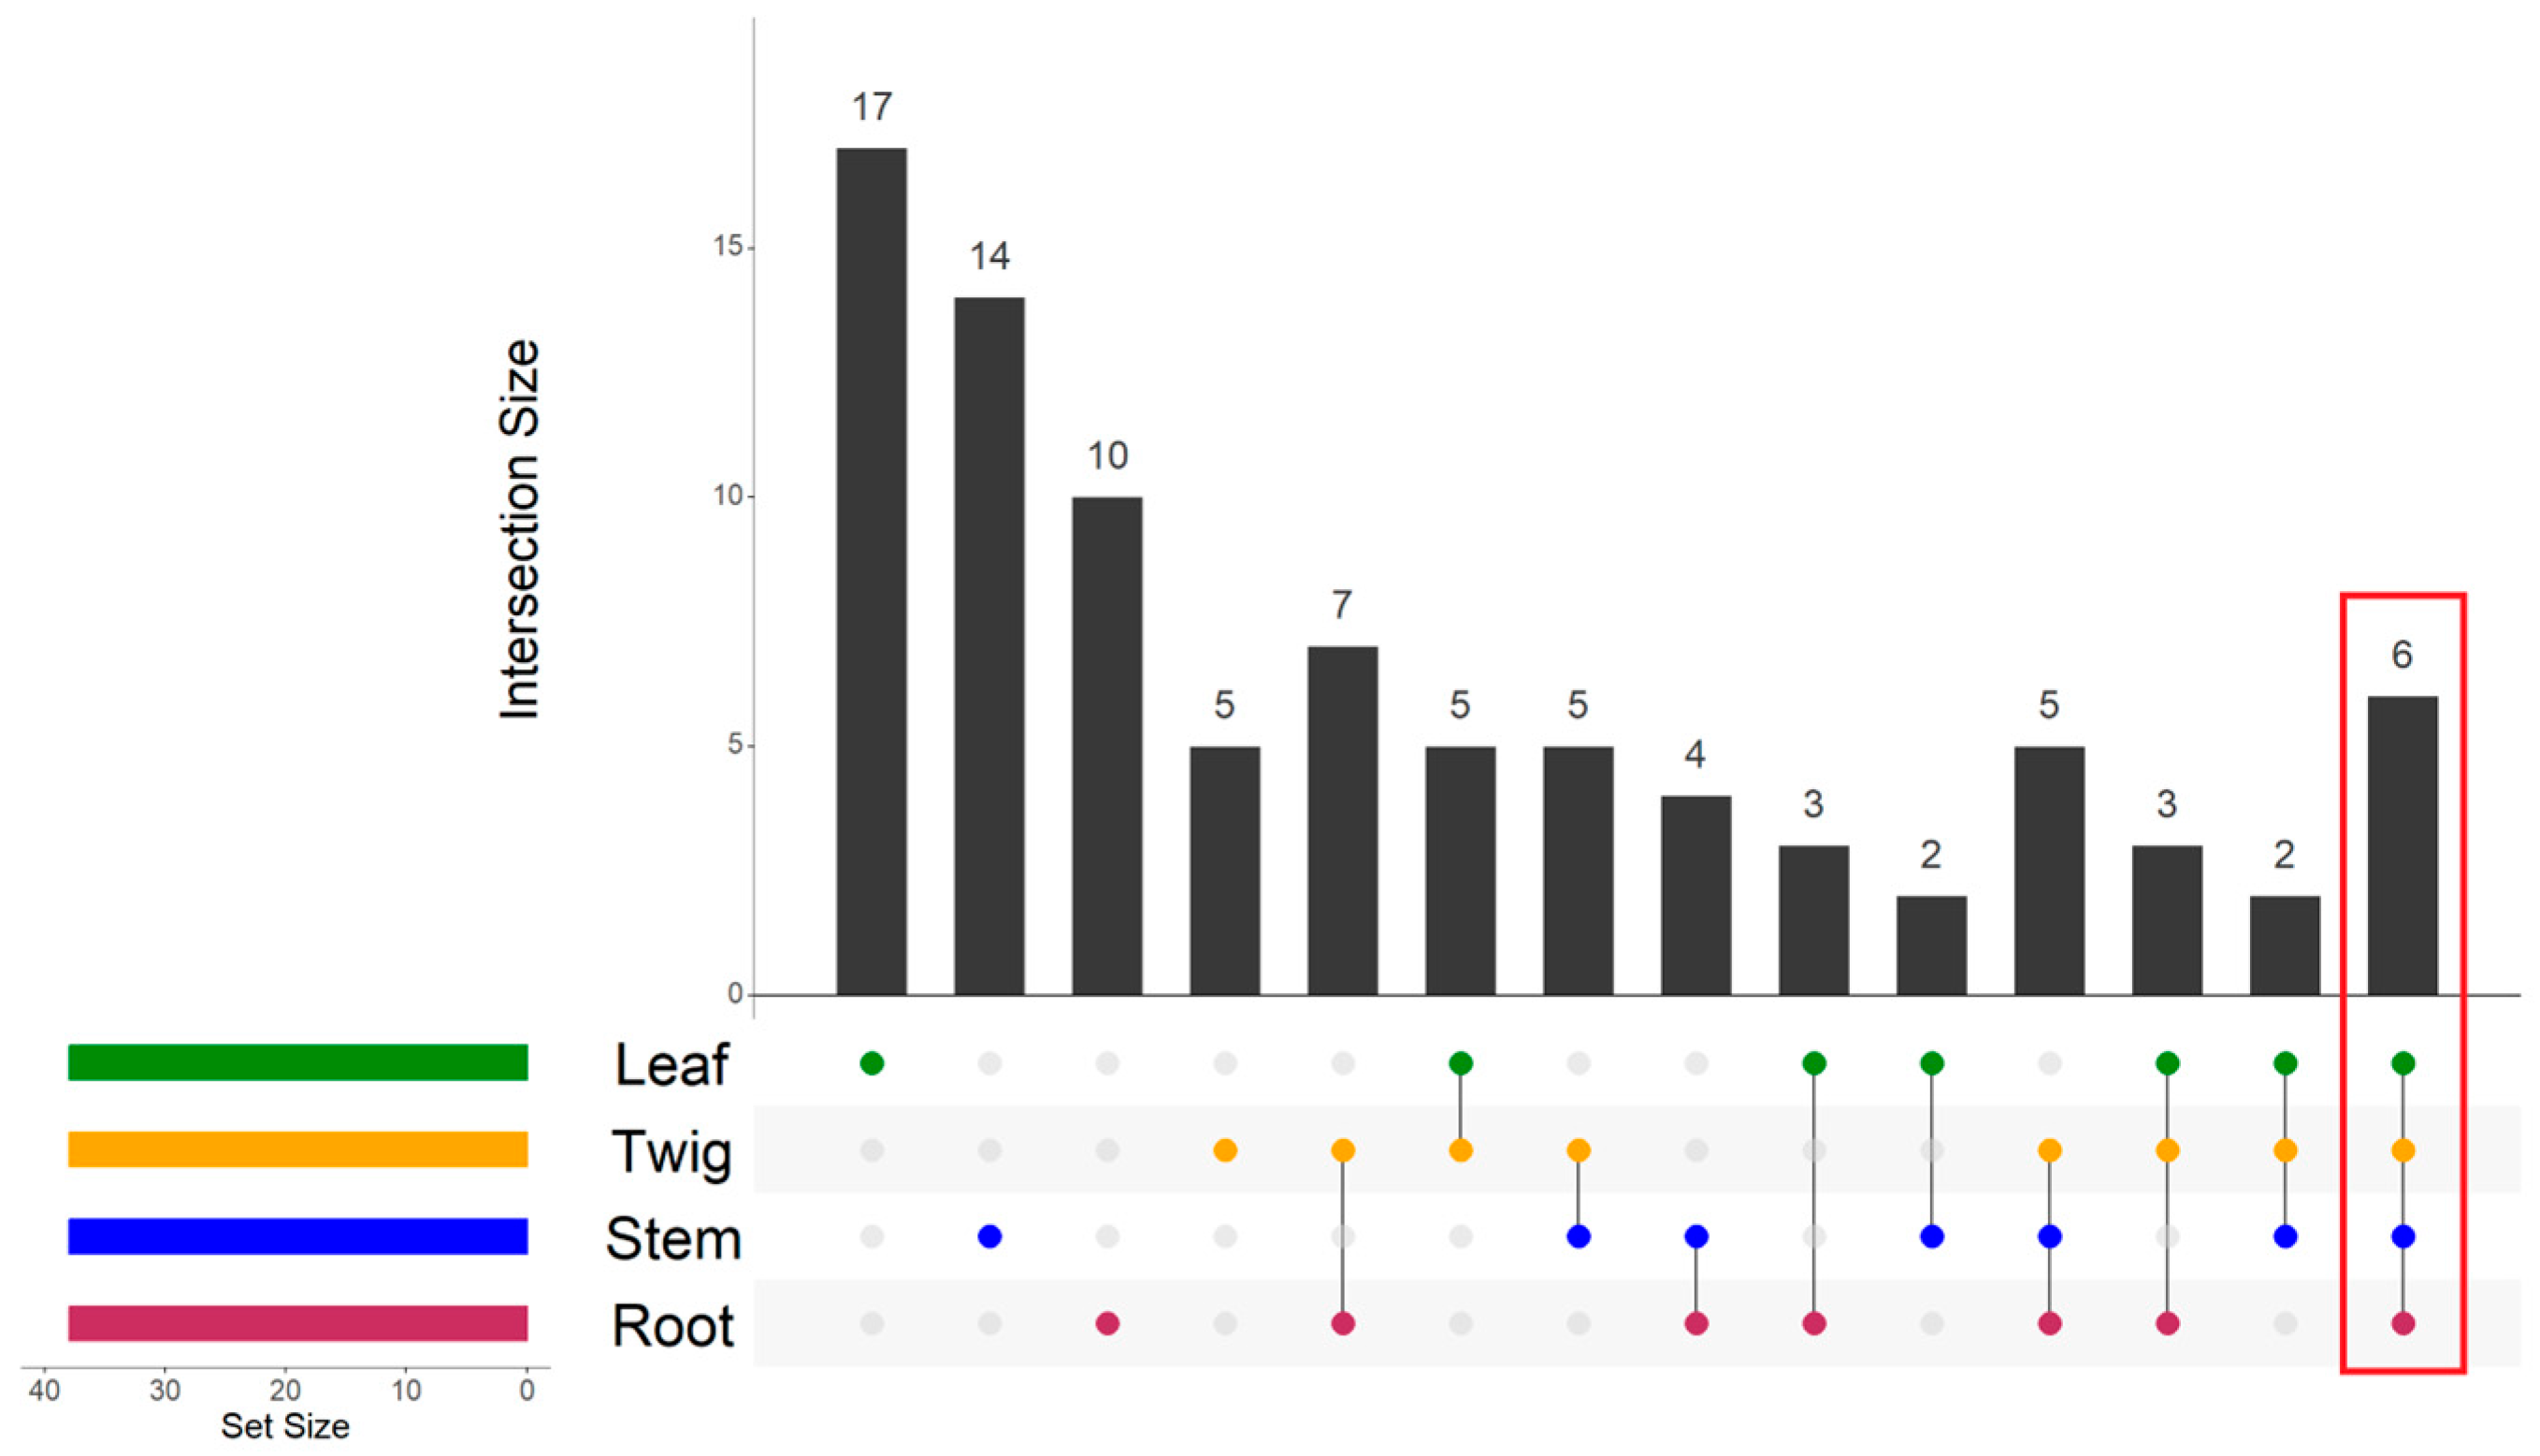
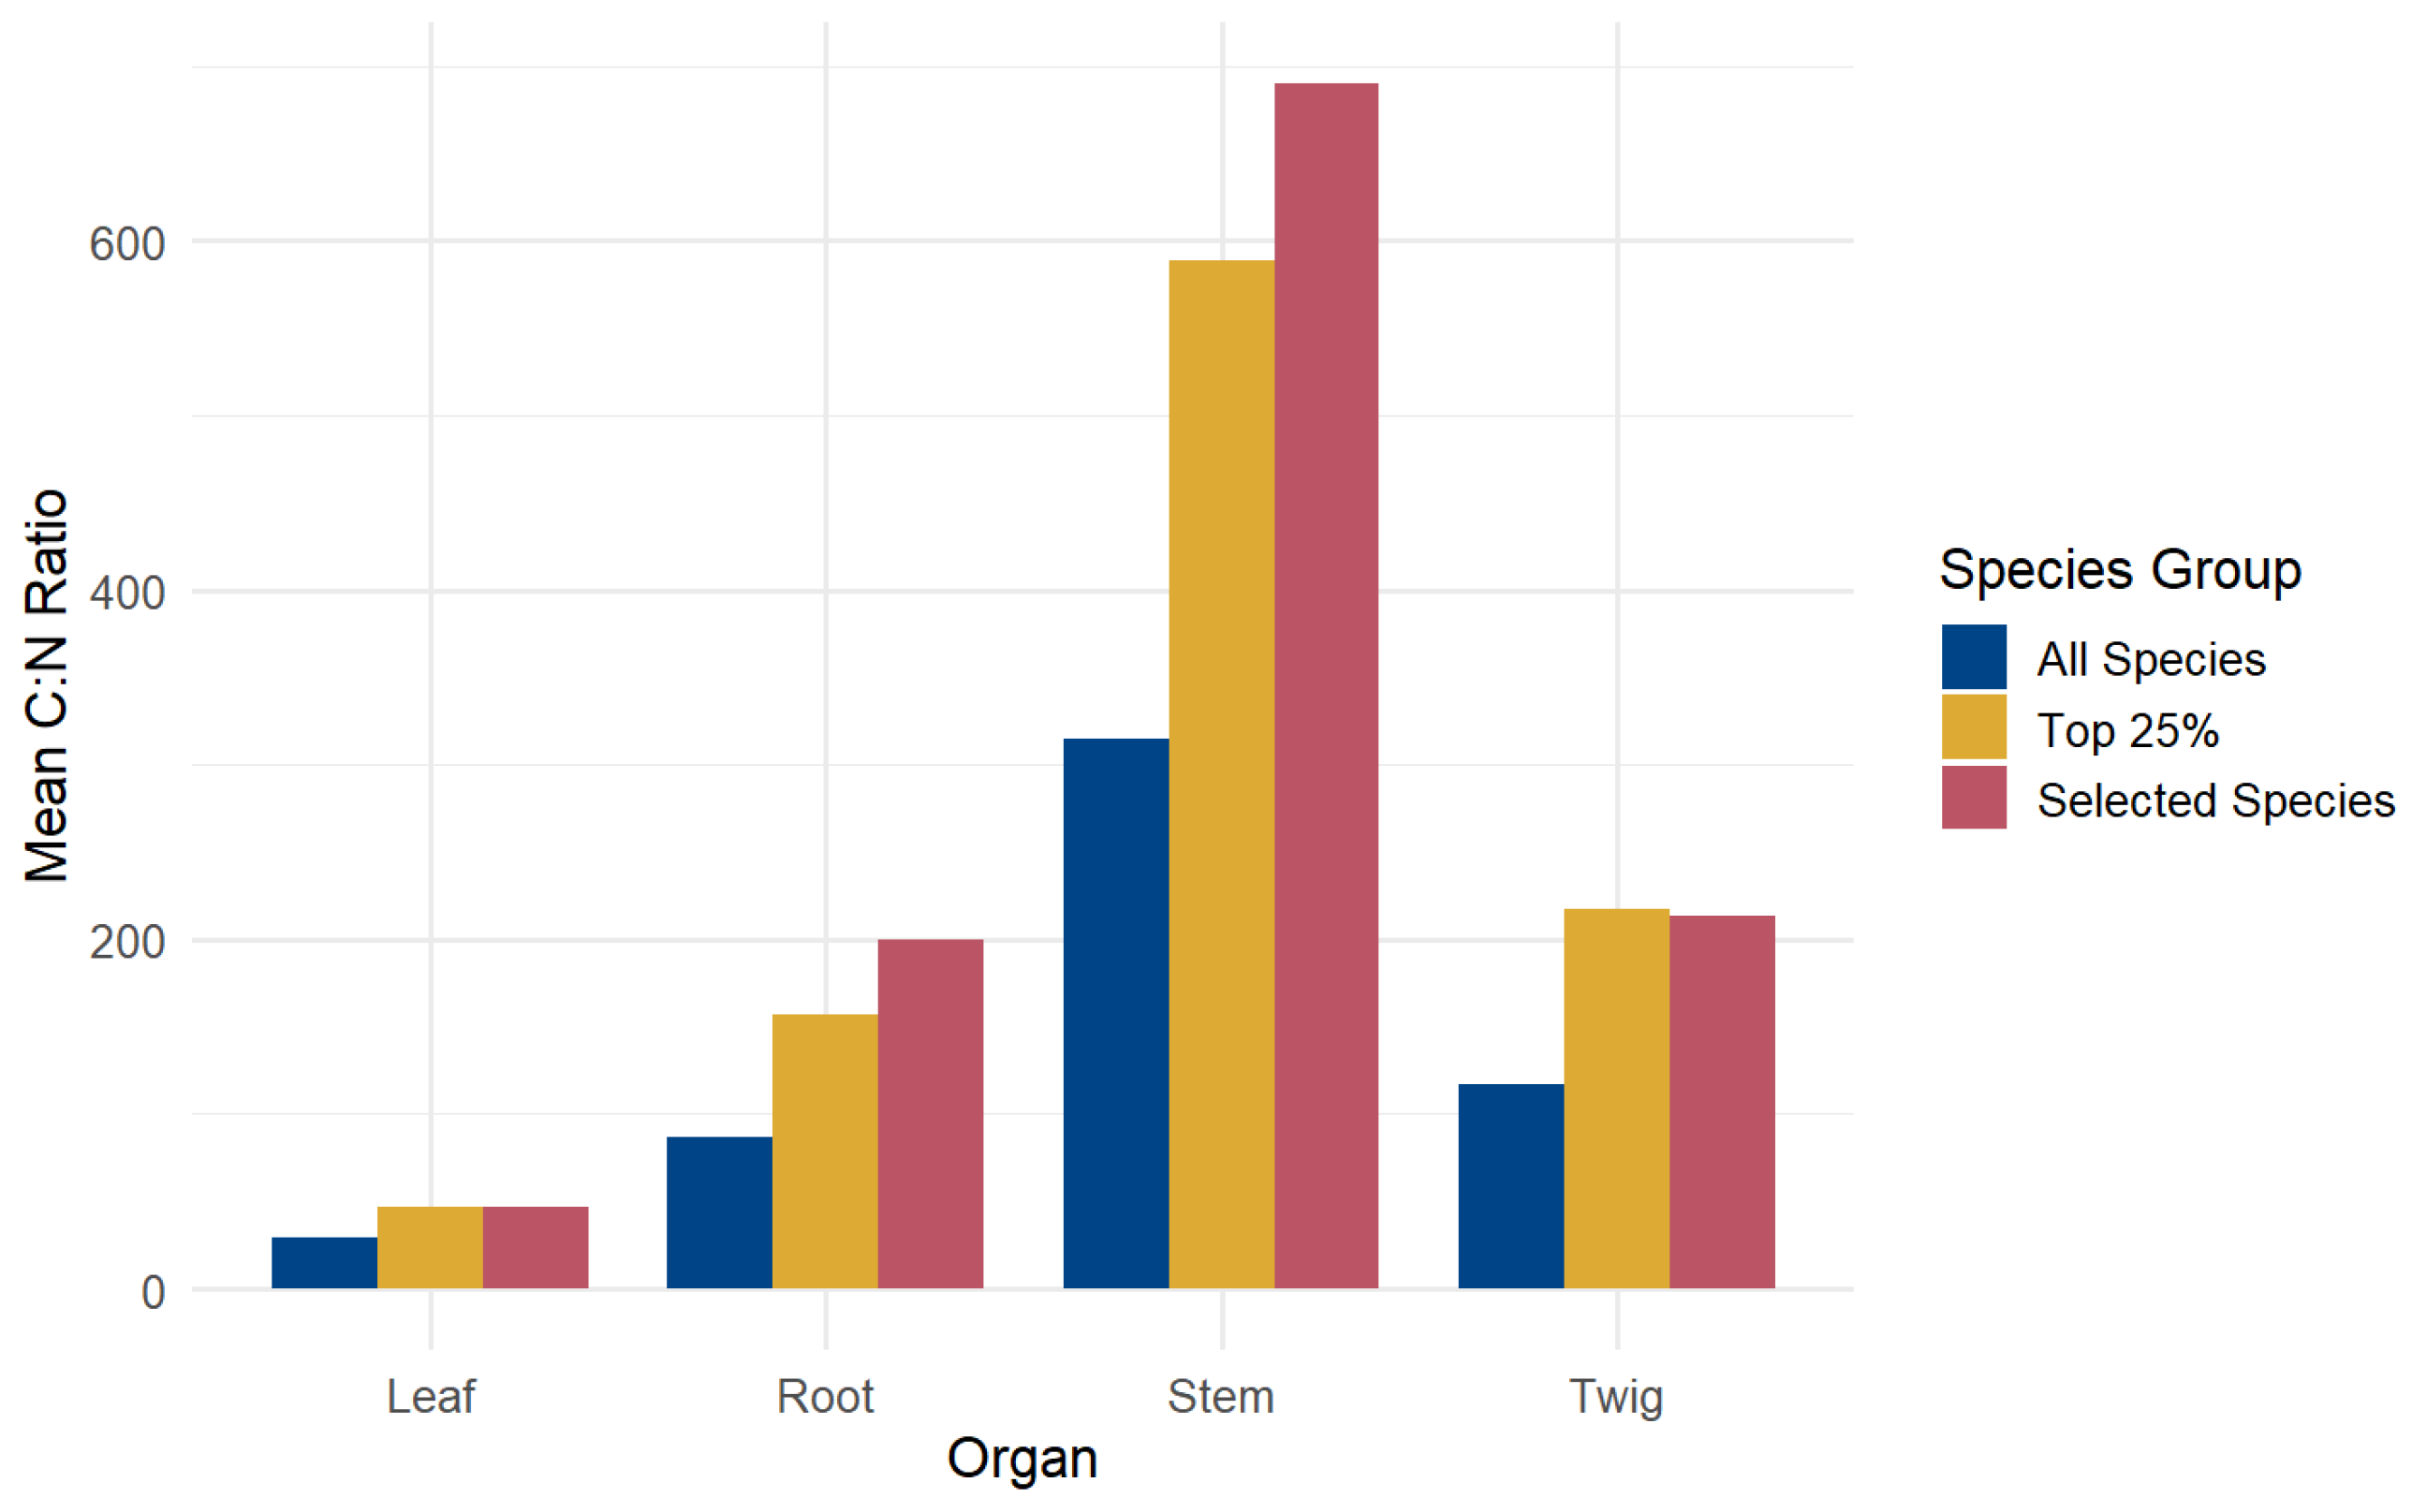
Figure 3 illustrates the number of species falling within the top 25% (above the 75th percentile) of C:N ratios for each plant organ. The largest group comprised 17 species with high C:N ratios in leaves, indicated by a single-colored dot for the leaf organ. The second and third largest groups were species with high C:N ratios in stem (14 species) and roots (10 species), respectively. Notable intersections were also observed among species with high C:N ratios in branches, stems, and roots (5 species), as well as in branches and roots (7 species). Six species consistently showed high C:N ratios across all four organs, represented by four connected colored dots. These included three species from Cluster 1, namely Calophyllum sclerophyllum Vesque, Chionanthus evenius (Stapf) Kiew, and Combretocarpus rotundatus (Miq.) Danser, and three from Cluster 2, which are Garcinia cuspidate King, Nephelium maingayi Hiern, and Jackiopsis ornata (Wall.) Ridsdale. These six species had an average C:N ratio around double that of the average of all observed species for each organ (Figure 4).

3.4. Hierarchical Clustering Based on Leaves N:P:K Stoichiometry

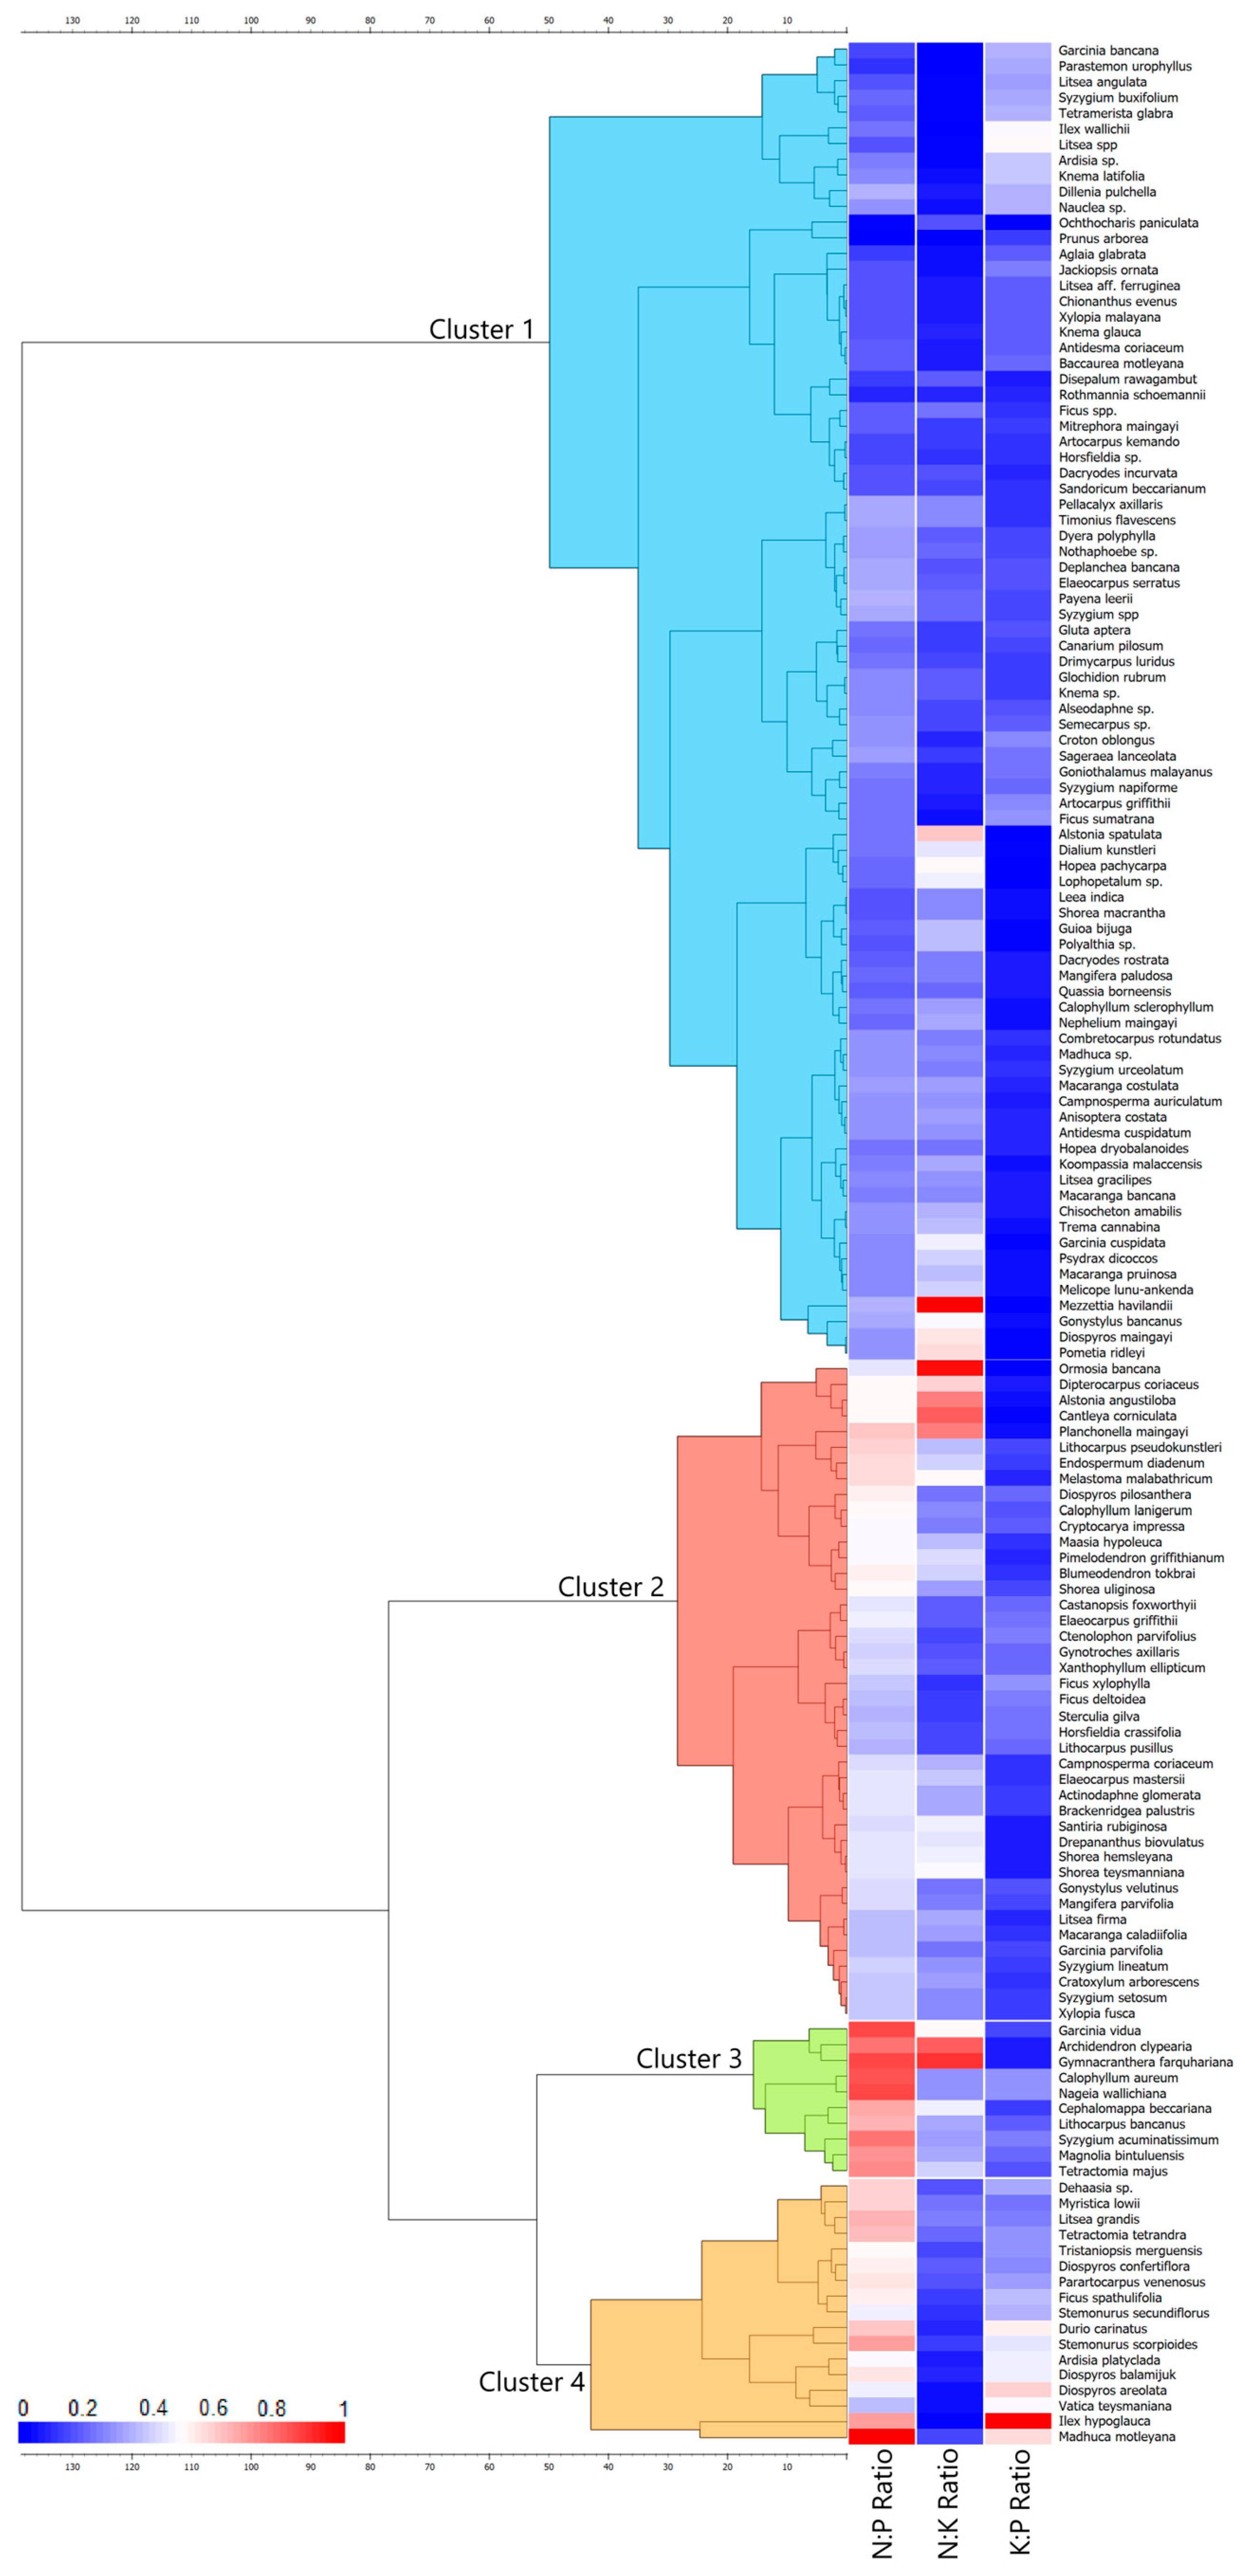
Hierarchical clustering based on the leaf N:P, N:K, and K:P ratios of 153 peatland tree species resulted in four distinct clusters (Figure 5). The heatmap reveals that these clusters are grouped based on their N:P ratios: low (clusters 1), low to moderate (clusters 2), moderate to high (clusters 4), and high (clusters 3). In the first cluster, other than low N:P ratios this cluster also shows a combination of moderate to low N:K and K:P ratios compared to the other clusters. In contrast, Cluster 3, which exhibited the highest N:P ratios, was characterized with high N:K and low to moderate K:P ratios. Cluster 4, characterized by moderate to high N:P ratios, had the highest K:P ratio (Table 2). All three leaf nutrient ratios (N:P, N:K, and K:P) differed significantly among clusters (p < 0.05).
Family representation varied across clusters, with Annonaceae (7 species) and Lauraceae (6 species) common in Cluster 1, Dipterocarpaceae and Euphorbiaceae (4 species each) frequent in Cluster 2, and Ebenaceae (3 species), Moraceae, and Stemonuraceae (2 species each) occurring more often in Cluster 4. Several genera, such as Syzygium, Ficus, and Litsea, appeared in multiple clusters.

3.5. Nutrient Deficiencies Based on N:P:K Stoichiometry

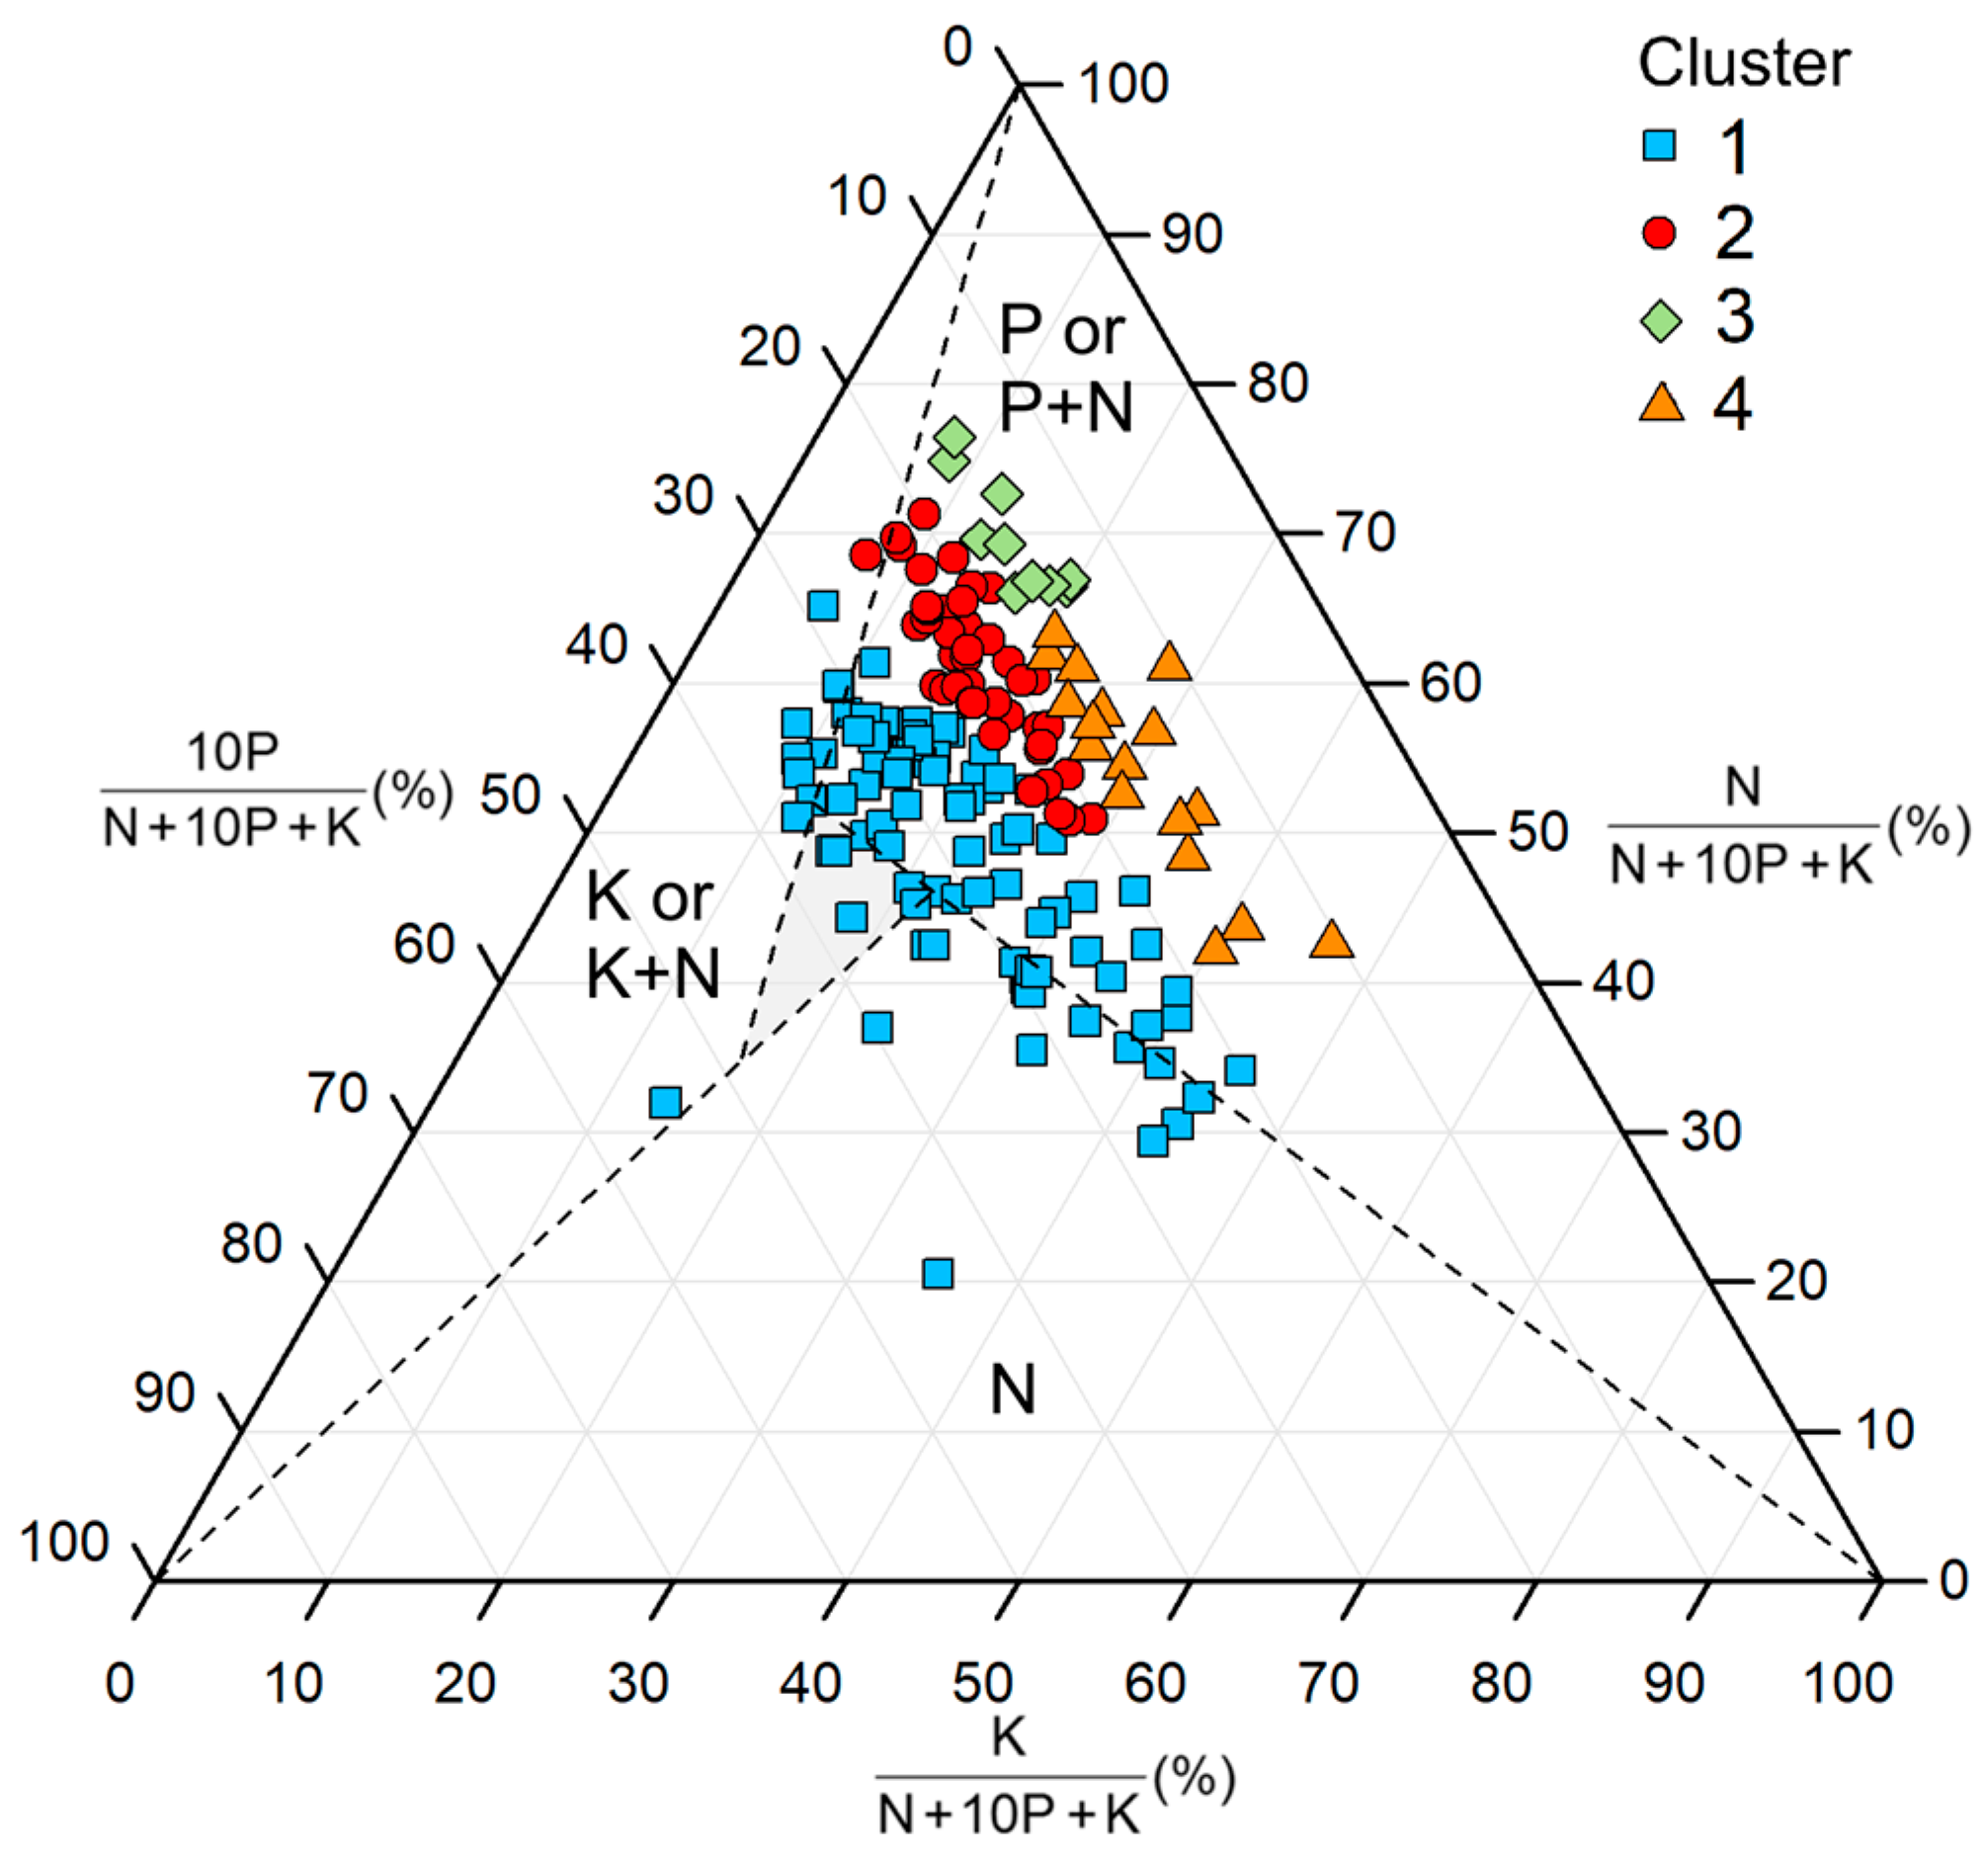
The N:P:K ratio is an indicator of nutrient limitation in plants. One approach is the use of a triaxial diagram incorporating critical thresholds: (1) N-limited sites, characterized by N:P < 14.5 and N:K < 2.1; (2) P- or P+N-limited sites, defined by N:P > 14.5 and K:P > 3.4; and (3) K- or K+N-limited sites, where N:K > 2.1 and K:P < 3.4 [29]. The clusters obtained from Figure 5 were further analyzed using this diagram. Figure 6 shows species from Clusters 3 and 4 positioned in zones indicative of P- or P+N-limitation. Species from Clusters 1 were distributed across all areas. Most species (120) were classified as P- or P+N-limited, followed by N-limited (17 species) and K- or K+N-limited (11 species).

4. Discussion

4.1. Organ C:N Ratios and Implications for Ecosystem and Carbon Sequestration

The C:N ratio in plant tissue offers key insights into species resource allocation strategies, photosynthetic efficiency, and ecological interactions [37]. The pattern of C:N ratios across plant organs in this study is consistent with the findings by Zhang et al. [38] and Zhang et al. [37], who investigated diverse forest types across China. Stems exhibited the highest C:N ratios, reflecting their primary role in structural support and carbon storage, particularly in the form of lignin and cellulose [39]. In contrast, leaves had the lowest C:N ratios due to their involvement in metabolically active processes such as photosynthesis, which requires high nitrogen concentrations to support enzymatic activity and chlorophyll synthesis [38]. Roots and twigs had intermediate C:N ratios that aligned with their functional roles in nutrient uptake, transport, and facilitating growth flexibility. Specifically, roots serve as the primary organs for water and nutrient uptake, while twigs facilitate shoot development and nutrient translocation between leaves and stems [38,39].
Furthermore, this study observed a narrower variability in leaf C:N ratios compared to stems, a trend also reported by Zhang et al. [37] and Liang et al. [40]. This tighter regulation of leaf C:N composition reflected their critical role in maintaining efficient photosynthetic function, where precise nitrogen allocation is essential. In contrast, stems which serve primarily structural and transport purposes, exhibit greater flexibility in their C:N composition [37,40,41].
Based on the comparison presented in Table 3, the C:N ratios obtained in this study were generally higher for most plant organs than those reported in previous studies from various forest ecosystems. The higher leaf C:N ratios observed in this study compared with those reported for other tropical ecosystems by Bauters et al. [42] and Fagundes et al. [43] likely reflect the nutrient-poor conditions characteristic of tropical peatland ecosystems [44]. This interpretation is supported by Nwaishi et al. [45], who observed increased C:N ratios in vegetation along a nutrient gradient, with higher ratios in nutrient-poor ecosystems and lower ratios in nutrient-rich ones, emphasizing the connection between nutrient availability and C:N ratio. According to Hogan et al. [46], tissue nitrogen concentrations increased with greater soil fertility, whereas carbon concentrations showed a slight decrease. This pattern implies that in nutrient-poor peatlands, tissue nitrogen remained low while carbon was relatively stable or slightly higher lead to higher C:N ratios compared to others tropical forests.
A broader comparison with forest ecosystems reported by Zhang et al. [38] and Zhang et al. [37], who studied various forest types in China, included tropical forest. The organ-specific C:N ratio values from this study were generally higher, particularly for roots, twigs, and leaves. These differences likely arose from variation in life and growth form, as Zhang et al. [38] included trees, shrubs, and herbs, whereas Zhang et al. [37] examined forests from evergreen broadleaf to coniferous and deciduous types. Jiang et al. [47] shows that trees have higher C:N ratio than shrubs and herbs. However, the mean stem C:N ratio here was lower than the two studies. The slightly lower stem C:N ratio could be linked to the high C:N ratio in leaves, indicating lower leaf nitrogen content. Since nitrogen is essential for photosynthesis, limited nitrogen availability can affect carbon assimilation, thereby influencing carbon allocation to stems [48]. In addition, differences in analytical approaches may also contribute to variation in C:N ratios among studies. The wet chemistry methods (Walkley–Black for C, Kjeldahl for N) used in this study have been shown in comparative analyses to produce C:N ratios that do not fully match those derived from dry combustion methods, despite strong agreement for C and N values individually [49].
Building on these organ-specific trends, the clustering results reveal how variations in organ-level C:N ratios shape species-level differences, offering further insights into how groups of species allocate nutrients and function within peatland ecosystems. Species with high stem C:N ratios, such as those in Clusters 1, allocate more metabolic resources in reinforcing structural tissues [50,51]. The high carbon content in the form of lignin and cellulose enhances mechanical strength and prolongs the longevity of both stems and entire trees, traits typically associated with slow-growing species [50,52]. These species also exhibited relatively high leaf C:N ratios, resulting in slower litter decomposition and nutrient cycling [24,25]. Despite their slower growth [50], selecting high-C:N-ratio trees for peatland revegetation is expected to relatively enhance long-term carbon sequestration through stable organic matter accumulation [24,25]. Wang and Moore [33] observed that the C:N ratio in plants increases as leaves transition from maturity to senescence. This nutrient shift creates imbalance between the nitrogen demands of decomposers and the nitrogen available in high-C:N organic matter, thereby slowing decomposition processes. Supporting this, Carvalho et al. [53] found that high-C:N species are associated with higher soil carbon content.
Conversely, tree species with low stem C:N ratios, such as those in Cluster 3, have higher nitrogen content that supports rapid growth. These species also exhibit lower leaf C:N ratios, reflecting high metabolic activity. Many studies have revealed that lower C:N ratios typically facilitate faster microbial decomposition compared to higher C:N ratios, thereby accelerating nutrient cycling [24,25,37]. The use of fast-growing species for peatland revegetation, especially if combined with fertilizer application, increases soil N and P levels. This nutrient enrichment can accelerate decomposition rates, alter nutrient limitation types, and promote plant growth in the short term [54,55]. However, over the long term, the rapid growth and high litter production of these species may stimulate microbial activity, accelerate organic matter decomposition, increase CO2 emissions, and ultimately reduce long-term carbon sequestration potential [56,57].
The six high-C:N-ratio species identified in this study include several species that are abundant or dominant in some Indonesian peatlands. C. rotundatus and C. sclerophyllum are reported as dominant or co-dominant species in peatland forests of Central and West Kalimantan, occurring across a wide range of peat depths [58,59,60]. In addition, N. maingayi is frequently recorded in multiple plots within Central Kalimantan peatlands [58]. However, the suitability of these species for large-scale restoration also depends on field viability factors such as hydrological regime, seedling survival rates, and competitive interactions with other species, which are known to be major determinants of wetland restoration success [61]. Therefore, while these species hold promise for carbon-focused peatland restoration, their deployment should be guided not only by stoichiometric traits but also by ecological adaptability and regeneration capacity to maximize both establishment success and long-term ecosystem resilience. In addition, variability in vegetation and peat soil C:N:P stoichiometry is strongly influenced by environmental factors such as nutrient availability, seasonal rainfall, water table, and ecosystem disturbances [45,62,63]. Therefore, the application of these species in degraded peatlands should carefully consider site-specific conditions at the target restoration location.

4.2. Leaf N:P:K Stoichiometry and Nutrient Deficiency in Tropical Peatland Trees

N, P, and K are essential nutrients required for the formation of organic compounds such as protein, chlorophyll, ATP, nucleic acids, and phospholipids [39]. Among plant organs, leaves typically exhibit the highest concentrations of nitrogen, phosphorus, and potassium due to their central role in photosynthesis and metabolic activity, making their nutrient stoichiometry a valuable indicator of ecosystem-level nutrient limitations [38,64]. In this study, the mean leaf N:P ratio was 23.89. According to Güsewell [65], an N:P ratio below 10 indicates nitrogen limitation, while a ratio above 20 suggests phosphorus limitation. Other research in wetland ecosystems by Güsewell and Koerselman [28] proposed thresholds of <14 and >16 for nitrogen and phosphorus limitation, respectively. Based on this threshold, the tree species analyzed in this tropical peatland ecosystem were likely experiencing phosphorus deficiency.
The leaf N:P ratio of 23.89 observed in this study is notably higher than the values reported in other studies of tropical forest tree species. Mo et al. [66] examined seven species in a tropical forest of southern China and found that N:P ratios in new and older leaves generally ranged from 15 to 21. Compare to global-scale analysis by Tian et al. [67], mean N:P ratio of for evergreen broad-leaved plants in tropical regions is 21.9. Compared to this study, the high N:P ratio in this study suggested a more pronounced phosphorus limitation among the tropical peatland tree species analyzed [68]. This contrast underscores a potential distinction in nutrient dynamics between tropical peatlands and other tropical forest ecosystems. Additional insight emerges when the data are compared with peatland ecosystems from other climatic regions to better understand differences in nutrient dynamics.
The nutrient ratio patterns observed in this study align with those reported by Wang and Moore [33] in Canadian peatlands, with N:P first followed by K:P and N:K. However, the value of the N:P (23.89) and N:K (3.20) ratios found here are higher than the values reported in their study (14 and 1.5, respectively), while the K:P ratios are similar (~9). These differences may reflect variation in sampling scope and regional vegetation structure. Wang and Moore [33] included mosses, herbs, and deciduous species, whereas this study focused on tree species. Mo et al. [66] found that evergreen broad-leaved species, typical of tropical forests, tend to have higher ratios, particularly N:P ratios, than deciduous or herbaceous species. Additionally, tropical peatlands are dominated by woody species that form lignin-rich peat, while boreal peatlands contain non-woody peat from Sphagnum and sedges [3,9]. These contrasting peat types affect decomposition and microbial activity, shaping nutrient availability [14]. These comparisons highlight that tropical peatland vegetation exhibits distinct nutrient stoichiometry compared to other tropical forests and boreal peatlands.
While overall stoichiometric patterns highlight general nutrient limitations in tropical peatlands, a more nuanced perspective emerges when examining how species group according to their N:P, N:K, and K:P ratios. Cluster 1 (Figure 5) consisted of species with N, P+N, and K+P deficiency, with P+N deficiency being the most prevalent (Figure 6). Despite these combined deficiencies, the low N:P and K:P ratios indicate that nitrogen remains the primary limiting nutrient, even when phosphorus is sufficiently available. This aligns with studies showing that nitrogen-deficient plants tend to increase nitrogen uptake while simultaneously reducing phosphorus absorption [65,69]. However, the low N:P with combination of moderate to low N:K, and K:P ratios compare to other clusters, which may indicate better nutrient homeostasis under nitrogen and phosphorus limitations [37]. In contrast, Clusters 3 and 4 display high N:P ratios, suggesting potential phosphorus deficiency (Figure 6) [28,64]. This pattern is consistent with findings from other nutrient-poor ecosystems, such as arid environments, where tree species often show high N:P ratios [68].
Tropical peatlands are widely recognized as nutrient-poor ecosystems. This is primarily due to slow decomposition rates and low soil pH, which severely limit nutrient cycling and availability [70,71]. Our study showed that most species exhibited combined N+P limitation. This pattern is also consistent with findings from northern peatlands by Güsewell [65] and Wang and Moore [33], which reported N, P, or combined N+P limitations in the vegetation. The limited decomposition rate traps nutrients in forms that are not readily available to plants [71]. Moore et al. [44] showed that most of this nitrogen exists in organic forms, inaccessible to most plants, which primarily rely on inorganic forms for uptake. Phosphorus scarcity, on the other hand, often results from its low availability rather than a total absence caused by the acidic peatland conditions restricting the availability of P [71,72]. Negassa et al. [73] showed that in drained peatlands, P predominantly exists in non-labile form, unavailable or slowly available to plants, whereas the labile form of P exhibits lower content. However, our results also highlight that certain species may experience K deficiency.

5. Conclusions

In conclusion, the organ-level nutrient stoichiometric patterns described above illustrate the adaptive strategies of tree species in response to nutrient-limited peatland conditions, influencing both ecosystem-level nutrient cycling and the potential for long-term carbon storage through their effects on decomposition rates. In this study, three distinct clusters were identified based on the C:N ratio across roots, stems, twigs, and leaves, providing insights into how species differ in their nutrient-use strategies. Notably, six species exhibited consistently high C:N ratios, potentially positioning them as promising candidates for peatland restoration efforts focused on long-term carbon storage. However, these recommendations are based solely on stoichiometric profiles and should therefore be interpreted cautiously, as factors such as hydrological regime, regeneration traits, and competition dynamics can strongly influence restoration success. Additionally, nutrient stoichiometry of N:P:K showed that most species exhibited combined N+P limitation.
This study is further limited by the absence of direct measurements of decomposition rates, species growth performance, and long-term carbon accumulation under field conditions. Future research should incorporate field experiments in multiple locations to validate the survival and growth of these species under various peatland hydrological conditions, as well as long-term decomposition trials to evaluate their contribution to soil carbon accumulation.

Author Contributions

M.S.I.: Formal analysis, Investigation, Data curation, Writing—original draft, Visualizatio; S.S. (Sulistijorini Sulistijorini) and M.M.: Writing—review & editing, Supervision; Z.A.A.: Investigation, Data curation; M.R.R.: Investigation, Data curation; L.W.: Formal analysis, Writing—review & editing; J.M.: Conceptualization, Formal analysis, Writing—review & editing; R.A.: Investigation, Resources, Data curation, Writing—review & editing; S.S. (Sanjay Swarup): Conceptualization, Writing—review & editing, Funding acquisition; T.T.: (the corresponding manuscript author) Conceptualization, Formal analysis, Writing—review & editing, Supervision. All authors contributed to writing and revising the draft of the manuscript. All authors have read and agreed to the published version of the manuscript.

Funding

This research was funded by Asia Pacific Resources International Limited, the Temasek Foundation as part of the Integrated Tropical Peatlands Research Programme at NUS Environmental Research Institute (A-0001182-00-00), and LPDP (Lembaga Pengelola Dana Pendidikan/Indonesia Endowment Fund).

Data Availability Statement

The data presented in this study are available on request from the corresponding author due to privacy or ethical constraints, as this research is part of a collaborative research project with a broader scope.

Acknowledgments

We thank Asia Pulp and Paper (APP) Sinarmas Forestry and PT. Tri Pupajaya for providing access to the study site and for supporting this research. PT. Arkha and its field team who assisted with logistics and manpower during field work and sampling in the field. Temasek Foundation supported this research as part of the Integrated Tropical Peatland Research Program (INTPREP) at the NUS Environmental Research Institute (A-0001182-00-00) and a collaborative research project between IPB University and NUS. We thank Lee Ming Yang, NUS Environmental Research Institute, Singapore, for critical comments for the manuscript.

Conflicts of Interest

Author Lahiru Wijedasa was employed by the company ConservationLinks. Author Randi Agusti was employed by the company Nusantara Climate Initiative. The remaining authors declare that the research was conducted in the absence of any commercial or financial relationships that could be construed as a potential conflict of interest.

References

  1. Page, S.E.; Rieley, J.O.; Banks, C.J. Global and Regional Importance of the Tropical Peatland Carbon Pool. Glob. Change Biol. 2011, 17, 798–818. [Google Scholar] [CrossRef]
  2. Xu, J.; Morris, P.J.; Liu, J.; Holden, J. PEATMAP: Refining Estimates of Global Peatland Distribution Based on a Meta-Analysis. CATENA 2018, 160, 134–140. [Google Scholar] [CrossRef]
  3. Girkin, N.T.; Cooper, H.V.; Ledger, M.J.; O’Reilly, P.; Thornton, S.A.; Åkesson, C.M.; Cole, L.E.S.; Hapsari, K.A.; Hawthorne, D.; Roucoux, K.H. Tropical Peatlands in the Anthropocene: The Present and the Future. Anthropocene 2022, 40, 100354. [Google Scholar] [CrossRef]
  4. Anda, M.; Ritung, S.; Suryani, E.; Hikmat, M.; Yatno, E.; Mulyani, A.; Subandiono, R.E. Revisiting Tropical Peatlands in Indonesia: Semi-Detailed Mapping, Extent and Depth Distribution Assessment. Geoderma 2021, 402, 115235. [Google Scholar] [CrossRef]
  5. Hooijer, A.; Page, S.; Canadell, J.G.; Silvius, M.; Kwadijk, J.; Wösten, H.; Jauhiainen, J. Current and Future CO2 Emissions from Drained Peatlands in Southeast Asia. Biogeosciences 2010, 7, 1505–1514. [Google Scholar] [CrossRef]
  6. Uda, S.K.; Hein, L.; Sumarga, E. Towards Sustainable Management of Indonesian Tropical Peatlands. Wetl. Ecol. Manag. 2017, 25, 683–701. [Google Scholar] [CrossRef]
  7. Noon, M.L.; Goldstein, A.; Ledezma, J.C.; Roehrdanz, P.R.; Cook-Patton, S.C.; Spawn-Lee, S.A.; Wright, T.M.; Gonzalez-Roglich, M.; Hole, D.G.; Rockström, J.; et al. Mapping the Irrecoverable Carbon in Earth’s Ecosystems. Nat. Sustain. 2021, 5, 37–46. [Google Scholar] [CrossRef]
  8. Warren, M.; Hergoualc’h, K.; Kauffman, J.B.; Murdiyarso, D.; Kolka, R. An Appraisal of Indonesia’s Immense Peat Carbon Stock Using National Peatland Maps: Uncertainties and Potential Losses from Conversion. Carbon Balance Manag. 2017, 12, 12. [Google Scholar] [CrossRef]
  9. Ribeiro, K.; Pacheco, F.S.; Ferreira, J.W.; De Sousa-Neto, E.R.; Hastie, A.; Krieger Filho, G.C.; Alvalá, P.C.; Forti, M.C.; Ometto, J.P. Tropical Peatlands and Their Contribution to the Global Carbon Cycle and Climate Change. Glob. Change Biol. 2021, 27, 489–505. [Google Scholar] [CrossRef]
  10. Page, S.E.; Baird, A.J. Peatlands and Global Change: Response and Resilience. Annu. Rev. Environ. Resour. 2016, 41, 35–57. [Google Scholar] [CrossRef]
  11. Vesala, R.; Kiheri, H.; Hobbie, E.A.; Van Dijk, N.; Dise, N.; Larmola, T. Atmospheric Nitrogen Enrichment Changes Nutrient Stoichiometry and Reduces Fungal N Supply to Peatland Ericoid Mycorrhizal Shrubs. Sci. Total Environ. 2021, 794, 148737. [Google Scholar] [CrossRef]
  12. Omar, M.S.; Ifandi, E.; Sukri, R.S.; Kalaitzidis, S.; Christanis, K.; Lai, D.T.C.; Bashir, S.; Tsikouras, B. Peatlands in Southeast Asia: A Comprehensive Geological Review. Earth-Sci. Rev. 2022, 232, 104149. [Google Scholar] [CrossRef]
  13. Kayranli, B.; Scholz, M.; Mustafa, A.; Hedmark, Å. Carbon Storage and Fluxes within Freshwater Wetlands: A Critical Review. Wetlands 2010, 30, 111–124. [Google Scholar] [CrossRef]
  14. Alonso-Serra, J. Carbon Sequestration: Counterintuitive Feedback of Plant Growth. Quant. Plant Biol. 2021, 2, e11. [Google Scholar] [CrossRef]
  15. Dommain, R.; Cobb, A.R.; Joosten, H.; Glaser, P.H.; Chua, A.F.L.; Gandois, L.; Kai, F.; Noren, A.; Salim, K.A.; Su’ut, N.S.H.; et al. Forest Dynamics and Tip-up Pools Drive Pulses of High Carbon Accumulation Rates in a Tropical Peat Dome in Borneo (Southeast Asia). J. Geophys. Res. Biogeosci. 2015, 120, 617–640. [Google Scholar] [CrossRef]
  16. Yule, C.M.; Gomez, L.N. Leaf Litter Decomposition in a Tropical Peat Swamp Forest in Peninsular Malaysia. Wetl. Ecol. Manag. 2009, 17, 231–241. [Google Scholar] [CrossRef]
  17. Lampela, M.; Jauhiainen, J.; Sarkkola, S.; Vasander, H. Promising Native Tree Species for Reforestation of Degraded Tropical Peatlands. For. Ecol. Manag. 2017, 394, 52–63. [Google Scholar] [CrossRef]
  18. Kissinger, K.; Pitri, R.M.N.; Nasrulloh, A.V. Implementation of Plant Selection Based-On Plant Growth on Revegetation of Peatland in South Kalimantan. Int. J. Environ. Agric. Biotechnol. 2022, 7, 137–142. [Google Scholar] [CrossRef]
  19. Anjani, R.; Siahaan, H. Initial Growth of Four Endemic Species in Degraded Peatland Revegetation in Ogan Komering Ilir, South Sumatra. IOP Conf. Ser. Earth Environ. Sci. 2023, 1201, 012056. [Google Scholar] [CrossRef]
  20. Peng, Y.; Schmidt, I.K.; Zheng, H.; Heděnec, P.; Bachega, L.R.; Yue, K.; Wu, F.; Vesterdal, L. Tree Species Effects on Topsoil Carbon Stock and Concentration Are Mediated by Tree Species Type, Mycorrhizal Association, and N-Fixing Ability at the Global Scale. For. Ecol. Manag. 2020, 478, 118510. [Google Scholar] [CrossRef]
  21. Fernández-Guisuraga, J.M.; Calvo, L.; Marcos, E. Plant Species Diversity and Abundance of Functional Groups Influence Net Nitrogen Mineralization along Productivity Gradients in Montane Calluna-dominated Heathlands. Plants People Planet 2025, 7, 1388–1402. [Google Scholar] [CrossRef]
  22. Straková, P.; Penttilä, T.; Laine, J.; Laiho, R. Disentangling Direct and Indirect Effects of Water Table Drawdown on Above- and Belowground Plant Litter Decomposition: Consequences for Accumulation of Organic Matter in Boreal Peatlands. Glob. Change Biol. 2012, 18, 322–335. [Google Scholar] [CrossRef]
  23. Sterner, R.W.; Elser, J.J. Ecological Stoichiometry: The Biology of Elements from Molecules to the Biosphere; Princeton University Press: Princeton, NJ, USA, 2002. [Google Scholar]
  24. Lynch, M.J.; Mulvaney, M.J.; Hodges, S.C.; Thompson, T.L.; Thomason, W.E. Decomposition, Nitrogen and Carbon Mineralization from Food and Cover Crop Residues in the Central Plateau of Haiti. SpringerPlus 2016, 5, 973. [Google Scholar] [CrossRef]
  25. Hapsari, K.A.; Biagioni, S.; Jennerjahn, T.C.; Reimer, P.M.; Saad, A.; Achnopha, Y.; Sabiham, S.; Behling, H. Environmental Dynamics and Carbon Accumulation Rate of a Tropical Peatland in Central Sumatra, Indonesia. Quat. Sci. Rev. 2017, 169, 173–187. [Google Scholar] [CrossRef]
  26. Jílková, V.; Straková, P.; Frouz, J. Foliage C:N Ratio, Stage of Organic Matter Decomposition and Interaction with Soil Affect Microbial Respiration and Its Response to C and N Addition More than C:N Changes during Decomposition. Appl. Soil Ecol. 2020, 152, 103568. [Google Scholar] [CrossRef]
  27. Koerselman, W.; Meuleman, A.F.M. The Vegetation N:P Ratio: A New Tool to Detect the Nature of Nutrient Limitation. J. Appl. Ecol. 1996, 33, 1441–1450. [Google Scholar] [CrossRef]
  28. Güsewell, S.; Koerselman, W. Variation in Nitrogen and Phosphorus Concentrations of Wetland Plants. Perspect. Plant Ecol. Evol. Syst. 2002, 5, 37–61. [Google Scholar] [CrossRef]
  29. Venterink, H.O.; Wassen, M.J.; Verkroost, A.W.M.; De Ruiter, P.C. Species Richness–Productivity Patterns Differ Between N-, P-, and K-Limited Wetlands. Ecology 2003, 84, 2191–2199. [Google Scholar] [CrossRef]
  30. Brearley, F.Q.; Mansur, M. Nutrient Stoichiometry of Nepenthes Species from a Bornean Peat Swamp Forest. Carniv. Plant Newsl. 2012, 41, 105–108. [Google Scholar] [CrossRef]
  31. Vourlitis, G.L.; De Almeida Lobo, F.; Lawrence, S.; Holt, K.; Zappia, A.; Pinto, O.B.; De Souza Nogueira, J. Nutrient Resorption in Tropical Savanna Forests and Woodlands of Central Brazil. Plant Ecol. 2014, 215, 963–975. [Google Scholar] [CrossRef]
  32. Yanbuaban, M.; Nuyim, T.; Matsubara, T.; Watanabe, T.; Osaki, M. Nutritional Ecology of Plants Grown in a Tropical Peat Swamp. Tropics 2007, 16, 31–39. [Google Scholar] [CrossRef]
  33. Wang, M.; Moore, T.R. Carbon, Nitrogen, Phosphorus, and Potassium Stoichiometry in an Ombrotrophic Peatland Reflects Plant Functional Type. Ecosystems 2014, 17, 673–684. [Google Scholar] [CrossRef]
  34. Balai Penelitian Tanah. Analisis Kimia Tanah, Tanaman, Air, Dan Pupuk; Balai Penelitian Tanah, Badan Penelitian dan Pengembangan Pertanian, Departemen Pertanian: Bogor, Indonesia, 2005. [Google Scholar]
  35. ISO/IEC 17025:2017; General Requirements for the Competence of Testing and Calibration Laboratories. International Organization for Standardization (ISO): Geneva, Switzerland, 2017.
  36. Zhang, H.; Guo, W.; Wang, G.G.; Yu, M.; Wu, T. Effect of Environment and Genetics on Leaf N and P Stoichiometry for Quercus Acutissima across China. Eur. J. For. Res. 2016, 135, 795–802. [Google Scholar] [CrossRef]
  37. Zhang, J.; He, N.; Liu, C.; Xu, L.; Chen, Z.; Li, Y.; Wang, R.; Yu, G.; Sun, W.; Xiao, C.; et al. Variation and Evolution of C:N Ratio among Different Organs Enable Plants to Adapt to N-limited Environments. Glob. Change Biol. 2020, 26, 2534–2543. [Google Scholar] [CrossRef]
  38. Zhang, J.; Zhao, N.; Liu, C.; Yang, H.; Li, M.; Yu, G.; Wilcox, K.; Yu, Q.; He, N. C:N:P Stoichiometry in China’s Forests: From Organs to Ecosystems. Funct. Ecol. 2018, 32, 50–60. [Google Scholar] [CrossRef]
  39. Taiz, L.; Zeiger, E. Plant Physiology, 5th ed.; Sinauer Associates: Sunderland, MA, USA, 2015. [Google Scholar]
  40. Liang, X.; Liu, S.; Wang, H.; Wang, J. Variation of Carbon and Nitrogen Stoichiometry along a Chronosequence of Natural Temperate Forest in Northeastern China. J. Plant Ecol. 2018, 11, 339–350. [Google Scholar] [CrossRef]
  41. Foyer, C.H.; Noctor, G. Photosynthetic Nitrogen Assimilation: Inter-Pathway Control and Signaling. In Photosynthetic Nitrogen Assimilation and Associated Carbon and Respiratory Metabolism; Foyer, C.H., Noctor, G., Eds.; Advances in Photosynthesis and Respiration; Springer: Dordrecht, The Netherlands, 2002; Volume 12, pp. 1–22. ISBN 978-0-7923-6336-1. [Google Scholar]
  42. Bauters, M.; Vercleyen, O.; Vanlauwe, B.; Six, J.; Bonyoma, B.; Badjoko, H.; Hubau, W.; Hoyt, A.; Boudin, M.; Verbeeck, H.; et al. Long-term Recovery of the Functional Community Assembly and Carbon Pools in an African Tropical Forest Succession. Biotropica 2019, 51, 319–329. [Google Scholar] [CrossRef]
  43. Fagundes, M.V.; Souza, A.F.; Oliveira, R.S.; Ganade, G. Functional Traits above and below Ground Allow Species with Distinct Ecological Strategies to Coexist in the Largest Seasonally Dry Tropical Forest in the Americas. Front. For. Glob. Change 2022, 5, 930099. [Google Scholar] [CrossRef]
  44. Moore, T.R.; Alfonso, A.; Clarkson, B.R. Plant Uptake of Organic Nitrogen in Two Peatlands. Plant Soil 2018, 433, 391–400. [Google Scholar] [CrossRef]
  45. Nwaishi, F.; Morison, M.; Plach, J.; Macrae, M.; Petrone, R. Carbon and Nutrient Stoichiometric Relationships in the Soil–Plant Systems of Disturbed Boreal Forest Peatlands within Athabasca Oil Sands Region, Canada. Forests 2022, 13, 865. [Google Scholar] [CrossRef]
  46. Hogan, J.A.; Valverde-Barrantes, O.J.; Tang, W.; Ding, Q.; Xu, H.; Baraloto, C. Evidence of Elemental Homeostasis in Fine Root and Leaf Tissues of Saplings across a Fertility Gradient in Tropical Montane Forest in Hainan, China. Plant Soil 2021, 460, 625–646. [Google Scholar] [CrossRef]
  47. Jiang, P.; Cao, Y.; Chen, Y. C, N, P Stoichiometric Characteristics of Tree, Shrub, Herb Leaves and Litter in Forest Community of Shaanxi Province, China. ACTA Ecol. Sin. 2023, 43, 8749–8758. [Google Scholar] [CrossRef]
  48. Ghimire, B.; Riley, W.J.; Koven, C.D.; Kattge, J.; Rogers, A.; Reich, P.B.; Wright, I.J. A Global Trait-based Approach to Estimate Leaf Nitrogen Functional Allocation from Observations. Ecol. Appl. 2017, 27, 1421–1434. [Google Scholar] [CrossRef]
  49. Dieckow, J.; Mielniczuk, J.; Knicker, H.; Bayer, C.; Dick, D.P.; Kögel-Knabner, I. Comparison of Carbon and Nitrogen Determination Methods for Samples of a Paleudult Subjected to No-till Cropping Systems. Sci. Agric. 2007, 64, 532–540. [Google Scholar] [CrossRef]
  50. Novaes, E.; Kirst, M.; Chiang, V.; Winter-Sederoff, H.; Sederoff, R. Lignin and Biomass: A Negative Correlation for Wood Formation and Lignin Content in Trees. Plant Physiol. 2010, 154, 555–561. [Google Scholar] [CrossRef] [PubMed]
  51. Ma, S.; He, F.; Tian, D.; Zou, D.; Yan, Z.; Yang, Y.; Zhou, T.; Huang, K.; Shen, H.; Fang, J. Variations and Determinants of Carbon Content in Plants: A Global Synthesis. Biogeosciences 2018, 15, 693–702. [Google Scholar] [CrossRef]
  52. Herrera-Ramírez, D.; Hartmann, H.; Römermann, C.; Trumbore, S.; Muhr, J.; Maracahipes-Santos, L.; Brando, P.; Silvério, D.; Huang, J.; Kuhlmann, I.; et al. Anatomical Distribution of Starch in the Stemwood Influences Carbon Dynamics and Suggests Storage-growth Trade-offs in Some Tropical Trees. J. Ecol. 2023, 111, 2532–2548. [Google Scholar] [CrossRef]
  53. Carvalho, F.; Brown, K.A.; Waller, M.P.; Boom, A. Leaf Traits Interact with Management and Water Table to Modulate Ecosystem Properties in Fen Peatlands. Plant Soil 2019, 441, 331–347. [Google Scholar] [CrossRef]
  54. Schillereff, D.N.; Chiverrell, R.C.; Sjöström, J.K.; Kylander, M.E.; Boyle, J.F.; Davies, J.A.C.; Toberman, H.; Tipping, E. Phosphorus Supply Affects Long-Term Carbon Accumulation in Mid-Latitude Ombrotrophic Peatlands. Commun. Earth Environ. 2021, 2, 241. [Google Scholar] [CrossRef]
  55. Byun, E.; Rezanezhad, F.; Slowinski, S.; Lam, C.; Bhusal, S.; Wright, S.; Quinton, W.L.; Webster, K.L.; Van Cappellen, P. Effects of Nitrogen and Phosphorus Amendments on CO2 and CH4 Production in Peat Soils of Scotty Creek, Northwest Territories: Potential Considerations for Wildfire and Permafrost Thaw Impacts on Peatland Carbon Exchanges. Soil 2025, 11, 309–321. [Google Scholar] [CrossRef]
  56. Escobar, D.; Manzoni, S.; Tapasco, J.; Vestin, P.; Belyazid, S. Evaluation of Long-Term Carbon Dynamics in a Drained Forested Peatland Using the ForSAFE-Peat Model. Biogeosciences 2025, 22, 2023–2047. [Google Scholar] [CrossRef]
  57. Sloan, T.J.; Ratcliffe, J.; Anderson, R.; Gehrels, W.R.; Gilbert, P.; Mauquoy, D.; Newton, A.J.; Payne, R.J.; Serafin, J.; Andersen, R. Potential for Large Losses of Carbon from Non-Native Conifer Plantations on Deep Peat over Decadal Timescales. Sci. Total Environ. 2024, 953, 175964. [Google Scholar] [CrossRef]
  58. Mirmanto, E. Vegetation Analyses of Sebangau Peat Swamp Forest, Central Kalimantan. Biodiversitas J. Biol. Divers. 2009, 11, 82–88. [Google Scholar] [CrossRef]
  59. Garsetiasih, R.; Heriyanto, N.M.; Adinugroho, W.C.; Gunawan, H.; Dharmawan, I.W.S.; Sawitri, R.; Yeny, I.; Mindawati, N.; Denny. Connectivity of Vegetation Diversity, Carbon Stock, and Peat Depth in Peatland Ecosystems. Glob. J. Environ. Sci. Manag. 2022, 8, 369. [Google Scholar] [CrossRef]
  60. Astiani, D.; Ekamawanti, H.A.; Ekyastuti, W.; Widiastuti, T.; Tavita, G.E.; Suntoro, M.A. Tree Species Distribution in Tropical Peatland Forest along Peat Depth Gradients: Baseline Notes for Peatland Restoration. Biodiversitas J. Biol. Divers. 2021, 22, 2571–2578. [Google Scholar] [CrossRef]
  61. Kettenring, K.M.; Tarsa, E.E. Need to Seed? Ecological, Genetic, and Evolutionary Keys to Seed-Based Wetland Restoration. Front. Environ. Sci. 2020, 8, 109. [Google Scholar] [CrossRef]
  62. Jia, X.; Wu, L.; Ren, J.; Peng, X.; Lv, H. Response of Carbon, Nitrogen, and Phosphorus in Leaves of Different Life Forms to Altitude and Soil Factors in Tianshan Wild Fruit Forest. Front. Ecol. Evol. 2024, 12, 1368185. [Google Scholar] [CrossRef]
  63. Marwanto, S.; Watanabe, T.; Iskandar, W.; Sabiham, S.; Funakawa, S. Effects of Seasonal Rainfall and Water Table Movement on the Soil Solution Composition of Tropical Peatland. Soil Sci. Plant Nutr. 2018, 64, 386–395. [Google Scholar] [CrossRef]
  64. Xing, S.; Cheng, X.; Kang, F.; Wang, J.; Yan, J.; Han, H. The Patterns of N/P/K Stoichiometry in the Quercus Wutaishanica Community among Different Life Forms and Organs and Their Responses to Environmental Factors in Northern China. Ecol. Indic. 2022, 137, 108783. [Google Scholar] [CrossRef]
  65. Güsewell, S. N:P Ratios in Terrestrial Plants: Variation and Functional Significance. New Phytol. 2004, 164, 243–266. [Google Scholar] [CrossRef] [PubMed]
  66. Mo, Q.; Zou, B.; Li, Y.; Chen, Y.; Zhang, W.; Mao, R.; Ding, Y.; Wang, J.; Lu, X.; Li, X.; et al. Response of Plant Nutrient Stoichiometry to Fertilization Varied with Plant Tissues in a Tropical Forest. Sci. Rep. 2015, 5, 14605. [Google Scholar] [CrossRef]
  67. Tian, D.; Yan, Z.; Niklas, K.J.; Han, W.; Kattge, J.; Reich, P.B.; Luo, Y.; Chen, Y.; Tang, Z.; Hu, H.; et al. Global Leaf Nitrogen and Phosphorus Stoichiometry and Their Scaling Exponent. Natl. Sci. Rev. 2018, 5, 728–739. [Google Scholar] [CrossRef]
  68. Castellanos, A.E.; Llano-Sotelo, J.M.; Machado-Encinas, L.I.; López-Piña, J.E.; Romo-Leon, J.R.; Sardans, J.; Peñuelas, J. Foliar C, N, and P Stoichiometry Characterize Successful Plant Ecological Strategies in the Sonoran Desert. Plant Ecol. 2018, 219, 775–788. [Google Scholar] [CrossRef]
  69. Torres-Rodríguez, J.V.; Salazar-Vidal, M.N.; Chávez Montes, R.A.; Massange-Sánchez, J.A.; Gillmor, C.S.; Sawers, R.J.H. Low Nitrogen Availability Inhibits the Phosphorus Starvation Response in Maize (Zea mays Ssp. Mays L.). BMC Plant Biol. 2021, 21, 259. [Google Scholar] [CrossRef] [PubMed]
  70. Sjögersten, S.; Cheesman, A.W.; Lopez, O.; Turner, B.L. Biogeochemical Processes along a Nutrient Gradient in a Tropical Ombrotrophic Peatland. Biogeochemistry 2011, 104, 147–163. [Google Scholar] [CrossRef]
  71. Choo, L.N.L.K.; Ahmed, O.H.; Razak, N.A.; Sekot, S. Improving Nitrogen Availability and Ananas Comosus L. Merr Var. Moris Productivity in a Tropical Peat Soil Using Clinoptilolite Zeolite. Agronomy 2022, 12, 2750. [Google Scholar] [CrossRef]
  72. Tanjung, R.H.R.; Suharno; Rumahorbo, B.T.; Reza, M.A.; Akhmad. Characteristics of Peatland Chemicals and Their Association with the Diversity of Dominant Plants in Papua. IOP Conf. Ser. Earth Environ. Sci. 2020, 575, 012082. [Google Scholar] [CrossRef]
  73. Negassa, W.; Michalik, D.; Klysubun, W.; Leinweber, P. Phosphorus Speciation in Long-Term Drained and Rewetted Peatlands of Northern Germany. Soil Syst. 2020, 4, 11. [Google Scholar] [CrossRef]
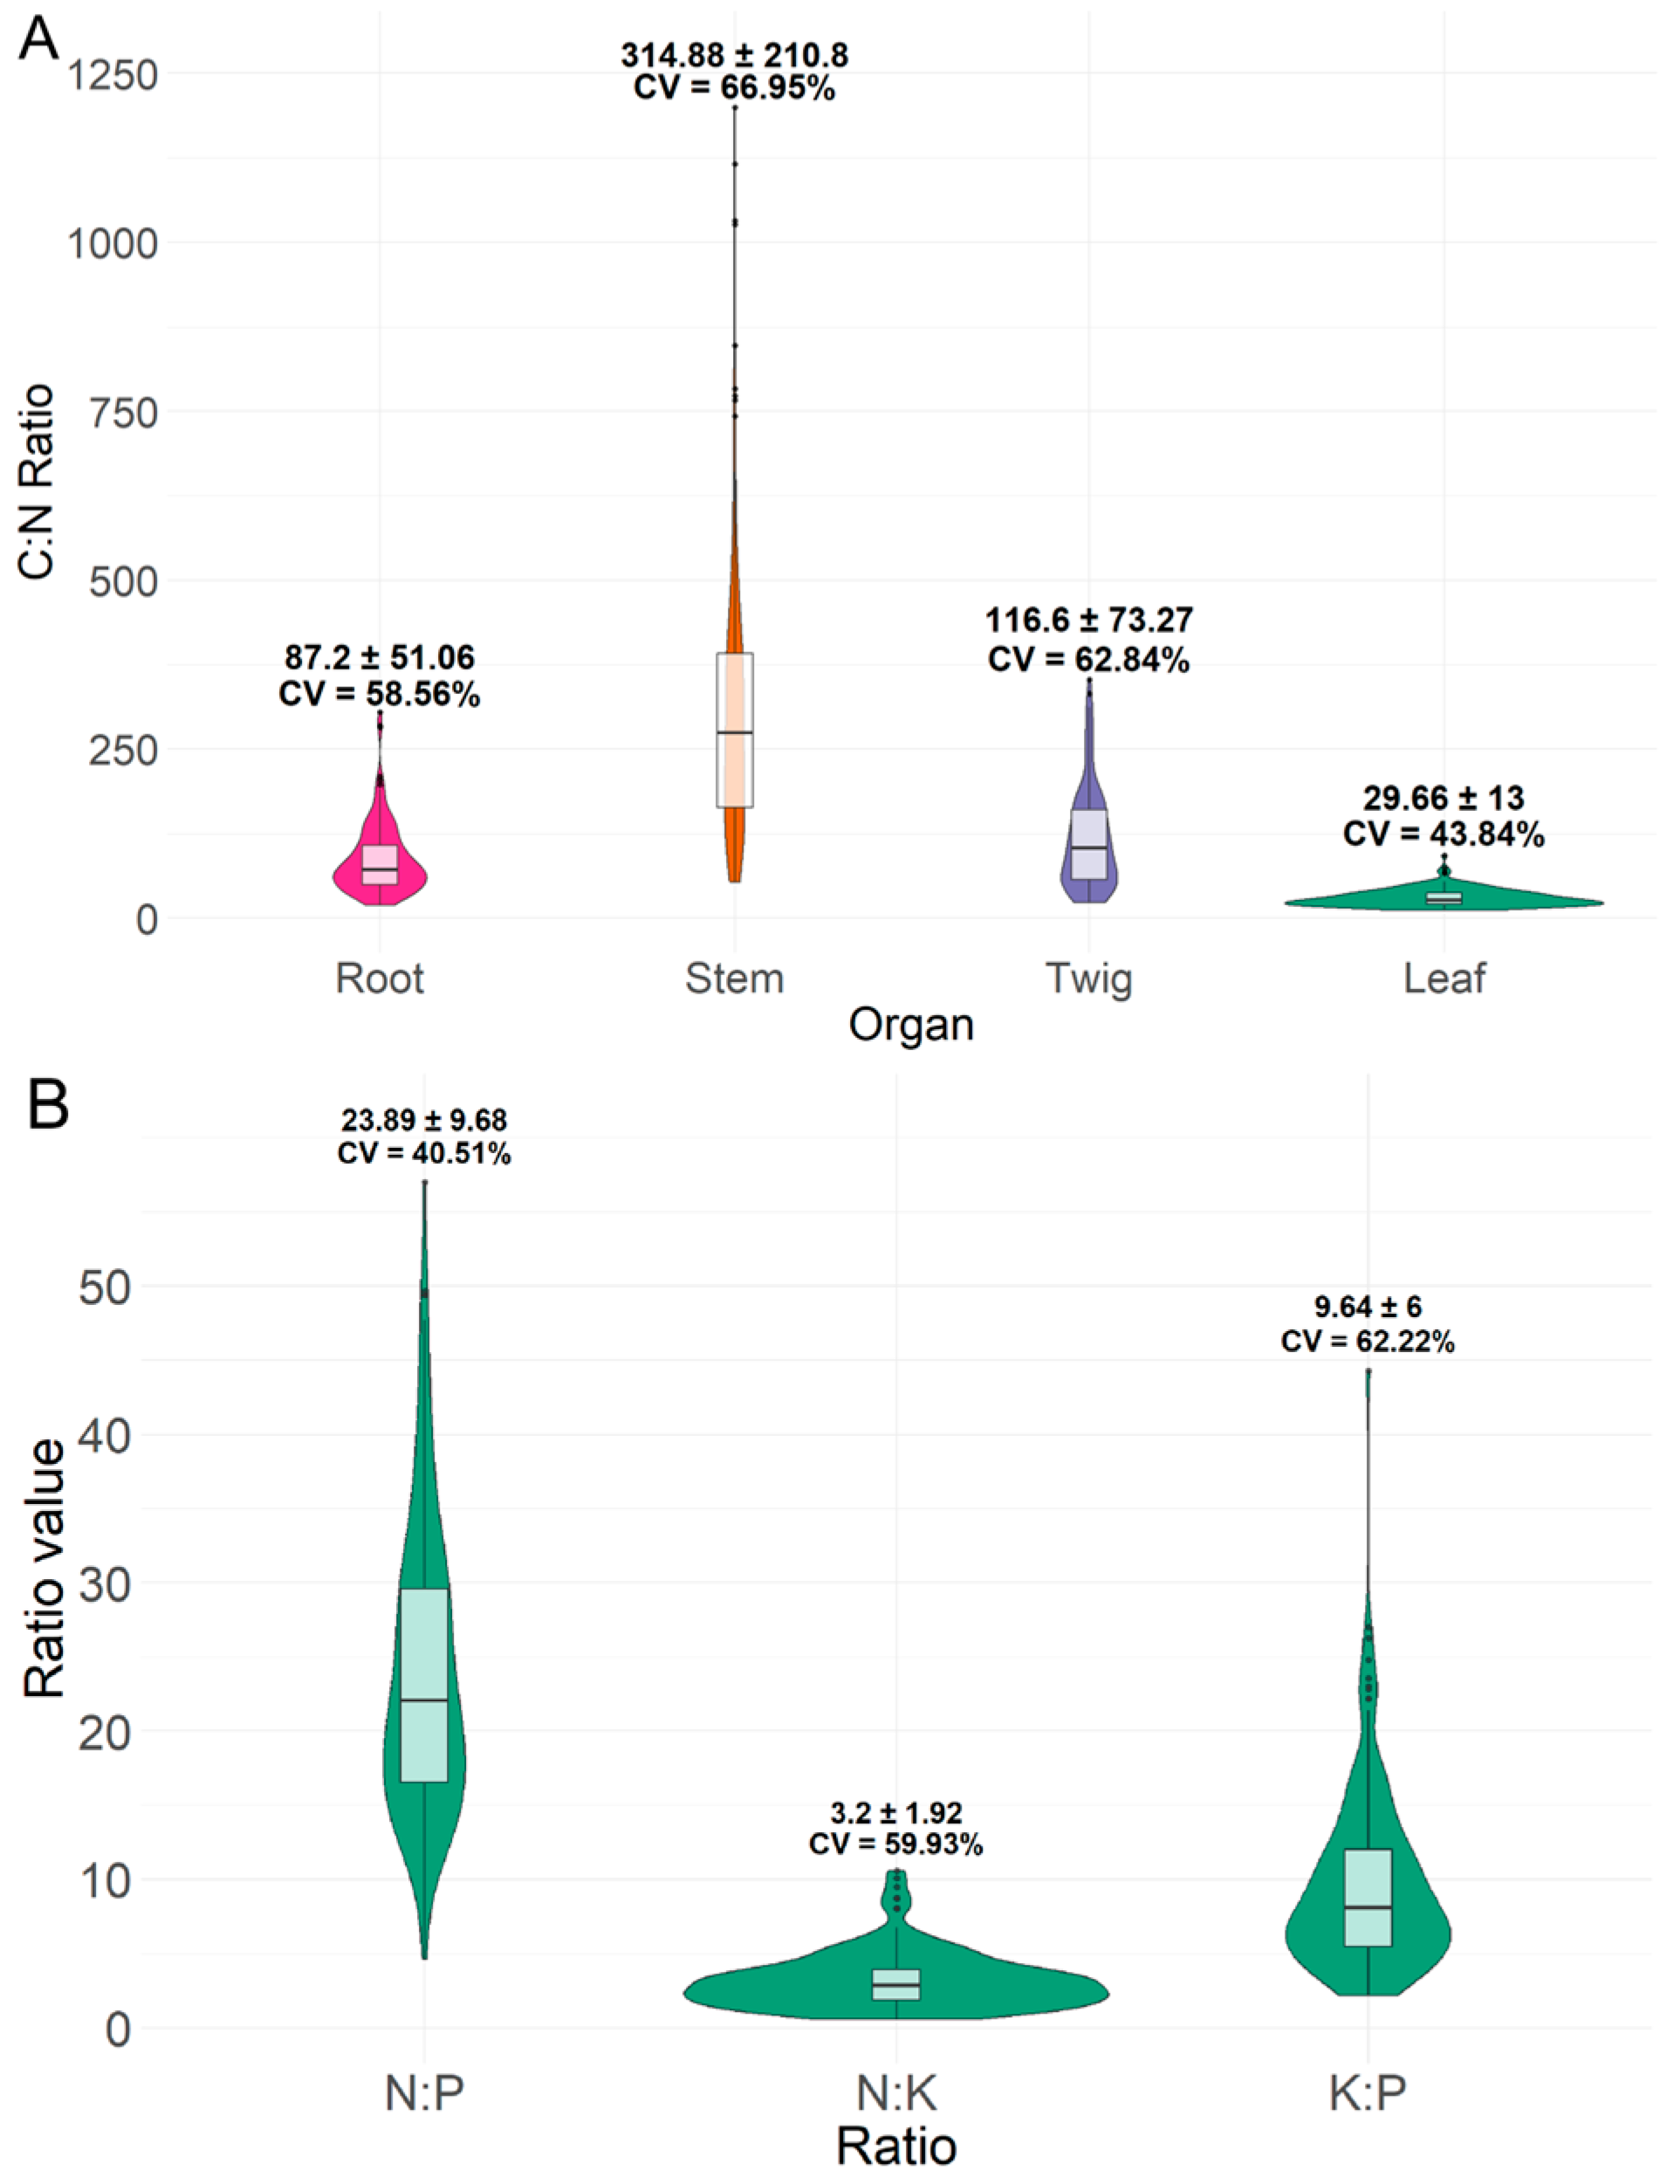
Figure 1. (A) Violin-box plots showing the distribution of C:N ratios across roots, stems, twigs, and leaves in 153 tree species. (B) Violin-box plots showing the distribution of N:P, N:K, and K:P ratios in leaves. Mean values ± standard deviation (SD) followed by the CV is indicated above each violin plot.
Forests 16 01379 g001
Figure 2. Hierarchical clustering of 153 tree species based on C:N ratios in roots, stems, twigs, and leaves, using Ward’s minimum variance method. Cluster composition: Cluster 1 = 13 species, Cluster 2 = 61 species, and Cluster 3 = 79 species. Heatmap colors represent normalized C:N values using Min–Max normalization, with blue indicating low values and red indicating high values.
Forests 16 01379 g002
Figure 3. UpSet plot illustrating the number of intersecting species across plant organs with the highest C:N ratios. The data represent species with C:N ratios in the top 25% (above the 75th percentile) among all analyzed species. The colored horizontal bars on the left indicate the total number of species (set size) with high C:N ratios for each organ. The upper black vertical bars (intersection size) chart shows the number of species with high C:N ratios in each organ. The lower panel displays combinations of organs, with connected colored dots indicating which organs are included in each combination. The red box highlights species exhibiting the highest C:N ratios across all observed organs.
Forests 16 01379 g003
Figure 4. Mean C:N ratios across four plant organs (leaves, roots, stems, and twigs) for three species groups: all species (n = 153), the top 25% species with the highest C:N ratio in each organ (n = 39), and six species that consistently exhibited high C:N ratios across all organs (G. cuspidata, N. maingayi, J. ornata, C. sclerophyllum, C. evenus, and C. rotundatus).
Forests 16 01379 g004
Figure 5. Hierarchical clustering of 153 tree species based on leaf N:P, N:K, and K:P ratios, using Ward’s minimum variance method. Cluster composition: Cluster 1 = 84 species, Cluster 2 = 42 species, Cluster 3 = 10 species, and Cluster 4 = 17 species. Heatmap colors indicate normalized nutrient ratio values using Min–Max normalization, where blue represents lower values and red represents higher values.
Forests 16 01379 g005
Figure 6. Triaxial diagram illustrating the stoichiometric relationships among nitrogen (N), phosphorus (P), and potassium (K). Species grouping is based on the hierarchical clustering results shown in Figure 5. Dashed lines indicate critical ratio thresholds for N:P (14.5), N:K (2.1), and K:P (3.4), as defined by Venterink et al. [29]. These thresholds divide the plot into four regions representing potential nutrient limitations: N deficiency (N region), P or combined P+N deficiency (P or P+N region), K or combined K+N deficiency (K or K+N region), and no apparent NPK deficiency.
Forests 16 01379 g006
Table 1. Mean (±SD) C:N ratios of roots, stems, twigs, and leaves across three C:N ratio-based clusters of peatland tree species. n indicates the number of species per cluster. Different lowercase letters within the same column indicate significant differences among clusters for each organ, based on the Kruskal–Wallis test followed by Dunn’s post-hoc test (p < 0.05).
ClusternOrgan C:N Ratio
RootStemTwigLeaf
113123.20 ± 50.87 a833.54 ± 196.58 a187.01 ± 74.16 a32.48 ± 11.82
26198.26 ± 52.59 a393.23 ± 85.37 b138.92 ± 74.59 a30.85 ± 11.60
37973.03 ± 45.18 b172.08 ± 71.59 c57.30 ± 28.61 b28.61 ± 14.62
Table 2. Mean (±SD) leaf N:P, N:K, and K:P ratios across four leaf stoichiometry-based clusters of peatland tree species. n indicates the number of species per cluster. Different lowercase letters within the same column indicate significant differences among clusters for each organ, based on the Kruskal–Wallis test followed by Dunn’s post-hoc test (p < 0.05).
ClusternLeaf Nutrient Ratio
N:PN:KK:P
18416.85 ± 3.74 a2.77 ± 1.70 a8.31 ± 4.80 a
24228.33 ± 3.39 b4.10 ± 1.92 b8.05 ± 2.80 a
31045.00 ± 3.99 c5.24 ± 2.21 b9.71 ± 3.28 a
41735.26 ± 7.16 d1.94 ± 0.66 a20.16 ± 7.93 d
Table 3. Comparison of mean C:N ratios across plant organs between this study and previous studies conducted in various forest ecosystems worldwide. Values for this study, Bauters et al. [42], and Fagundes et al. [43] are presented as mean ± SD, while values for Zhang et al. [37] and Zhang et al. [38] are presented as mean ± standard error (SE). When SD or SE is unavailable, only the mean value is reported. “-“ indicates data not available.
Ecosystem Type & LocationSampleOrgan C:N RatioStudy/Reference
RootStemTwigLeaf
Tropical peatland in South Sumatra Province, Indonesia153 native tree species87.20 ± 51.06314.88 ± 210.8116.60 ± 73.2729.66 ± 13This study
Semi-deciduous rain forest
Maringa-Lopori-Wamba forest, Tshuapa province, DR Congo
Trees from five different succession stages---Lowest:
18.0
Highest:
19.5 ± 0.7
Bauters et al. [42]
Seasonally dry tropical forest Açu National Forest, Rio Grande do Norte, Brazil20 native tree species---22.91± 5.769Fagundes et al. [43]
28 natural climax forests in nature reserves, China647 trees62.85 ± 1.20321.36 ± 6.8565.07 ± 0.7624.28 ± 0.26Zhang et al. [37]
9 typical forest ecosystems (cold-temperate to tropical zones), The north–south transect of eastern China803 tree, shrub, and herb species50.6 ± 2.6369.9 ± 38.560.1 ± 1.423.6 ± 0.7Zhang et al. [38]
Disclaimer/Publisher’s Note: The statements, opinions and data contained in all publications are solely those of the individual author(s) and contributor(s) and not of MDPI and/or the editor(s). MDPI and/or the editor(s) disclaim responsibility for any injury to people or property resulting from any ideas, methods, instructions or products referred to in the content.