Abstract
Mangroves are characterized by high productivity, thus playing crucial roles in combating global climate change. In recent decades, the invasion of Spartina alterniflora has led to significant degradation of mangrove vegetation. Currently, the main restoration measure for such damaged mangroves is to remove the invasive S. alterniflora. Furthermore, monitoring of S. alterniflora regeneration after restoration is also of great significance. In this study, an indicator of the presence of S. alterniflora in the soil was measured using a stable isotopic mixing model and further used to predict the potential regeneration of S. alterniflora in the natural Zhangjiang Estuary mangrove forest and the artificially planted Quanzhou Bay mangrove forest. The key findings are as follows: (1) The regeneration of S. alterniflora was observed in the Quanzhou Bay mangrove forest after observing an increased indication of its underground biomass (from 2.5% to 10.6%). This was not observed in the Zhangjiang Estuary mangrove forest, indicating its higher resistance against S. alterniflora regeneration. (2) The removal of S. alterniflora affected the diversity of the soil microbes, possibly by regulating the available organic matter, thus further altering the levels of S. alterniflora regeneration after restoration. (3) The higher functional redundancy and co-occurrence of soil microbes in the natural ZJE mangrove forest may be one major reason for its higher resistance to S. alterniflora invasion/regeneration. This study reveals potential effects of soil microbial communities on the stability of mangrove wetlands, which may provide new insights for future research on mangrove restoration programs.
1. Introduction
As one of the most productive ecosystems, mangroves contribute significantly to the sequestration of blue carbon and serve as crucial habitats for numerous species, thus playing significant roles in combating global climate change and maintaining coastal stability [1,2]. In recent decades, the combined impact of natural factors and human activities has led to the degradation of approximately one-third of mangroves globally [3,4], highlighting the urgent need to protect and restore such damaged areas. In the past 20 years, the global restoration of mangroves, which has mainly involved the transplantation of native species, has decelerated the rate of mangrove degradation from 2% yr−1 to 0.4% yr−1 [5,6]. However, it has been reported that some of the species used in the transplantation of mangroves have a lower survival rate and are more sensitive to disturbances [7,8,9]. This indicates the need for long-term monitoring of such restored areas.
In China, one of the major threats to mangrove ecosystems is the invasion of Spartina alterniflora, which used to be defined as a beneficial species for maintaining coastal stability [10,11,12]. However, due to its rapid propagation and expansion, it has caused many problems in mangrove ecosystems, such as the degradation of mangrove plants, the loss of biological diversity and an increase in the emission of methane [12,13,14]. To prevent the further degradation of mangrove ecosystems, the removal of S. alterniflora and the supplementary planting of mangrove plants have been widely conducted in China [12,15]. However, there are still many challenges remaining in such areas. One of the most significant challenges is the frequent regeneration of S. alterniflora. Until now, the most widely used method for the monitoring of S. alterniflora was remote sensing [16,17,18,19]. However, due to the rapid propagation of S. alterniflora and the impact of periodic tidal inundation, this method exhibits a lag in providing warnings of S. alterniflora invasion. The lack of timeliness associated with S. alterniflora monitoring may further lead to the undoing of previous restoration efforts. In our previous study, a stable isotopic model was used to analyze the contributions of different sources to the total soil organic matter (SOM) [7]. Based on the δ13C and C:N ratio of organic matter derived from various sources, the ratio of organic matter derived from S. alterniflora in the soil can be determined [20,21,22]. This can be defined as an indicator of its underground biomass. During our previous study in an artificially planted mangrove, the regeneration of S. alterniflora was observed following an increase in this indicator of its underground biomass [7]. If this method can be used in different mangroves, it may aid in providing early warnings of S. alterniflora invasion and regeneration.
Another problem that should be considered is the low survival rates of artificially planted mangroves [7,8,9]. Even when using the same species as those present in natural mangroves, the growth of artificially planted mangroves is not ideal. In addition, it is easier for S. alterniflora to invade and regenerate in such mangrove communities [10,23,24]. One possible reason for the difference in stability between natural and artificially planted mangroves is the difference in their soil microbial communities [5,25]. Soil microbial communities play a vital role in driving numerous critical processes, including sustaining soil fertility, enabling nutrient cycling (such as the transformation and absorption of essential nutrients) and fostering biodiversity [26,27,28,29,30]. This may further enhance the disease resistance and stress tolerance of plants [27,28,29,30]. Previous studies have demonstrated differences in the soil microbial communities under plants of different ages [25]. Therefore, such microbial differences may contribute to explaining the observed variations in the stability of mangroves. Additionally, the co-occurrence of soil microbes and their functions may also impact the stability of mangroves. Soil microbes interact directly or indirectly with each other by exchanging materials, energy and information, thus sharing similar niches and functions, or competing with each other [31,32]. Such complex ecological relationships can be modeled as interaction networks, with species serving as nodes and their interconnections represented as edges. This is fundamental to the characterization of species interactions and the dynamics of ecosystems [33,34]. Previous studies have revealed that a more complex ecological network may represent an ecosystem with higher functional diversity [31,35,36]. Moreover, it may also reflect differences in the vulnerability and functional redundancy of soil microbial communities [34,35,36]. Given the importance of soil microbes in supporting plant health [26,27,28,29,30], the differences in soil microbial co-occurrence networks may help to explain the differences in stability between natural and artificially planted mangroves.
Therefore, this study selected a natural mangrove (Zhangjiang Estuary mangrove forest, ZJE mangrove forest) and an artificially planted mangrove (Quanzhou Bay mangrove forest, QZB mangrove forest) as the study areas. The aims of this study were as follows: (1) to test the application of stable isotopic analyses for the early discovery of S. alterniflora invasion or regeneration in mangrove ecosystems, (2) to observe the differences in the diversity and co-occurrence of the soil microbiota between the natural and artificially planted mangroves and (3) to reveal the possible effects of soil microbes on the stability of mangrove ecosystems. This innovative study could provide important insights into the role of soil microbes in supporting the stability of mangrove ecosystems and therefore enhance their protection and restoration.
2. Materials and Methods
2.1. Sample Collection
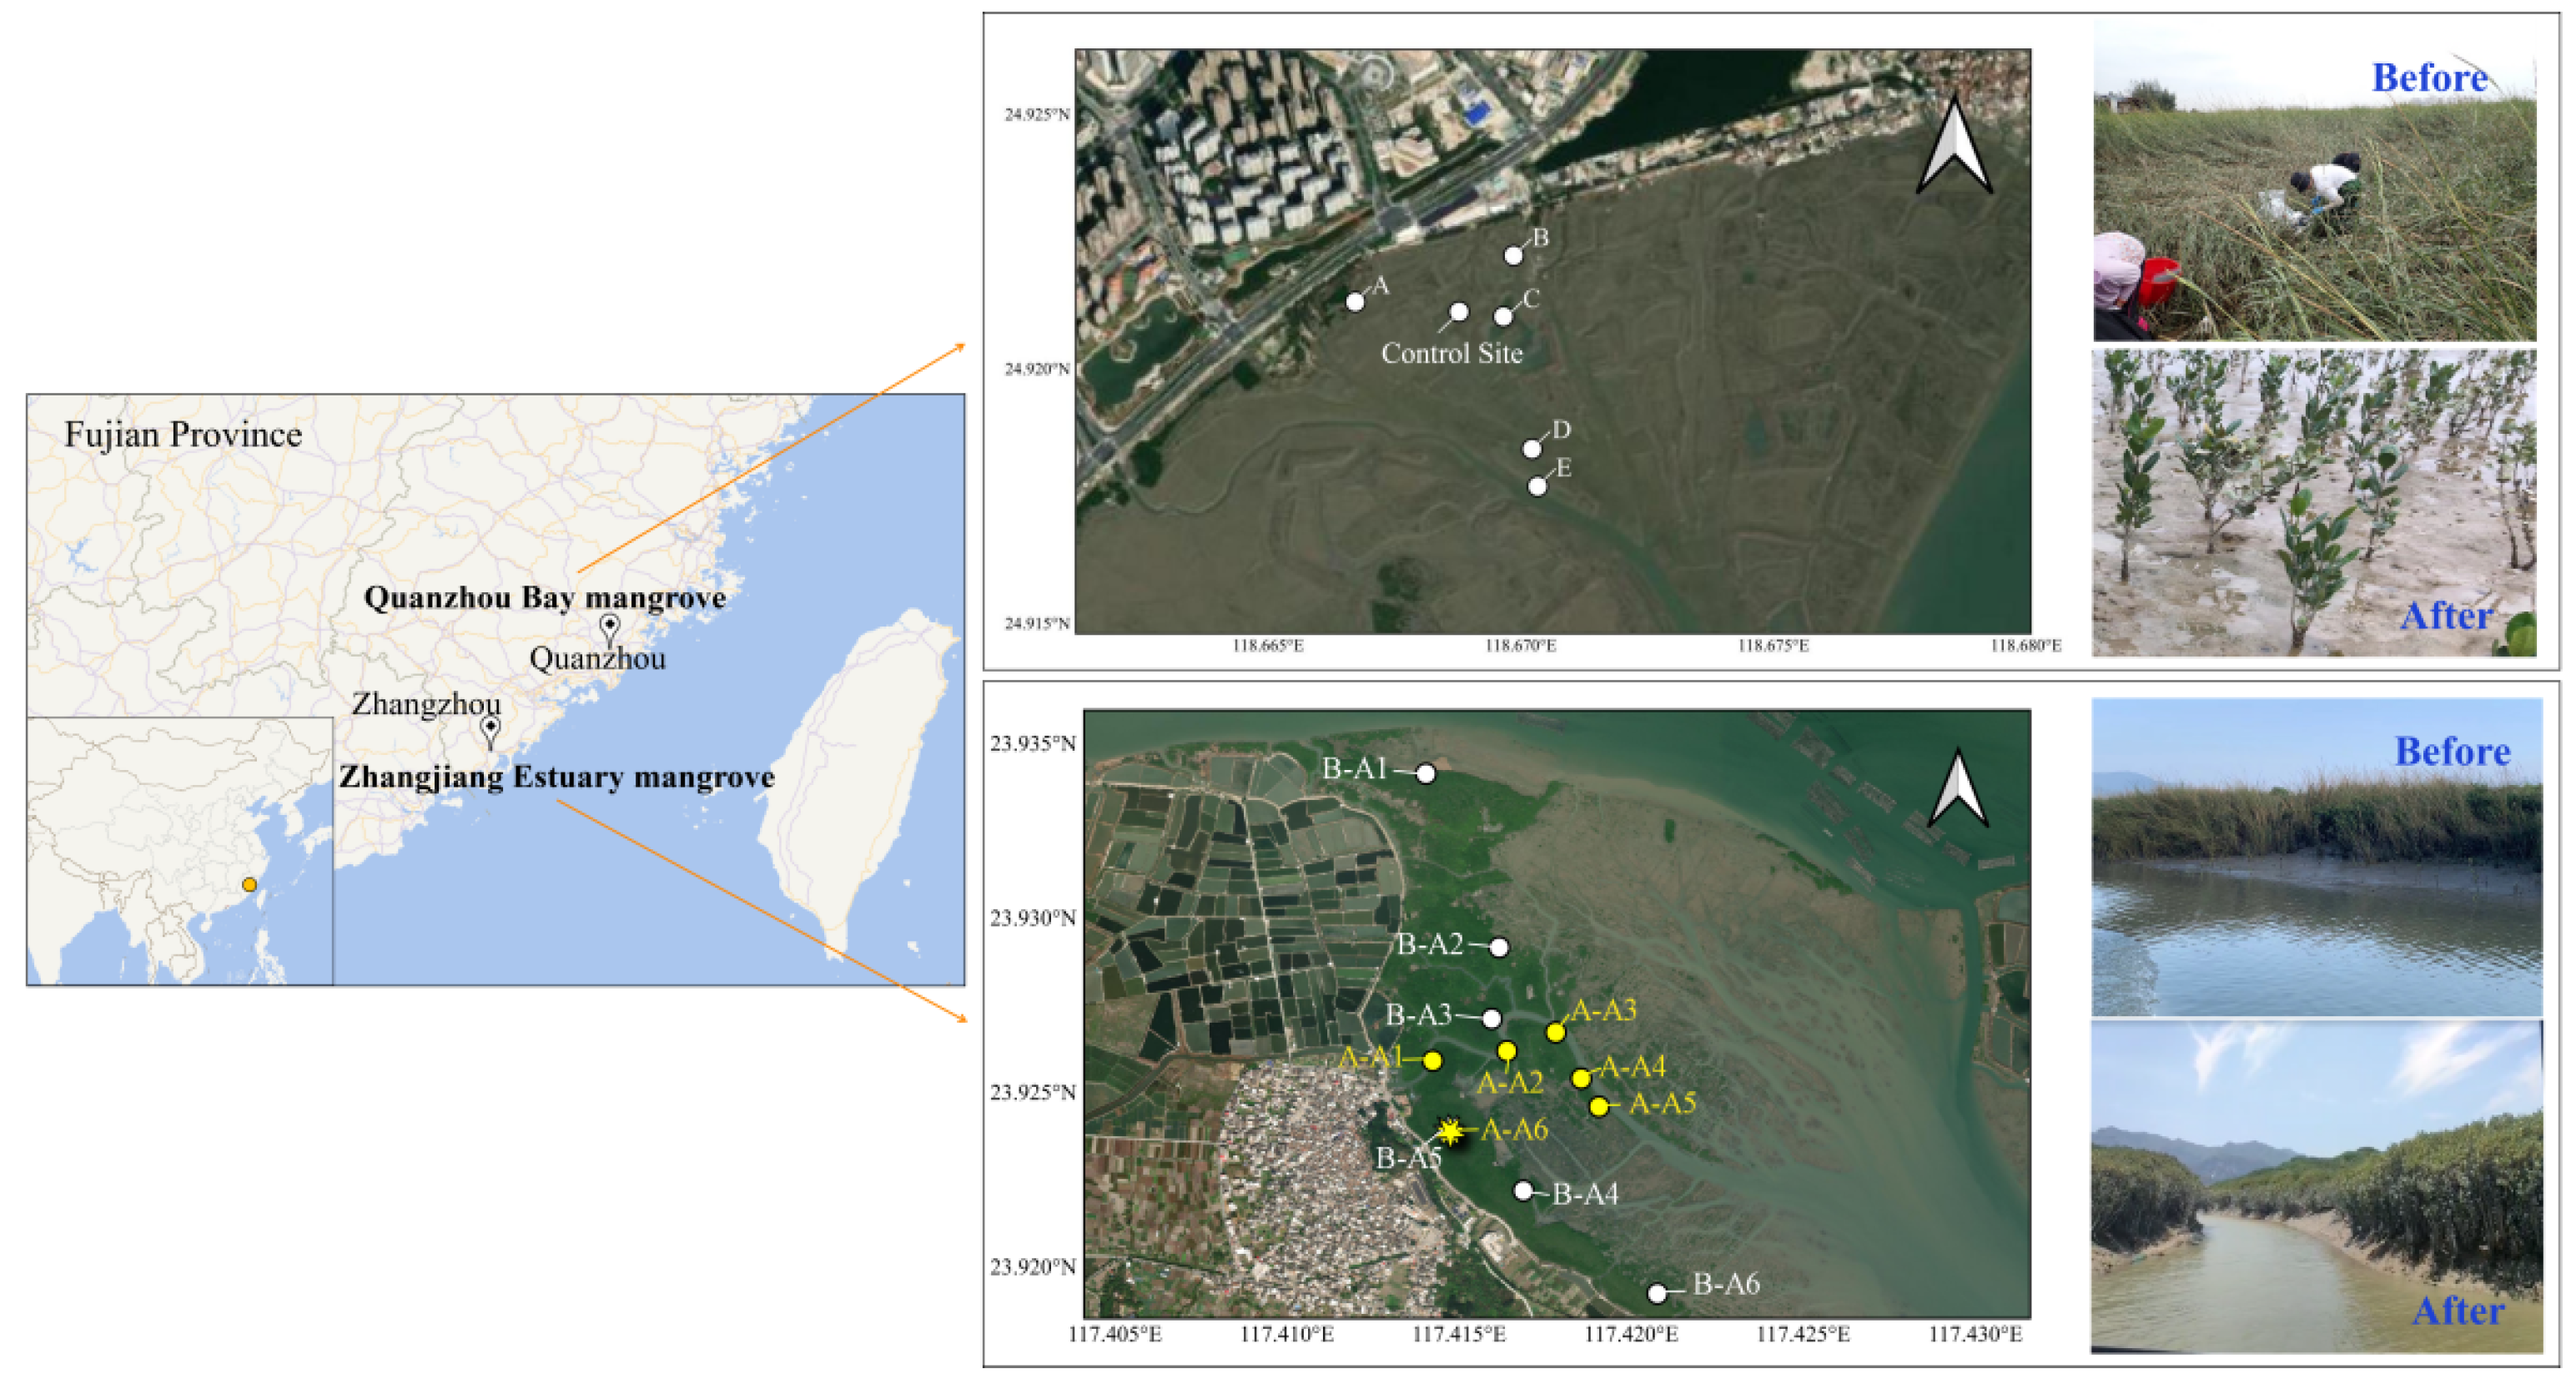
The ZJE and QZB mangrove forests are both located in Fujian Province, southeastern China. These areas have been influenced by S. alterniflora for many years [10,11]. In the ZJE mangrove forest, S. alterniflora was mainly observed alongside the tidal creek or at the fringe of the mudflat, while that in QZB occupied most of the study area. In late 2022, the S. alterniflora in the study areas was removed by mowing and plowing, without using a herbicide. Field sampling was carried out before and after the removal of S. alterniflora (in December 2021 and May 2023 in the ZJE mangrove forest and September 2022 and June 2023 in the QZB mangrove forest, respectively). The later sampling was conducted approximately six months after the removal of S. alterniflora. The locations of the sampling sites are shown in Figure 1. There were slight variations in the sampling sites in the ZJE mangrove forest, with one site located in the core zone of the mangrove community (B-A5 and A-A6) and others positioned at the fringe of the mangroves. The sampling sites within the QZB mangrove forest remained consistent across both periods, with a control site established on the mudflat.
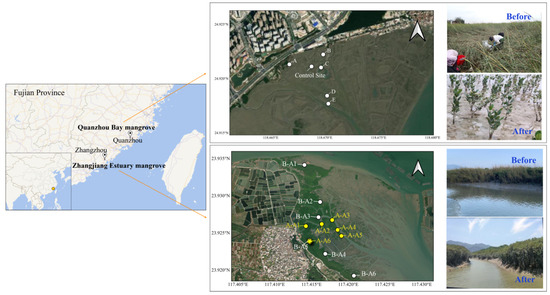
Figure 1.
The location of the sampling sites. The sites labeled “B-” and “A-” in the Zhangjiang Estuary represent the sampling sites before and after the removal of S. alterniflora, respectively, with B-A5 and A-A6 located in the same location.
Surface soil (0~10 cm) was collected with a sampling tube (2.9 cm inner diameter); then the topmost 1 cm was removed. After that, the upper 5 cm of the sample was collected to detect the content and δ13C of the SOM (δ13CSOM). During the second investigation in the ZJE mangrove forest, soil samples from depths of 20~25 cm (middle layer) and 40~45 cm (bottom layer) were also collected. Samples of mangrove litter and S. alterniflora were collected to measure their C:N ratio and δ13C. The above samples were kept at −20 °C before analysis. Another three replicates of 30 g of surface soil were collected and homogenized under anoxic conditions. Subsamples of 5 g of soil were transferred to 50 mL tubes, cooled with dry ice and transported under an Argon atmosphere to the laboratory for molecular analyses.
2.2. Content and Isotopic Values of Organic Matter
Triplicate soil samples were collected from within a 1 m × 1 m square at each site and mixed evenly before analysis. In the laboratory, the collected soil and plant samples were treated with HCl vapor (48 h) to remove inorganic carbon and dried at 60 °C. The dried samples were fully pulverized; then the contents of total organic carbon (TOC) and total nitrogen and the δ13C of the SOM were measured using a Finnigan Delta V Advantage isotope ratio mass spectrometer interfaced with a Carlo Erba NC 2500 elemental analyzer, with an analytical precision of <0.2‰.
2.3. The Contribution of S. alterniflora to the Total Soil Organic Matter
In homogeneous ecosystems, the δ13C value can serve as an indicator of the origin of organic compounds. Thus, the specific δ13C and C:N values are hereinafter considered as indirect indicators of the presence of S. alterniflora in an ecosystem. Apart from S. alterniflora and mangrove plants, the production of algae and the imports of external organic matter should also be considered during the source analysis of SOM. The contribution of zooplankton was also considered, as the production of algae may also facilitate the growth of zooplankton. Additionally, as the ZJE mangrove forest has been reported to have been strongly affected by aquaculture sewage for many years [37,38,39], organic matter derived from aquaculture water was considered here. The characteristic δ13C and C:N ratio of organic matter derived from the above sources are shown in Table 1. Based on the stable isotopic mixing model, the contribution of S. alterniflora to the total SOM can be observed.
During our previous study in the QZB mangrove forest, the IsoSource mixing model was used to observe the indicators of S. alterniflora [7]. However, it has been reported that the MixSir mixing model may be more ideal for the source analysis of organic matter [40,41]. Thus the indicators of S. alterniflora in QZB were re-analyzed using the Mixsir mixing model in R (version 4.3.3) and compared with those in the ZJE mangrove forest. The contribution of the mangrove plants was measured by summing the contributions of all the species at each site.

Table 1.
The δ13C and C:N ratio of organic matter derived from different sources.
Table 1.
The δ13C and C:N ratio of organic matter derived from different sources.
| Source | δ13C (‰) | C:N | References | ||
|---|---|---|---|---|---|
| Mean | SD | Mean | SD | ||
| Kandelia candai | −29.50 | 0.90 | 16.49 | 0.86 | This study; [42] |
| Aegiceras corniculatum | −29.98 | 1.01 | 15.33 | 2.31 | |
| Avicennia marima | −29.87 | 1.04 | 13.31 | 3.36 | |
| Bruguiera gymnorrhiza | −29.45 | 0.65 | 21.40 | 4.94 | [43,44,45] |
| S. alterniflora | −12.80 | 0.30 | 32.70 | 1.80 | This study; [46] |
| Rhizophora Stylosa | −27.94 | 0.40 | 25.20 | 3.25 | [44,45,47] |
| Benthic algae | −18.56 | 1.73 | 7.60 | 0.70 | [48,49,50,51,52] |
| Aquaculture water | −27.81 | 1.85 | 4.72 | 1.35 | This study; [53] |
| Phytoplankton | −20.80 | 1.10 | 6.55 | 1.95 | [54] |
| Zooplankton | −26.20 | 5.40 | 4.48 | 1.46 | [55] |
| Seawater | −25.05 | 0.15 | 4.05 | 0.81 | This study; [53] |
| Fresh water | −26.12 | 1.18 | 4.49 | 2.07 | |
2.4. DNA Sampling, Extraction, Amplification and Sequencing
Soil genomic DNA was extracted using the E.Z.N.A. Soil DNA Kit (Omega Bio-tek, Inc., Nockross, GA, USA) following the manual. The concentration and quality of the genomic DNA were checked using a NanoDrop 2000 spectrophotometer (Thermo Scientific Inc., Waltham, MA, USA). DNA samples were stored at −20 °C for subsequent experiments. The V3–4 hypervariable region of the bacterial 16S rRNA gene was amplified with the universal primers 338F (5′-ACTCCTACGGGAGGCAGCAG-3′) and 806R (5′-GGACTACNNGGGTATCTAAT-3′). For each sample, an 8-digit barcode sequence was added to the 5′ end of the forward and reverse primers (Allwegene Company, Beijing, China). The PCR was carried out on an ABI 9700 PCR instrument (Applied Biosystems, USA) using 25 μL reaction solutions, containing 12.5 μL 2× Taq PCR MasterMix (Vazyme Biotech Co., Ltd., China) at 3 °C μL (2 ng μL−1), 1 μL forward primer (5 μM), 1 μL reverse primer (5 μM), 2 μL template DNA and 5.5 μL ddH2O. The cycling parameters were 95 °C for 5 min, followed by 28 cycles of 95 °C for 45 s, 55 °C for 50 s and 72 °C for 45 s, with a final extension at 72 °C for 10 min. The PCR products were purified using an Agencourt AMPure XP Kit (Beckman Coulter, Inc., Brea, CA, USA). Sequencing libraries were generated using the NEB Next Ultra II DNA Library Prep Kit (New England Biolabs, Inc., Ipswich, Massachusetts, USA) following the manufacturer’s recommendations. The library quality was assessed using a Nanodrop 2000 (ThermoFisher Scientific, Inc., Waltham, MA, USA), Agilent 2100 Bioanalyzer (Agilent Technologies, Inc., San Clara, CA, USA) and ABI StepOnePlus Real-Time PCR System (Applied Biosystems, Inc., Waltham, MA, USA) successively.
Deep sequencing was performed on an Illumina Miseq/Nextseq 2000/Novaseq 6000 (Illumina, Inc., San Diego, CA, USA) platform at Beijing Allwegene Technology Co., Ltd (Beijing, China). After the run, image analysis, base calling and error estimation were performed using Illumina Analysis Pipeline Version 2.6 (Illumina, Inc., San Diego, CA, USA). Qualified sequences were clustered into operational taxonomic units (OTUs) at a similarity threshold of 97% using the Uparse algorithm in Vsearch (v2.7.1) software. The BLAST (version 2.9.0) tool was used to classify all OTU representative sequences into different taxonomic groups against Silva138 and the GenBank non-redundant nucleus database (nt), and the e-value threshold was set to 1 × 10⁻⁵. QIIME (version 1.8.0) was used to generate rarefaction curves and to calculate the richness and diversity indices based on the OTU information.
2.5. Construction and Visualization of Microbial Co-Occurrence Networks
The microbial co-occurrence networks of the two areas were also analyzed using R (version 4.3.3) and visualized using Gephi (version 0.10.1). Briefly, OTUs with relative abundances of >0.01% of the total number of bacterial sequences were retained for the network construction. Then the Spearman correlations between all the OTU pairs were computed, with the thresholds for |r| and p set to ≥0.8 and <0.05, respectively. A set of parameters, including the average degree, cluster connections, modularity and network density, were also analyzed using Gephi (version 0.10.1). This method made it possible to assess the homogeneity of the microbiota associated with the mangrove ecosystem or, on the contrary, its diversity and heterogeneity, caused by the appearance of new phytocenoses.
2.6. Statistical Analysis
Pearson’s correlation analysis was conducted using the Statistical Package for Social Sciences program (version 19.0) and R (version 4.3.3). The cluster analysis of the OTUs and the diversity analysis of the benthic community were completed using Mothur (version 1.48.0) and R (version 4.3.3). In addition, structural equation modeling (SEM) was conducted using AMOS 26.0 (IBM Corp., Armonk, NY, USA) to measure the effects of the soil physicochemical properties, enzyme activity and plant diversity on the changes in the soil bacterial and fungal community. The parameters used to fit the model included an Χ2/df ≤ 3, an RMSEA (root mean square error approximation) ≤ 0.05, a CFI (comparative fit index) ≥ 0.90 and a GFI (goodness-of-fit index) ≥ 0.90.
3. Results
3.1. Contents of Soil Organic Matter
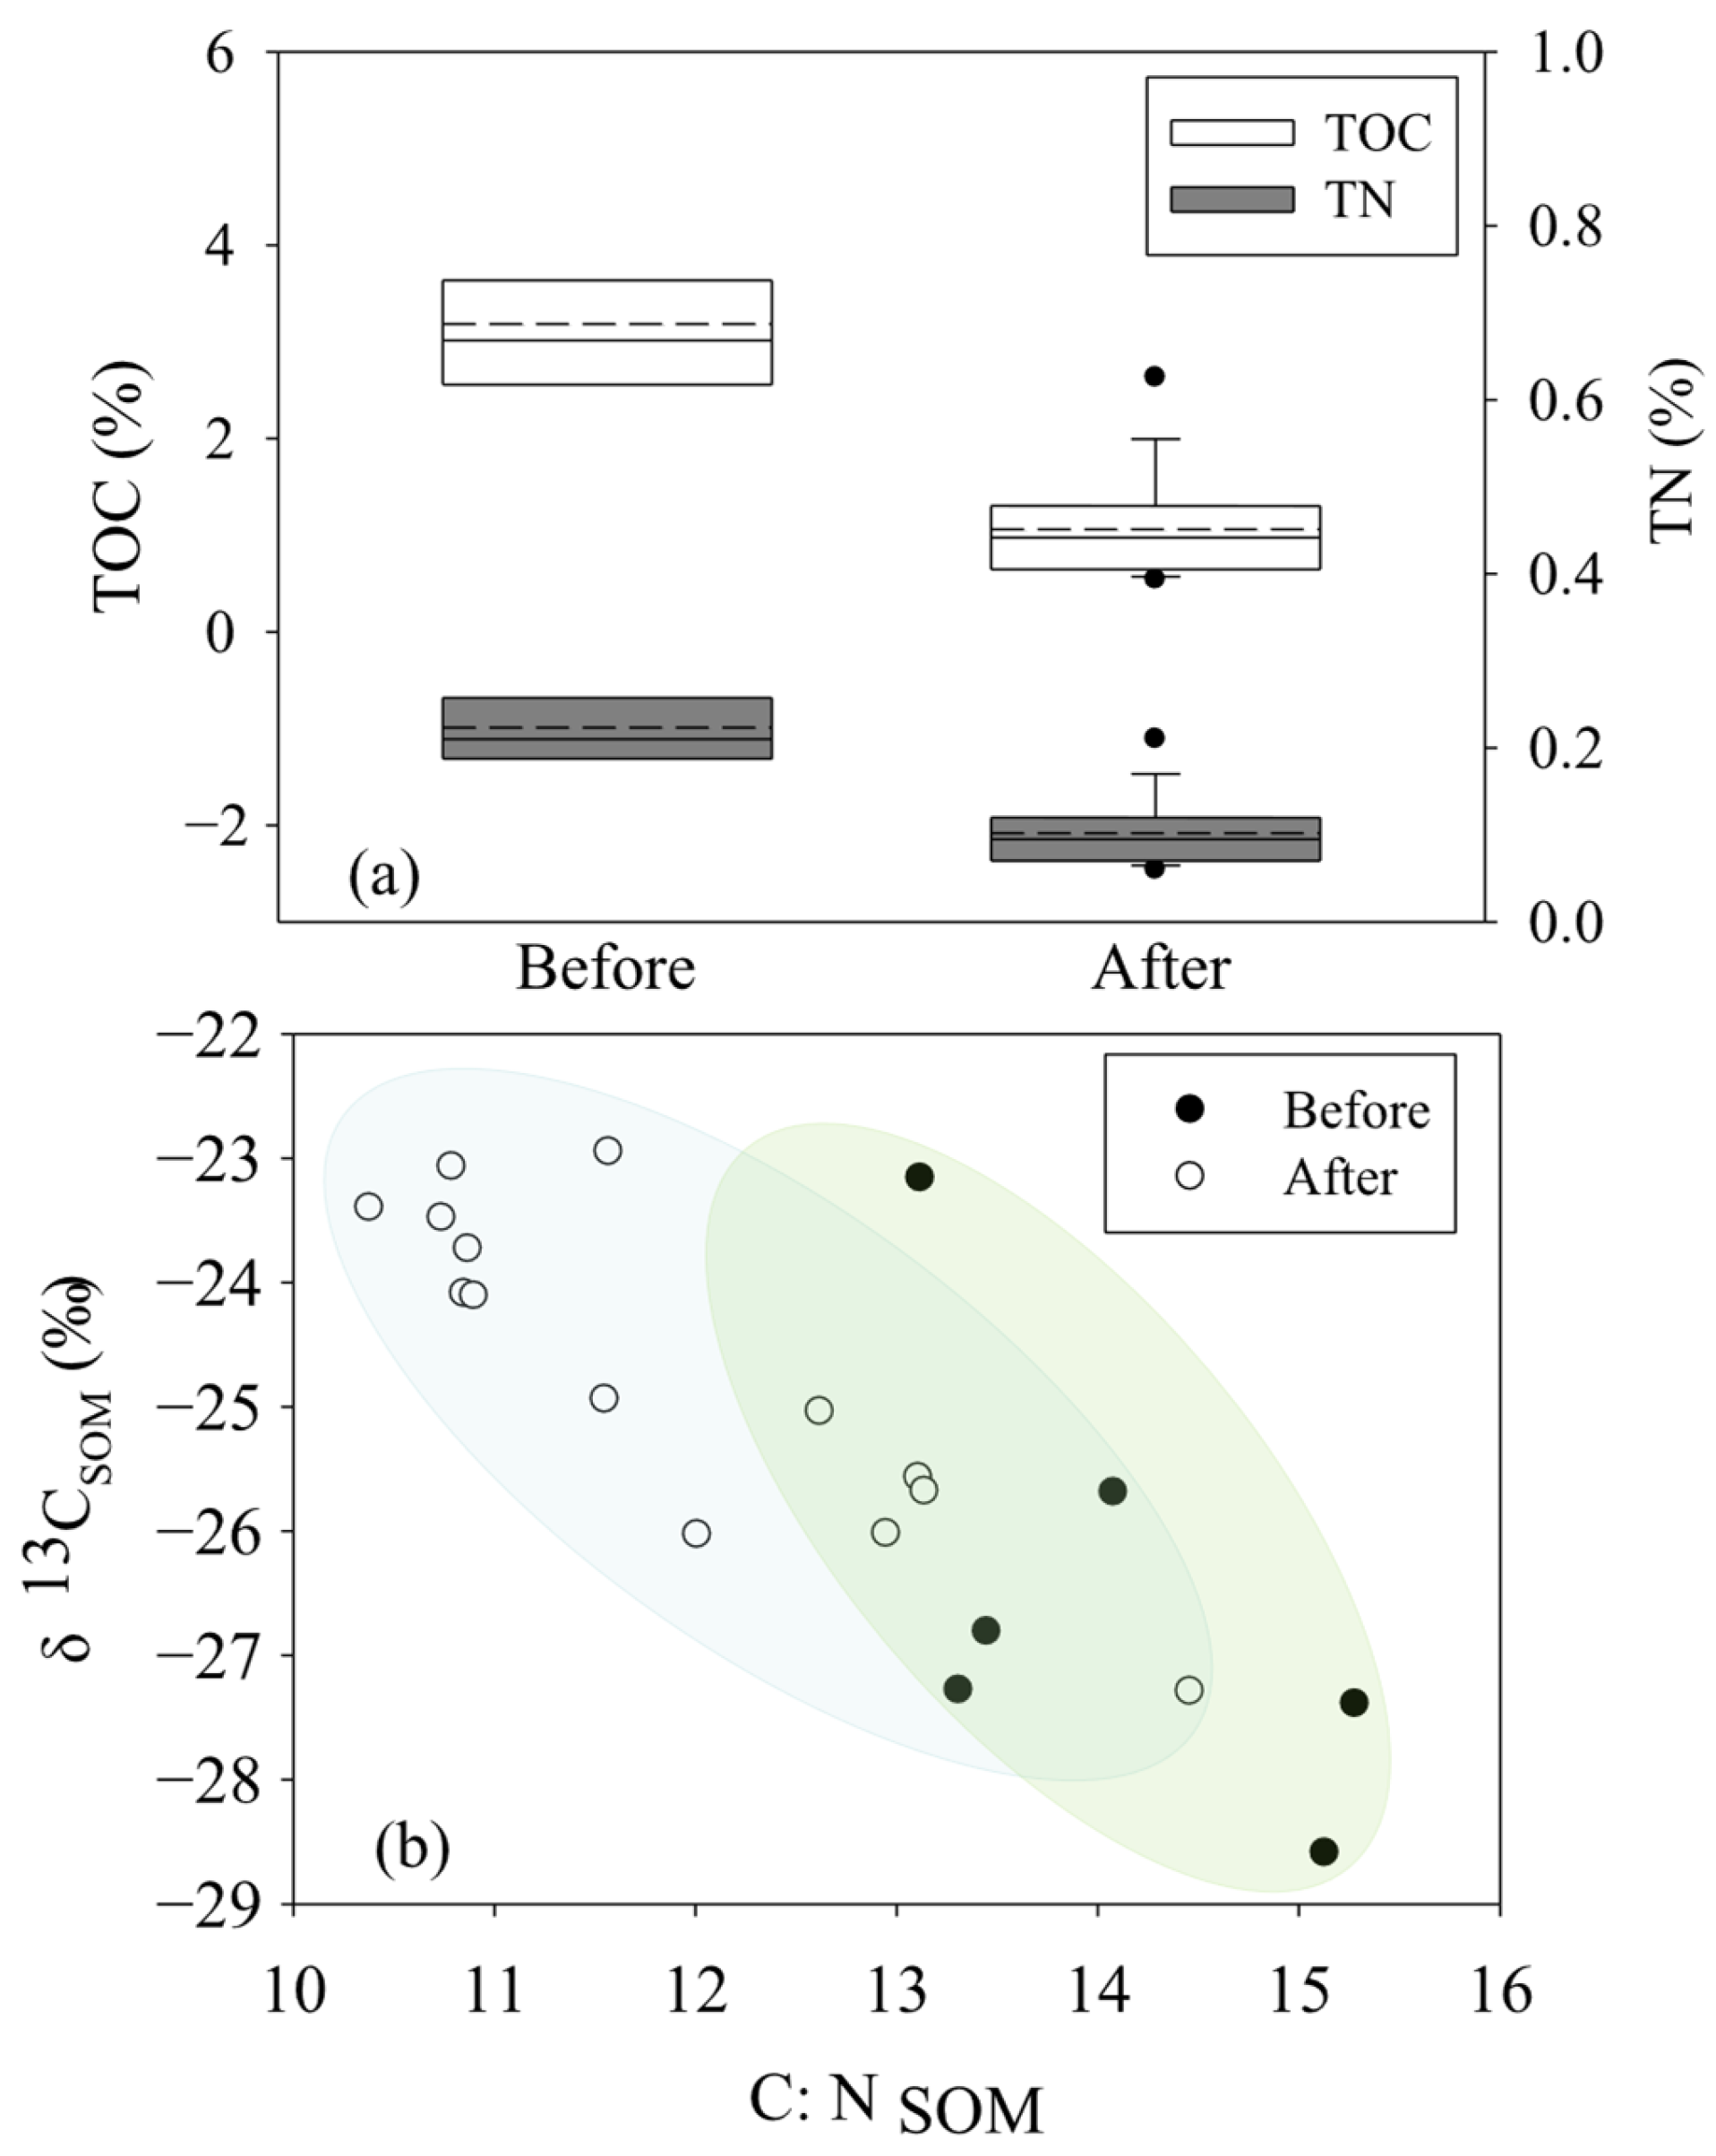
Before the removal of S. alterniflora, the contents of TOC and TN in the ZJE mangrove forest were in the ranges of 2.52%~4.71% (3.19 ± 0.81%, n = 6) and 0.18%~0.31% (0.23 ± 0.05%, n = 6), which decreased to 0.54%~2.63% (1.06 ± 0.53%, n = 14) and 0.06%~0.21% (0.10 ± 0.04%, n = 14) after the removal of S. alterniflora (Figure 2a). Generally, higher contents of both TOC and TN were observed in the core area of the mangrove community. Following the trend of the variation in the TOC and TN, the C:N ratio of the soil (C:NSOM) in the ZJE mangrove forest decreased from 13.12~15.28 (14.09 ± 0.95%, n = 6) to 8.39~12.39 (10.16 ± 1.05%, n = 14) (Figure 2b), with the maximum values observed in the core area of the ZJE mangrove forest during both sampling periods (Table S1). In comparison, the observed δ13CSOM values showed relatively less temporal variation (Figure 2b), being in the ranges of −28.6‰~−23.2‰ (−26.5 ± 1.8‰, n = 6) and −27.29‰~−22.95‰ (−24.67 ± 1.32 ‰, n = 14) before and after the removal of S. alterniflora, respectively (Figure 2b). The variation in the TOC, TN and C:NSOM in the QZB mangrove forest was described in our previous research [7]. Briefly, the contents of TOC and TN and the δ13CSOM both decreased obviously after the removal of S. alterniflora, while the C:N ratio of the SOM increased obviously. In comparison, the contents of TOC and TN in the ZJE were obviously higher than those in the QZB mangrove forest, while the C:NSOM here was lower. The data for the QZB mangrove forest are also shown in Table S2.
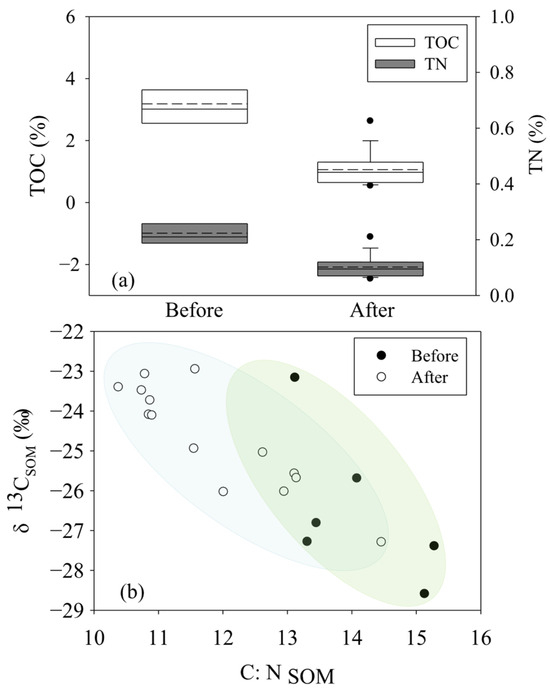
Figure 2.
The contents and isotopic characteristics of soil organic matter in Zhangjiang Estuary mangrove forest: (a) the contents of total organic carbon and total nitrogen, (b) the C:NSOM and the δ13C of soil organic matter.
3.2. The Indicators of the Underground Biomass of S. alterniflora
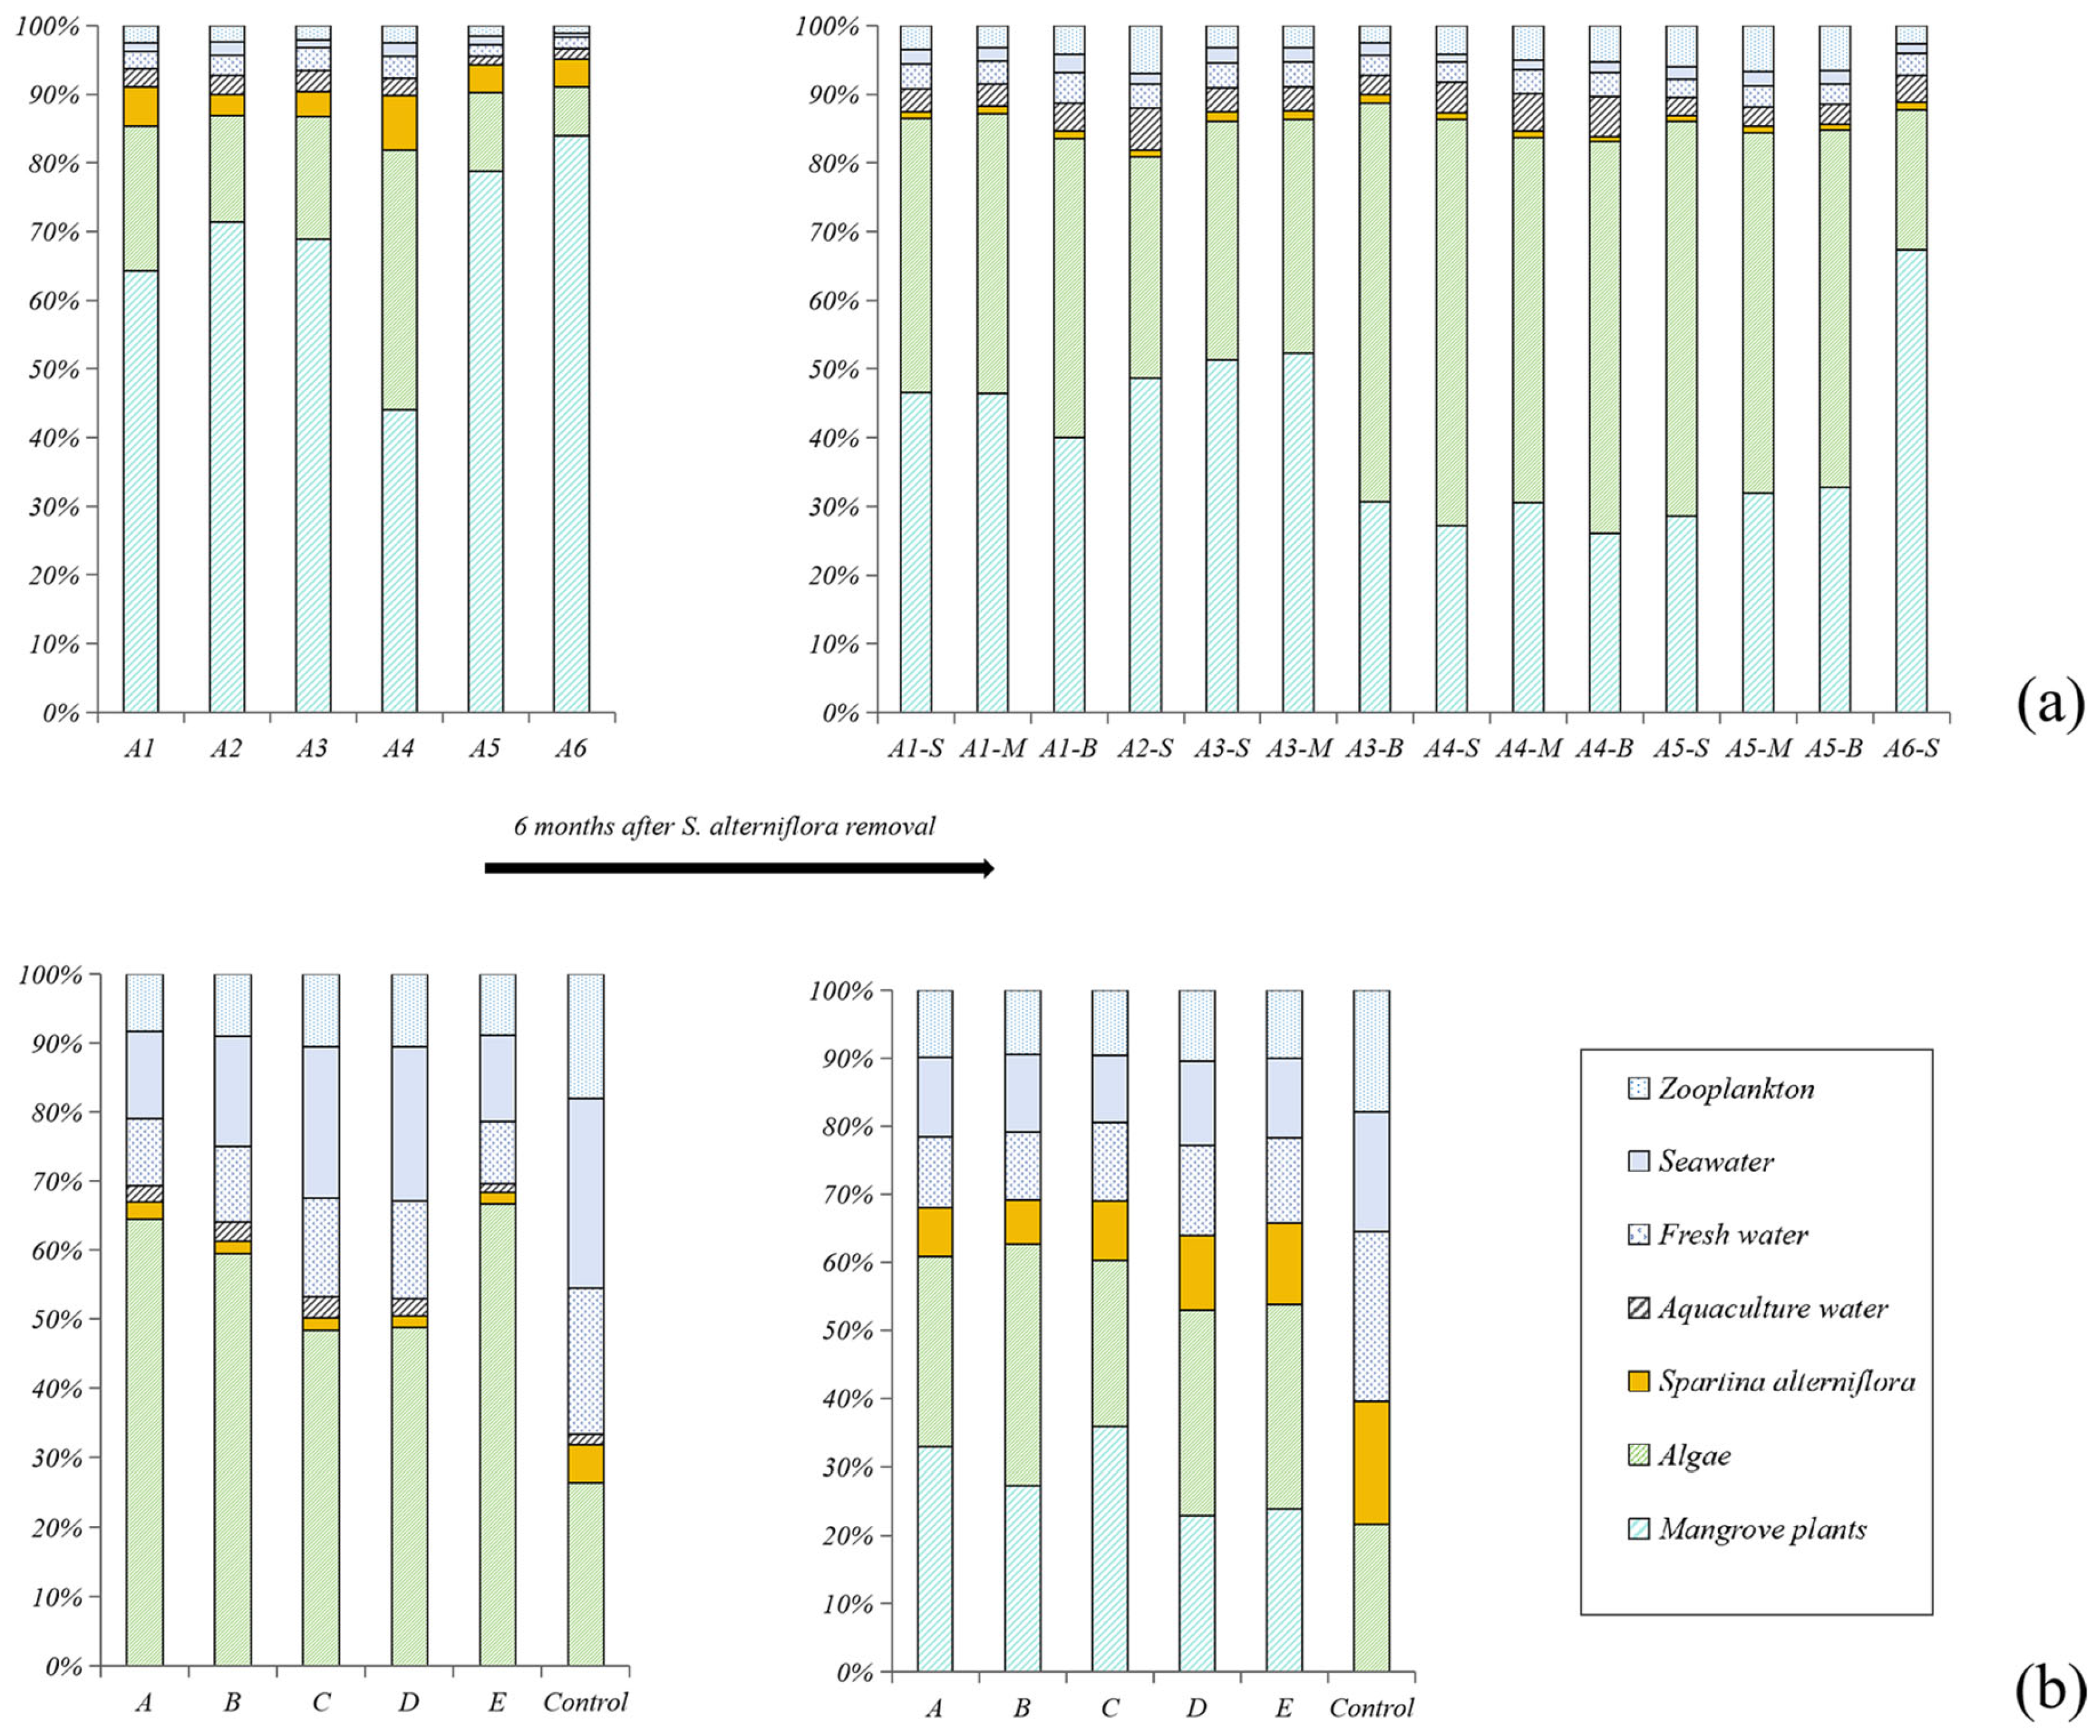
The proportion of the organic matter derived from different sources is shown in Figure 3: (1) Before the removal of S. alterniflora, S. alterniflora contributed to 5.2 ± 2.2% (n = 6) and 2.5 ± 1.5% (n = 6) of the total SOM in the ZJE and QZB mangrove forests. Mangrove plants were the primary source of the SOM in the ZJE mangrove forest (68.4 ± 14.3%, n = 6), while algae (including benthic algae and phytoplankton) were the main source in the QZB mangrove forest (53.6 ± 16.2%, n = 6). (2) At 6 months after the removal of S. alterniflora, its contribution had decreased to 1.0 ± 0.2% (n = 11) in the ZJE mangrove forest, whereas that in the QZB mangrove forest had increased to 10.6 ± 4.2% (n = 6). Algae became another significant source of the SOM in the ZJE mangrove forest, accounting for 64.6 ± 20.5% (n = 11) of the total SOM, while the contribution of algae in the QZB mangrove forest was relatively lower (28.2 ± 4.8%, n = 6). Generally, the indicators of S. alterniflora in the QZB mangrove forest increased rapidly during our investigation (t = −6.21, p = 0.002). This was not observed in the ZJE mangrove forest.
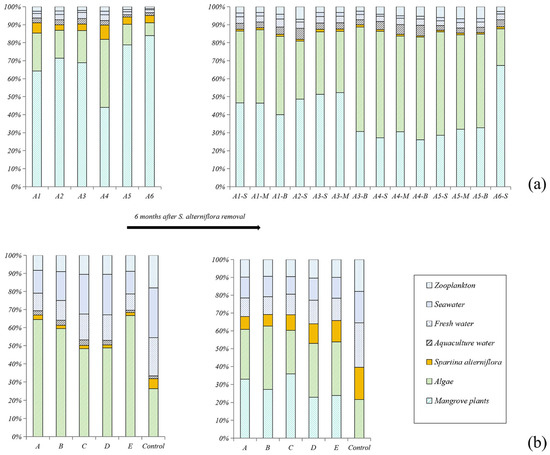
Figure 3.
The contributions of the major sources of soil organic matter before and after the removal of S. alterniflora: (a) Zhangjiang Estuary mangrove forest, (b) Quanzhou Bay mangrove forest. “-S”, “-M” and “-B” represent samples collected from the surface 10 cm, 20~25 cm and 40~45 cm respectively.
3.3. Benthic Bacterial Community
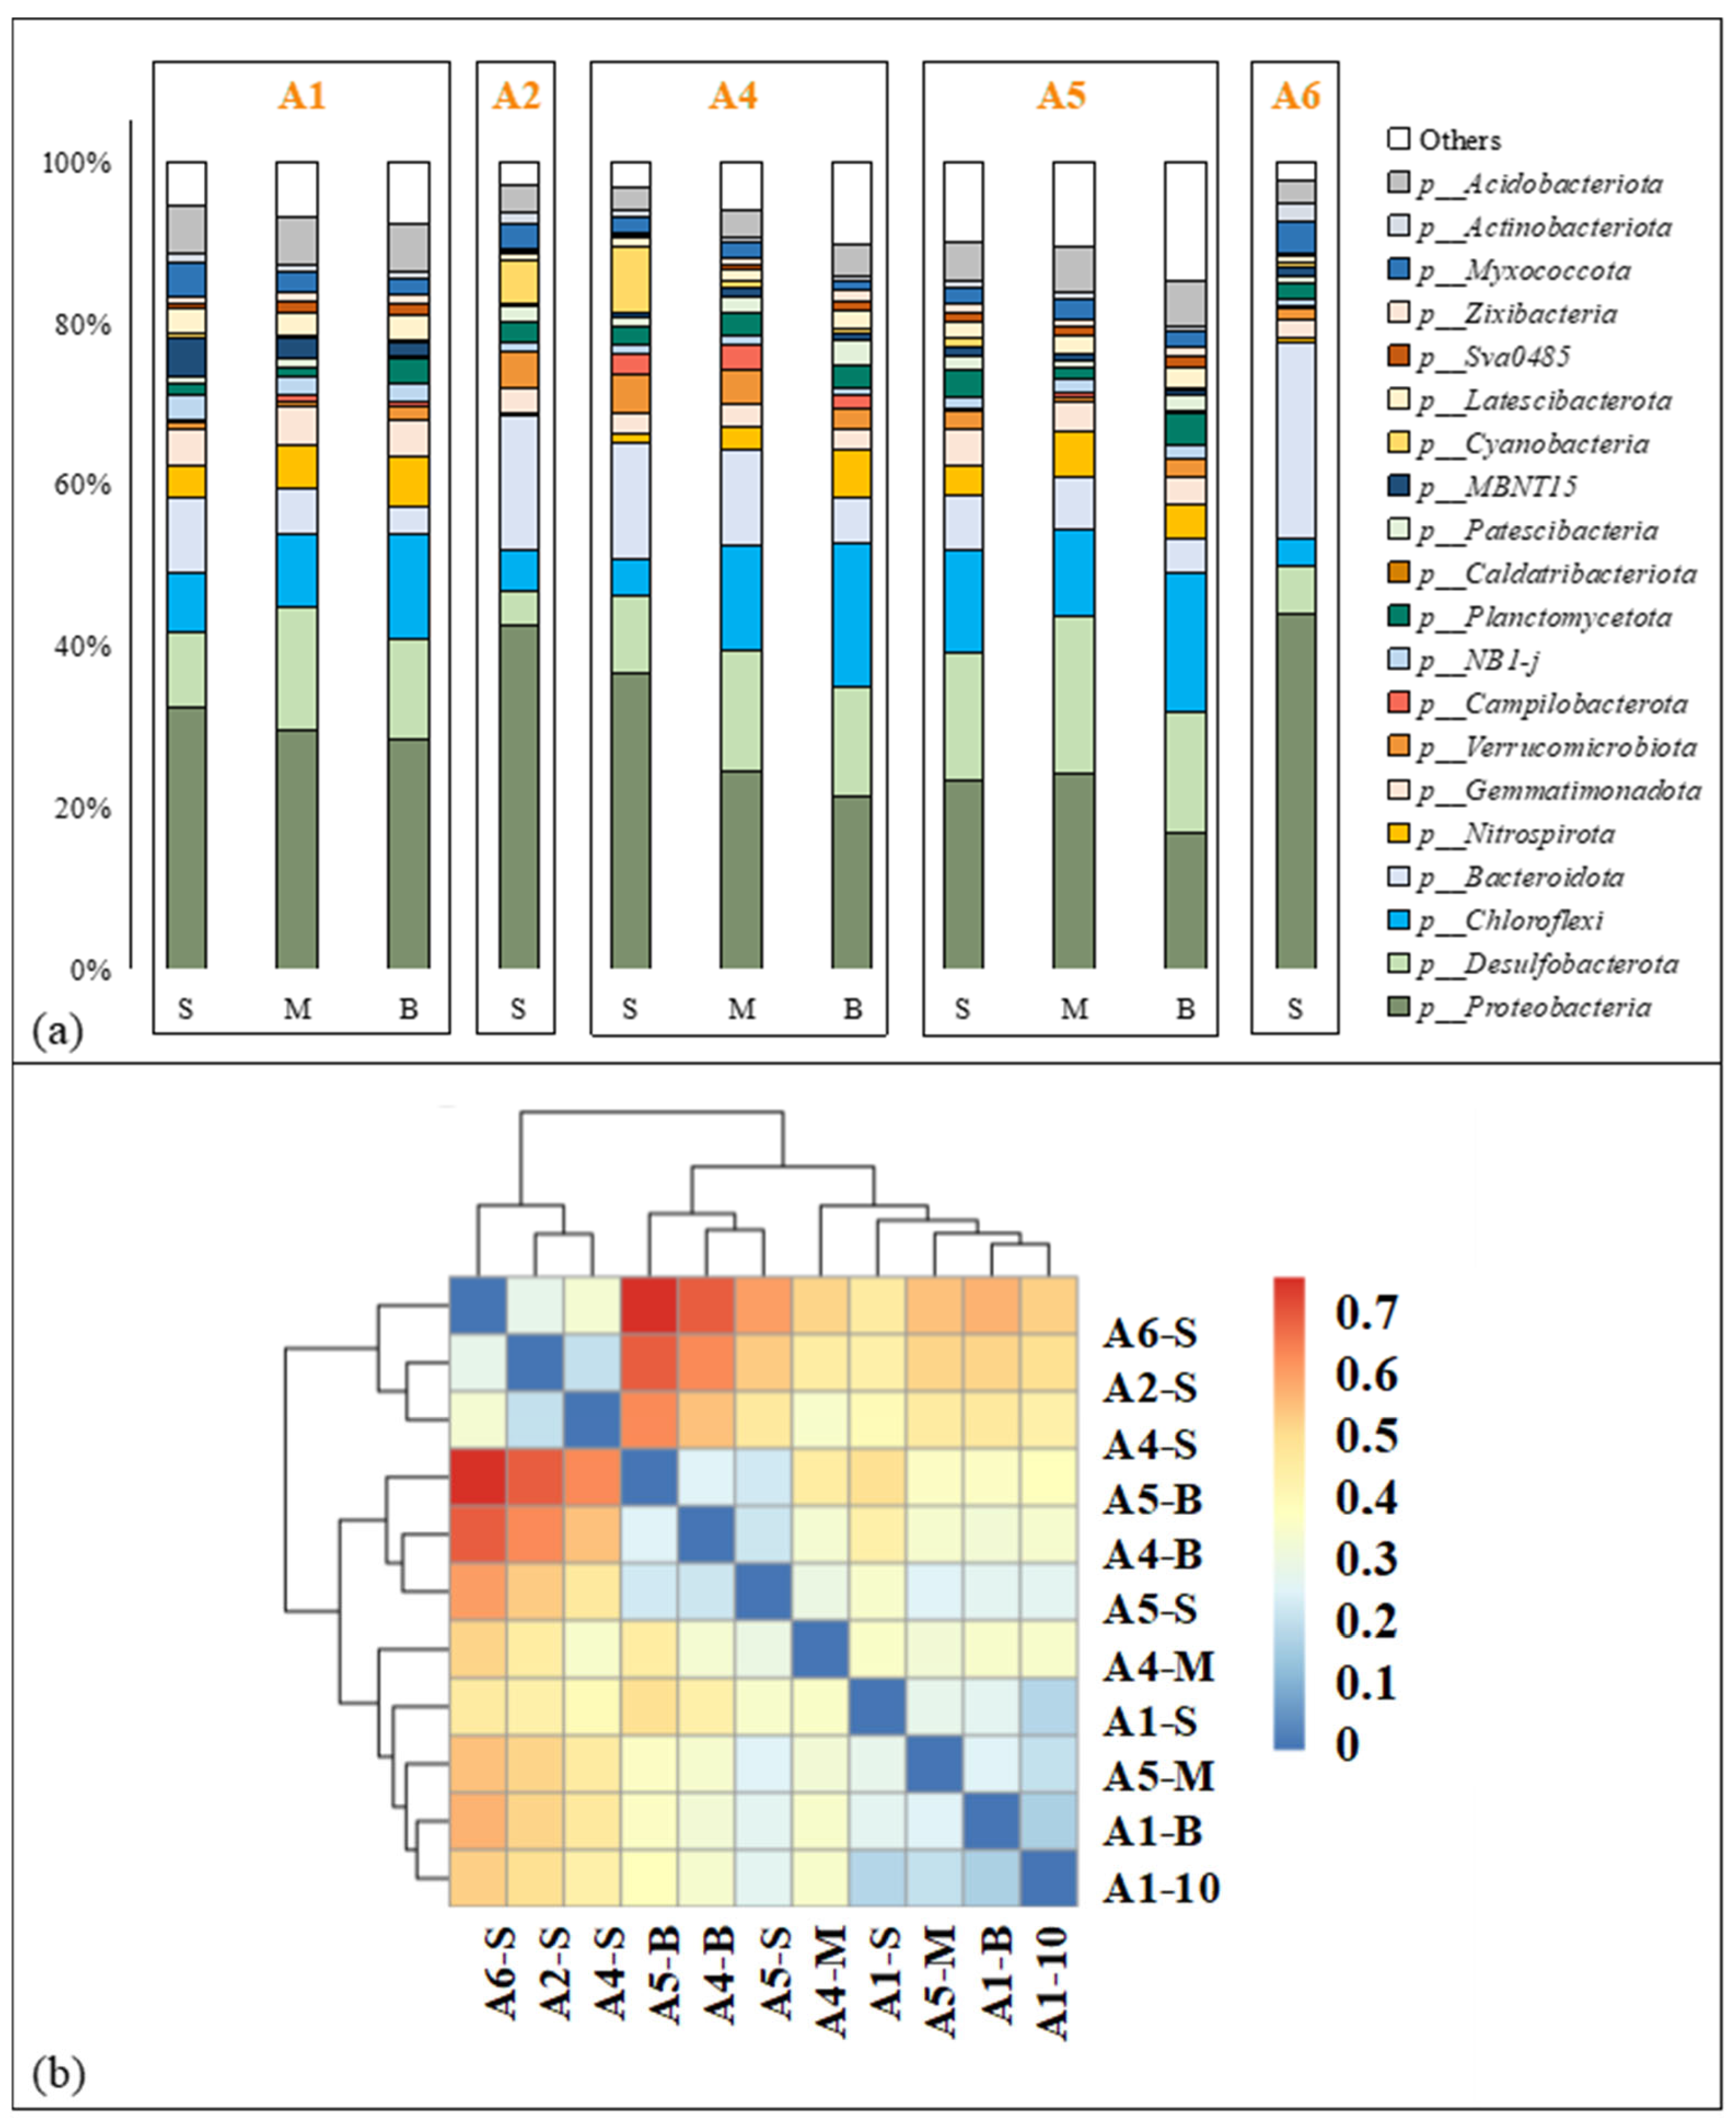
The composition of the benthic bacterial community at the phylum level in the ZJE mangrove forest is shown in Figure 4. Most of the benthic bacteria in the study area belonged to Proteobacteria, accounting for 16.82%~48.37% (29.46 ± 8.69%, n = 11) of the total biomass (Figure 4a). Apart from Proteobacteria, Bacteroidota was another important component at the surface at A2, A4 and A6, while Desulfobacterota and Chloroflexi had important contributions at the other sites (Figure 4a). Cluster analysis of the observed OTUs indicated that the microbial compositions at the surface at A2, A3 and A6 were similar to each other (Figure 4b) and that the microbial compositions at the other sites could be further divided into two groups (Figure 4b). Compared to the horizontal variation, vertical variation in the bacterial composition was less obvious (Figure 4a). The composition of the benthic bacterial community in the QZB mangrove forest was reported in our previous study [7], made up mostly of Proteobacteria and Desulfobacterota (Figure S1). The details of the benthic bacterial community composition in QZB are shown in Figure S1. The alpha diversity indices of the soil microbial communities in the two areas are shown in Figure S2. Generally, apart from the Shannon diversity index, all the other indices observed in the ZJE mangrove forest were higher than those in the QZB mangrove forest (p < 0.05), especially the PD_whole_tree index (Figure S2).
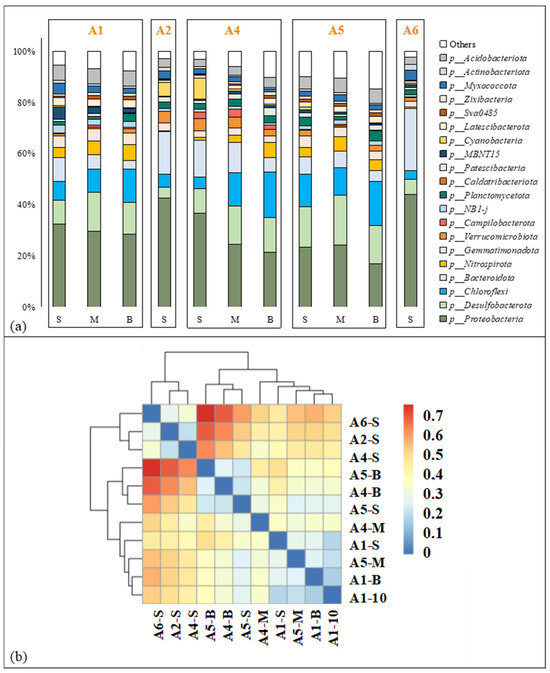
Figure 4.
Composition of benthic microbial community in Zhangjiang Estuary mangrove forest: (a) microbial composition at phylum level, (b) results of cluster analysis. “-S”, “-M” and “-B” represent samples collected from the surface 10 cm, 20~25 cm and 40~45 cm respectively.
3.4. Microbial Co-Occurrence Networks
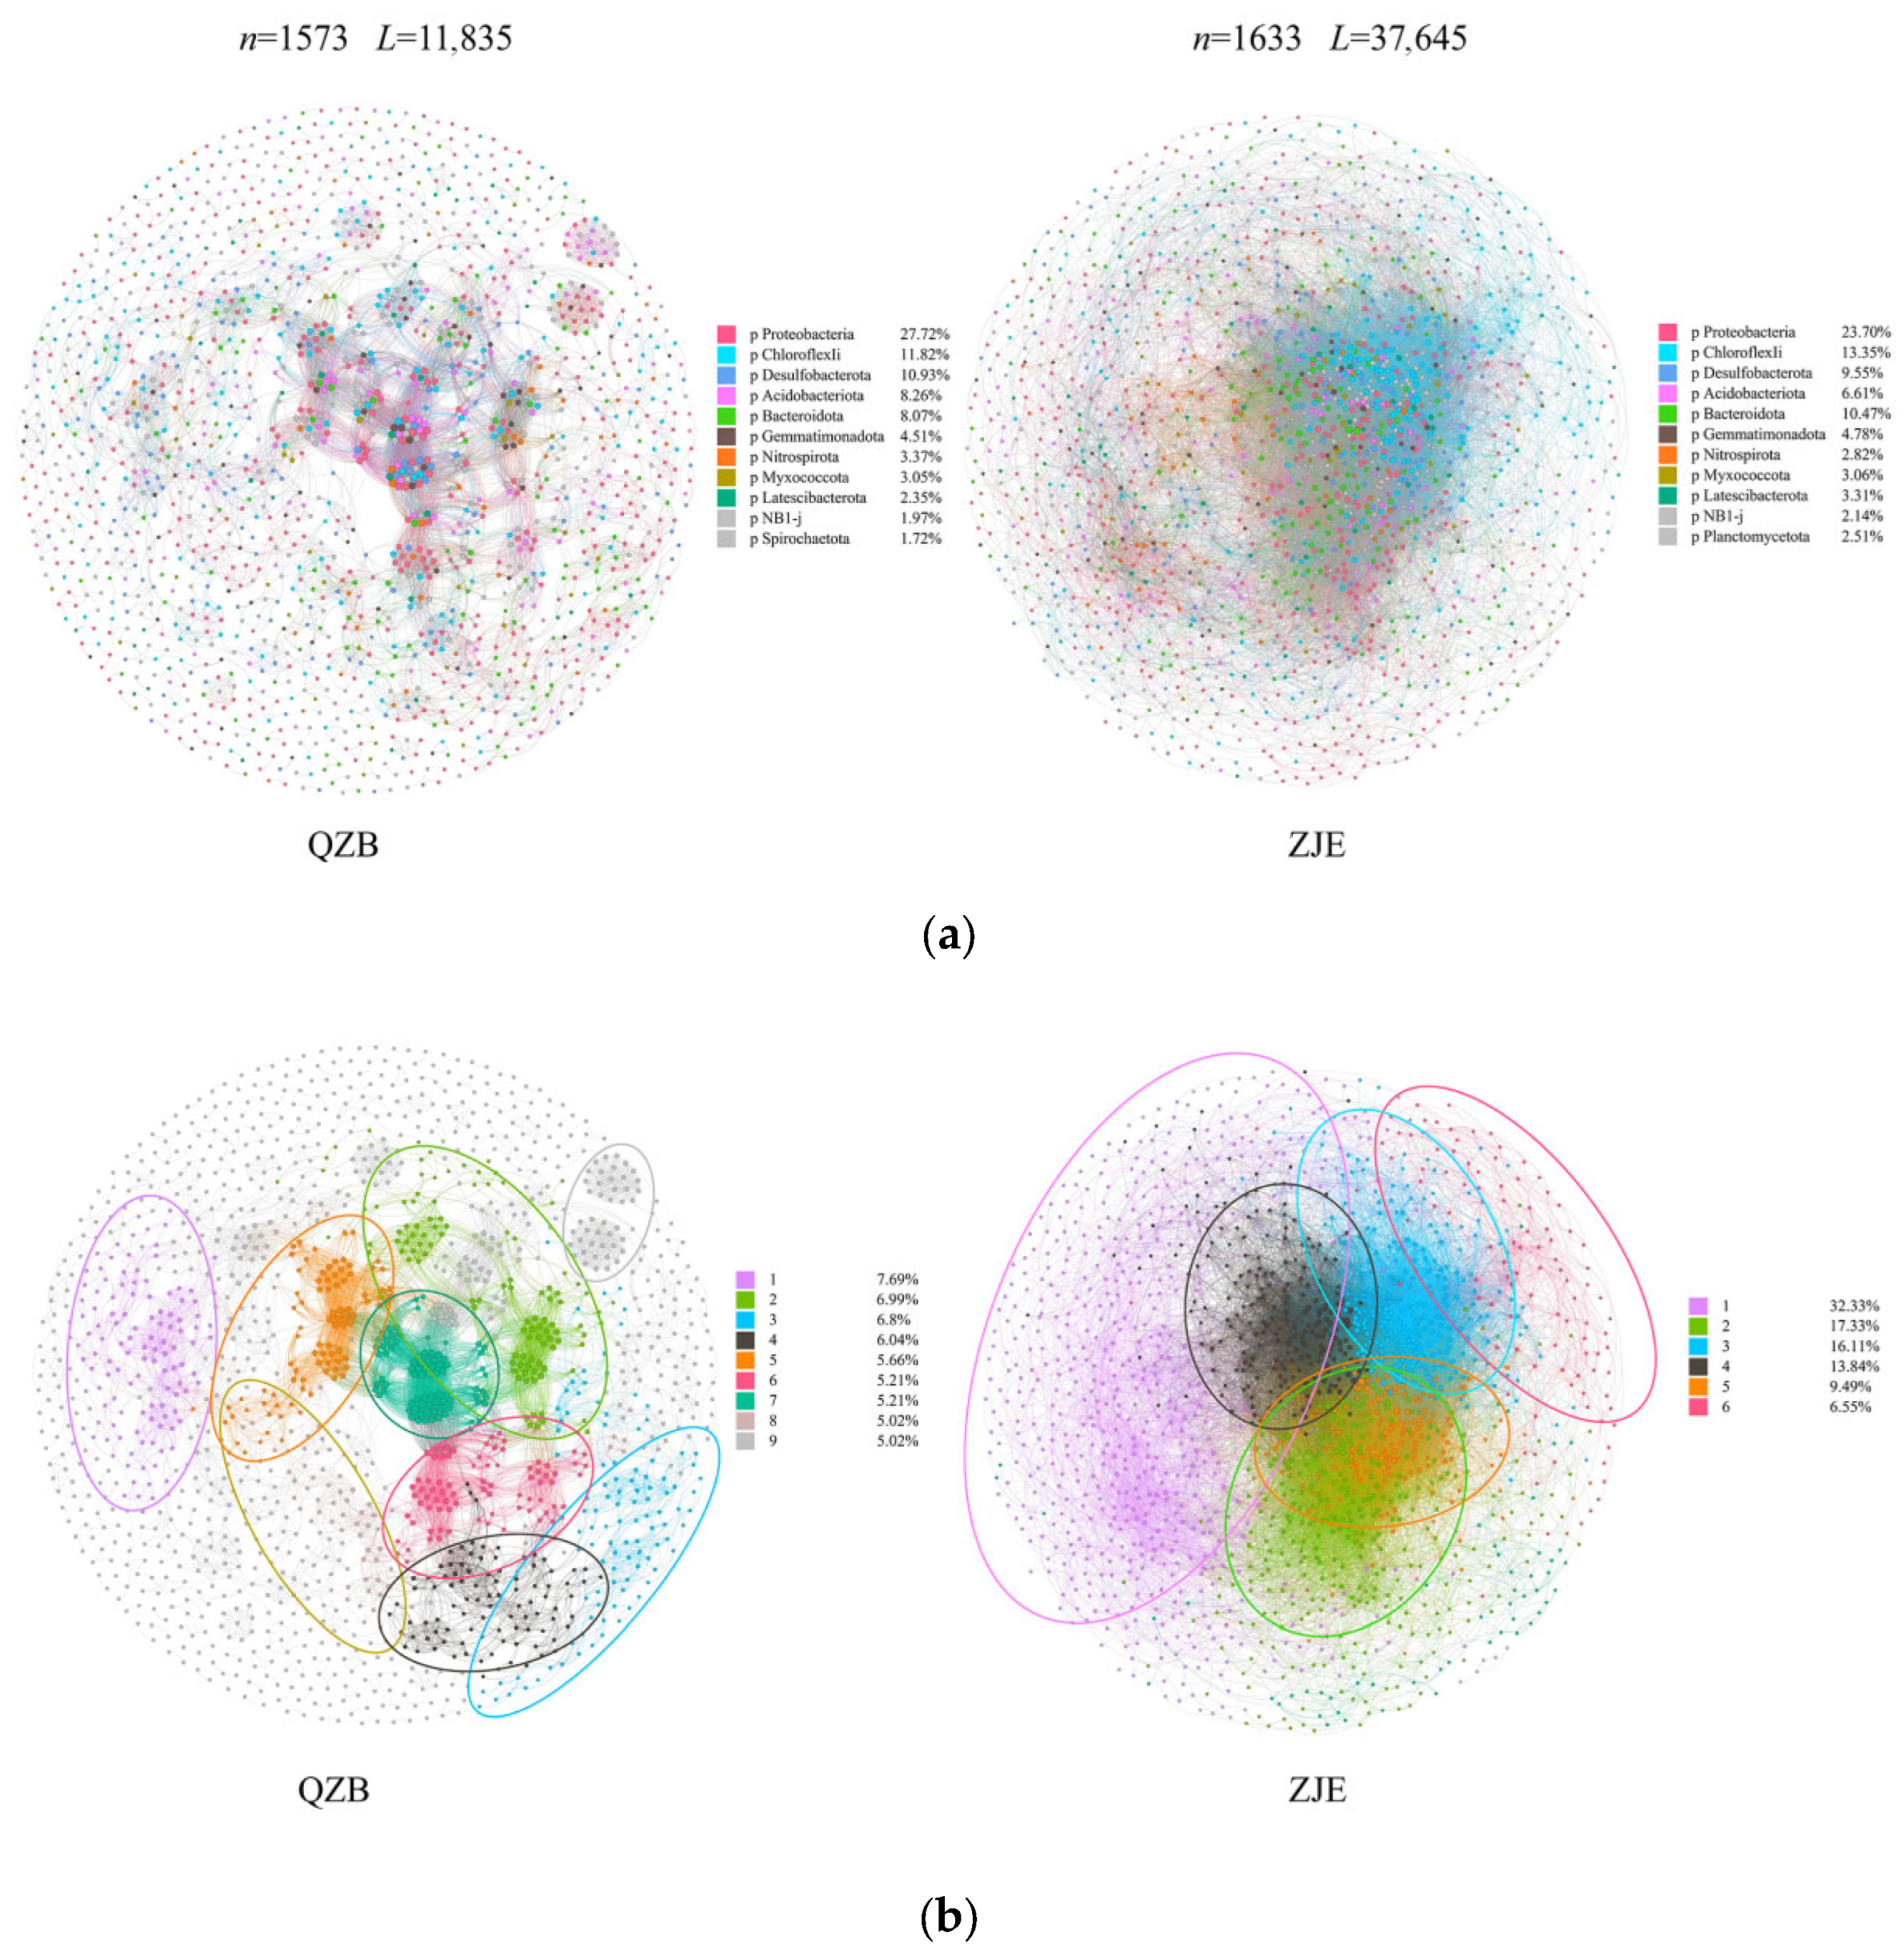
The microbial co-occurrence networks in the two areas exhibited obvious differences (Figure 5). Generally, the network in the ZJE mangrove forest had higher connectivity, with 1633 nodes and 37,645 edges observed, while that in the QZB mangrove forest had only 1573 nodes and 11,835 edges (Figure 5). Most of the connections observed in both areas were positive correlations, accounting for about 62.7% and 62.4% of the total links in the ZJE mangrove forest and QZB mangrove forest, respectively. Proteobacteria was the predominant phylum in both areas, accounting for 23.70% and 27.72% of the major components of the networks in the ZJE and QZB mangrove forests. The topological parameters of the networks are shown in Table 2. Briefly, except for the value of modularity, all the other parameters measured were higher in the ZJE mangrove forest. Generally, the network in the ZJE mangrove forest exhibited a higher level of connectivity.
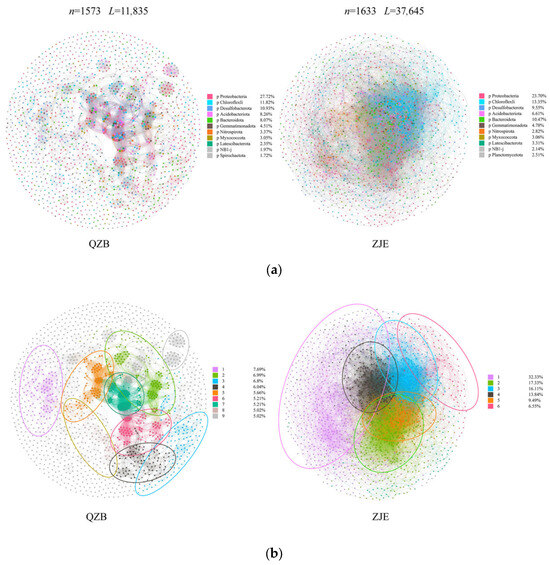
Figure 5.
The microbial co-occurrence networks in the Quanzhou Bay mangrove forest (QZB) and Zhangjiang Estuary mangrove forest (ZJE): (a) the phyla of the major components in the networks and (b) the modularity of the networks’ construction.

Table 2.
The topological parameters of the soil microbial networks in the study areas.
4. Discussion
4.1. Early Warnings of S. alterniflora Regeneration
In this study, the contribution of S. alterniflora to the total SOM was defined using the indicators of its underground biomass. Before the analysis of the SOM, the litter and roots of mangrove and other plants were carefully removed. Thus, the indicators of S. alterniflora had only two possible sources: (1) SOM directly derived from S. alterniflora and (2) the seeds of S. alterniflora. As most of the carbon fixed by S. alterniflora is converted into its own biomass, rather than being conserved in the soil [56,57], the variation in the indicators of S. alterniflora may have mainly been caused by the germination of its seeds. During our investigation, a rapid increase in the indicators of S. alterniflora was observed in the QZB mangrove forest (Figure 2), which was not observed in the ZJE mangrove forest. The regeneration of S. alterniflora was indeed observed in the QZB mangrove forest, about three months after the second investigation. However, this was not observed in the ZJE mangrove forest. The above results may reflect the higher resistance of the natural mangrove forest to S. alterniflora regeneration after restoration. It may also indicate the effectiveness of using a stable isotopic mixing model as an early warning method for S. alterniflora invasion or regeneration, which needs to be considered in future restoration of such areas.
4.2. The Causal Link Between Microbial Diversity and S. alterniflora Invasion/Regeneration
Soil microbes play a key role in regulating the fertility of the soil and have great effects on plant health [28,29,30]. Hence, their biodiversity and functional profiles may serve as efficient indicators of soil health and nutrient pool dynamics [28], further explaining plant growth variations. Though Proteobacteria dominated the microbial communities in both areas, the soil microbe biodiversity was significantly higher in the ZJE mangrove forest (Figure S2), especially the PD_whole_tree index. This index integrates the species abundance and evolutionary distance, with a higher value reflecting higher community diversity [58]. During our investigation, the PD_whole_tree index of soil microbes was negatively correlated with the indicators of S. alterniflora (R = 0.57, n = 17, p < 0.05). In addition, it was also negatively correlated with the C:N ratio of the SOM (R = 0.63, n = 17, p < 0.01). Such correlations can be interpreted from two perspectives: On one hand, S. alterniflora invasion may decrease the microbial diversity by altering the quantity and quality of the bioavailable organic matter in the soil [7,59] or by changing the physical and chemical characteristics of the soil [60,61,62]. On the other hand, higher microbial diversity may support higher functional diversity of soil microbes, thus supporting the health of mangrove plants and increasing the resistance to S. alterniflora invasion/regeneration.
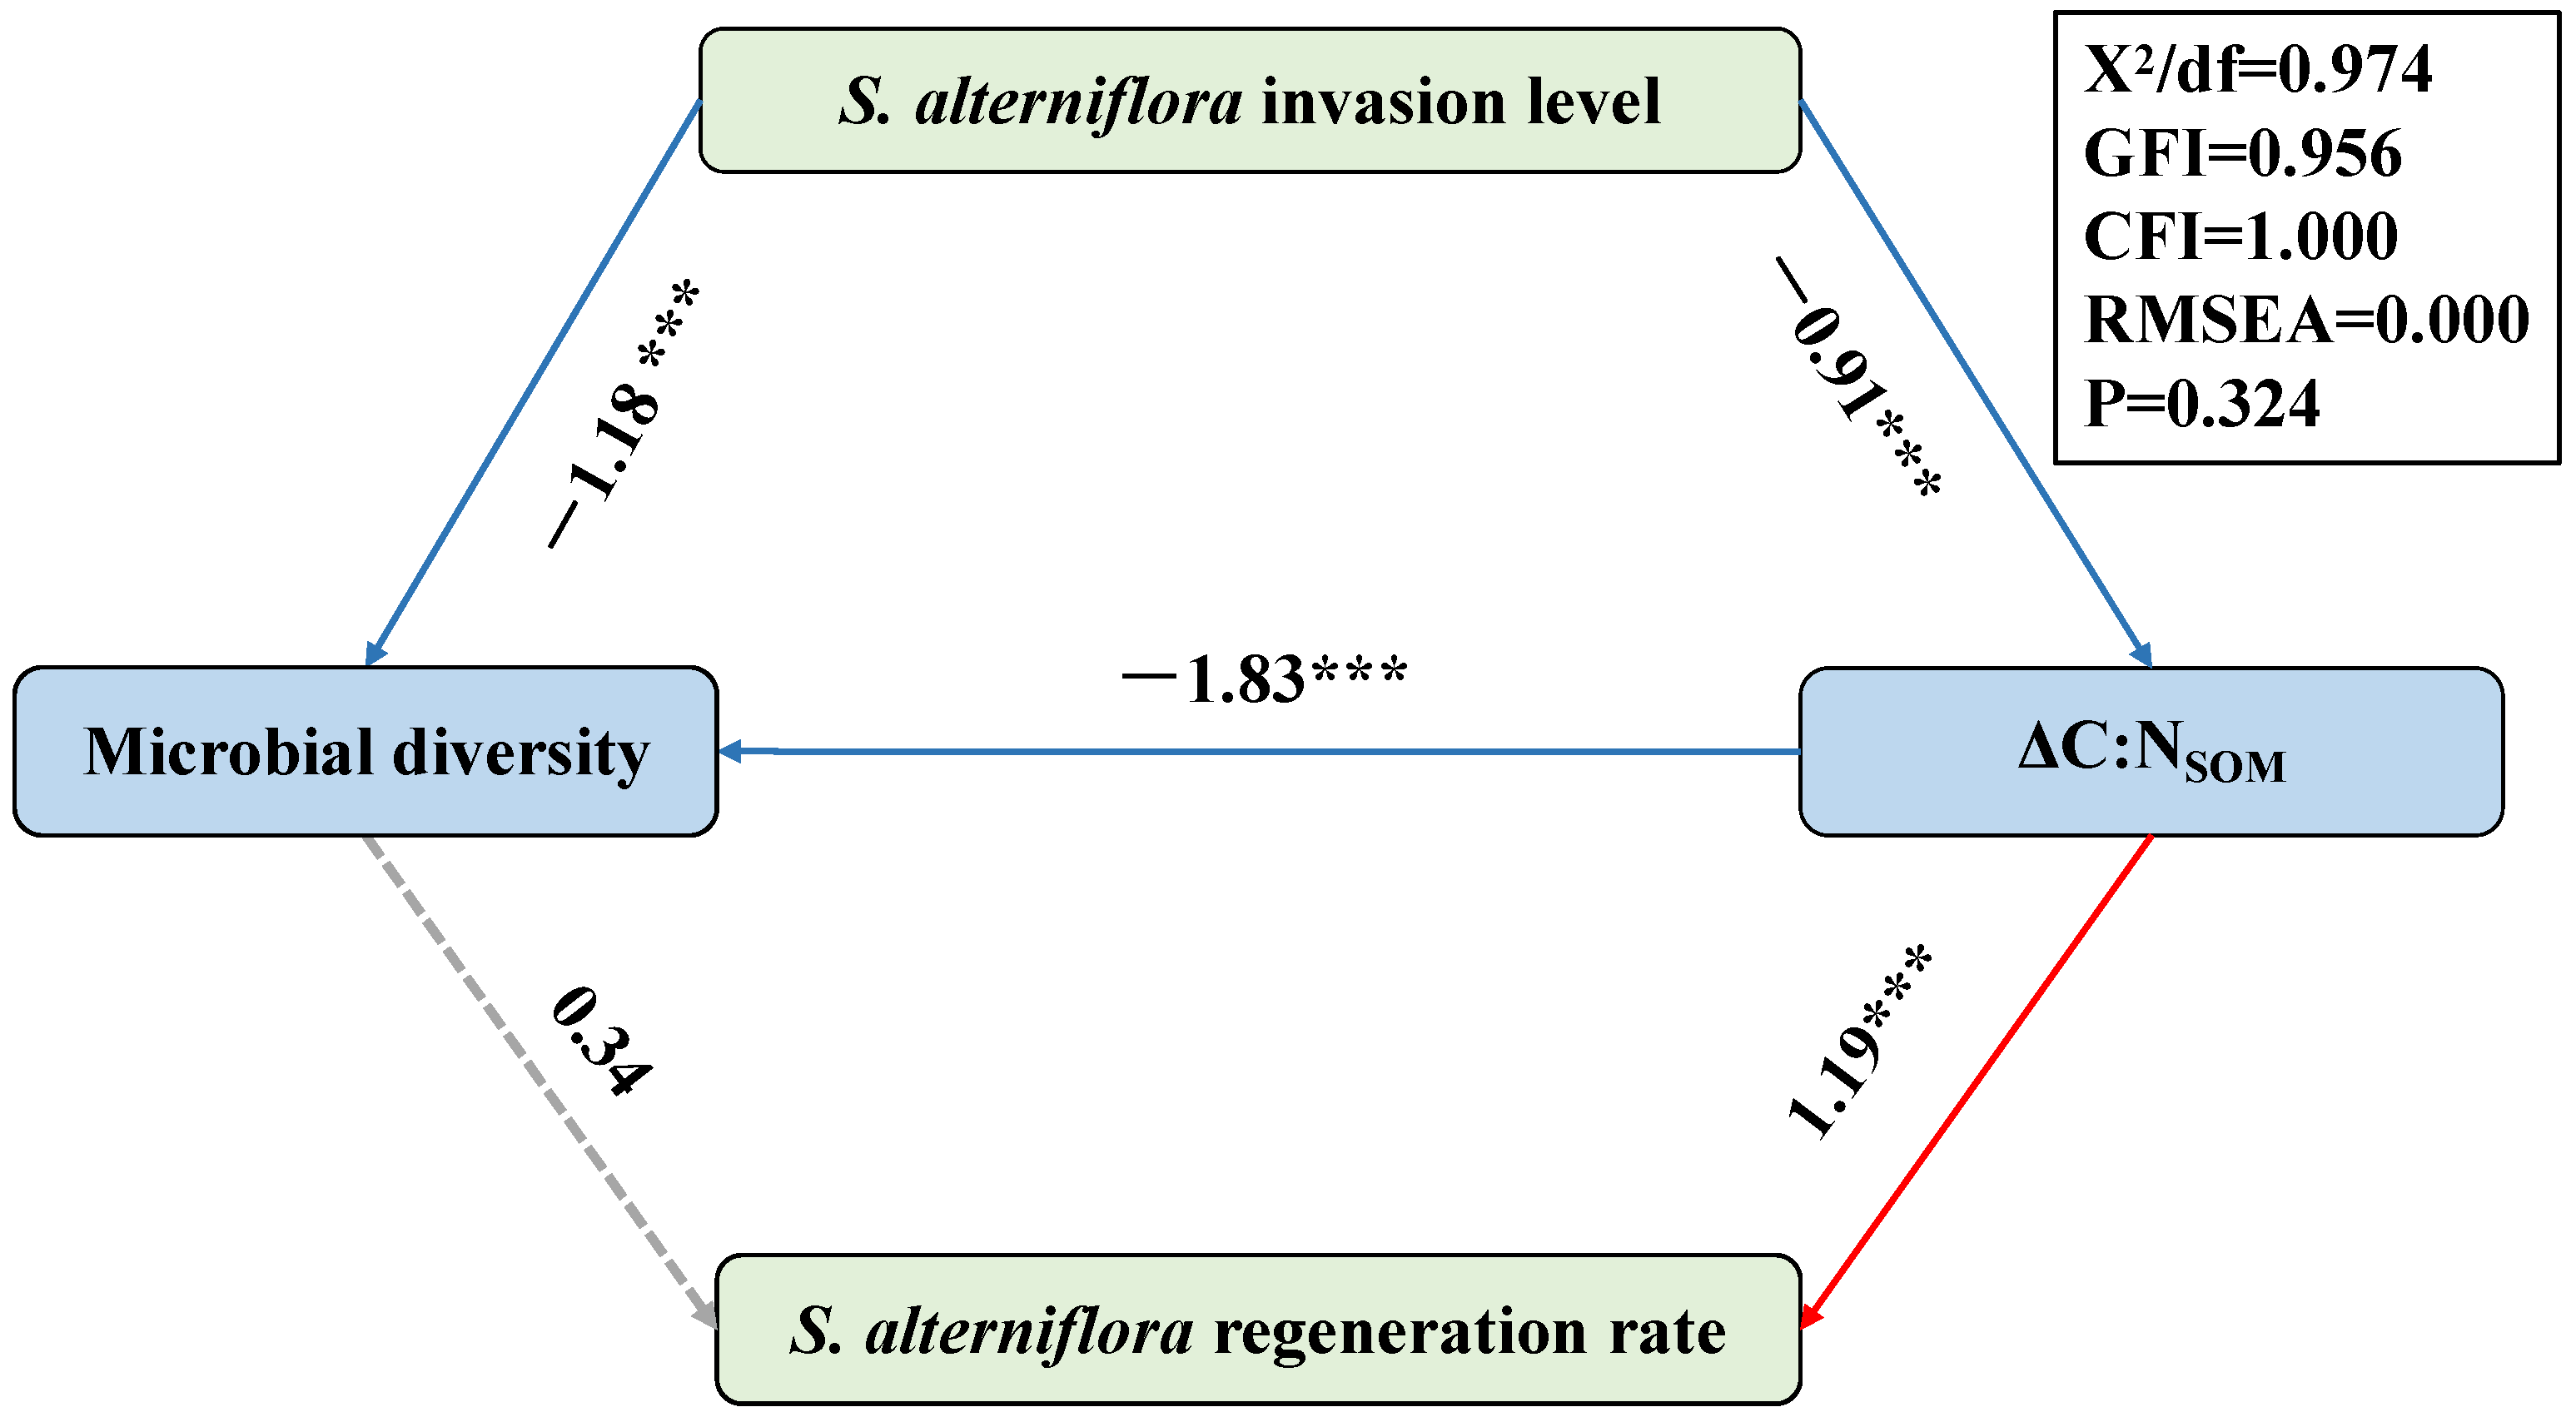
In order to reveal the causal link between the microbial diversity and the level of S. alterniflora invasion/regeneration, a structural equation model (SEM) was constructed in this study (Figure 6). In this model, the content of the organic carbon derived from S. alterniflora (TOCS. alterniflora) represented the level of S. alterniflora invasion pre-restoration, while the difference in the TOCS. alterniflora (∆TOCS. alterniflora) between the two sampling periods represented the rate of S. alterniflora regeneration. The results indicated that the level of S. alterniflora invasion pre-restoration has great effects on the variation in the total TOC (∆TOC), thus regulating the C:N ratio of the SOM (C:NSOM). As organic matter derived from mangrove plants is characterized by a higher C:NSOM and amount of tannin [11,48,53], the restoration in the QZB mangrove forest, which was conducted by replacing S. alterniflora with mangrove seedlings, caused an obvious increase in the C:NSOM and consequently decreased the bioavailability of the organic matter [7,63,64]. This may have further decreased the biodiversity of the soil microbes here (Figure 6). Though a direct correlation between the microbial diversity and ∆TOCS. alterniflora was not observed, an inverse correlation with the ∆C:NSOM was revealed by the SEM (Figure 6), indicating a potential negative correlation between the microbial diversity and ∆TOCS. alterniflora.
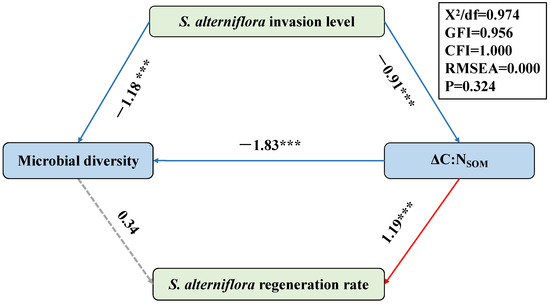
Figure 6.
The structural equation model (SEM) indicating the effects of the S. alterniflora invasion level pre-restoration, microbial diversity and variation in the C:NSOM on the regeneration rate of S. alterniflora. Path coefficients only include significant standardized prediction coefficients. Red and blue arrows indicate positive and negative relationships, respectively. Continuous arrows show significant associations (*** p < 0.001). Dotted arrows show non-significant associations.
The above results reveal a correlation between the soil microbial diversity and S. alterniflora invasion/regeneration. They also reveal a potential correlation between the initial invasion intensity and post-restoration regeneration rates of S. alterniflora in mangroves, highlighting the need for intensified monitoring in areas with severe initial invasions.
4.3. Higher Soil Microbial Co-Occurrence Enhances Mangroves’ Resistance to S. alterniflora
Apart from the community diversity, the microbial co-occurrence may also have a significant influence on the mangrove ecosystem stability. In this study, the ZJE mangrove forest exhibited a more complex and tightly connected microbial network than QZB (Figure 5a), indicating stronger species interconnectivity and functional integration. Though the networks of the two areas both displayed a clear modular construction (Mo > 0.4) [32], the modules observed in the QZB mangrove forest were small (Figure 5b). In contrast, the modules observed in the ZJE mangrove forest were obviously larger, with the top three ones accounting for >50% of the total network links (Figure 5b). Larger modules typically represent functional groups sharing similar niches [65], whereas smaller modules may act as “satellites” supporting the core functional groups [66,67]. Thus, the network in the ZJE mangrove forest suggests the higher functional diversity of soil microbes here, which may further support the health of the soil and mangrove plants [65,68].
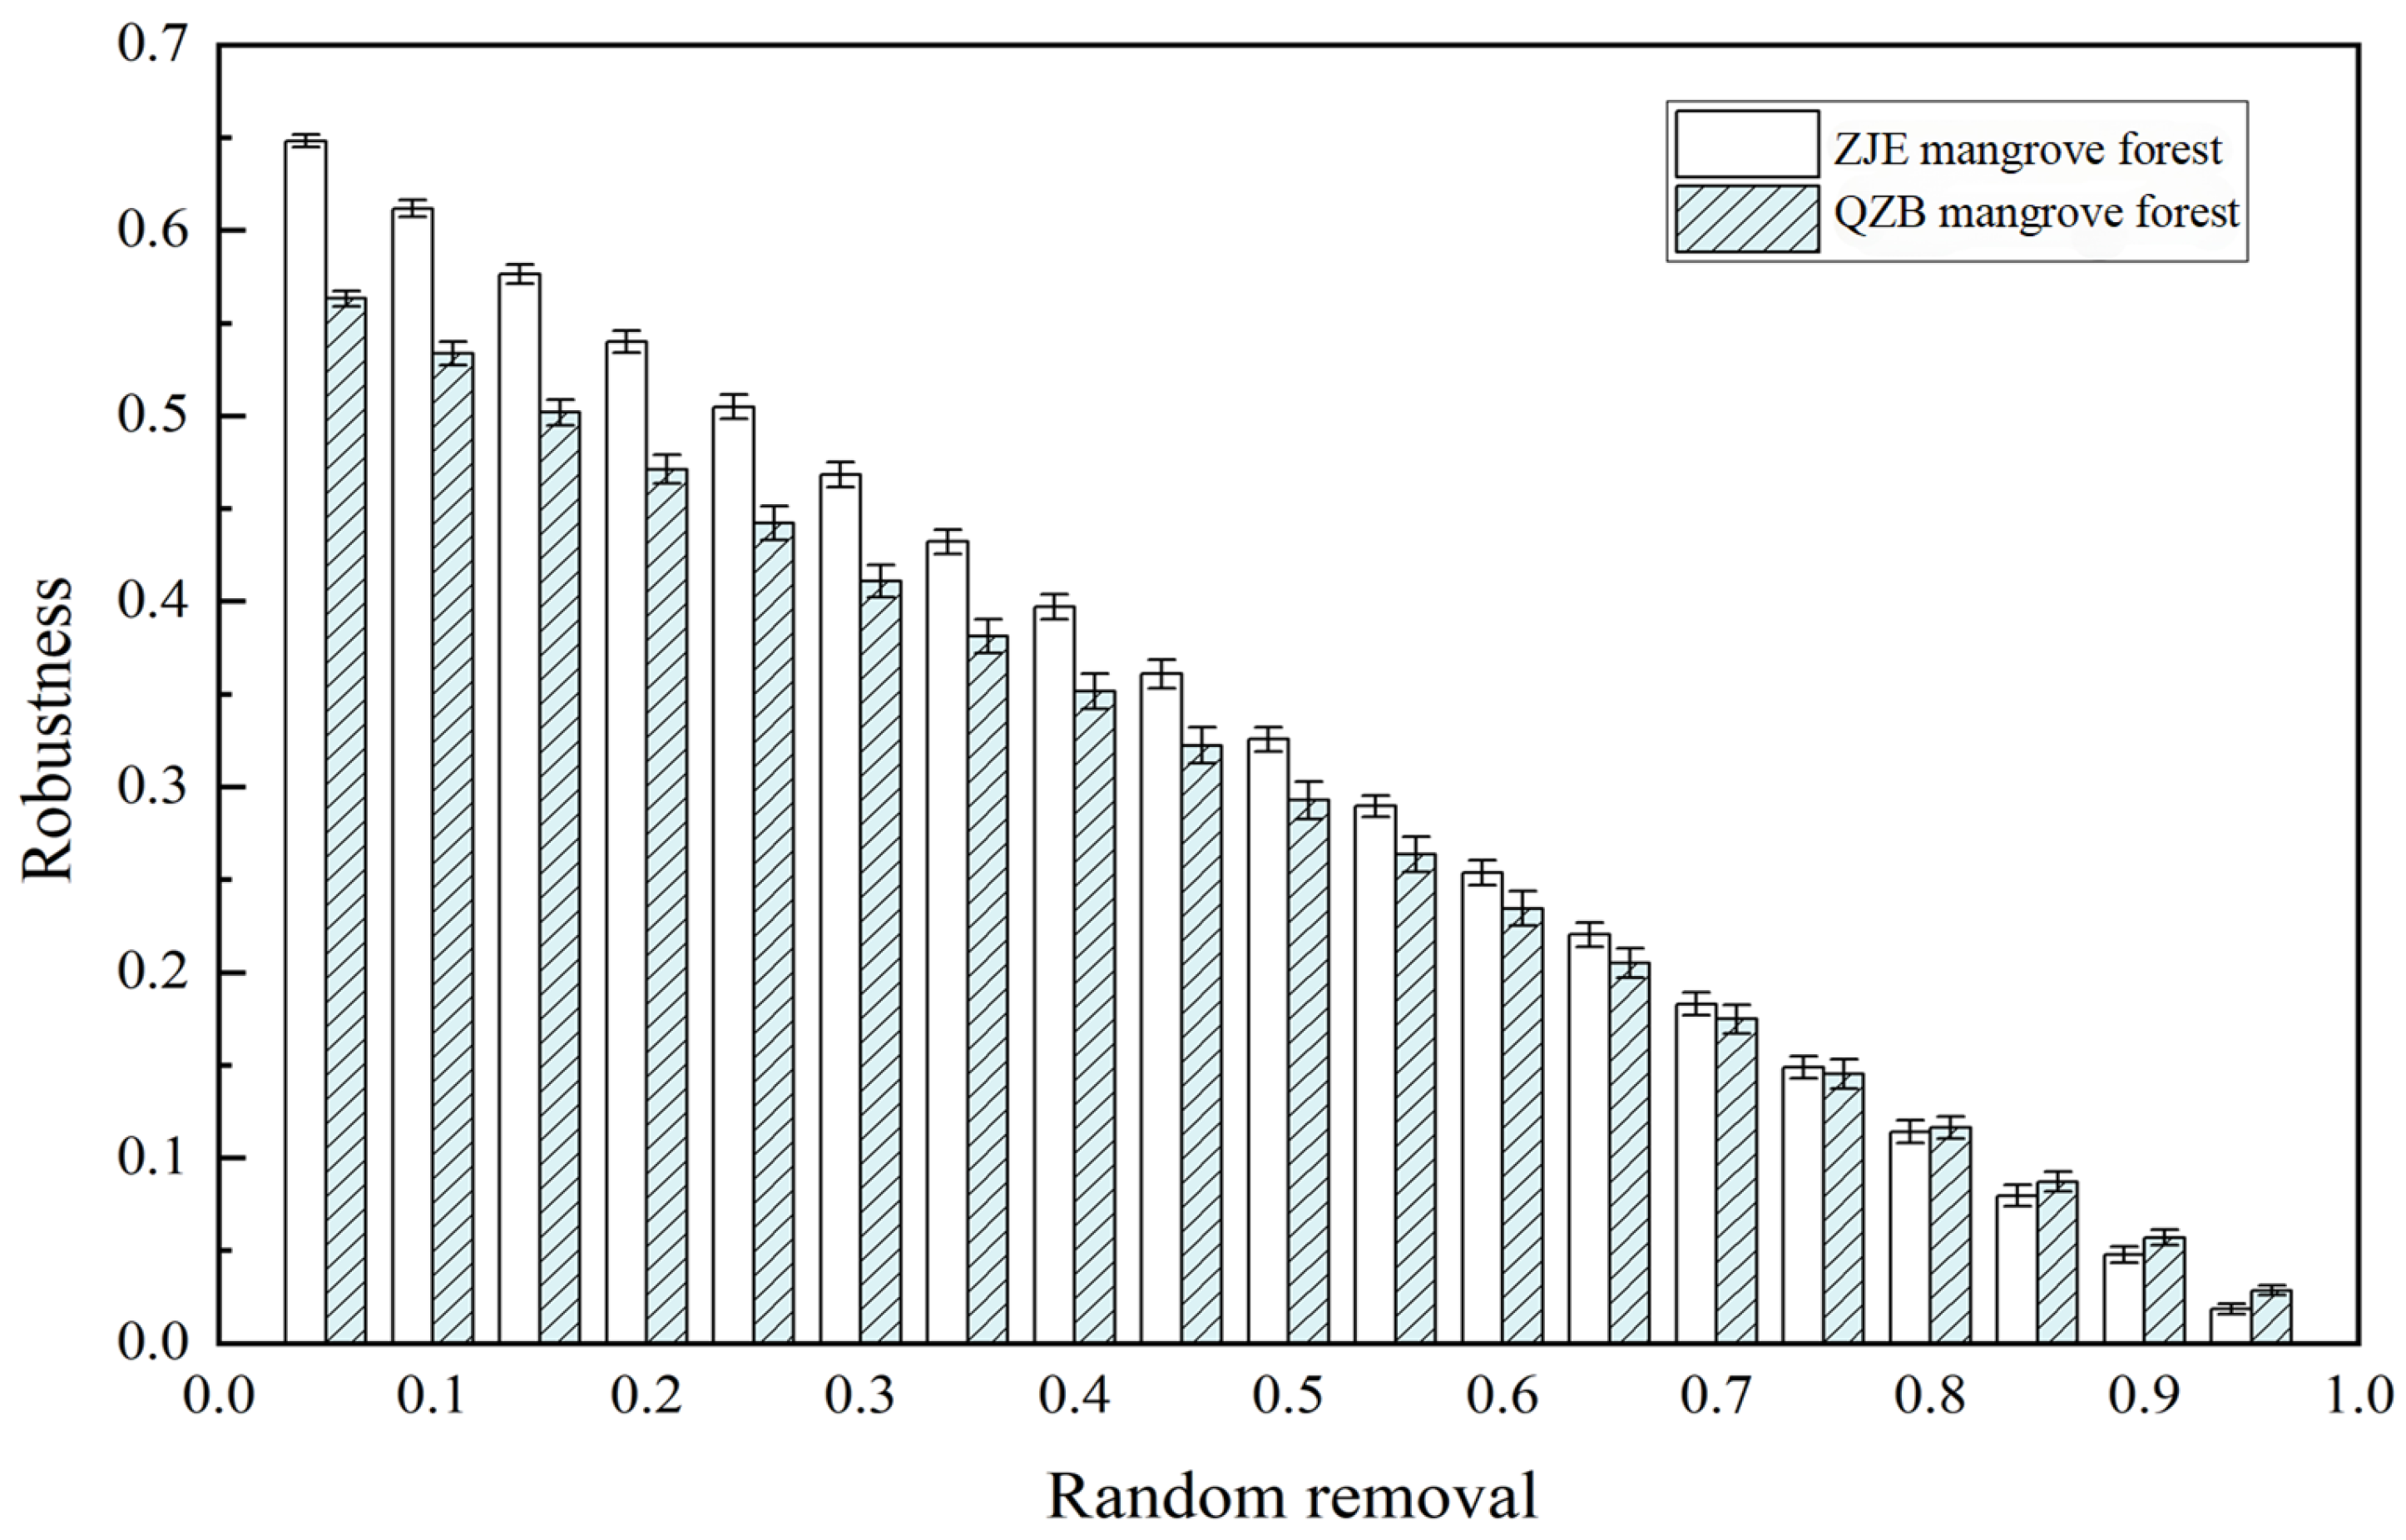
Another notable difference between the two networks was the microbial diversity in each module. The main components in each of the modules of both networks were Proteobacteria, indicating their crucial roles in supporting the function of the soil microbial communities in the study areas. In comparison, the modules in the ZJE mangrove forest contained more nodes and exhibited higher taxonomic diversity (Figure 5). This indicates the higher functional redundancy of the soil microbes here, where multiple species perform similar roles [65,69]. Therefore, species loss within a module could be compensated for by other species, implying the stronger resistance to disturbance and higher stability of the ZJE mangrove. To test this hypothesis, the robustness index (reflecting the community resistance to species loss) of the soil microbes in the two areas was calculated using R v4.3.3 [70]. Notably, the difference in the robustness between the two sites narrowed with species loss and was negligible after 70% species removal (Figure 7). These results indicate that the soil microbes in the natural ZJE mangrove forest exhibit greater resistance to species loss, thereby enhancing the functional stability [66,68]. Additionally, the inter-module connections in the ZJE network were also stronger (Figure 5), suggesting heightened functional co-occurrence here [65,68,69]. These properties collectively support and may enhance stress resistance in mangrove ecosystems [28,29,30].
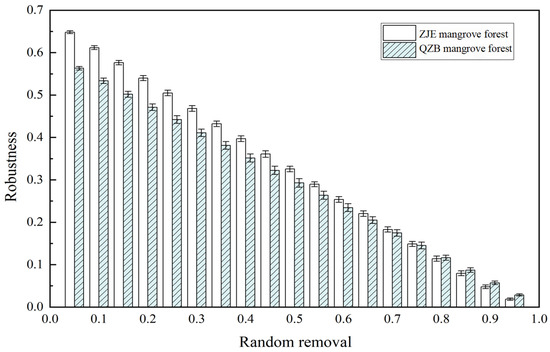
Figure 7.
The robustness indices in the Zhangjiang Estuary (ZJE) mangrove forest and Quanzhou Bay (QZB) mangrove forest (with the X-axis representing the percentage of species lost).
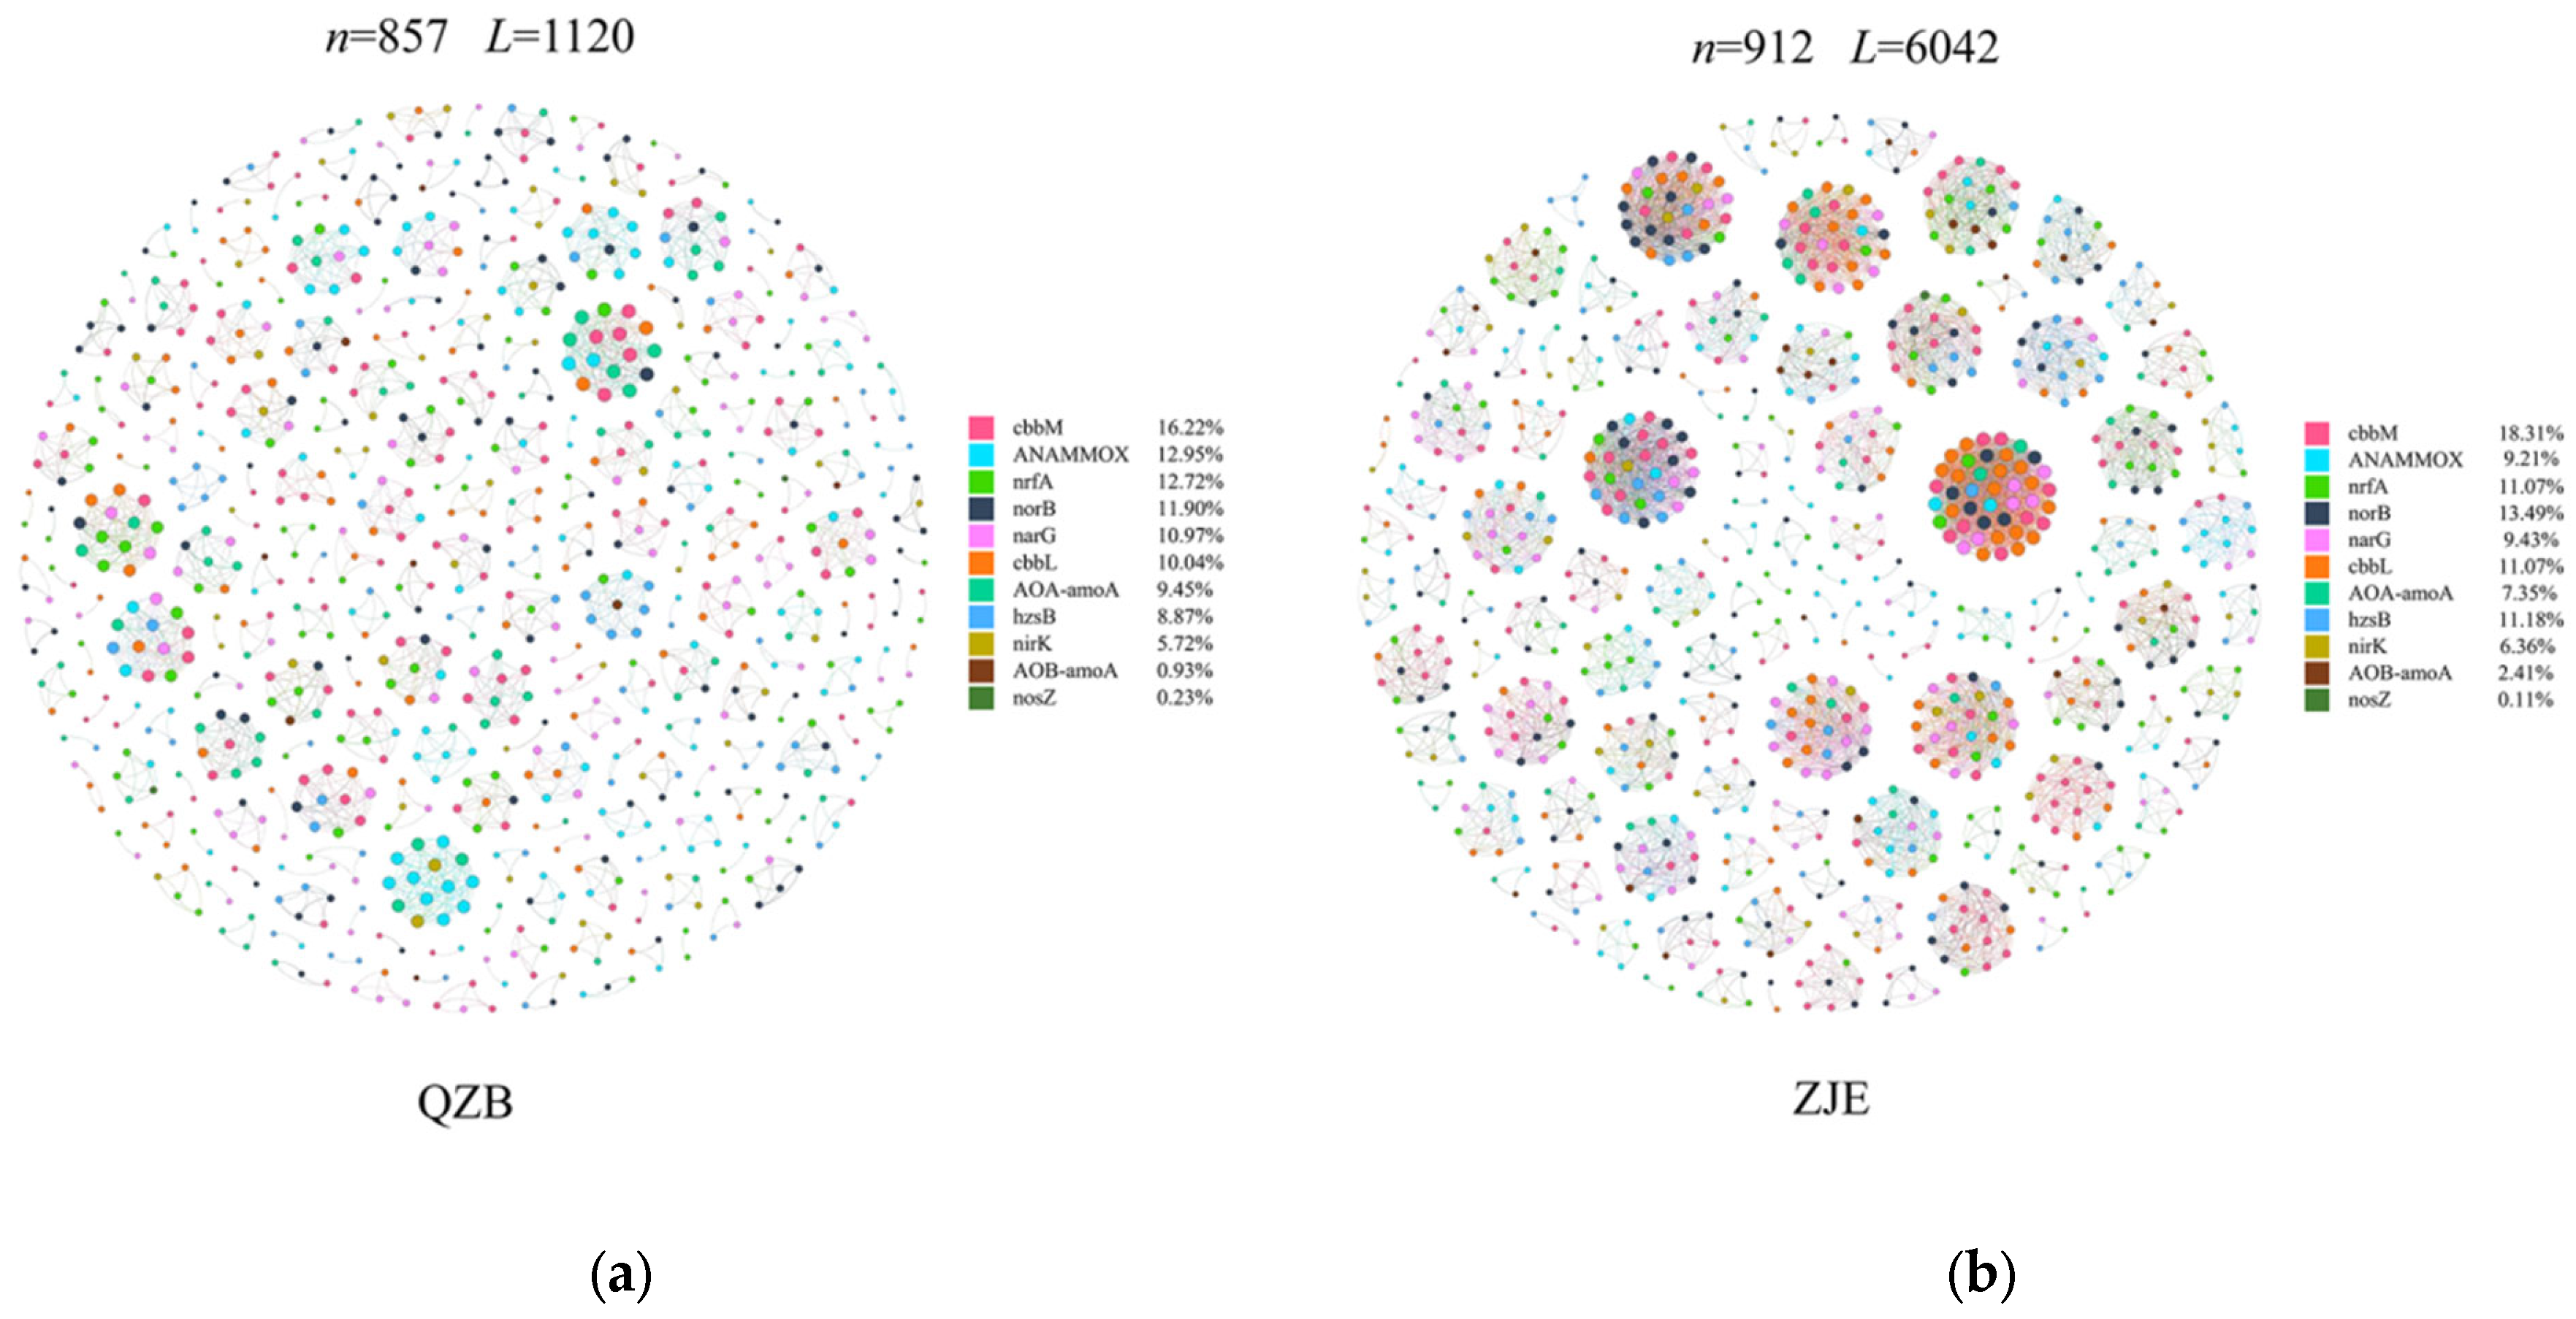
To further explore the functional co-occurrence of soil microbes in the study area, amplicon sequencing of key functional genes involved in carbon and nitrogen cycling was performed. Co-occurrence networks of OTUs associated with these genes were constructed. Although the node numbers were similar between the sites, the ZJE mangrove network exhibited approximately three times more edges than the QZB mangrove network (Table 3), indicating stronger functional co-occurrence in carbon and nitrogen cycling. Given the significant anthropogenic N inputs in the two areas [7,37], functional genes related to N removal were prioritized for analysis. The ZJE network revealed higher co-occurrence of norB/narB (nitrite/nitrous oxide reductase genes critical for nitrogen removal) and cbbM/cbbL (RuBisCO genes encoding microbial carbon fixation) (Figure 8) [71,72]. Compared with plant-derived carbon, the carbon fixed by microorganisms can be directly assimilated by the microorganisms and thus is characterized by higher bioavailability [73]. Hence, the co-occurrence of norB/narB and cbbM/cbbL suggested that the heterotrophic N removal in the ZJE mangroves may be energetically supported by the carbon fixed by microbes in soil. Excessive nitrogen may impair the health of plants by (1) causing a nutrient imbalance within plants, thus increasing their susceptibility to infection by fungal pathogens [72,74], (2) reducing the root/shoot ratio of plants, thus decreasing their absorption rates for nutrients and water [75,76,77], or (3) increasing the soil nutrient homogeneity, thus intensifying the competition among species for the same limiting resources and thereby diminishing the species diversity [78]. Additionally, the addition of N may also promote the assimilation of heavy metals by plants [77], thereby causing toxicity to mangrove plants. Consequently, the higher co-occurrence of microbial N removal and carbon fixation may produce relatively stable nutrient conditions for the ZJE mangrove forest, thus supporting its stability and raising its resistance against S. alterniflora invasion or regeneration.

Table 3.
The topological parameters of functional networks in the study areas.
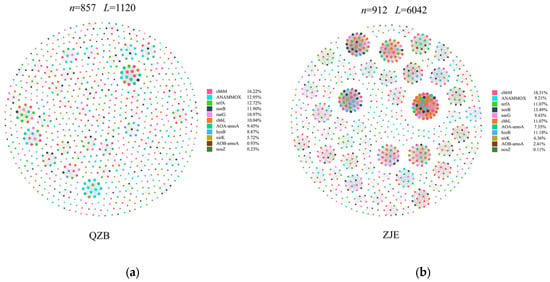
Figure 8.
Modular constructions of the key functional gene networks in the soil: (a) Quanzhou Bay mangrove forest (QZB), (b) the Zhangjiang Estuary mangrove forest (ZJE).
Generally, our results revealed the higher co-occurrence of soil microbes in the natural ZJE mangrove forest, which may have been correlated with the mangroves’ resistance to external disturbance and biological invasion. Any known research in this area is scarce, resulting in a lack of reference data and preventing a comparison of such data with those obtained in our study. Furthermore, the influence of seasonal variation and the effects of the mangrove species on the community composition and co-occurrence of benthic microbes should be considered. Nevertheless, given the global significance of mangrove ecosystems, this study serves as the first step toward further advancements.
5. Conclusions
In summary, this study revealed the causal relationship between the soil microbial diversity and the invasion/regeneration of S. alterniflora in mangroves. The key findings are as follows: (1) the application of carbon stable isotope analyses enables the detection of the presence of S. alterniflora in mangrove soils; (2) the removal of S. alterniflora may affect the diversity of soil microbial communities (presumably by regulating the composition of the organic matter), thereby influencing subsequent S. alterniflora regeneration; (3) the soil microbes in natural ZJE mangroves exhibited higher functional redundancy and co-occurrence patterns. We propose that the enhanced resistance of the ZJE mangrove ecosystem to S. alterniflora invasion/regeneration may be associated with a stable community composition of symbiotic microbes, as evidenced by the aforementioned co-occurrence patterns.
Supplementary Materials
The following supporting information can be downloaded at https://www.mdpi.com/article/10.3390/f16091378/s1: Table S1: The contents, δ13C and C:N ratio of the SOM in the water overlying the ZJE mangrove soils; Table S2: The contents and isotopic characteristics of the SOM in the QZB mangrove forest before and after the removal of S. alterniflora; Figure S1: Composition of benthic microbial community in Quanzhou Bay mangrove forest: (a) microbial composition at phylum level, (b) results of cluster analysis [7]; Figure S2: The α diversity indices of benthic microbes in the two sampling areas. The solid lines represent the median, and the dotted lines represent the averaged values.
Author Contributions
Conceptualization, S.H. and D.L.; data curation, G.L. and D.L.; funding acquisition, D.L.; investigation, S.H., L.Z., D.H., X.C., Z.L. and D.L.; methodology, S.H.; software, G.L. and S.H.; writing—original draft, S.H.; writing—review and editing, D.L. All authors have read and agreed to the published version of the manuscript.
Funding
This work was supported by the National Natural Science Foundation of China (42306053), the Natural Science Foundation of Fujian Province, China (2021J05156), and the Open Fund of the Key Laboratory of Global Change and Marine-Atmospheric Chemistry (GCMAC2310).
Data Availability Statement
The main data used in this study are provided in the Supplementary Materials.
Acknowledgments
We are grateful to the project team members for providing assistance with sampling. Thanks are also given to the Zhangjiang Estuary Wetland Ecosystem Field Research Base of Xiamen University for their help with sampling and sharing background information.
Conflicts of Interest
The authors declare no conflicts of interest.
Abbreviations
The following abbreviations are used in this manuscript:
| SOM | Soil organic matter |
| S. alterniflora | Spartina alterniflora |
| ZJE | Zhangjiang Estuary |
| QZB | Quanzhou Bay |
References
- Alongi, D.M. Carbon cycling and storage in mangrove forests. Annu. Rev. Mar. Sci. 2014, 6, 195–219. [Google Scholar] [CrossRef]
- Pendleton, L.; Donato, D.; Murray, B.; Baldera, A. Estimating global ‘‘blue carbon’’ emissions from conversion and degradation of vegetated coastal ecosystems. PLoS ONE 2012, 7, 43542. [Google Scholar] [CrossRef]
- Sasmito, S.D.; Taillardat, P.; Clendenning, J.N.; Cameron, C.; Friess, D.A.; Murdiyarso, D.; Hutley, B. Effect of land-use and land-cover change on mangrove blue carbon: A systematic review. Glob. Change Biol. 2019, 25, 4291–4302. [Google Scholar] [CrossRef]
- Goldberg, L.; Lagomasino, D.; Thomas, N.; Fatoyinbo, T. Global declines in human-driven mangrove loss. Glob. Change Biol. 2020, 26, 5844–5855. [Google Scholar] [CrossRef]
- Friess, D.A.; Rogers, K.; Lovelock, C.E.; Krauss, K.W.; Shi, S. The state of the world’s mangrove forests: Past, present, and future. Annu. Rev. Environ. Resour. 2019, 44, 89–115. [Google Scholar] [CrossRef]
- Wang, L.; Jia, M.; Yin, D.; Tian, J. A review of remote sensing for mangrove forests: 1956–2018. Remote Sens. Environ. 2019, 231, 111223. [Google Scholar] [CrossRef]
- Chu, T.; Li, D.; Shih, Y.-J.; Guo, Y.; Liu, K.; Ji, F.; Li, J.; Yin, Y.; Chen, R. 2Coupling use of stable isotopes and functional genes as indicators for the impacts of artificial restoration on the carbon storage of a coastal wetland invaded by Spartina alterniflora, southeastern China. Front. Mar. Sci. 2024, 11, 1364412. [Google Scholar] [CrossRef]
- Lin, K.; Zhang, Q.; Jian, S.; Wang, R.; Shen, W.; Chen, H.; Ren, H.; Xu, F. Mangrove resource and sustainable development at Zhanjiang. Ecol. Sci. 2006, 23, 23–29. [Google Scholar] [CrossRef]
- Zhang, J.; She, Z.; Lin, J.; Chen, G. 2A study on growth of artificial mangrove forest and plant diseases and insect pests. Ecol. Sci. 2006, 25, 367–370, (In Chinese with English abstract). [Google Scholar] [CrossRef]
- Cui, L.; Berger, U.; Cao, M.; Zhang, Y.; He, J.; Pan, L.; Jiang, J. Conservation and restoration of mangroves in response to invasion of Spartina alterniflora based on the MaxEnt Model: A case study in China. Forests 2023, 14, 1220. [Google Scholar] [CrossRef]
- Feng, J.; Huang, Q.; Qi, F.; Guo, J.; Lin, G. Utilization of exotic Spartina alterniflora by fish community in the mangrove ecosystem of Zhangjiang Estuary: Evidence from stable isotope analyses. Biol. Invasions 2015, 17, 2113–2121. [Google Scholar] [CrossRef]
- Zheng, X.; Javed, Z.; Liu, B.; Zhong, S.; Cheng, Z.; Rehman, A.; Du, D.; Li, J. Impact of Spartina alterniflora invasion in coastal wetlands of China: Boon or bane? Biology 2023, 12, 1057. [Google Scholar] [CrossRef] [PubMed]
- Liu, J.; Wang, W.; Shen, L.; Yang, Y.; Xu, J.; Tian, M.; Liu, X.; Yang, W.; Jin, J.; Wu, H. Response of methanotrophic activity and community structure to plant invasion in China’s coastal wetlands. Geoderma 2021, 407, 115569. [Google Scholar] [CrossRef]
- Qi, X.; Chmura, G. Invasive Spartina alterniflora marshes in China: A blue carbon sink at the expense of other ecosystem services. Front. Ecol. Environ. 2023, 21, 182–190. [Google Scholar] [CrossRef]
- Feng, J.; Zhou, J.; Wang, L.; Cui, X.; Ning, C.; Wu, H.; Zhu, X.; Lin, G. Effects of short-term invasion of Spartina alterniflora and the subsequent restoration of native mangroves on the soil organic carbon, nitrogen and phosphorus stock. Chemosphere 2017, 184, 774–783. [Google Scholar] [CrossRef]
- Cohen, W.B.; Goward, S.N. Landsat’s role in ecological applications of remote sensing. Bioscience 2004, 54, 535–545. [Google Scholar] [CrossRef]
- Gavier-Pizarro, G.I.; Kuemmerle, T.; Hoyos, L.E.; Stewart, S.I.; Huebner, C.D.; Keuler, N.S.; Radeloff, V.C. Monitoring the invasion of an exotic tree (Ligustrum lucidum) from 1983 to 2006 with Landsat TM/ETM+ satellite data and Support Vector Machines in Córdoba, Argentina. Remote Sens. Environ. 2012, 122, 134–145. [Google Scholar] [CrossRef]
- Huang, H.; Zhang, L. A study of the population dynamics of Spartina alterniflora at Jiuduansha shoals, Shanghai, China. Ecol. Eng. 2007, 29, 164–172. [Google Scholar] [CrossRef]
- Wang, A.; Chen, J.; Jing, C.; Ye, G.; Wu, J. Monitoring the invasion of Spartina alterniflora from 1993 to 2014 with Landsat TM and SPOT 6 Satellite Data in Yueqing Bay, China. PLoS ONE 2015, 10, e0135538. [Google Scholar] [CrossRef]
- Phillips, D.L.; Gregg, J.W. Source partitioning using stable isotopes: Coping with too many sources. Oecologia 2003, 136, 261–269. [Google Scholar] [CrossRef]
- Philp, P. The emergence of stable isotopes in environmental and forensic geochemistry studies. Environ. Chem. Lett. 2007, 5, 57–66. [Google Scholar] [CrossRef]
- Xia, S.; Song, Z.; Li, Q.; Guo, L.; Yu, C.; Singh, B.P.; Fu, X.; Chen, C.; Wang, Y.; Wang, H. Distribution, sources, and decomposition of soil organic matter along a salinity gradient in estuarine wetlands characterized by C:N ratio, δ13C-δ15N and lignin biomarker. Glob. Change Biol. 2021, 27, 417–434. [Google Scholar] [CrossRef]
- Wang, A.; Chen, J.; Li, D. Impact of Spartina alterniflora on sedimentary environment of coastal wetlands of the Quanzhou Bay. Ocean. Eng. 2008, 26, 60–69. [Google Scholar] [CrossRef]
- Yang, J.; Gao, J.; Liu, B.; Wei, Z. Sediment deposits and organic carbon sequestration along mangrove coasts of the Leizhou Peninsula, southern China. Estuar. Coast. Shelf Sci. 2014, 136, 3–10. [Google Scholar] [CrossRef]
- Yin, M.; Feng, J.; Huang, X.; Cai, Z.; Lin, G.; Zhou, J. Soil microbial community structure in natural and transplanted mangrove (Kandelia obovata) forests. Acta Ecol. Sin. 2017, 36, 1–10. [Google Scholar] [CrossRef]
- Bhaduri, D.; Pal, S.; Purakayastha, T.J.; Chakraborty, K.; Akhtar, M.S. Soil quality and plant-microbe interactions in the Rhizosphere. In Sustainable Agriculture Reviews; Lichtfouse, E., Ed.; Springer International Publishing: Cham, Switzerland, 2015; Volume 17, pp. 307–335. [Google Scholar] [CrossRef]
- Lynn, T.; Ge, T.; Yuan, H.; Wei, X.; Wu, X.; Xiao, K.; Kumaresan, D.; Yu, S.; Wu, J.; Whiteley, A.S. Soil carbon-fixation rates and associated bacterial diversity and abundance in three natural ecosystems. Microb. Ecol. 2017, 73, 645–657. [Google Scholar] [CrossRef] [PubMed]
- Sathya, A.; Vijayabharathi, R.; Gopalakrishnan, S. Soil Microbes: The invisible managers of soil fertility. In Microbial Inoculants in Sustainable; Singh, D., Singh, H., Prabha, R., Eds.; Springer: New Delhi, India, 2016; Volume 2, pp. 1–16. [Google Scholar] [CrossRef]
- Verma, K.K.; Song, X.; Li, D.; Singh, M.; Rajput, V.D.; Malviya, M.K.; Minkina, T.; Singh, R.K.; Singh, P.; Li, Y. Interactive role of silicon and plantrhizobacteria mitigating abiotic stresses: A new approach for sustainable agriculture and climate change. Plants 2020, 9, 1055. [Google Scholar] [CrossRef]
- Kumar, P.S.; Rangasamy, G.; Gayathri, K.V.; Parthasarathy, V. Rhizobium mayense sp. Nov., an efficient plant growth-promoting nitrogen-fixing bacteria isolated from rhizosphere soil. Environ. Res. 2023, 220, 115200. [Google Scholar] [CrossRef]
- Montoya, J.; Pimm, S.; Solé, R. Ecological networks and their fragility. Nature 2006, 442, 259–264. [Google Scholar] [CrossRef]
- Newman, M. Modularity and community structure in networks. Proc. Natl. Acad. Sci. USA 2006, 103, 8577. [Google Scholar] [CrossRef]
- Berry, D.; Widder, S. Deciphering microbial interactions and detecting keystone species with co-occurrence networks. Front. Microbiol. 2014, 5, 219. [Google Scholar] [CrossRef]
- Pržulj, N.; Malod-Dognin, N. Network analytics in the age of big data. Science 2016, 353, 123–124. [Google Scholar] [CrossRef] [PubMed]
- Landi, P.; Minoarivelo, H.; Brännström, Å.; Hui, C.; Dieckmann, U. Complexity and stability of ecological networks: A review of the theory. Popul. Ecol. 2018, 60, 319–345. [Google Scholar] [CrossRef]
- Okuyama, T.; Holland, J. Network structural properties mediate the stability of mutualistic communities. Ecol. Lett. 2008, 11, 208–216. [Google Scholar] [CrossRef] [PubMed]
- Wu, H.; Peng, R.; Yang, Y.; He, L.; Wang, W.; Zheng, T.; Lin, G. Mariculture pond influence on mangrove areas in South China: Ignificantly larger nitrogen and phosphorus loadings from sediment wash-out than from tidal water exchange. Aquaculture 2014, 426–427, 204–212. [Google Scholar] [CrossRef]
- Li, D.; Yan, J.; Lu, Z.; Chu, T.; Li, J.; Chu, T.-J. Use of δ13C and δ15N as indicators to evaluate the influence of sewage on organic natter in the Zhangjiang mangrove–estuary ecosystem, southeastern China. Water 2023, 15, 3660. [Google Scholar] [CrossRef]
- Wang, F.; Xiao, K.; Santos, I.R.; Lu, Z.; Tamborski, J.; Wang, Y.; Yan, R.; Chen, N. Porewater exchange drives nutrient cycling and export in a mangrove-salt marsh ecotone. J. Hydrol. 2022, 606, 127401. [Google Scholar] [CrossRef]
- Moore, J.; Semmens, B.; Semmens, B.X. Incorporating uncertainty and prior information into stable isotope mixing models. Ecol. Lett. 2022, 11, 470–480. [Google Scholar] [CrossRef]
- Parnell, A.C.; Inger, R.; Bearhop, S.; Jackson, A.L. Source partitioning using stable isotopes: Coping with too much variation. PLoS ONE 2010, 5, e9672. [Google Scholar] [CrossRef]
- Xue, B.; Yan, C.; Lu, H.; Bai, Y. Mangrove-derived organic carbon in sediment from Zhangjiang Estuary (China) Mangrove wetland. J. Coastal. Res. 2009, 25, 949–956. [Google Scholar] [CrossRef]
- Fan, Y.; Pan, Y.; Chen, Z.; Lin, H.; Xu, R.; Wu, C.; Hong, T. C:N:P stoichiometry in roots, stems, and leaves of four mangrove species. Chin. J. Ecol. 2019, 38, 1041. [Google Scholar] [CrossRef]
- Huang, J.; Lin, G.; Han, X. Comparative study on water use efficiency of mangrove plants in different habitats. Chin. J. Plant Ecol. 2005, 29, 530–536, (In Chinese with English Abstract). [Google Scholar] [CrossRef]
- Wang, G.; Guan, D.; Peart, M.R.; Chen, Y.; Peng, Y. Ecosystem carbon stocks of mangrove forest in Yingluo Bay, Guangdong Province of South China. Forest Ecol. Manag. 2013, 310, 539–546. [Google Scholar] [CrossRef]
- Cheng, X.; Chen, J.; Luo, Y.; Henderson, R.; An, S.; Zhang, Q.; Chen, J.; Li, B. Assessing the effects of short-term Spartina alterniflora invasion on labile and recalcitrant C and N pools by means of soil fractionation and stable C and N isotopes. Geoderma 2008, 145, 177–184. [Google Scholar] [CrossRef]
- Murukesh, N.; Chandramohanakumar, N. Nutrients and isotopic composition in Rhizophoraceae mangroves of Kochi, South west coast of India. J. Plant. Res. 2021, 37, 331–344. [Google Scholar] [CrossRef]
- Gao, Y. Studies on Dstribution Patterns of and Controlling Factors for Soil Carbon Pools of Selected Mangrove Wetlands in China. Ph.D. Thesis, Tsinghua University, Beijing, China, 2019. (In Chinese with English Abstract). [Google Scholar]
- Choy, E.J.; Richard, P.; Kim, K.; Kang, C. Quantifying the trophic base for benthic secondary production in the Nakdong River estuary of Korea using stable C and N isotopes. J. Exp. Mar. Biol. Ecol. 2009, 382, 18–26. [Google Scholar] [CrossRef]
- Gao, J.; Yu, K.; Xu, S.; Huang, X.; Chen, B.; Wang, Y. Content and source analysis of organic carbon in the outer slope sediments of the Yongle Atoll, Xisha Islands. J. Trop. Oceanogr. 2024, 43, 131–145, (In Chinese with English Abstract). [Google Scholar] [CrossRef]
- Quan, W. Food Wed Analysis of Salt Marshes of the Yangtze River Estuary by Using Stable Isotopes. Ph.D. Thesis, Fudan University, Shanghai, China, 2007. (In Chinese with English Abstract). [Google Scholar]
- Yokoyama, H.; Sakami, T.; Ishihi, Y. Food sources of benthic animals on intertidal and subtidal bottoms in inner Ariake Sound, southern Japan, determined by stable isotopes. Estuar. Coast. Shelf Sci. 2009, 82, 243–253. [Google Scholar] [CrossRef]
- Wu, G. Organic Carbon Sources and Microbial Carbon Assimilation in Mangrove Ecosystems. Ph.D. Thesis, Xiamen University, Fujian, China, 2018. (In Chinese with English Abstract). [Google Scholar]
- Kang, C.; Kim, J.; Lee, K.; Kim, J.B.; Lee, P.; Hong, J. Trophic importance of benthic microalgae to macrozoobenthos in coastal bay systems in Korea: Dual stable C and N isotope analyses. Mar. Ecol. Prog. Ser. 2003, 259, 79–92. [Google Scholar] [CrossRef]
- Wang, K.; Zhu, K.; Guo, Y.; Xu, J. Reconstruction of consumer dietary sources based on stable isotopes. Acta Hydrobiol. Sin. 2022, 46, 767–777. [Google Scholar] [CrossRef]
- Castañeda-Moya, E.; Twilley, R.R.; Rivera-Monroy, V.H. Allocation of biomass and net primary productivity of mangrove forests along environmental gradients in the Florida Coastal Everglades, USA. Forest. Ecol. Manag. 2013, 307, 226–241. [Google Scholar] [CrossRef]
- Hemminga, M.; Huiskes, A.; Steegstra, M.; Soelen, J.V. Assessment of carbon allocation and biomass production in a natural stand of the salt marsh plant Spartina anglica using 13C. Mar. Ecol. Prog. Ser. 1996, 130, 169–178. [Google Scholar] [CrossRef]
- Faith, D. Conservation Evaluation and Phylogenetic Diversity. Biol. Conserv. 1992, 61, 1–10. [Google Scholar] [CrossRef]
- Feng, J.; Guo, J.; Huang, Q.; Jiang, J.; Huang, G.; Yang, Z.; Lin, G. Changes in the community structure and diet of benthic macrofauna in invasive Spartina alterniflora wetlands following restoration with native mangroves. Wetlands 2014, 34, 673–683. [Google Scholar] [CrossRef]
- Nguyen, L.T.; Osanai, Y.; Lai, K.; Anderson, I.C.; Bange, M.P.; Tissue, D.T.; Singh, B.K. Responses of the soil microbial community to nitrogen fertilizer regimes and historical exposure to extreme weather events: Flooding or prolonged-drought. Soil Biol. Biochem. 2018, 118, 227–236. [Google Scholar] [CrossRef]
- Rath, K.M.; Fierer, N.; Murphy, D.V.; Rousk, J. Linking bacterial community composition to soil salinity along environmental gradients. ISME J. 2019, 13, 836–846. [Google Scholar] [CrossRef]
- Yang, W.; Cai, A.; Wang, J.; Luo, Y.; Cheng, X.; An, S. Exotic Spartina alterniflora Loisel. invasion significantly shifts soil bacterial communities with the successional gradient of saltmarsh in eastern China. Plant Soil 2020, 449, 97–115. [Google Scholar] [CrossRef]
- Dauwe, B.; Middelburg, J. Amino acids and hexosamines as indicators of organic matter degradation state in North Sea sediments. Limnol. Oceanogr. 1998, 43, 782–798. [Google Scholar] [CrossRef]
- Jílková, V.; Straková, P.; Frouz, J. Foliage C:N ratio, stage of organic matter decomposition and interaction with soil affect microbial respiration and its response to C and N addition more than C:N changes during decomposition. Appl. Soil. Ecol. 2020, 152, 103568. [Google Scholar] [CrossRef]
- Ma, B.; Wang, H.; Dsouza, M.; Lou, J.; He, Y.; Dai, Z.; Brookes, P.C.; Xu, J.; Gilbert, J.A. Geographic patterns of co-occurrence network topological features for soil microbiota at continental scale in eastern China. ISME J. 2016, 10, 1891–1901. [Google Scholar] [CrossRef]
- Hanski, I. Dynamics of regional distribution: The core and satellite species hypothesis. Oikos 1982, 38, 210–221. [Google Scholar] [CrossRef]
- Gast, C.J.V.D.; Walker, A.W.; Stressmann, F.A.; Rogers, G.B.; Scott, P.; Daniels, T.W.; Carroll, M.P.; Parkhill, J.; Bruce, K.D. Partitioning core and satellite taxa from within cystic fibrosis lung bacterial communities. ISME J. 2011, 5, 780–791. [Google Scholar] [CrossRef]
- Liu, G.; Verdegem, M.; Ye, Z.; Liu, Y.; Zhao, J.; Zhu, S. Co-occurrence patterns in biofloc microbial communities revealed by network analysis and their impact on the host. Aquaculture 2023, 577, 739964. [Google Scholar] [CrossRef]
- Liu, C.; Cui, Y.; Li, X.; Yao, M. Microeco: An R package for data mining in microbial community ecology. FEMS Microbiol. Ecol. 2021, 97, 255. [Google Scholar] [CrossRef] [PubMed]
- Montesinos-Navarro, A.; Hiraldo, F.; Tella, J.; Blanco, G. Network structure embracing mutualism-antagonism continuums increases community robustness. Nat. Ecol. Evol. 2017, 1, 1661–1669. [Google Scholar] [CrossRef] [PubMed]
- Reis, C.R.G.; Reed, S.C.; Oliveira, R.S.; Nardoto, G.B. Isotopic evidence that nitrogen enrichment intensifies nitrogen losses to the atmosphere from subtropical mangroves. Ecosystems 2019, 22, 1126–1144. [Google Scholar] [CrossRef]
- Queiroz, H.M.; Ferreira, T.O.; Taniguchi, C.A.K.; Barcellos, D.; Nascimento, J.C.D.; Nóbrega, G.N.; Otero, X.L.; Artur, A.G. Nitrogen mineralization and eutrophication risks in mangroves receiving shrimp farming effluents. Environ. Sci. Pollut. Res. 2020, 27, 34941–34950. [Google Scholar] [CrossRef]
- Saini, R.; Kapoor, R.; Kumar, R.; Siddiqi, T.O.; Kumar, A. CO2 utilizing microbes—A comprehensive review. Biotechnol. Adv. 2011, 29, 949–960. [Google Scholar] [CrossRef]
- Fan, H.B.; Huang, Y.Z. Ecophysiological mechanism underlying the impacts of nitrogen saturation in terrestrial ecosystems on plants. J. Plant Physiol. Mol. Biol. 2006, 32, 395–402. [Google Scholar] [PubMed]
- Li, D.; Mo, J.; Fang, Y.; Peng, S.; Per, G. Impact of nitrogen deposition on forest plants. Acta Ecol. Sin. 2003, 23, 9. [Google Scholar] [CrossRef]
- Schulze, E.D. Air pollution and forest decline in a spruce (Picea abies) forest. Science 1989, 244, 776–783. [Google Scholar] [CrossRef]
- Tang, G.; Zhang, X.; Qi, L.; Li, L.; Guo, J.; Zhong, H.; Liu, J.; Huang, J. Nitrogen and phosphorus fertilizer increases the uptake of soil heavy metal pollutants by plant community. Bull. Environ. Contam. Toxicol. 2022, 109, 1059–1066. [Google Scholar] [CrossRef] [PubMed]
- Tilman, D. Resource Competition and Community Structure; Monographs in Population Biology; Princeton University Press: Princeton, NJ, USA, 1982; Volume 17, pp. 1–296. [Google Scholar] [PubMed]
Disclaimer/Publisher’s Note: The statements, opinions and data contained in all publications are solely those of the individual author(s) and contributor(s) and not of MDPI and/or the editor(s). MDPI and/or the editor(s) disclaim responsibility for any injury to people or property resulting from any ideas, methods, instructions or products referred to in the content. |
© 2025 by the authors. Licensee MDPI, Basel, Switzerland. This article is an open access article distributed under the terms and conditions of the Creative Commons Attribution (CC BY) license (https://creativecommons.org/licenses/by/4.0/).

