Article

Asynchronous Patterns Between Vegetation Structural Expansion and Photosynthetic Functional Enhancement on China’s Loess Plateau

1
School of Tourism & School of Artificial Intelligence, Xi’an International Studies University, Xi’an 710128, China
2
Key Laboratory of Vegetation and Environmental Change, Institute of Botany, Chinese Academy of Sciences, Beijing 100093, China
3
China National Botanical Garden, Beijing 100093, China
*
Author to whom correspondence should be addressed.
Forests 2025, 16(9), 1375; https://doi.org/10.3390/f16091375
Submission received: 10 August 2025 / Revised: 23 August 2025 / Accepted: 25 August 2025 / Published: 27 August 2025
(This article belongs to the Section Forest Ecophysiology and Biology)

Abstract

The Loess Plateau (LP), Earth’s largest loess deposit, has experienced significant vegetation recovery since 2000 despite water scarcity. Using 2001–2022 satellite-derived normalized difference vegetation index (NDVI) and solar-induced chlorophyll fluorescence (SIF) data, we analyze vegetation structural (greenness) and functional (photosynthesis) responses, addressing critical knowledge gaps in cover expansion—functional enhancement relationships during ecological restoration. Sustained warming and increased moisture have consistently enhanced both the NDVI and SIF across the LP, with water availability remaining the key limiting factor for vegetation structure and function. Notably, the relative trend of SIF (RTSIF: 3.92% yr−1) significantly exceeded that of the NDVI (RTNDVI: 1.63% yr−1), producing a mean divergence (ΔRTSIF-NDVI) of 2.38% yr−1 (p < 0.01) across the LP. This divergence indicates faster functional enhancement relative to structural expansion during vegetation recovery, with grasslands exhibiting the most pronounced difference in ΔRTSIF-NDVI compared to forests and shrublands. Hydrothermal conditions regulated vegetation structural–functional divergence, with regions experiencing stronger water stress exhibiting significantly greater ΔRTSIF-NDVI values. These findings demonstrate substantial hydrological constraint alleviation since 2001. Increased precipitation enhanced light use efficiency, accelerating photosynthetic function—especially in grasslands due to their rapid precipitation response. In contrast, forests maintained higher structure–function synchrony (lower values of ΔRTSIF-NDVI) through conservative strategies. Our findings indicate that grasslands may evolve as carbon sink hotspots via photosynthetic overcompensation, whereas forests remain reliant on sustaining current vegetation and are constrained by deep soil water deficits. This contrast highlights the value of ΔRTSIF-NDVI as a physiologically based indicator for quantifying restoration quality and predicting carbon sequestration potential across the LP.

1. Introduction

In recent decades, satellite observations reveal a significant enhancement in global vegetation structure and functioning under a warming climate, with the global leaf area index increasing by approximately 0.068 m2 m−2 per year since the 1980s, particularly in arid and semi-arid regions [1,2]. The Loess Plateau (LP), characterized by a semi-arid to semi-humid climate, suffers from persistent water scarcity, severe soil erosion, and ecological fragility, making it highly sensitive to climatic changes [3]. Recent studies indicate a prolonged “warming and wetting” trend across the LP. Since the 1980s, systematic soil and water conservation efforts—most notably the Grain to Green Program (GTGP) launched in 1999—have effectively mitigated erosion and enhanced ecological integrity, leading to substantial vegetation recovery and regional greening [4]. However, despite rapid increases in vegetation coverage, ecosystem functional changes across the LP remain poorly quantified. Furthermore, growing water scarcity risks threaten ecosystem stability, introducing significant uncertainty into future carbon sink dynamics [5]. Thus, a comprehensive understanding of vegetation–function relationships and their climatic responses is crucial for accurately projecting long-term carbon sequestration potential and guiding sustainable ecosystem management strategies.
Significant increases in vegetation cover and productivity have been widely documented across the LP since 2000, supported by multi-source evidence from field measurements, remote sensing, and modeling [6,7]. Satellite-derived vegetation indices, including the Leaf Area Index (LAI) and Normalized Difference Vegetation Index (NDVI), reveal increased vegetation coverage in over 80% of the region, showing a distinct northwest-to-southeast spatial gradient. Notably, vegetation greenness lines (VGLs) have been migrating northwestward at rates exceeding 9 km yr−1 [8]. This pronounced greening trend corresponds to an enhanced fraction of absorbed photosynthetically active radiation (fPAR), consequently elevating regional ecosystem productivity. Remote sensing estimates indicate an annual increase in gross primary productivity (GPP) of approximately 13.64 g C m−2 yr−1, displaying a spatial pattern that closely follows vegetation greenness dynamics [9]. Furthermore, solar-induced chlorophyll fluorescence (SIF), as a novel proxy for photosynthetic activity, shows a consistent upward trend [10], providing an independent validation of these productivity gains. Yet, comparative studies of Loess Plateau ecosystem greening and function dynamics are notably scarce.
Vegetation greening reflects ecosystem structural changes, yet photosynthetic function and structural traits may exhibit asynchronous responses to climatic variations [11]. Extensive research has established that climate warming, elevated atmospheric CO2 concentrations, and anthropogenic ecological engineering serve as primary drivers of enhanced vegetation coverage and functionality across the LP [12,13]. Both remote sensing and in situ observations consistently identify moisture availability as the key regulator of interannual vegetation variability, demonstrating strong positive correlations among precipitation, soil moisture, and vegetation growth indices (e.g., the NDVI and GPP) [14,15]. Importantly, temperature effects on LP vegetation are mediated by water availability [16], and the CO2 fertilization effect on photosynthesis is progressively constrained by nutrient and hydrological limitations [17]. These findings collectively demonstrate that both vegetation structure and function on the LP are fundamentally moisture-limited, governing their interannual dynamics. Theoretically, this moisture constraint might promote strong interannual coupling between vegetation structure and function, particularly in arid and semi-arid ecosystems [18]. However, our current understanding reveals two critical knowledge gaps: (1) the precise nature and strength of structure–function coupling in the LP remain insufficiently quantified, and (2) emerging evidence suggests this coupling relationship is undergoing dynamic changes, though the specific patterns and mechanistic drivers remain unclear [19].
The coupling/decoupling of photosynthetic function and vegetation structure fundamentally reflect plants’ adaptive regulation of carbon acquisition strategies and resource allocation in response to environmental variability [20,21]. Within the Loess Plateau’s ecological restoration context, this dynamic is profoundly influenced by regional climate gradients and vegetation functional types. While concurrent increases in vegetation greenness and productivity are observed across the LP, both parameters demonstrate marked spatial heterogeneity that may be further modulated by intensifying hydrological constraints [22]. Notably, the interannual coupling strength between LAI and GPP exhibits aridity-dependent variation, with decreasing correlation coefficients along moisture gradients. Mesic forest ecosystems particularly demonstrate greenness–productivity decoupling, reflecting a strategic trade-off between leaf quantity (LAI) and quality (canopy light use efficiency) [23]. Arid ecosystems, however, present more complex relationship patterns [24]. However, comprehensive regional-scale comparative analyses remain scarce [25]. A critical unresolved question concerns the strategic prioritization of LP vegetation under climatic constraints: whether ecological restoration drives the optimization of photosynthetic physiology or biomass expansion represents a fundamental mechanistic uncertainty. This knowledge gap is particularly consequential for the ecologically vulnerable Loess Plateau, where vegetation dynamics are acutely climate-limited.
Previous research on the Loess Plateau has predominantly examined the long-term trends of individual vegetation indicators, despite the critical importance of both structural and functional metrics for comprehensive ecological restoration assessment [26]. Notably, the potential asynchrony between these dimensions (e.g., functional enhancement preceding structural recovery) remains poorly quantified at regional scales. Remote sensing indicators provide distinct perspectives: the NDVI primarily captures structural characteristics through leaf area and biomass accumulation, while SIF offers direct insight into photosynthetic function with heightened sensitivity to environmental variability, particularly water availability [27]. Leveraging these complementary datasets, our study introduces ΔRTSIF-NDVI—a novel metric quantifying the differential response rates of ecosystem structure (NDVI) and function (SIF) across the Loess Plateau (2001–2022)—to elucidate the relationship between photosynthetic physiological optimization and structural expansion during ecological restoration. This innovative indicator may not only characterize structure–function coupling dynamics but also serve as a robust diagnostic tool for evaluating ecological restoration quality. Elucidating the divergent responses of structural development and photosynthetic performance to climate drivers is essential for refining carbon sink projections and informing targeted ecosystem management strategies in this ecologically vulnerable region.

2. Materials and Methods

2.1. Study Area

The Loess Plateau (33°43′–41°16′ N, 100°54′–114°33′ E), situated in Northwestern China, covers an extensive area of approximately 624,000 km2. Characterized by a distinct topographical gradient with higher elevations in the west and lower in the east, the region experiences a typical temperate continental monsoon climate. This climatic regime spans three major zones: arid, semi-arid, and semi-humid regions [28]. The vegetation cover is predominantly characterized by grasslands (accounting for 49.94% of the area), croplands (35.45%), shrubs (0.59%), and forests (10.69%) (Figure 1a). Between 2001 and 2022, the region exhibited a distinct warming–wetting trend (Figure 1b), with growing-season (from April to October) temperatures increasing significantly at an average rate of 0.013 °C yr−1 (p < 0.01) (Figure 1c). Precipitation patterns followed a southeast/northwest decreasing gradient (100–800 mm), with 82% of the area showing increases averaging 2.33 mm yr−1, particularly pronounced in southern and central/eastern regions (up to 3.93 mm yr−1) (Figure 1d). Growing-season soil moisture (0.15–0.45 m3m−3) increased along the northeast/southwest axis but decreased significantly at the northwestern and southeastern margins (Figure 1e).

2.2. Datasets

2.2.1. Vegetation Indices

The normalized difference vegetation index (NDVI), a widely adopted metric for quantifying vegetation greenness, serves as a robust proxy for ecosystem structural characteristics, including leaf area index (LAI) and biomass accumulation patterns. This study utilized the MOD13A2 Version 6.1 product (MOD13A2v061) from NASA’s Terra/MODIS platform (https://ladsweb.modaps.eosdis.nasa.gov/missions-and-measurements/products/MOD13A2) (accessed on 24 August 2025), providing NDVI data at 16-day temporal and 1 km spatial resolutions for the 2001–2022 study period [29]. The solar-induced chlorophyll fluorescence (SIF) data were derived from the contiguous solar-induced chlorophyll fluorescence (CSIF) dataset (in clear-sky conditions) (https://osf.io/8xqy6/?view_only=4d14a64b7be644d39564c82a371e1d20) (accessed on 24 August 2025) [30], providing 4-day composites at 0.05° spatial resolution. This dataset was developed through machine learning integration of OCO-2 SIF observations with MODIS MCD43C4 Collection 6 surface reflectance data. To ensure spatial consistency with the NDVI dataset, we performed linear interpolation to resample the SIF data to a 1 km resolution grid. We additionally obtained MOD17A2Hv060 gross primary productivity (GPP) data (2001–2021; 8 days; 500 m resolution) [31], which were linearly interpolated to 1 km spatial resolution for analysis consistency.

2.2.2. Climate Datasets

Climate variables, including temperature, precipitation, potential evapotranspiration (PET), and soil moisture, were acquired from the National Tibetan Plateau Scientific Data Center (TPDC) (https://www.tpdc.ac.cn/home (accessed on 24 August 2025)) for the 2001–2022 study period. Temperature data were obtained from the “1-km monthly mean temperature dataset for China (1901–2024)” [32,33], while precipitation data came from the corresponding “1 km monthly precipitation dataset for China (1901–2024)” [34]. Monthly PET data were sourced from the “1-km monthly potential evapotranspiration dataset for China (1901–2024)” [35,36]. Soil moisture data were derived from the “1-km daily soil moisture dataset over China based on in-situ measurements (2000–2022)”, which employed machine learning techniques to integrate 10-layer observations from 1648 China Meteorological Administration stations with multiple covariates including ERA5_Land reanalysis data, MODIS LAI products, land cover classifications, digital elevation models, and soil property datasets [37,38]. Downward shortwave radiation data originated from the Global Land Surface Satellite (GLASS) product at 0.05° spatial and daily temporal resolution, subsequently resampled to 1 km resolution using nearest-neighbor interpolation to maintain spatial consistency with other datasets.

2.2.3. Land Cover and Digital Elevation Model (DEM) Datasets

The land cover dataset was obtained from the European Space Agency Climate Change Initiative Land Cover product (ESA CCI-LC) with 300 m spatial and annual temporal resolution (https://www.esa-landcover-cci.org/) (accessed on 24 August 2025). For our analysis, we employed the 2015 dataset and reclassified it into five primary categories: grasslands, croplands, shrublands, forests, and other land cover types. Additionally, digital elevation data were acquired from the Advanced Spaceborne Thermal Emission and Reflection Radiometer Global Digital Elevation Model (ASTER GDEM v2) (http://earthexplorer.usgs.gov/) (accessed on 24 August 2025), at 30 m spatial resolution. All data mentioned above are presented in Table 1.

2.3. Methods

All original vegetation and climate indicator datasets were first aggregated to monthly temporal resolution, then composited into growing-season metrics prior to subsequent analytical processing. For MODIS NDVI and GPP, we generated monthly composites using the maximum value composite (MVC) procedure [39], and we discarded the negative values of SIF. The vegetation growing-season was set as April–October, in accordance with existing vegetation phenology studies of the LP [40]. Growing-season NDVI, SIF, GPP, temperature, and solar radiation were averaged across months, while precipitation and soil moisture were summed from April to October.
We quantified interannual trends in NDVI, SIF, GPP, and climate variables using linear least squares regression. To facilitate cross-comparison of NDVI, SIF, and GPP trends while accounting for regional baseline differences, we normalized each pixel’s trend by dividing it by the mean value of the initial five-year period (2001–2005), yielding relative trends (RTs). This normalization approach quantifies both the following: (1) the annual rate of change, and (2) the percentage change relative to baseline conditions. The resulting metrics are designated as RTNDVI, RTSIF, and RTGPP for vegetation structure, photosynthetic activity, and productivity, respectively. Notably, we observed that RTSIF consistently exceeded RTNDVI across the study area. To quantify this enhancement gap, we computed relative trend divergence (∆RTSIF-NDVI = RTSIF − RTNDVI) in regions where both variables showed increasing trends.
Furthermore, to explore drivers of vegetation change during 2001–2022, we performed partial correlation analyses between vegetation indices (NDVI and SIF) and climatic factors (solar radiation, temperature, precipitation, and soil moisture). For example, the correlation between NDVI and soil moisture was analyzed while controlling for temperature and radiation. Prior to analysis, all time series were detrended to remove long-term trends. Finally, to ensure the robustness of our findings, we excluded non-vegetated and sparsely vegetated areas, defined as pixels with multi-year average growing-season NDVI values below 0.1. All data processing and analyses in this study were performed using MATLAB (R2023b).

3. Results

3.1. Vegetation Greenness (NDVI) and Photosynthetic Function (SIF) Changes: Trends and Climatic Controls

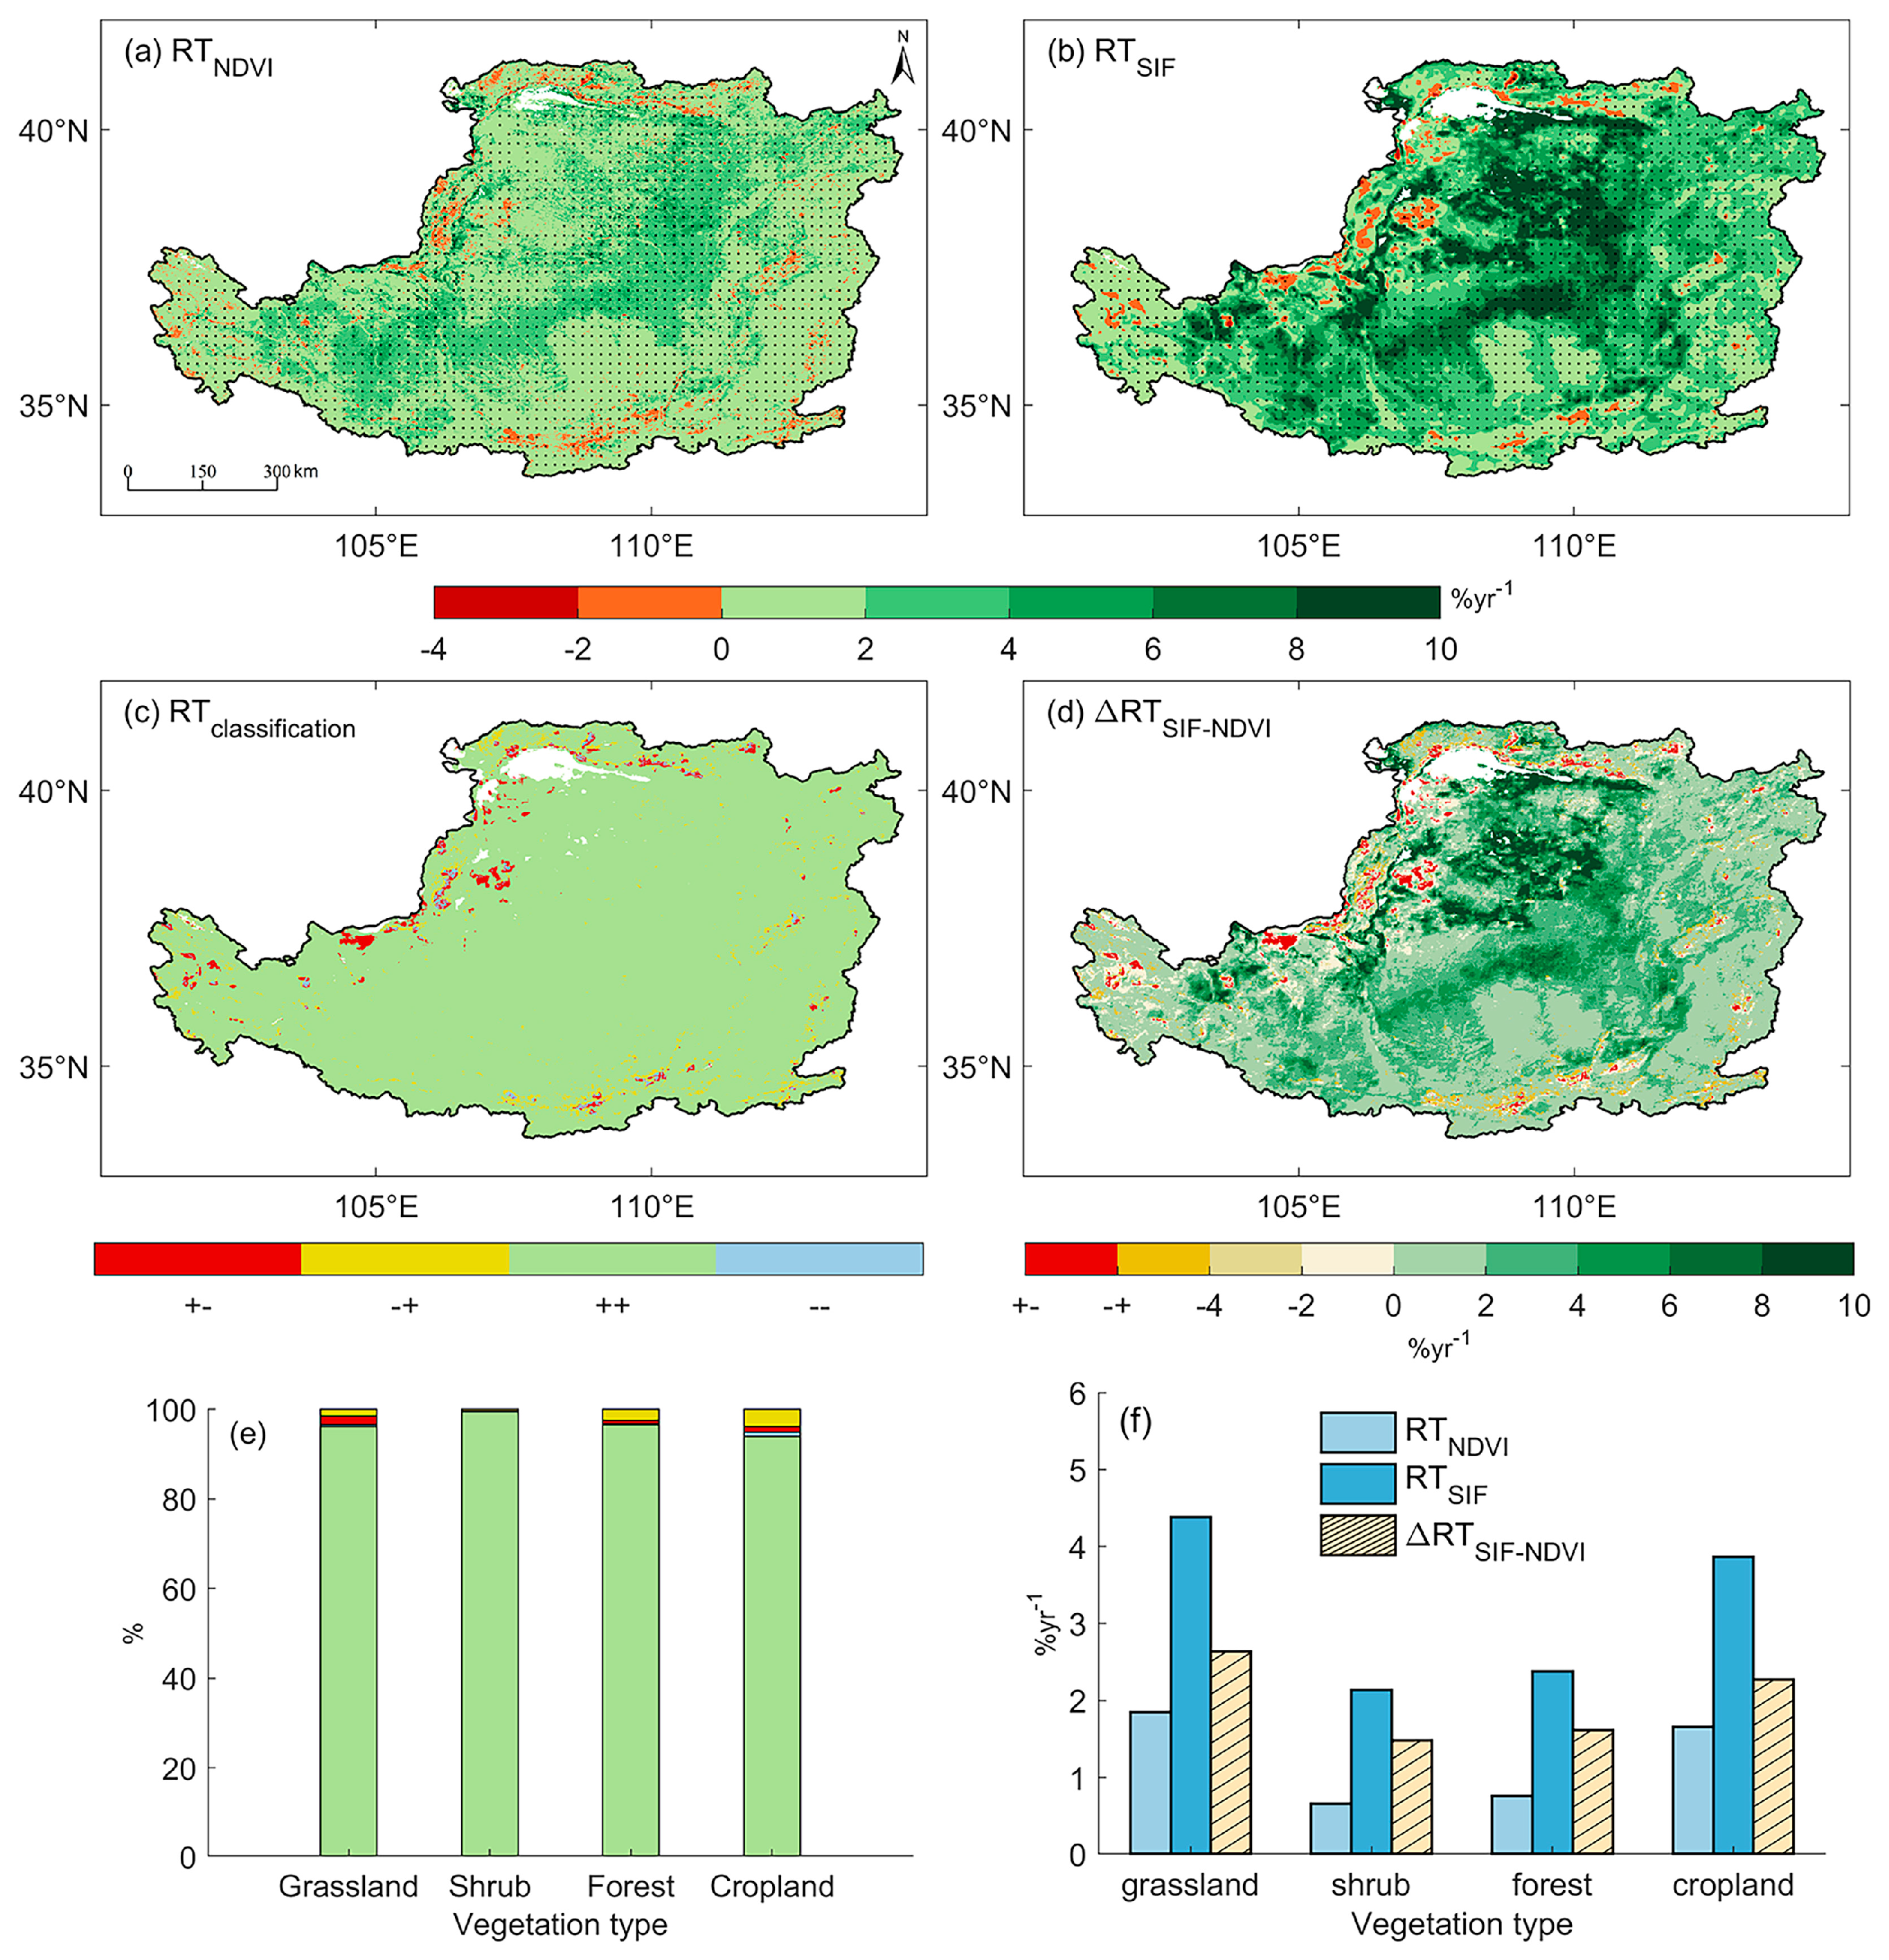
The Loess Plateau demonstrated pronounced greening from 2001 to 2022 with a significant mean growing-season NDVI increase of 0.003 yr−1 (p < 0.05) and approximately 96% of the study area exhibiting statistically significant positive trends (Figure S1a). Spatially, the most significant vegetation greening was observed in the central and Southwestern LP (including central/Southern Shanxi, Northern/central Shaanxi, Eastern/Southern Gansu, and Southern Ningxia), with maximum NDVI increase rates reaching 0.012 yr−1. In contrast, more modest greening trends were found in northwestern and southeastern areas. Notably, areas with a decline in the NDVI, while spatially dispersed, were primarily concentrated in the Northern and Southern LP sectors—regions that largely coincide with major agricultural zones (Figure 1 and Figure S1a). Consistent with the observed vegetation greening, satellite-derived SIF data demonstrated a parallel significant enhancement (p < 0.05; Figure S1c), where 96.87% of the study area displayed positive trends averaging 0.0028 yr−1. Both indices showed the greatest enhancement in northeast–southwest-oriented arid/semi-arid central regions (predominantly grasslands), whereas northwestern and southeastern margins exhibited comparatively smaller increases (Figure S1).
While the spatial pattern of relative vegetation greenness trends (RTNDVI) mirrored the absolute NDVI trends across the LP, the relative photosynthetic activity trends (RTSIF) exhibited distinct spatial dynamics compared to raw SIF trends (Figure 2). Notably, the northwestern desert grasslands showed the most pronounced relative enhancement in photosynthetic activity, with an annual percentage change of 5.43% yr−1 relative to baseline conditions (Figure 2b). The regional averages of RTNDVI and RTSIF were 1.63% yr−1 and 3.92% yr−1, respectively. To characterize the NDVI and SIF variation patterns, we classified and analyzed their relative trends. Our results show that the vast majority (~93%) of the plateau experienced concurrent increases in both the NDVI and SIF, reflecting a comprehensive vegetation improvement (Figure 2c). In contrast, only minimal portions showed divergent patterns: about 2% of areas (primarily in the northwestern desert grasslands) showed NDVI increases coupled with SIF decreases; <3% of areas (mostly croplands) displayed either NDVI decreases with SIF increases or simultaneous declines in both indices, sporadically distributed across the plateau. A notable disparity was observed, with RTSIF systematically exceeded RTNDVI (Figure 2), prompting the calculation of ∆RTSIF-NDVI in co-increasing zones to quantify this enhancement gap (Figure 2d). A quantitative analysis showed 88.95% of areas displayed positive ∆RTSIF-NDVI values (mean = 2.4% yr−1, p < 0.01), demonstrating that ecosystem functioning (SIF) consistently outpaced structural development (NDVI) under climate change, highlighting differential climate sensitivities.
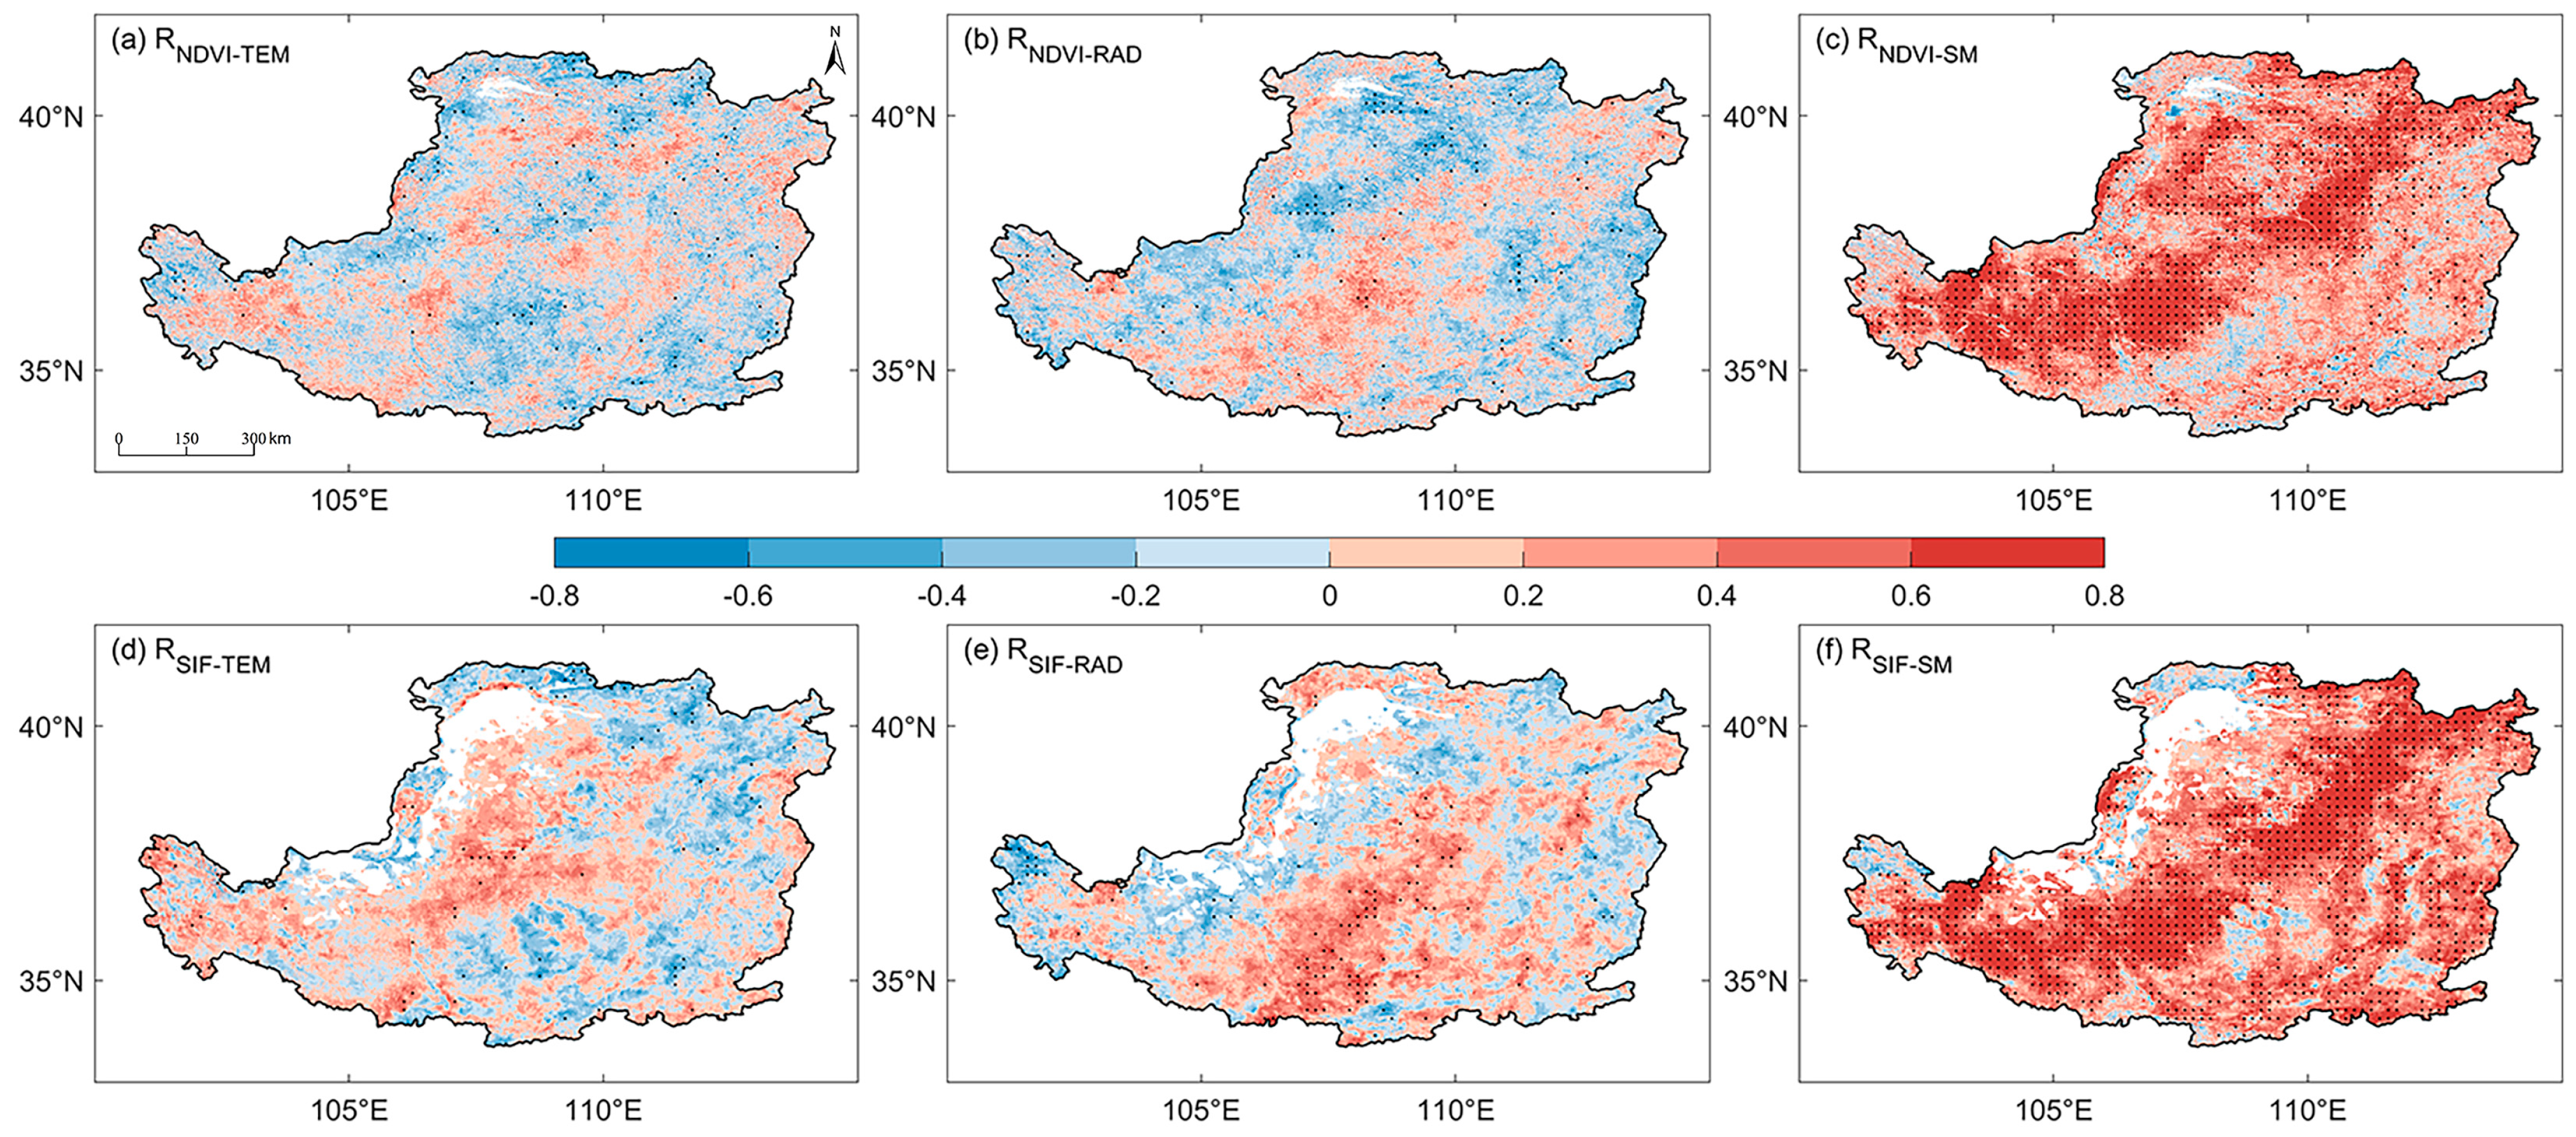
A partial correlation analysis revealed water availability as the primary driver of interannual vegetation variability across the Loess Plateau. Soil moisture (SM) showed robust positive correlations with both vegetation indices, significantly (p < 0.05) affecting ~41% (RNDVI-SM: mean r = 0.59) and ~49% (RSIF-SM: mean r = 0.60) of the region, with positive relationships extending to about 84% and 90% of the study area, respectively (Figure 3c,f). In contrast, temperature and radiation displayed spatially heterogeneous and generally weak associations with vegetation dynamics. The spatial patterns of growing-season soil moisture trends showed remarkable alignment with vegetation dynamics across the LP. Most notably, within the northeast–southwest-oriented arid/semi-arid central belt, soil moisture variations demonstrated strong coherence with both vegetation greenness (NDVI) and photosynthetic activity (SIF) distributions (Figure 1e and Figure 3c,f). This correspondence was particularly evident across the region’s predominant cultivated loessal soils, reinforcing soil moisture as the primary control for vegetation structural and functional variability. However, the observed soil moisture declines in the northwestern and southeastern sectors suggest the influence of additional, potentially anthropogenic, drivers in these marginal areas. On the other hand, vegetation greenness and photosynthetic activity also show a strong positive correlation with precipitation, especially in the northwestern grassland areas (Figure S2), with regional average correlation coefficients of 0.49 and 0.54 (p < 0.05). This moisture dependence coincides with widespread growing-season precipitation increases observed plateau-wide (Figure 1d). Synthesizing these findings with prior results, we identify water availability as the principal driver of interannual vegetation variability, though its regulatory influence interacts with warming trends and CO2 fertilization effects to determine ultimate response magnitudes.

3.2. The Photosynthetic–Structural Enhancement Divergence (ΔRTSIF-NDVI) Across the Loess Plateau

Our analysis reveals that since 2001, under consistent climatic conditions, SIF increased faster than the NDVI across about 89% of the LP; namely, the divergence between their relative change trends is positive (ΔRTSIF-NDVI > 0; mean = 2.38% yr−1). This indicates greater photosynthetic responses than structural responses despite shared moisture availability. Consistently, gross primary productivity change rates (RTGPP) also exceed RTNDVI (Figure S3). A temporal analysis reveals that this differential response stems from distinct climate sensitivities. A partial correlation analysis demonstrates that temperature and moisture variables (precipitation and soil moisture) exhibit stronger positive effects on SIF than on the NDVI (Figure 3 and Figure S2), confirming that SIF’s enhanced sensitivity to climatic fluctuations accounts for the widespread ΔRTSIF-NDVI > 0 pattern. These observed patterns providing compelling evidence for ecosystem-scale decoupling between structural greenness (NDVI) and photosynthetic function (SIF) under shifting climatic conditions.
Over the past two decades (2001–2022), the Loess Plateau has exhibited marked spatial heterogeneity in ΔRTSIF-NDVI patterns, strongly aligned with the northwest–southeast climatic gradient spanning arid to semi-humid zones (Figure 2d). The semi-arid regions displayed particularly pronounced ΔRTSIF-NDVI values (2–10% yr−1), with peak enhancement (8–10% yr−1) occurring in the Eastern Mu Us Sandy Land. This ecotone, characterized by skeletal sandy soils and desert steppe vegetation, experiences severe moisture limitations due to low precipitation (≤400 mm) and high potential evapotranspiration (>900 mm). In contrast, the afforested Loess Hilly Gully region—a major implementation zone for the GTGP—showed moderate ΔRTSIF-NDVI values (0–4% yr−1), reflecting successful vegetation restoration in grassland systems. The semi-humid zones, dominated by forest and intensive croplands, exhibited the lowest functional–structural decoupling (ΔRTSIF-NDVI: 0–2% yr−1), suggesting greater synchrony between canopy development and photosynthetic activity in these water-sufficient environments.
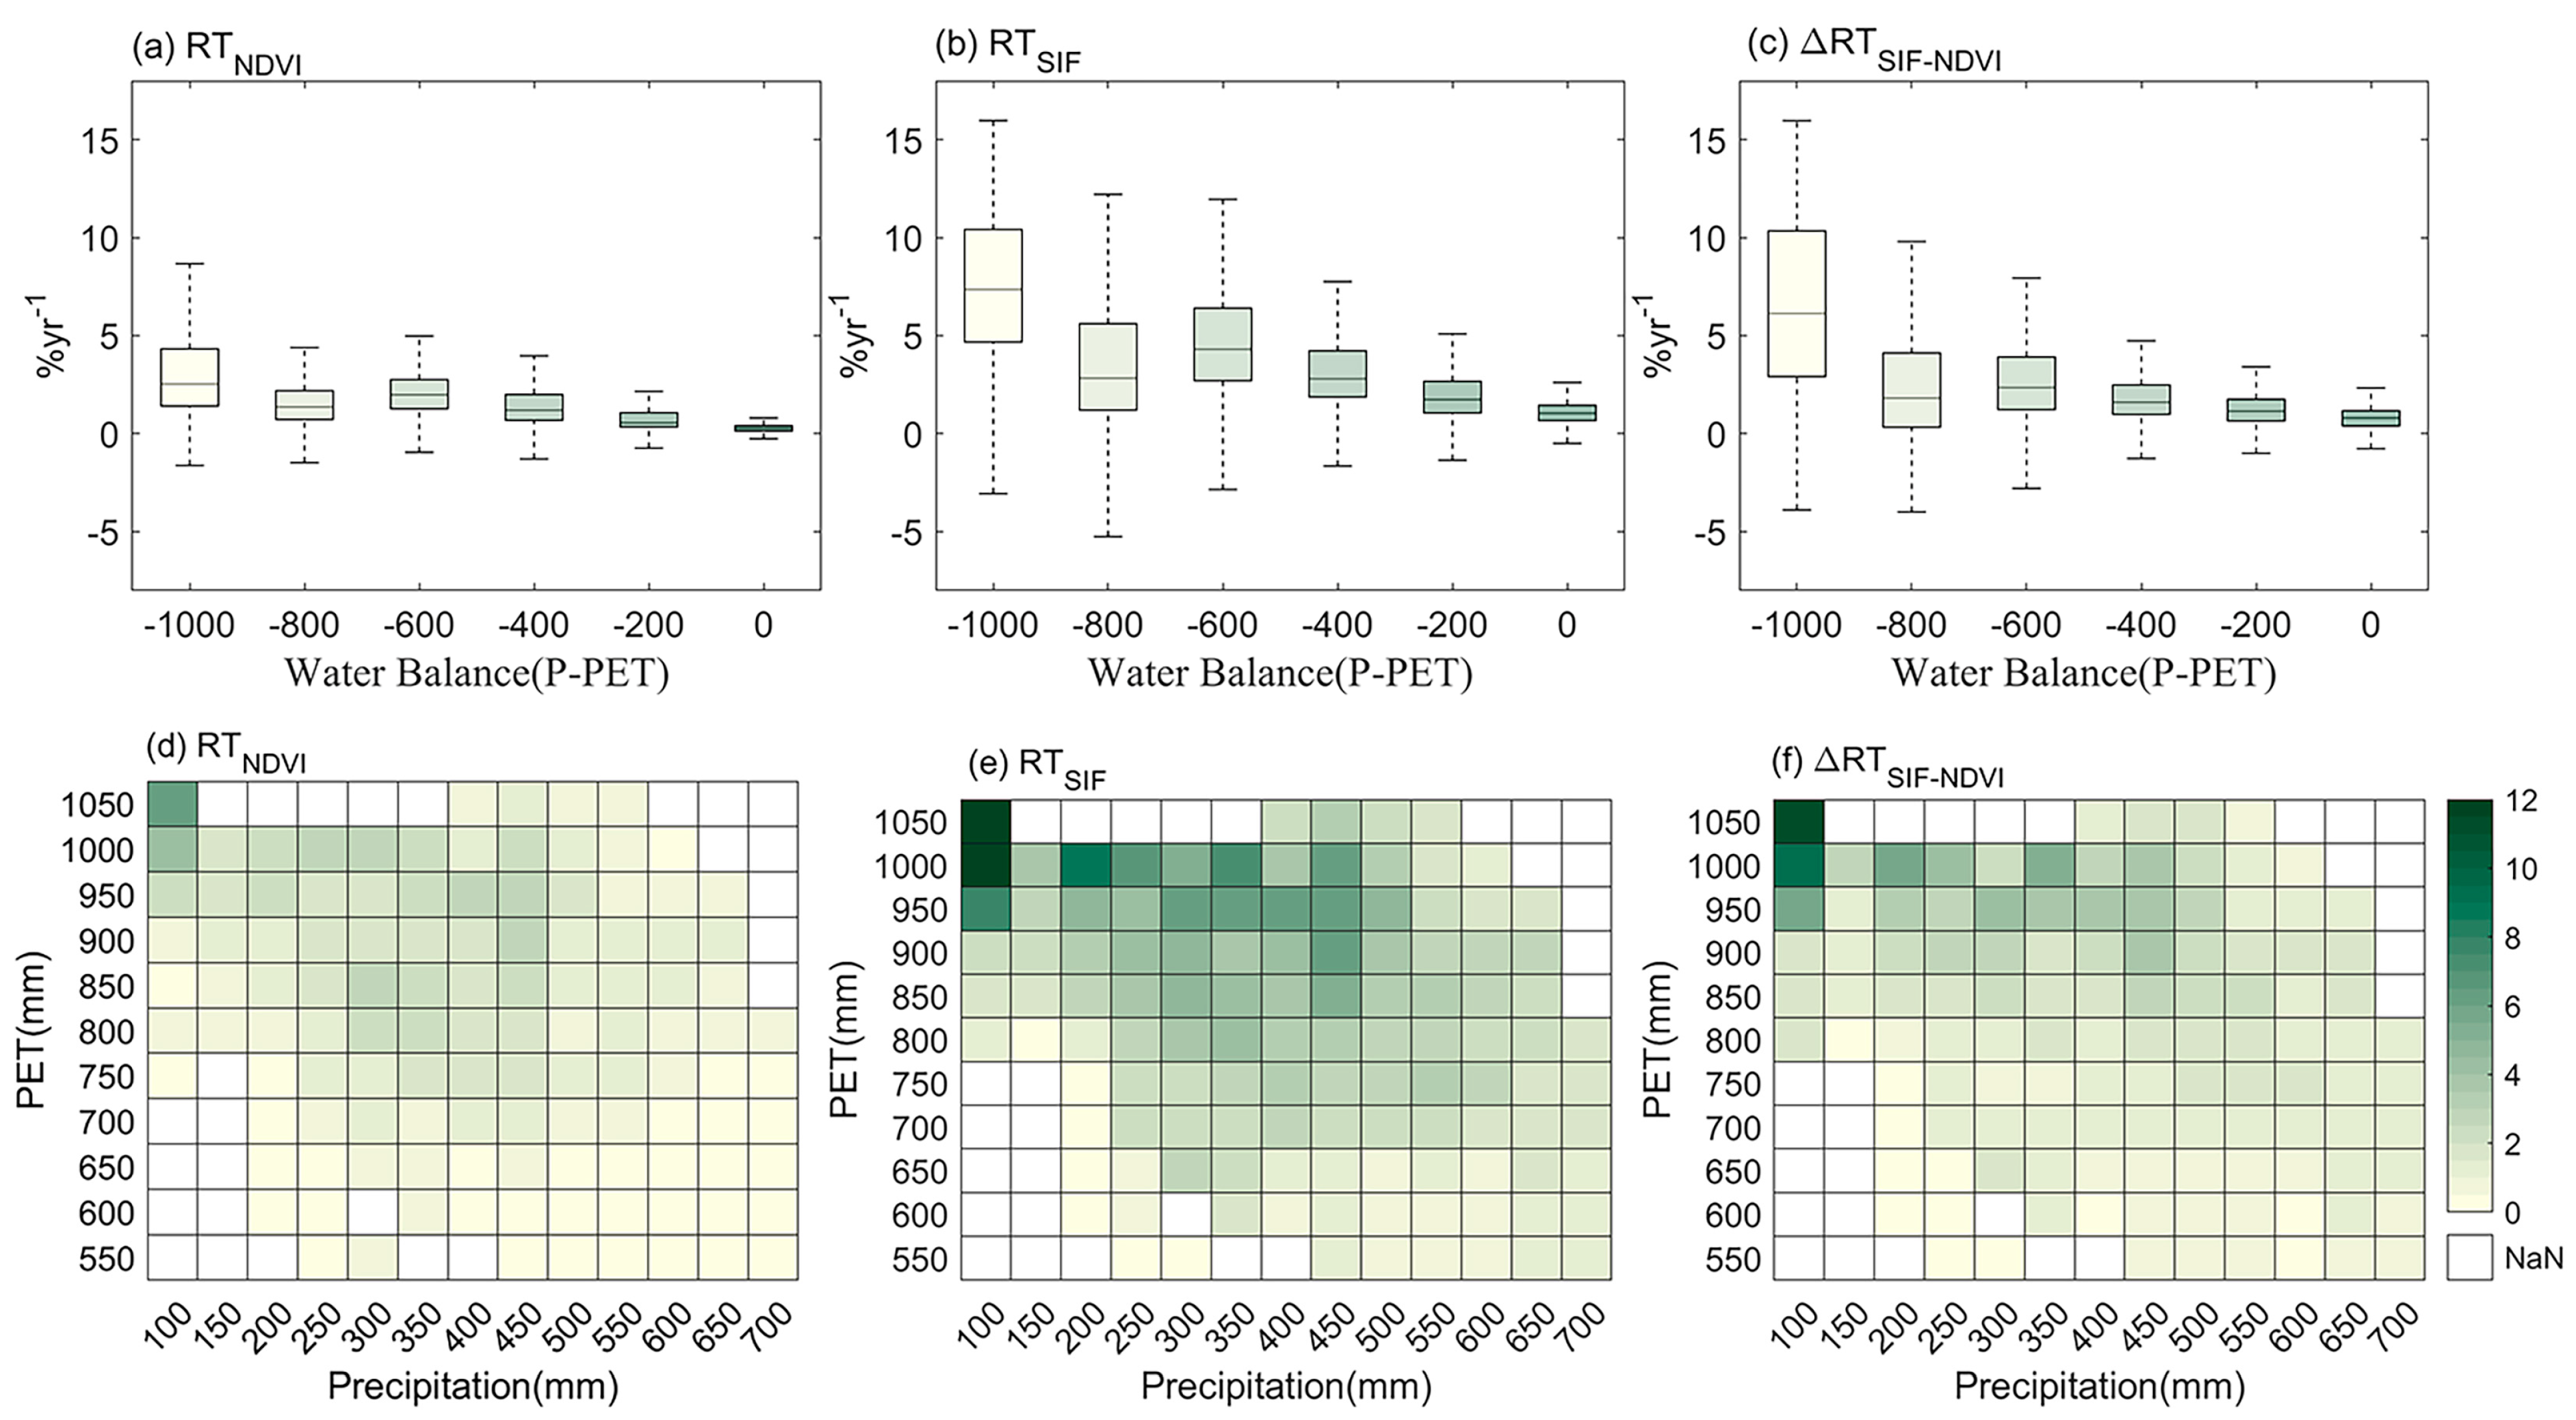
Our analysis of the spatial heterogeneity in ΔRTSIF-NDVI across the plateau revealed a strong dependence on moisture availability, where a greater water imbalance corresponded to larger ΔRTSIF-NDVI values (Figure 4a–c). Using the water balance index (P-PET) as a quantitative moisture metric, we observed that regions with lower water balance values (a greater moisture deficit) exhibited both higher RTNDVI and RTSIF magnitudes, consequently resulting in amplified ΔRTSIF-NDVI differences. This moisture-driven pattern was particularly pronounced for RTSIF, highlighting photosynthetic activity’s enhanced sensitivity to water stress. The water balance index analysis shows predominantly negative values across the plateau, indicating widespread water deficit conditions, where regions with greater moisture deficits (−800 to −1000 mm P-PET) exhibit substantially greater enhancement rates (RTNDVI: 3.55% yr−1; RTSIF: 11.52% yr−1; ΔRTSIF-NDVI: 7.98% yr−1) compared to relatively humid areas (0–200 mm P-PET; RTNDVI: 0.29% yr−1; RTSIF: 1.05% yr−1; ΔRTSIF-NDVI: 0.76% yr−1), highlighting the critical role of moisture availability in driving both structural and functional vegetation responses across this ecologically vulnerable region.
Building upon the hydroclimatic analysis, our spatial visualization of ΔRTSIF-NDVI demonstrates a clear dependency on the balance between growing-season precipitation (P) and PET (Figure 4d–f). The most pronounced ΔRTSIF-NDVI values (9.48–11.21% yr−1) occur in moisture-stressed regions characterized by maximal PET (>1000 mm) and minimal P (<200 mm), decreasing progressively along gradients of improved water availability. This spatial distribution reflects that RTSIF shows continuous enhancement with increasing aridity, while RTNDVI remains relatively stable. Furthermore, within the temperature–precipitation climatic space, ΔRTSIF-NDVI follows a characteristic decline from hot/arid to cold/humid zones, reaching maximum values in thermal optimum conditions (a growing-season temperature of 14–18 °C; Figure S4).

3.3. Divergent Responses of Vegetation Greenness and Photosynthesis Across Plant Functional Groups

Vegetation types exhibited significantly divergent responses regarding the NDVI and SIF, demonstrating a systematic photosynthetic overperformance (positive ΔRTSIF-NDVI value) across all ecosystems (Figure 2f). The relative trends followed consistent but distinct hierarchies, with grasslands showing the strongest responses for both vegetation greenness and photosynthetic activity, followed by croplands, forests, and shrubs. After excluding croplands due to predominant anthropogenic influences (e.g., irrigation and management practices), ΔRTSIF-NDVI remained most pronounced in grasslands (2.64% yr−1), followed by shrubs (1.61% yr−1) and forests (1.48% yr−1), demonstrating that grassland ecosystems exhibited the strongest climate-induced divergence between vegetation structural development and photosynthetic functional enhancement under the observed warming/wetting trend on the Loess Plateau.

4. Discussion

4.1. Structural–Functional Asynchrony in Loess Plateau Vegetation Dynamics

Since 2001, the Loess Plateau has undergone concurrent climatic changes (warming and increased precipitation), CO2 fertilization, and ecological restoration, collectively enhancing ecosystem greenness and productivity [12]. Our analysis reveals a striking disparity in enhancement rates: while the NDVI increased modestly, SIF and GPP exhibited substantially greater gains (Figure 2 and Figure S3). This differential response suggests coordinated improvements in both canopy development and light use efficiency (LUE), with photosynthetic functional enhancement outpacing structural expansion. The observed productivity gains likely derive principally from LUE optimization, consistent with the Monteith (1972) productivity framework (GPP = f (LAI) × PAR × LUE) [41]. Mechanistically, NDVI increases (reflecting LAI expansion) under low-vegetation conditions primarily augment PAR interception capacity, thereby elevating its baseline photosynthetic potential. However, such structural changes exhibit diminishing returns for photosynthetic improvements, particularly under moisture-limited conditions in which stomatal regulation and biochemical constraints may suppress photosynthetic efficiency despite canopy expansion [42]. This decoupling explains the disproportionate SIF enhancements observed relative to those of the NDVI across the LP.
The Loess Plateau’s vegetation productivity faces fundamental constraints from severe soil erosion and chronic water scarcity, which collectively limit soil resource availability (moisture and nutrients) and consequently suppress photosynthetic efficiency. Our observed combination of modest NDVI increases and stable radiation levels (Figure 1b) strongly implicates LUE optimization as the dominant mechanism behind the productivity enhancement [43]. This interpretation gains further support from SIF’s physiological basis—as a direct byproduct of photosynthesis, SIF simultaneously reflects the following: (1) photosynthetic energy conversion efficiency and (2) vegetation stress responses to environmental limitations like water deficits [44,45]. The pronounced SIF increases observed across the LP, when contextualized with our moisture availability findings, suggest that improved hydrological conditions have effectively alleviated historical water and nutrient constraints. This hydrological amelioration has preferentially enhanced LUE rather than canopy expansion, enabling more efficient photosynthetic performance under given light conditions and ultimately driving disproportionate functional (SIF) versus structural (NDVI) improvements in these fragile ecosystems.
These findings corroborate global observations of increasing photosynthetic efficiency in water-limited ecosystems, where an improved LUE has been identified as the primary explanation for the divergence between vegetation greening and productivity trends [24]. Our analysis provides compelling evidence that environmental constraints on LP vegetation have progressively weakened since 2001. This ecological release has led to the faster rate of functional capacity improvements (SIF) compared to structural expansion (NDVI), establishing that photosynthetic functional enhancements have consistently outpaced structural development over the 22-year study period.
Our findings reveal a progressive decoupling between productivity and greenness trends in the Loess Plateau ecosystem, contrasting with historical tight coupling driven by water availability in arid/semi-arid regions [46,47] (Figure 3). While previous studies hypothesized that vegetation greening might intensify water limitations through resource competition [19], our 22-year dataset demonstrates an overall alleviation of water and nutrient constraints through two synergistic mechanisms: (1) hydrological amelioration, in which increased precipitation enhanced soil moisture and stimulated nutrient cycling (nitrogen mineralization, phosphorus solubilization, and nutrient mobility [48]), and (2) vegetation adaptive strategies featuring preferential carbon allocation to fine root development over leaf expansion, thereby optimizing resource acquisition while increasing photosynthetic efficiency and reducing transpirational water loss. This physiological adaptation, characteristic of arid-adapted vegetation, explains the observed disproportionate productivity gains relative to structural expansion. The concurrent effects of rising CO2 concentrations further enhanced the photosynthetic efficiency and LUE, enabling significant ecosystem functional improvements despite modest canopy development [49,50]. These findings collectively demonstrate how the Loess Plateau’s vegetation has responded to changing hydroclimatic conditions through optimized resource allocation strategies that prioritize photosynthetic performance over structural expansion, representing a sophisticated adaptation to the region’s evolving environmental constraints.
Vegetation types demonstrate distinct response patterns primarily governed by differential water use efficiencies (WUEs) and canopy–photosynthesis relationships, with grasslands exhibiting the most rapid NDVI and SIF increases (followed by shrubs and forests) due to their shallow root systems and superior WUE [51] (Figure 2). Grassland dynamics are strongly precipitation-driven, showing tight coupling between leaf area and productivity during times of water stress; when moisture limitations are lessened, both parameters enhance synergistically. Nevertheless, the NDVI’s early saturation at low biomass contrasts with SIF’s linear response to photosynthetic improvement, explaining their maximal ΔRTSIF-NDVI values. This divergence is further intensified because annual grasses optimize photosynthesis through rapid leaf turnover, while the NDVI’s reliance on biomass stock accumulation makes it inherently slower to respond to hydrological variations [52]. Conversely, forest ecosystems display attenuated responses due to deep-rooted water access and conservative stomatal regulation, in which productivity reflects long-term water balance [53], while canopy closure limits NDVI sensitivity and resource allocation trade-offs prioritize structural growth over photosynthetic enhancement [23], collectively resulting in smaller ΔRTSIF-NDVI values through synchronized but gradual SIF-NDVI increases. The unique ecological context of the LP further accentuates these observed patterns: in grassland restoration areas, initial rapid NDVI increases (reflecting vegetation cover recovery) gradually transition to SIF-driven growth as photosynthetic efficiency becomes the dominant productivity factor. Conversely, plantation species like Robinia pseudoacacia exhibit early NDVI saturation during stand development, while their SIF enhancements face additional constraints due to deep soil water competition [54].

4.2. Water Stress Amplifies Divergence Between Ecosystem Structure and Function on the Loess Plateau

The water balance (P-PET) on the Loess Plateau serves as a robust indicator of regional hydroclimatic constraints, directly governing the spatial heterogeneity of ΔRTSIF-NDVI by mediating vegetation water and nutrient limitations (Figure 4). As a quintessential aeolian loess landscape, the LP’s chronic water deficits exacerbate vegetation stress through two synergistic soil resource constraints: (1) hydrological limitations, in which precipitation serves as the primary soil moisture source due to deep groundwater tables and the limited subsurface water storage capacity [55]; and (2) edaphic constraints, as the predominance of silt-sized particles and persistent erosion processes severely impair soil water retention. These moisture limitations create cascading effects on nutrient cycling—by regulating mineralization rates (particularly nitrogen and phosphorus), microbial activity, and solute transport pathways, soil water availability ultimately determines nutrient bioavailability [56]. This integrated water–nutrient constraint framework explains the observed spatial patterns of vegetation structural–functional divergence (ΔRTSIF-NDVI) across the plateau’s moisture gradient.
Vegetation in the most water-deficient regions (minimum P-PET values) experiences the maximum environmental stress, and subsequent stress alleviation drives disproportionately large improvements in photosynthetic efficiency (SIF) compared to canopy development (NDVI), generating peak ΔRTSIF-NDVI values. This decoupling attenuates progressively along moisture gradients, with smaller ΔRTSIF-NDVI values occurring in less stressed areas, demonstrating the dominant role of direct water availability in structural–functional relationships. A spatial analysis confirms that this heterogeneity is principally governed by RTSIF variability (Figure 4), further substantiated by the southeast-to-northwest nutrient gradient [57]. Specifically, the humid Southeastern LP’s favorable hydro-climatic conditions minimize ΔRTSIF-NDVI magnitudes, while the arid northwest’s extreme water deficits create optimal conditions for maximal functional–structural decoupling (ΔRTSIF-NDVI = 5.69–11.21% yr−1). These patterns collectively establish hydro-climatic stress intensity as the primary determinant of vegetation response divergence across the LP’s ecological gradient.
Vegetation-type-specific analyses reveal that ΔRTSIF-NDVI values intensify progressively with water stress severity across all ecosystem types, exhibiting particularly strong sensitivity to atmospheric water demand (PET) in grasslands relative to forests and shrublands (Figure 5). For instance, in high-PET regions (>900 mm), grassland ΔRTSIF-NDVI values reach four to five times those observed in low-PET areas, whereas forests exhibit only one- to two-fold increases. (Figure 5). Regions with elevated PET values exhibit concomitant increases in temperature, solar radiation, and atmospheric evaporative demand. Within the Loess Plateau’s warming–wetting context, vegetation in high-PET zones capitalizes on enhanced energy availability through two key mechanisms: (1) extended growing-season and stimulated enzymatic activity (particularly Rubisco activation) that directly boost photosynthetic capacity, and (2) the precipitation-mediated mitigation of PET-induced water stress, which sustains higher stomatal conductance values and amplifies SIF emissions (Figure 5a). Grasslands in these high-PET environments demonstrate particular adaptability—increased precipitation maintains optimal stomatal aperture, preferentially allocating absorbed light energy to photosynthetic electron transport rather than structural growth. This physiological optimization is reinforced by grassland-induced improvements in surface soil properties (e.g., enhanced water retention capacity), creating a positive ecohydrological feedback loop: precipitation increases boost soil moisture, further amplifying photosynthetic rates and driving high ΔRTSIF-NDVI values.
In marked contrast, forest ecosystems in chronically high-PET environments develop water conservation strategies including stomatal density reduction and leaf thickening [58,59]. These adaptive traits prove insufficient to counterbalance cumulative transpirational water losses, leading to the progressive depletion of deep soil moisture reserves. Consequently, the resulting hydrological deficit counteracts potential photosynthetic benefits in high-PET regions, imposing fundamental constraints on SIF enhancement potential. Land use patterns further reinforce these vegetation-type responses. High-PET regions, particularly the loess hilly areas of Eastern Gansu, represent priority implementation zones for farmland-to-grassland conversion programs. In these areas, restored grasslands exhibit rapid transitions to photosynthetic functional enhancement phases due to their superior water use efficiency. In contrast, afforestation efforts concentrate predominantly in low-PET areas, where the relative water abundance diminishes the marginal productivity gains from precipitation increases. Furthermore, the high mortality rates of tree plantations in high-PET marginal zones introduce systematic sampling bias in forest plots, potentially obscuring the full magnitude of PET-driven ΔRTSIF-NDVI variations in woody vegetation.
The disproportionate enhancement of photosynthetic function relative to structural expansion in high-PET grasslands suggests these ecosystems may evolve into critical carbon sink hotspots on the LP. Their carbon sequestration potential appears to be driven primarily by improved photosynthetic efficiency rather than biomass accumulation—a process potentially underestimated by traditional NDVI-based assessments [60]. In contrast, the parallel growth rates of the NDVI and SIF in forest ecosystems indicate their carbon sinks rely predominantly on existing vegetation maintenance, with a limited capacity for future expansion. Projecting current climatic trends, grasslands may assume the dominant carbon sequestration role, while forests face growing systemic vulnerabilities. Under persistent warming and humidification scenarios, the Loess Plateau’s grasslands are projected to emerge as the dominant carbon sink, whereas forest ecosystems face escalating long-term vulnerabilities that may compromise the sustainability of current productivity gains. This divergence stems from differential climate sensitivities—when afforestation surpasses the regional hydrological carrying capacity or the drought frequency increases, deep-rooted forest systems become particularly susceptible to structural collapse.

4.3. Uncertainties

This study’s interpretation of ecosystem structural–functional dynamics relies exclusively on NDVI and SIF datasets, necessitating future validation through integrated remote sensing data and ground-based measurements. Several methodological considerations warrant attention: (1) NDVI saturation effects in high-biomass ecosystems (particularly closed-canopy forests) may systematically underestimate vegetation growth, potentially inflating ΔRTSIF-NDVI magnitudes; (2) Fundamental differences in sensor methodologies contribute to measurement discrepancies—SIF provides direct quantification of photosystem II photochemical quantum yield, demonstrating a heightened sensitivity to immediate environmental fluctuations, while the NDVI primarily reflects the total chlorophyll content, whose biosynthesis involves longer physiological processes, inherently creating temporal disparities in stress response detection. Furthermore, different SIF retrieval approaches may also significantly influence the SIF data, potentially leading to divergent interpretations.
Several important limitations warrant consideration in interpreting these findings. First, the use of a fixed growing-season (April–October) may obscure phenological shifts in the NDVI and SIF responses to climate change, potentially introducing systematic bias. Secondly, a critical step involves integrating eddy covariance flux measurements to empirically validate SIF-GPP relationships across the Loess Plateau’s diverse ecosystems. Furthermore, the physiological basis for observed enhancements in photosynthetic efficiency and LUE requires targeted field experimentation to identify the underlying mechanisms. While this study highlights moisture as the dominant control for vegetation dynamics, it does not explicitly partition the relative contributions of temperature and elevated CO2 to the observed LUE and growth responses. The precise quantification of moisture’s specific role in driving NDVI-SIF decoupling therefore remains an important research gap. Finally, given the increasing frequency and intensity of extreme climate events (particularly droughts) and their disproportionate impacts on vegetation structure and function, future investigations should explicitly incorporate climate extremes when assessing ecosystem structure–function relationships to improve predictive capacity.

5. Conclusions

This study comprehensively evaluates the responses of vegetation greenness (NDVI) and photosynthetic activity (SIF) to climate change and their interrelationships across the Loess Plateau (LP) during 2001–2022. Our analyses reveal three key findings. First, both the NDVI and SIF showed significant positive trends over the 22-year period, with interannual variability predominantly controlled by moisture availability (precipitation and soil moisture). Second, under the observed warming–wetting trend, photosynthetic parameters (SIF and GPP) increased at rates two to four times faster than structural greenness (NDVI), demonstrating a climate-driven decoupling between ecosystem function and structure. Third, a spatial analysis established moisture stress as the primary determinant of structural–functional divergence (ΔRTSIF-NDVI), with increasing precipitation effectively alleviating the water limitation of vegetation, driving ecosystem-level decoupling between photosynthetic activity and canopy development. This asynchrony was particularly pronounced in grassland ecosystems, where flexible stomatal regulation enables the rapid conversion of moisture availability into enhanced light use efficiency (LUE). Contrasting with herbaceous systems, forest ecosystems exhibited constrained divergence due to conservative resource use strategies and canopy shading effects. These findings position ΔRTSIF-NDVI as a robust, physiologically grounded indicator for assessing ecological restoration quality and carbon sequestration potential across the LP. These results establish an empirical foundation for developing targeted conservation strategies that account for the LP’s evolving climate–vegetation dynamics.

Supplementary Materials

The following supporting information can be downloaded at: https://www.mdpi.com/article/10.3390/f16091375/s1, Figure S1: Spatial distributions of trends in the growing-season (April—October) NDVI and SIF on the Loess Plateau from 2001 to 2022; Figure S2: Spatial patterns of partial correlation coefficients between vegetation indices (NDVI, SIF) and climatic drivers (temperature (TEM), solar radiation (RAD), precipitation (PREC)) across the Loess Plateau (2001–2022); Figure S3: Spatial patterns of relative trends of (a) NDVI (RTNDVI), (b) SIF (RTSIF) and (c) GPP (RTGPP) on the Loess Plateau (2001–2022); Figure S4: Hydrothermal gradients of RTNDVI, RTSIF and ΔRTSIF-NDVI across the Loess Plateau (2001–2022).

Author Contributions

Conceptualization, P.L. and Y.D.; methodology, P.L.; software, J.G.; validation, P.L. and K.L.; formal analysis, J.G.; data curation, J.G. and X.D.; writing—original draft preparation, P.L. and J.G.; writing—review and editing, P.L., T.Z., P.W. and K.L.; visualization, J.G.; supervision, K.L.; project administration, P.L.; funding acquisition, P.L. All authors have read and agreed to the published version of the manuscript.

Funding

This research was funded by the National Natural Science Foundation of China (grant no. 42401128); the MOE (Ministry of Education in China) Project of Humanities and Social Sciences (grant no. 24XJCZH006); and the Natural Science Basic Research Program of Shaanxi Province of Shaanxi, China (grant no. 2022JQ-211, 2024JC-YBMS-233).

Data Availability Statement

The original contributions presented in this study are included in the article. Further inquiries can be directed to the corresponding author.

Conflicts of Interest

The authors declare no conflicts of interest.

References

  1. Poulter, B.; Frank, D.; Ciais, P.; Myneni, R.B.; Andela, N.; Bi, J.; Broquet, G.; Canadell, J.G.; Chevallier, F.; Liu, Y.Y.; et al. Contribution of semi-arid ecosystems to interannual variability of the global carbon cycle. Nature 2014, 509, 600–603. [Google Scholar] [CrossRef]
  2. Piao, S.; Wang, X.; Park, T.; Chen, C.; Lian, X.; He, Y.; Bjerke, J.; Chen, A.; Ciais, P.; Tømmervik, H.; et al. Characteristics, Drivers and Feedbacks of Global Greening. Nat. Rev. Earth Environ. 2019, 1, 14–27. [Google Scholar] [CrossRef]
  3. Fu, B.; Liu, Y.; Cao, Z.; Wang, Z.; Wu, X. Current conditions, issues, and suggestions for ecological protection and high-quality development in Loess Plateau. Bull. Chin. Acad. Sci. 2023, 38, 1110–1117. [Google Scholar]
  4. Fan, X.; Qu, Y.; Zhang, J.; Bai, E. China’s vegetation restoration programs accelerated vegetation greening on the Loess Plateau. Agric. For. Meteorol. 2024, 350, 109994. [Google Scholar] [CrossRef]
  5. Ma, Y.; Li, J.; Cao, W.; Huang, L. Grain for green program to grassland might lead to carbon sink leakage in the loess plateau. Earth’s Future 2025, 13, e2024EF005261. [Google Scholar] [CrossRef]
  6. Zheng, K.; Wei, J.Z.; Pei, J.Y.; Cheng, H.; Zhang, X.L.; Hunag, F.Q.; Li, F.M.; Ye, J.S. Impacts of climate change and human activities on grassland vegetation variation in the Chinese Loess Plateau. Sci. Total Environ. 2019, 660, 236–244. [Google Scholar] [CrossRef] [PubMed]
  7. Wang, Z.; Fu, B.; Wu, X.; Wang, S.; Li, Y.; Feng, Y.; Zhang, L.; Hu, Y.; Cheng, L.; Li, B. Distinguishing trajectories and drivers of vegetated ecosystems in China’s Loess Plateau. Earth’s Future 2024, 12, e2023EF003769. [Google Scholar] [CrossRef]
  8. Song, X.; Xie, P.; Sun, W.; Mu, X.; Gao, P. The greening of vegetation on the Loess Plateau has resulted in a northward shift of the vegetation greenness line. Glob. Planet. Change 2024, 237, 104440. [Google Scholar] [CrossRef]
  9. Gong, E.; Zhang, J.; Wang, Z.; Wang, J. Estimating the dynamics and driving factors of gross primary productivity over the Chinese Loess Plateau by the modified vegetation photosynthesis model. Ecol. Inform. 2024, 83, 102838. [Google Scholar] [CrossRef]
  10. Wu, H.; Zhou, P.; Song, X.; Sun, W.; Song, S.; Zhang, Y. Dynamics of solar-induced chlorophyll fluorescence (SIF) and its response to meteorological drought in the Yellow River Basin. J. Environ. Manag. 2024, 360, 121023. [Google Scholar] [CrossRef]
  11. Anniwaer, N.; Li, X.; Wang, K.; Xu, H.; Hong, S. Shifts in the trends of vegetation greenness and photosynthesis in different parts of Tibetan Plateau over the past two decades. Agric. For. Meteorol. 2024, 345, 109851. [Google Scholar] [CrossRef]
  12. He, L.; Guo, J.; Jiang, Q.; Zhang, Z.; Yu, S. How did the Chinese Loess Plateau turn green from 2001 to 2020? An explanation using satellite data. Catena 2022, 214, 106246. [Google Scholar] [CrossRef]
  13. Niu, Z.; He, H.; Yu, P.; Sitch, S.; Zhao, Y.; Wang, Y.; Jain, A.K.; Vuichard, N.; Si, B. Climate Change and CO2 Fertilization Have Played Important Roles in the Recent Decadal Vegetation Greening Trend on the Chinese Loess Plateau. Remote Sens. 2023, 15, 1233. [Google Scholar] [CrossRef]
  14. Li, G.; Sun, S.; Han, J.; Yan, J.; Liu, W.; Wei, Y.; Lu, N.; Sun, Y. Impacts of Chinese Grain for Green program and climate change on vegetation in the Loess Plateau during 1982–2015. Sci. Total Environ. 2019, 660, 177–187. [Google Scholar] [CrossRef]
  15. Zhang, T.; Tang, Y.; Xu, M.; Zhao, G.; Cong, N.; Zheng, Z.; Zhu, J.; Niu, B.; Chen, Z.; Zhang, Y.; et al. Soil moisture dominates the interannual variability in alpine ecosystem productivity by regulating maximum photosynthetic capacity across the Qinghai-Tibetan Plateau. Glob. Planet. Change 2023, 228, 104191. [Google Scholar] [CrossRef]
  16. Gou, Y.; Jin, Z.; Kou, P.; Tao, Y.; Xu, Q.; Zhu, W.; Tian, H. Mechanisms of climate change impacts on vegetation and prediction of changes on the Loess Plateau, China. Environ. Earth Sci. 2024, 83, 234. [Google Scholar] [CrossRef]
  17. Wang, S.; Zhang, Y.; Ju, W.; Chen, J.; Ciais, P.; Cescatti, A.; Sardans, J.; Janssens, I.; Wu, M.; Berry, J.; et al. Recent global decline of CO2 fertilization effects on vegetation photosynthesis. Science 2020, 370, 1295–1300. [Google Scholar] [CrossRef]
  18. Li, D.; Li, X.; Li, Z.; Fu, Y.; Zhang, J.; Zhao, Y.; Wang, Y.; Liu, Y.; Rossi, E. Drought limits vegetation carbon sequestration by affecting photosynthetic capacity of semi-arid ecosystems on the Loess Plateau. Sci. Total Environ. 2024, 912, 168778. [Google Scholar] [CrossRef]
  19. Tian, F.; Zhu, Z.; Cao, S.; Zhao, W.; Li, M.; Wu, J. Satellite-observed increasing coupling between vegetation productivity and greenness in the semiarid Loess Plateau of China is not captured by process-based models. Sci. Total Environ. 2024, 906, 167664. [Google Scholar] [CrossRef]
  20. Meng, F.; Liu, D.; Wang, Y.; Wang, S.; Wang, T. Negative relationship between photosynthesis and late-stage canopy development and senescence over Tibetan Plateau. Glob. Change Biol. 2023, 29, 3147–3158. [Google Scholar] [CrossRef] [PubMed]
  21. Tang, J.; Niu, B.; Hu, Z.; Zhang, X. Increasing susceptibility and shortening response time of vegetation productivity to drought from 2001 to 2021. Agric. For. Meteorol. 2024, 352, 110025. [Google Scholar] [CrossRef]
  22. Luo, Y.; Liang, W.; Yan, J.; Zhang, W.; Gou, F.; Wang, C.; Liang, X. Vegetation Growth Response and Trends after Water Deficit Exposure in the Loess Plateau, China. Remote Sens. 2023, 15, 2593. [Google Scholar] [CrossRef]
  23. Hu, Z.; Piao, S.; Knapp, A.K.; Wang, X.; Peng, S.; Yuan, W.; Running, S.; Mao, J.; Shi, X.; Ciais, P. Decoupling of greenness and gross primary productivity as aridity decreases. Remote Sens. Environ. 2022, 279, 113120. [Google Scholar] [CrossRef]
  24. Wei, F.; Wang, S.; Fu, B.; Wang, L.; Zhang, W.; Wang, L.; Nan, N.; Fensholt, R. Divergent trends of ecosystem-scale photosynthetic efficiency between arid and humid lands across the globe. Glob. Ecol. Biogeogr. 2022, 31, 1824–1837. [Google Scholar] [CrossRef]
  25. Wang, F.; Xia, J.; Zou, L.; Zhang, L.; Li, X.; Yu, J. Spatio-temporal heterogeneity and driving mechanism of ecosystem water use efficiency in the Loess Plateau, China. J. Hydrol. Reg. Stud. 2024, 56, 102012. [Google Scholar] [CrossRef]
  26. Zhang, Y.; Jiang, X.; Lei, Y.; Gao, S. The contributions of natural and anthropogenic factors to NDVI variations on the Loess Plateau in China during 2000–2020. Ecol. Indic. 2020, 143, 109342. [Google Scholar] [CrossRef]
  27. Liu, L.; Teng, Y.; Wu, J.; Zhao, W.; Liu, S.; Qiu, S. Soil water deficit promotes the effect of atmospheric water deficit on solar-induced chlorophyll fluorescence. Sci. Total Environ. 2020, 720, 137408. [Google Scholar] [CrossRef]
  28. Kimura, R.; Takayama, N. Climate of the Loess Plateau. In Restoration and Development of the Degraded Loess Plateau, China; Tsunekawa, A., Liu, G., Yamanaka, N., Du, S., Eds.; Ecological Research Monographs; Springer: Tokyo, Japan, 2014; pp. 23–33. [Google Scholar]
  29. Didan, K. MODIS/Terra Vegetation Indices 16-Day L3 Global 1km SIN Grid V061. NASA EOSDIS Land Processes DAAC. 2021. Available online: https://ladsweb.modaps.eosdis.nasa.gov/missions-and-measurements/products/MOD13A2 (accessed on 24 August 2025).
  30. Zhang, Y.; Joiner, J.; Alemohammad, S.H.; Zhou, S.; Gentine, P. A global spatially contiguous solar-induced fluorescence (CSIF) dataset using neural networks. Biogeosciences 2018, 15, 5779–5800. [Google Scholar] [CrossRef]
  31. Running, S.; Mu, Q.; Zhao, M. MOD17A2H MODIS/Terra Gross Primary Productivity 8-Day L4 Global 500m SIN Grid V006. NASA EOSDIS Land Processes Distributed Active Archive Center. 2015. Available online: https://ladsweb.modaps.eosdis.nasa.gov/missions-and-measurements/products/MOD17A2H (accessed on 24 August 2025).
  32. Peng, S.; Ding, Y.; Wen, Z.; Chen, Y.; Cao, Y.; Ren, J. Spatiotemporal change and trend analysis of potential evapotranspiration over the Loess Plateau of China during 2011–2100. Agric. For. Meteorol. 2017, 233, 183–194. [Google Scholar] [CrossRef]
  33. Peng, S. 1-km Monthly Mean Temperature Dataset for China (1901–2024); National Tibetan Plateau Data Center: Beijing, China, 2019. [Google Scholar] [CrossRef]
  34. Peng, S. 1-km Monthly Precipitation Dataset for China (1901–2024); National Tibetan Plateau/Third Pole Environment Data Center: Beijing, China, 2020. [Google Scholar] [CrossRef]
  35. Ding, Y.; Peng, S. Spatiotemporal change and attribution of potential evapotranspiration over China from 1901 to 2100. Theor. Appl. Climatol. 2021, 145, 79–94. [Google Scholar] [CrossRef]
  36. Peng, S. 1-km Monthly Potential Evapotranspiration Dataset for China (1901–2024); National Tibetan Plateau/Third Pole Environment Data Center: Beijing, China, 2022. [Google Scholar] [CrossRef]
  37. Shangguan, W.; Li, Q.; Shi, G. A 1 km Daily Soil Moisture Dataset over China Based on In-Situ Measurement (2000–2022); National Tibetan Plateau/Third Pole Environment Data Center: Beijing, China, 2022. [Google Scholar] [CrossRef]
  38. Li, Q.; Shi, G.; Shangguan, W.; Nourani, V.; Li, J.; Li, L.; Huang, F.; Zhang, Y.; Wang, C.; Wang, D.; et al. A 1 km daily soil moisture dataset over China using in situ measurement and machine learning. Earth Syst. Sci. Data 2022, 14, 5267–5286. [Google Scholar] [CrossRef]
  39. Holben, B.N. Characteristics of Maximum-Value Composite Images from Temporal AVHRR Data. Int. J. Remote Sens. 1986, 7, 1417–1434. [Google Scholar] [CrossRef]
  40. Piao, S.; Wang, X.; Ciais, P.; Zhu, B.; Wang, T.; Liu, J. Changes in satellite-derived vegetation growth trend in temperate and boreal Eurasia from 1982 to 2006. Glob. Change Biol. 2011, 17, 3228–3239. [Google Scholar] [CrossRef]
  41. Monteith, J.L. Solar Radiation and Productivity in Tropical Ecosystems. J. Appl. Ecol. 1972, 9, 747–766. [Google Scholar] [CrossRef]
  42. Behera, S.; Elakkiyaa, T.L.; Sarkar, A.; Dutta, D. Solar-induced chlorophyll fluorescence yield holds the potential for drought early warning. Geophys. Res. Lett. 2025, 52, e2024GL113419. [Google Scholar] [CrossRef]
  43. Wang, S.; Fu, B.; Wei, F.; Piao, S.T.; Maestre, F.; Wang, L.; Jiao, W.; Liu, Y.; Li, C.; Zhao, W. Drylands contribute disproportionately to observed global productivity increases. Sci. Bull. 2023, 68, 224–232. [Google Scholar] [CrossRef]
  44. Guanter, L.; Alonso, L.; Gomez-Chova, L.J.; Vila, J.A.; Moreno, J. Estimation of solar-induced vegetation fluorescence from space measurements. Geophys. Res. Lett. 2007, 34, L08401. [Google Scholar] [CrossRef]
  45. Marrs, J.K.; Reblin, J.S.; Logan, B.A.; Allen, D.W.; Reinmann, A.B.; Bombard, D.M.; Tabachnik, D.; Hutyra, L.R. Solar-induced fluorescence does not track photosynthetic carbon assimilation following induced stomatal closure. Geophys. Res. Lett. 2022, 47, e2020GL087956. [Google Scholar] [CrossRef]
  46. Chen, J.; Ju, W.; Ciais, P.; Viovy, N.; Liu, R.; Liu, Y.; Lu, X. Vegetation structural change since 1981 significantly enhanced the terrestrial carbon sink. Nat. Commun. 2019, 10, 4259. [Google Scholar] [CrossRef] [PubMed]
  47. Zhou, J.; Liu, Q.; Liang, L.; He, J.; Yan, D.; Wang, X.; Sun, T.; Li, S. More portion of precipitation into soil water storage to maintain higher evapotranspiration induced by revegetation on China’s Loess Plateau. J. Hydrol. 2022, 615, 128707. [Google Scholar] [CrossRef]
  48. Su, H.; Liu, W.; Li, Y.G. Ecological implications of hydraulic redistribution in nutrient cycling of soil-plant system. Chin. J. Plant Ecol. 2014, 38, 1019–1028. [Google Scholar]
  49. Xi, X.; Yuan, X. Significant water stress on gross primary productivity during flash droughts with hot conditions. Agric. For. Meteorol. 2022, 324, 109100. [Google Scholar] [CrossRef]
  50. Peng, J.; Tang, J.; Xie, S.; Wang, Y.; Liao, J.; Chen, C.; Sun, C.; Mao, J.; Zhou, Q.; Niu, S. Evidence for the acclimation of ecosystem photosynthesis to soil moisture. Nat. Commun. 2024, 15, 9795. [Google Scholar] [CrossRef] [PubMed]
  51. Ma, R.; Cui, X.; Wang, D.; Wang, S.; Wang, H.; Yao, X.; Li, S. Spatial and Temporal Characteristics of Water Use Efficiency in Typical Ecosystems on the Loess Plateau in the Last 20 Years, with Drivers and Implications for Ecological Restoration. Remote Sens. 2022, 14, 5632. [Google Scholar] [CrossRef]
  52. Kong, D.; Miao, C.; Wu, J.; Zheng, H.; Wu, S. Time lag of vegetation growth on the Loess Plateau in response to climate factors: Estimation, distribution, and influence. Sci. Total Environ. 2020, 744, 140726. [Google Scholar] [CrossRef]
  53. Deng, Y.; Wang, X.; Wang, K.; Ciais, P.; Tang, S.; Jin, L.; Li, L.; Piao, S. Responses of vegetation greenness and carbon cycle to extreme droughts in China. Agric. For. Meteorol. 2021, 298–299, 108307. [Google Scholar] [CrossRef]
  54. Hou, X.; Zhang, B.; Chen, J.; Zhou, J.; He, Q.-Q.; Yu, H. Response of Vegetation Productivity to Greening and Drought in the Loess Plateau Based on VIs and SIF. Forests 2024, 15, 339. [Google Scholar] [CrossRef]
  55. Zhou, J.; Liu, Q.; Liang, L.; Yan, D.; Yang, Y.; Wang, X.; Sun, T.; Li, S.; Gan, L.; Wu, J. Water constraints enhanced by revegetation while alleviated by increased precipitation on China’s water-dominated Loess Plateau. J. Hydrol. 2024, 640, 131731. [Google Scholar] [CrossRef]
  56. Dang, H.; Li, J.H.; Xu, J.S.; Xu, J.; Chu, G.; Zhang, J.; Yu, Y.; Jin, Z. Differences in soil water and nutrients under catchment afforestation and natural restoration shape herbaceous communities on the Chinese Loess Plateau. For. Ecol. Manag. 2022, 505, 119925. [Google Scholar] [CrossRef]
  57. Fu, B.; Wang, S.; Liu, Y.; Liu, J.; Liang, W.; Mioa, C. Hydrogeomorphic ecosystem responses to natural and anthropogenic changes in the Loess Plateau of China. Annu. Rev. Earth Planet. Sci. 2017, 45, 223–243. [Google Scholar] [CrossRef]
  58. Jian, S.; Zhao, C.; Fang, S.; Yu, K. Effects of different vegetation restoration on soil water storage and water balance in the Chinese Loess Plateau. Agric. For. Meteorol. 2015, 206, 85–96. [Google Scholar] [CrossRef]
  59. Liu, Y.; Miao, H.-T.; Huang, Z.; Cui, Z.; He, H.; Zheng, J.; Han, F.; Chang, X.; Wu, G. Soil water depletion patterns of artificial forest species and ages on the Loess Plateau (China). For. Ecol. Manag. 2018, 417, 137–143. [Google Scholar] [CrossRef]
  60. Li, B.; Zhang, W.; Li, S.; Wang, J.; Liu, G.; Xu, M. Severe depletion of available deep soil water induced by revegetation on the arid and semiarid Loess Plateau. For. Ecol. Manag. 2021, 491, 119156. [Google Scholar] [CrossRef]
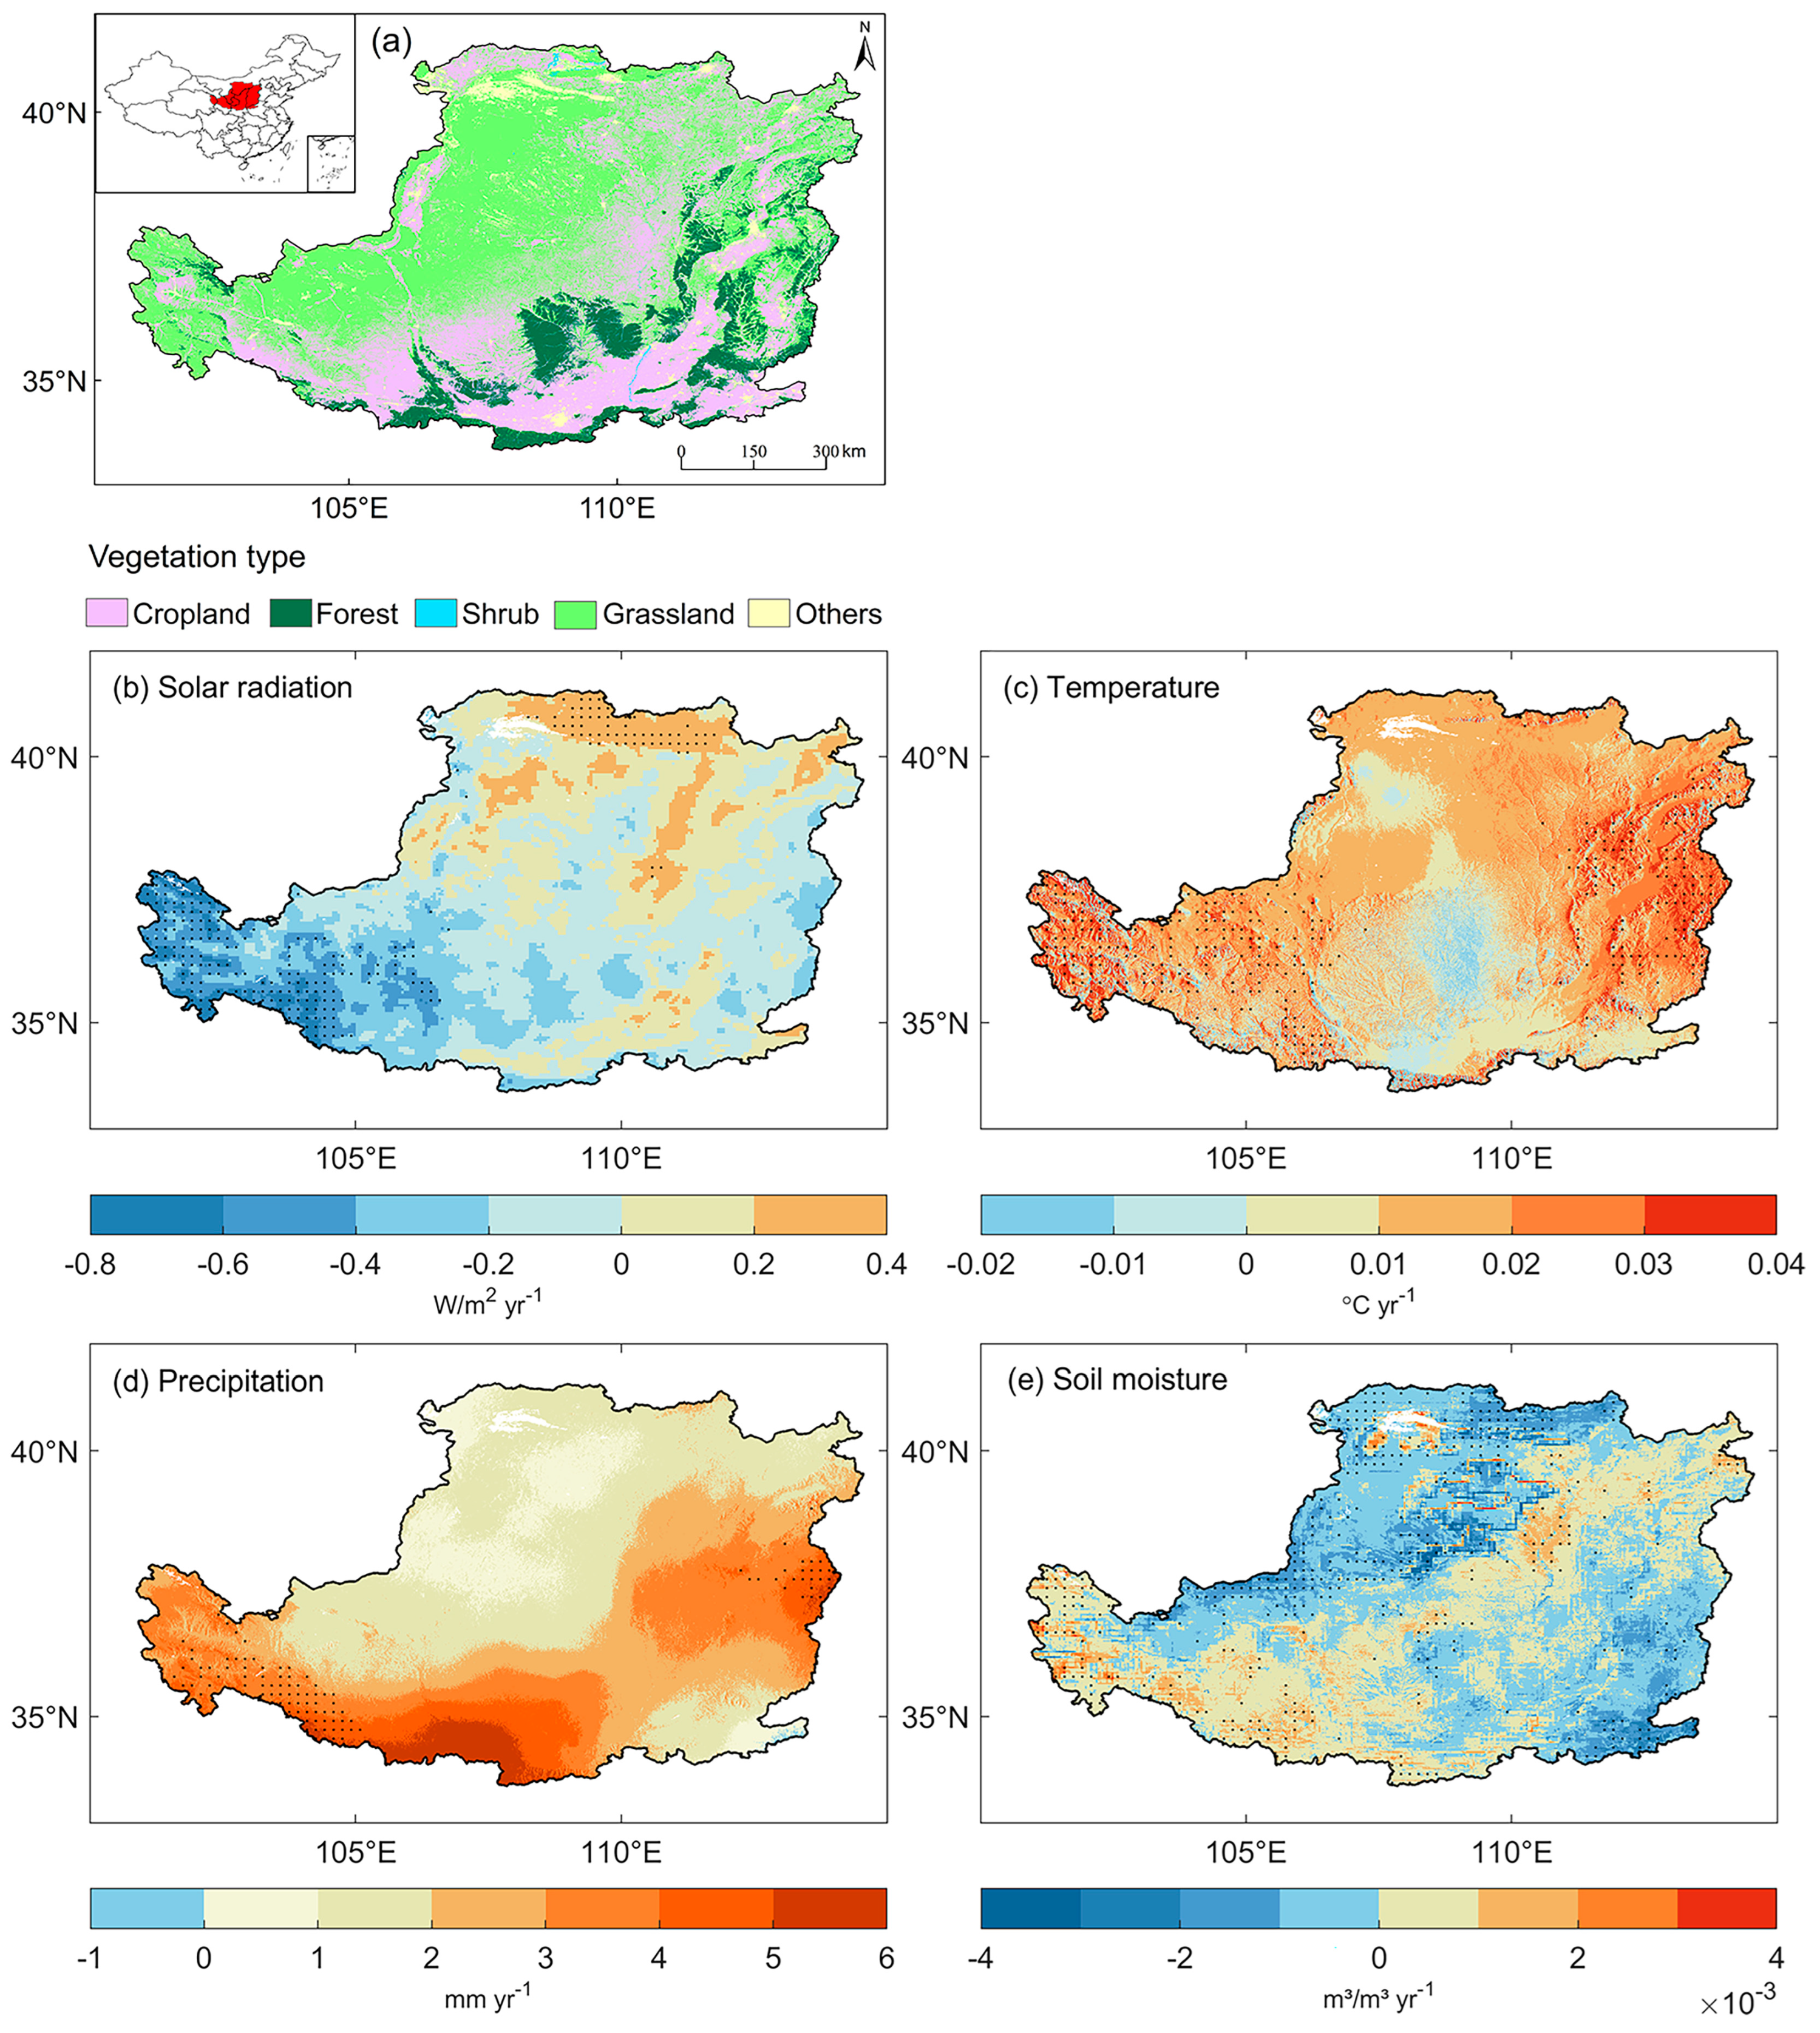
Figure 1. The geographical location of the Loess Plateau (LP) and the spatial patterns of temporal trends in climate factors from 2001 to 2022 (data sources of vegetation cover and climate data can be found in Section 2.2). (a) Geographic location and vegetation cover types of the LP. Temporal trends in growing-season (b) solar radiation, (c) temperature, (d) precipitation, and (e) soil moisture. Black dots indicate significant temporal trends (p < 0.05).
Forests 16 01375 g001
Figure 2. Spatiotemporal patterns of vegetation structural and functional changes on the Loess Plateau (2001–2022). Relative trends of (a) NDVI (RTNDVI), (b) SIF (RTSIF) with statistically significant trends (p < 0.05) denoted by black dots, and (d) their divergence (ΔRTSIF-NDVI). (c) Four possible combinations of NDVI-SIF trend relationships (symbols represent: ‘+’ = positive trend, ‘−’ = negative trend). (e) Proportional distribution of NDVI-SIF trend combinations among plant functional groups. (f) Comparative analysis of RTNDVI, RTSIF, and ΔRTSIF-NDVI across different vegetation types.
Forests 16 01375 g002
Figure 3. Spatial patterns of partial correlation coefficients between vegetation indices (NDVI and SIF) and climatic drivers (temperature (TEM), solar radiation (RAD), and soil moisture (SM)) across the Loess Plateau (2001–2022). Statistically significant correlations (p < 0.05) are denoted by black dots. Missing SIF data for particular years account for the additional blank regions in panels (df).
Forests 16 01375 g003
Figure 4. Hydroclimatic controls on vegetation dynamics: water availability gradients of RTNDVI, RTSIF, and ΔRTSIF-NDVI across the Loess Plateau (2001–2022). Water availability is quantified by the balance between precipitation (P) and potential evapotranspiration (PET), representing the regional moisture supply–demand equilibrium.
Forests 16 01375 g004
Figure 5. Variations in RTNDVI, RTSIF, and ΔRTSIF-NDVI across PET gradients among plant functional groups in the Loess Plateau (2001–2022).
Forests 16 01375 g005
Table 1. Summary of the data sources used in this study.
Data ClassIndex NameData NameData ResolutionData Range Data Source
Spatial Temporal
GreennessNDVIMOD13A2V0611 × 1 km16 days2001–2022NASA
ProductivitySIFCSIF0.05° × 0.05°4 days2001–2022(Zhang et al., 2018) [30]
GPPMOD17A2HV0600.05° × 0.05°8 days2001–2021NASA
MeteorologyTemperature (TEM)China 1 km meteorology1 × 1 kmmonthly2001–2022TPDC
Precipitation (PRE)
Potential evapotranspiration
(PET)
Soil moisture (SM)
Solar radiationDownward shortwave radiation0.05° × 0.05°daily2001–2022GLASS
LandcoverLandcoverESA CCI-LC300 × 300 myear2015ESA
ElevationDEMASTER GDEM v230 × 30 m2009USGS
Disclaimer/Publisher’s Note: The statements, opinions and data contained in all publications are solely those of the individual author(s) and contributor(s) and not of MDPI and/or the editor(s). MDPI and/or the editor(s) disclaim responsibility for any injury to people or property resulting from any ideas, methods, instructions or products referred to in the content.