1. Introduction
Forests have a fundamental role in the global carbon cycle [
1], landscape architecture, and human well-being due to their social, ecological, and economic value [
2,
3]. In 2018–2020, Romania’s natural heritage included approximately 6.9 million hectares (ha) of forest [
4,
5], covering about 29% of the country’s total area [
6]. The importance of forests is particularly evident in areas like Romania’s Gârda Forest, located in the Apuseni Mountains, where rich biodiversity and ecological challenges demand sustainable management [
7,
8]. Although Romania has the largest area of ancient, old-growth forests in the European Union (EU) [
9], inadequate forest management remains a main threat to the forest [
10,
11]. Between 2000 and 2010, Romania’s old-growth forest cover was reduced by 1% (2720 ha), highlighting the need to safeguard these forests [
11] and to develop new management approaches to ensure their effective conservation [
12].
In 2007, 67 Natura 2000 sites in the Apuseni Mountains were declared protected areas [
13], imposing restrictions on timber harvesting [
10]. These measures negatively affected the rural mountain communities, particularly in the Apuseni Natural Park, where residents traditionally rely on woodworking, forestry, and the sale of wood products for their livelihoods [
14]. This created tension between conservation efforts and local economic needs, a globally relevant issue [
12]. A growing trend in conservation focuses on integrating local community needs and involving residents in forest planning and management [
12], but this has not been the case in the Apuseni Mountains. As a result, many residents have migrated, leading to a lack of workforce and serious consequences for forest stewardship.
The state-owned forestry fund managed by the Gârda Forest District covers 11,080.15 ha, divided into six production units (PUs), as follows: PU I: Magura; PU III: Iarba Rea; PU IV: Biharia; PU V: Arieseni; PU VI: Gârda Seaca; and PU VII: Scarisoara [
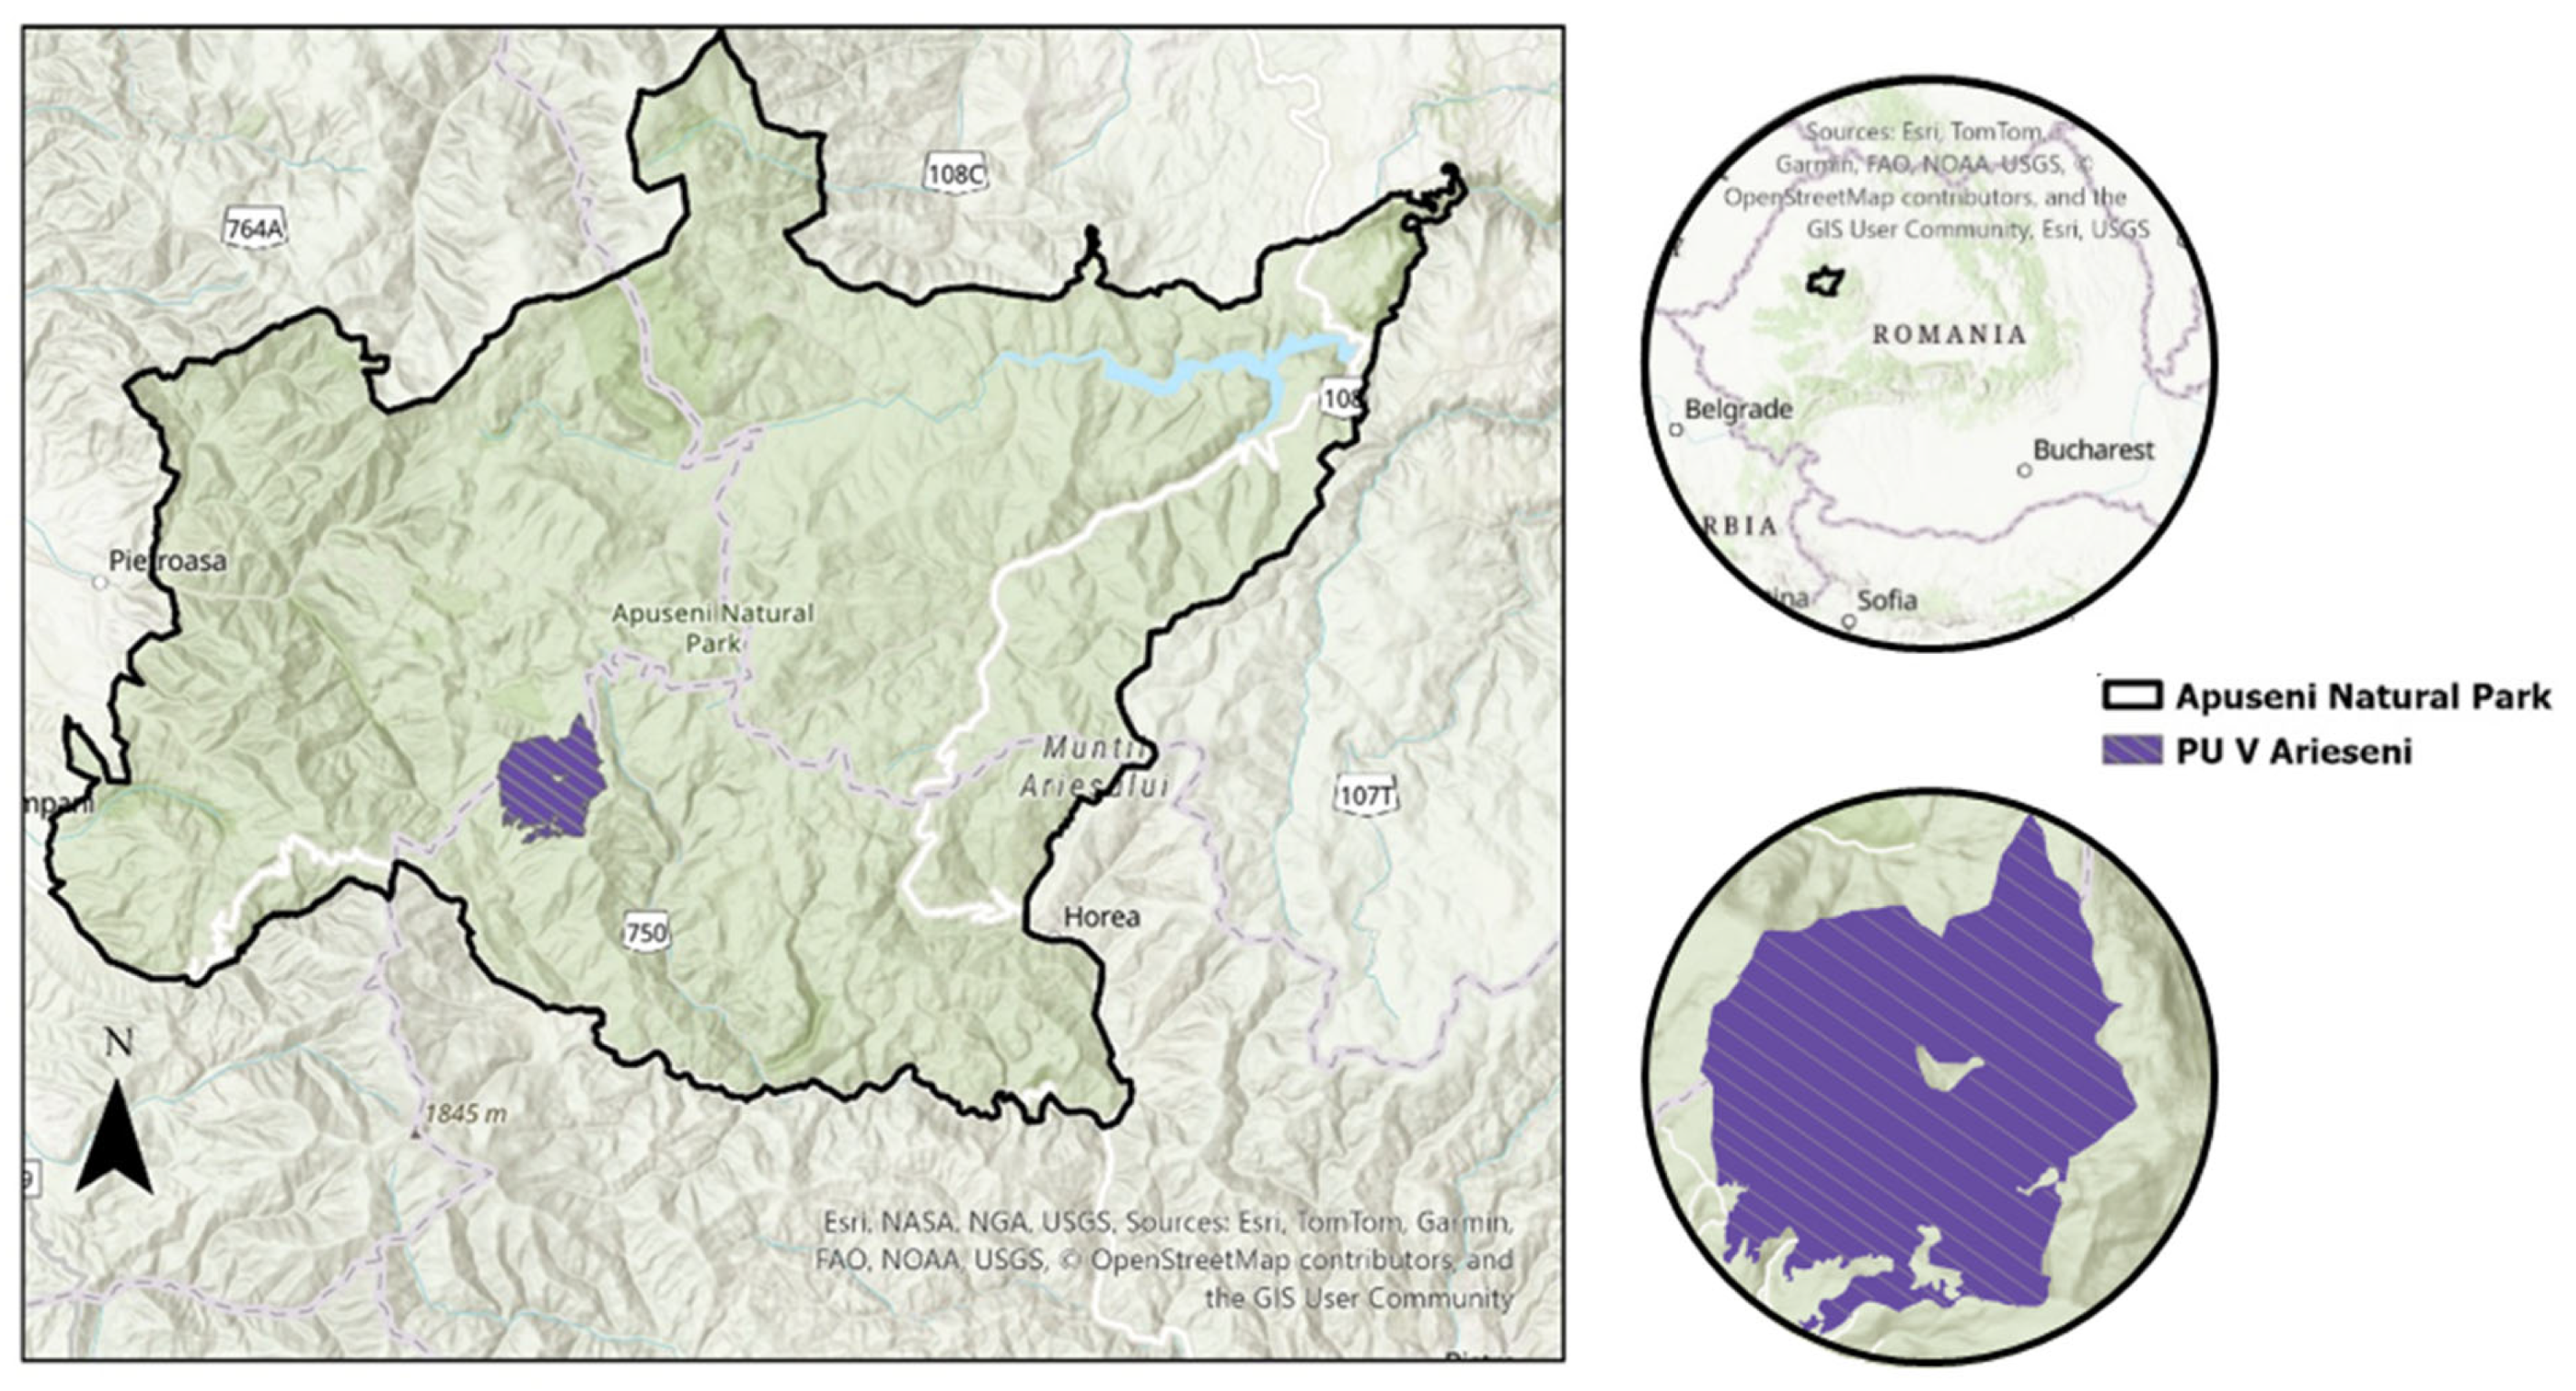
15]. Our research focuses on PU V Arieseni, a state-owned forest east of Alba County, in the Biharia Massif [
15]. In Romania, forest conservation is a top priority in forestry legislation and forest management planning [
5]. Chapters 8 and 9 of the Gârda Forest District Management Plan [
15] (pp. 220–324) detail “forest protection” and “biodiversity conservation measures”. Conservation is a key objective, achieved through both general and specific management measures. General measures include proper and timely tree care, timber harvesting, and regeneration work. Specific measures include protection against wind and snow damage, fire, disease, and pests; managing stands damaged by logging, landslides, or wildlife; and treatments for stands on rocky terrain or peat swamps [
15].
Given the forest’s multiple functions (e.g., production, protection, ecological balance), many stakeholders are involved, often with conflicting goals [
1,
2,
8,
16]. The Forest Management Plan (FMP) provides the general framework for all stakeholders [
8,
10,
11,
16]. The FMP is a complex, paper-based document, often hundreds of pages long, containing descriptive information with no spatial references. Each forest engineer must interpret it independently. In addition to the descriptive information referring to the entire PU, the FMP includes tables describing each compartment, found in the “Compartment Description” section (
Figure S1). Additionally, the forest stand map is a paper map typically extended on nine A4-size sheets mounted on canvas and repeatedly folded, making it prone to stretching and degradation over time. These limitations reduce the efficiency and accuracy of forest engineers and decision-makers.
Forest engineers update the FMP every 10 years. During this period, all forestry operations are hand-recorded in an annex to each compartment of the FMP, including work type, extracted forest volume (m
3), intervention area (ha), and species group. This data is consolidated into a final report, when the 10 years end, which means duplicated work. The Ministry of Environment, Waters, and Forests oversees the national forest fund and approves FMPs [
17]. Applying a Geographic Information System (GIS) would enable faster, more targeted data access through spatial analysis, and would greatly simplify FMP updates.
The lack of digital forest resource data [
18] and poor data interoperability, management, and analysis are major challenges. To address this, the EU launched the INSPIRE Directive (Infrastructure for Spatial Information in the European Community) to improve geospatial data sharing, availability and interoperability across Europe [
19]. The GIS plays a key role in spatial analysis of forest data, making it an ideal tool for implementing INSPIRE. It enables data harmonization, decision-making and planning, monitoring, reporting, data sharing, accessibility, and policy support.
Successful forest management depends on multiple factors. One is the FMP, which creates a foundation for innovative analysis and strategic decision-making [
20]. Another is the GIS, used in harvest planning, resource management, map production, fire management, strategic planning and modeling [
21]. In Romania, forest management remains largely traditional and descriptive, based on the FMP. This presents challenges for managers, policymakers, and other stakeholders who must process and update large volumes of data. A GIS helps address this by integrating and analyzing complex datasets efficiently.
The digitalization of the FMP has started in Romania [
22], but progress is limited. Existing webmaps are designed for public use and lack the functionality forest engineers need for analyses and updates (because webmaps do not have the widgets necessary for analyses and updates). Compartment polygons are generalized for faster loading of the webmap. Although digital maps are available on mobile devices in the field, they only show spatial boundaries, not FMP-specific data. Most forestry districts still rely on paper FMPs. Some early efforts to digitize FMPs include Vesa Forest’s GIS-based management services and partial GIS implementation by private districts in Romuli [
23] and Ardud [
24]. The Romanian Foresters Association (ASFOR) has also shown interest in supporting digital FMPs [
25]. Romania’s National Forest Strategy 2030 [
26] includes goals for integrating biodiversity conservation and using economic tools to support the local communities—objectives that require converting FMP data into geodatabases. A GIS strategy aligned with the FMP and INSPIRE Directive would narrow the gap between Romania and other countries and promote better decision-making at all levels.
Globally, FMPs address regeneration, care, timber harvesting, and socio-economic issues in forest-adjacent communities. However, GIS is typically used to address individual management issues such as timber extraction and harvested forest volume [
16,
27], environmental monitoring [
7,
18,
28,
29,
30,
31,
32], recreation [
7], risk assessment [
33] and decision-making [
33,
34]. In Romania, GIS applications have focused on isolated topics such windthrow mapping [
35], calculation of tree and allowable cut volumes [
27], biodiversity and landslide risk [
36], species distribution [
37], land receding of forested areas [
38], forest favorability [
39], or fire risk modeling [
40]. Few studies [
41,
42] explore how integrating digital FMPs into GISs can improve forest management holistically. Our study fills this current specific gap by showing how multiple management concerns (e.g., forest care, regeneration, timber harvesting, and economics) can be combined in a single GIS. This integrated approach allows better assessment of the forest structure, dynamics, and evolution trends. Spatial forest management also improves predictability and supports more effective planning and decision-making [
7,
16].
There are very few spatial analysis studies on the Apuseni Mountains. One study assessed annual forest coverage changes in the Apuseni Natural Park (2000–2014) [
28]; another examined habitat changes in the region [
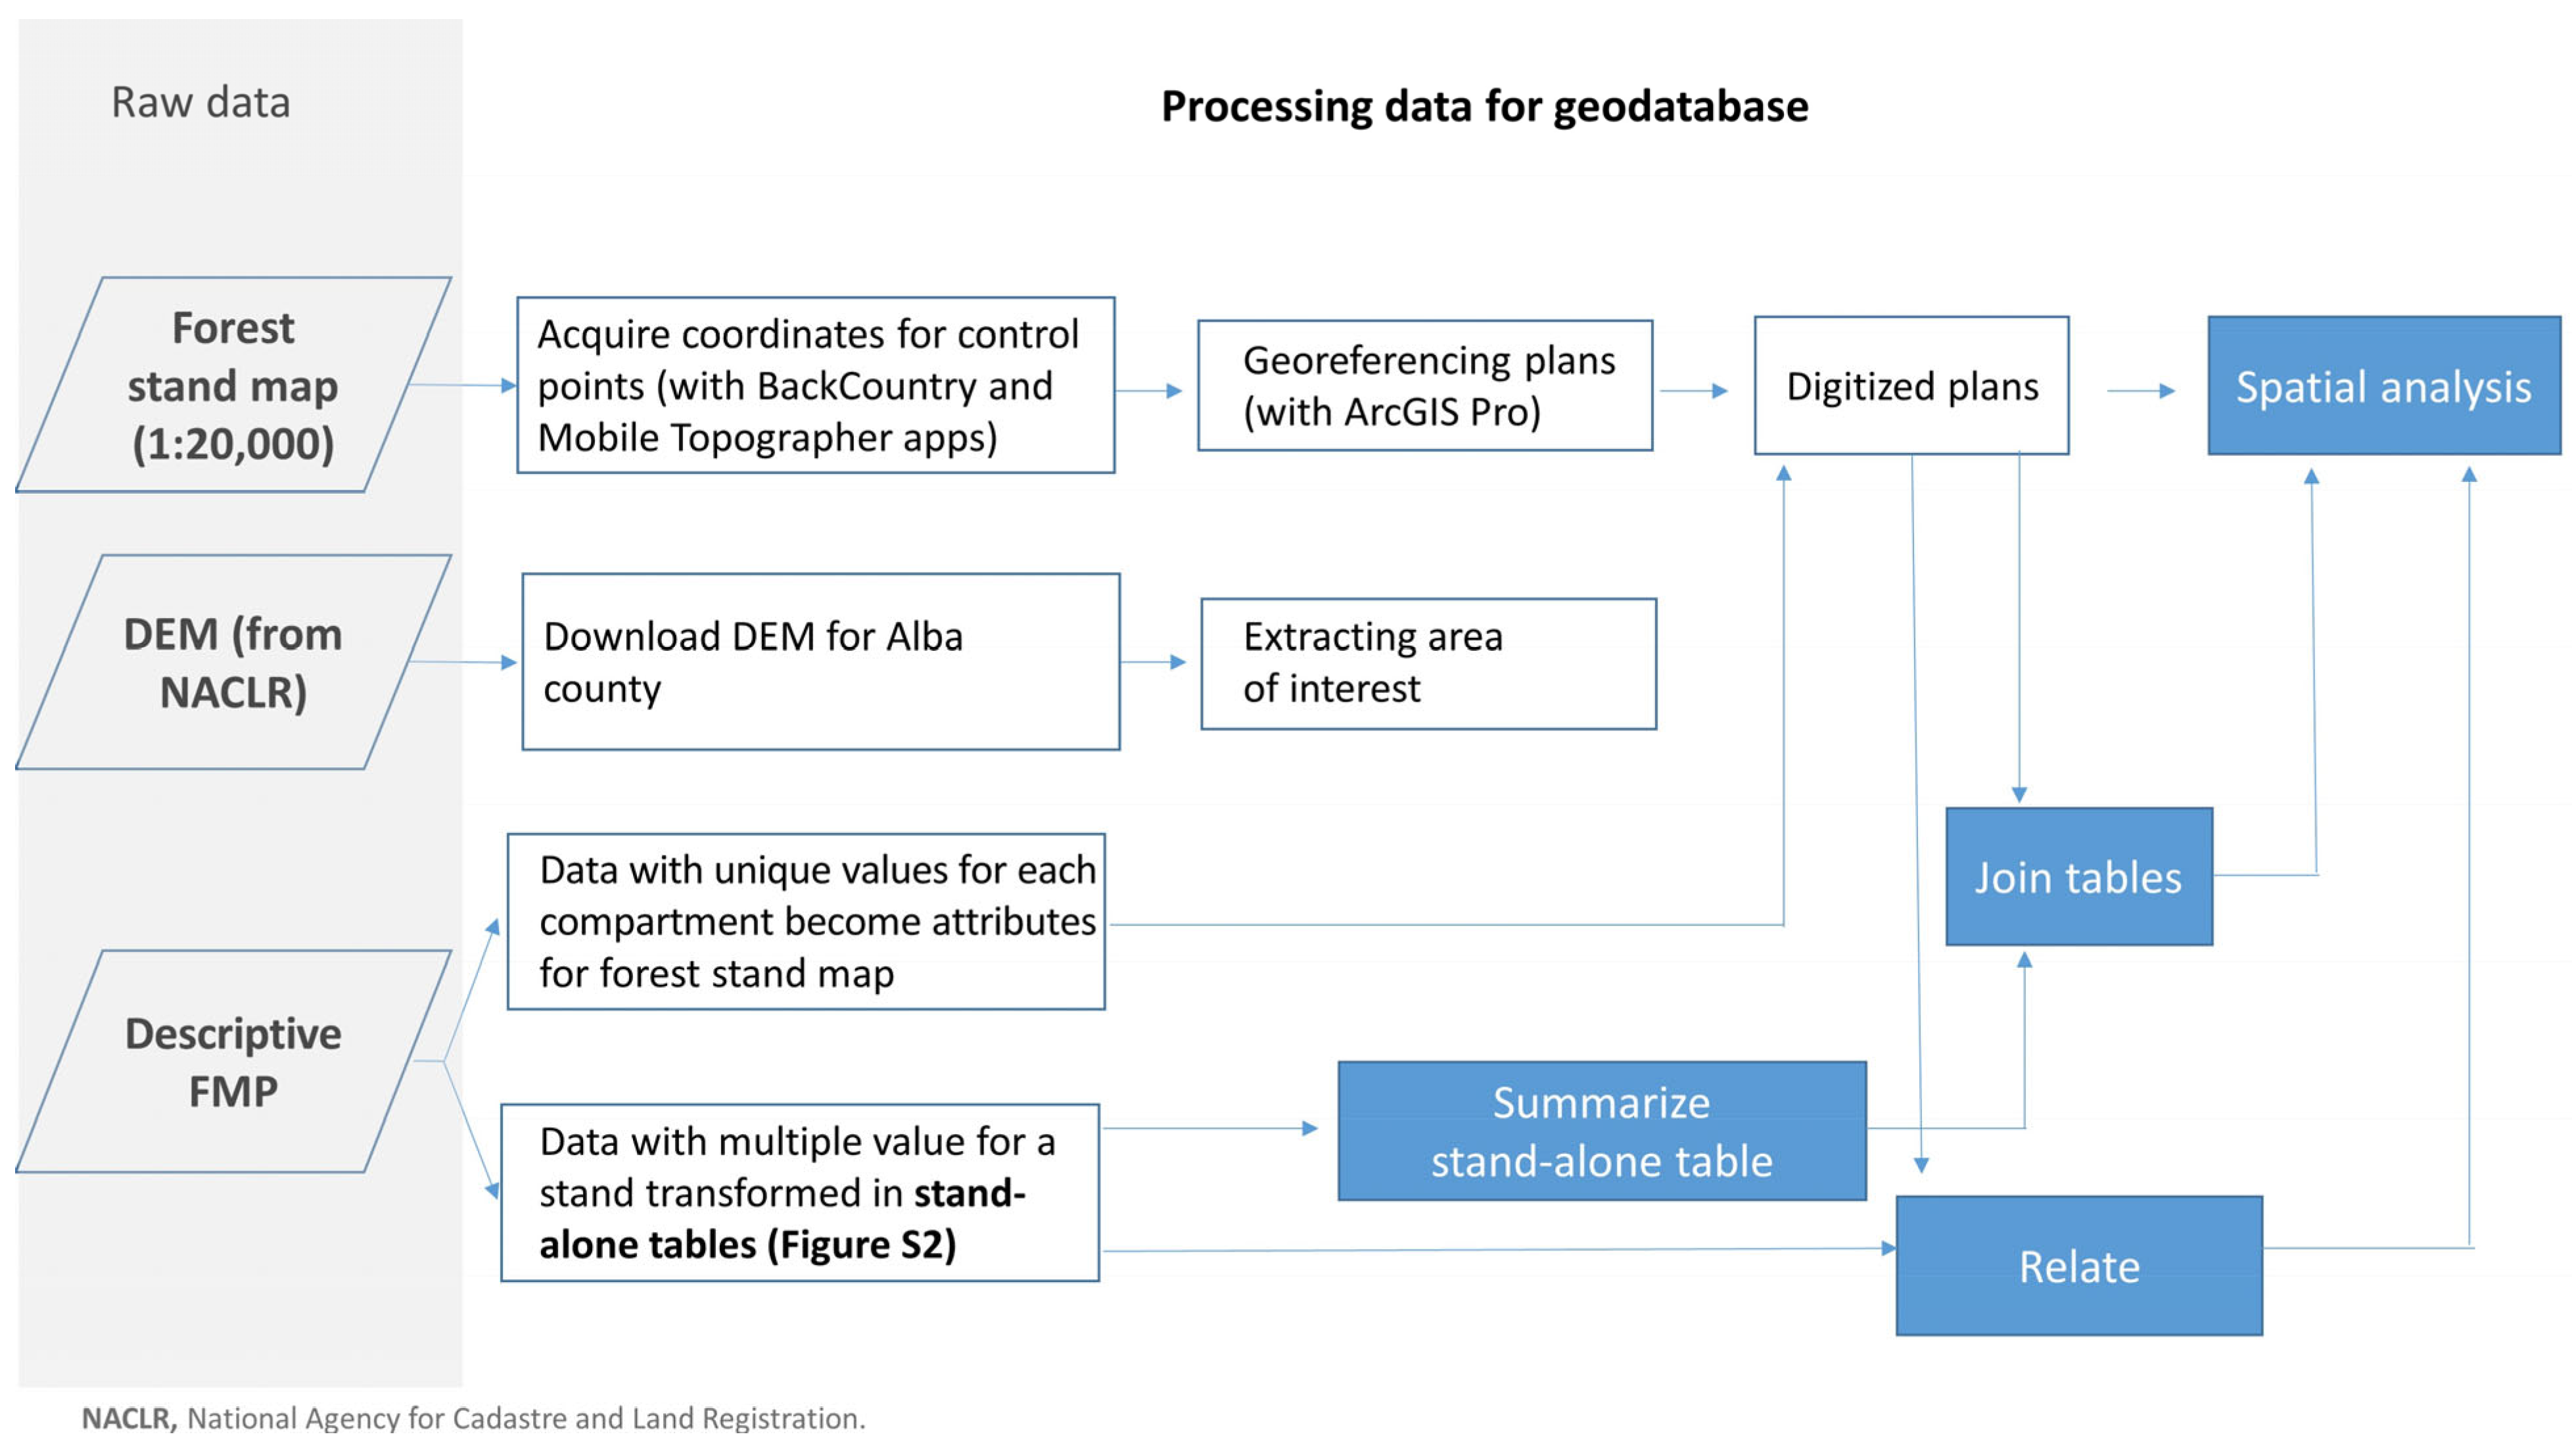
13]. Our study addresses this knowledge gap by evaluating how forest management in Romania can be improved using GIS-based spatial analysis. We aimed to design a GIS that supports forest engineers and stakeholders in their management decisions. Specific goals of the research included integrating descriptive tables, a georeferenced forest stand map, and a Digital Elevation Model (DEM) of the studied area into a GIS that enables spatial analysis of (i) forest composition by compartment, (ii) present and target compositions, (iii) compartments with the youngest trees by species and composition, (iv) forest site type per compartment, (v) surface analysis, (vi) regeneration dynamics, (vii) forest volume per compartment, (viii) production or protection sub-units, (ix) average age of production unit compartments, and (x) type of proposed silvicultural treatments per compartment.
To ensure sustainability, our research focused on aligning ecological functions of forest with the needs of the local communities and broader economic interests like wood exploitation. Spatial analysis demonstrated that these objectives can be achieved simultaneously, and are, in fact, mutually reinforcing. The proposed GIS-based forest management system contributes to achieving the Sustainable Development Goals [
43] adopted by the United Nations in 2015. Specifically, it supports goal 1, “No Poverty”, by prompting rational timber use, and goal 15, “Life and Land”, through sustainable forest management and resilient ecosystem use. This study represents a synergy of technology, ecology, and practical forest management, aimed at protecting Romania’s valuable natural resources while supporting the development of forest-dependent communities.
3. Results
We structured our results in a way that highlights both the environmental sustainability and economic viability of forest management. Based on data integration and spatial analysis, the key addresses forest composition and structure, site characteristics and environmental factors, regeneration dynamics and sustainability, forest productivity and economic performance, silvicultural treatments, and management planning. Each result is based on a spatial analysis or a sequence of spatial analyses. To highlight differences between compartments, data were statistically characterized where appropriate to complement the maps and avoid visual clutter.
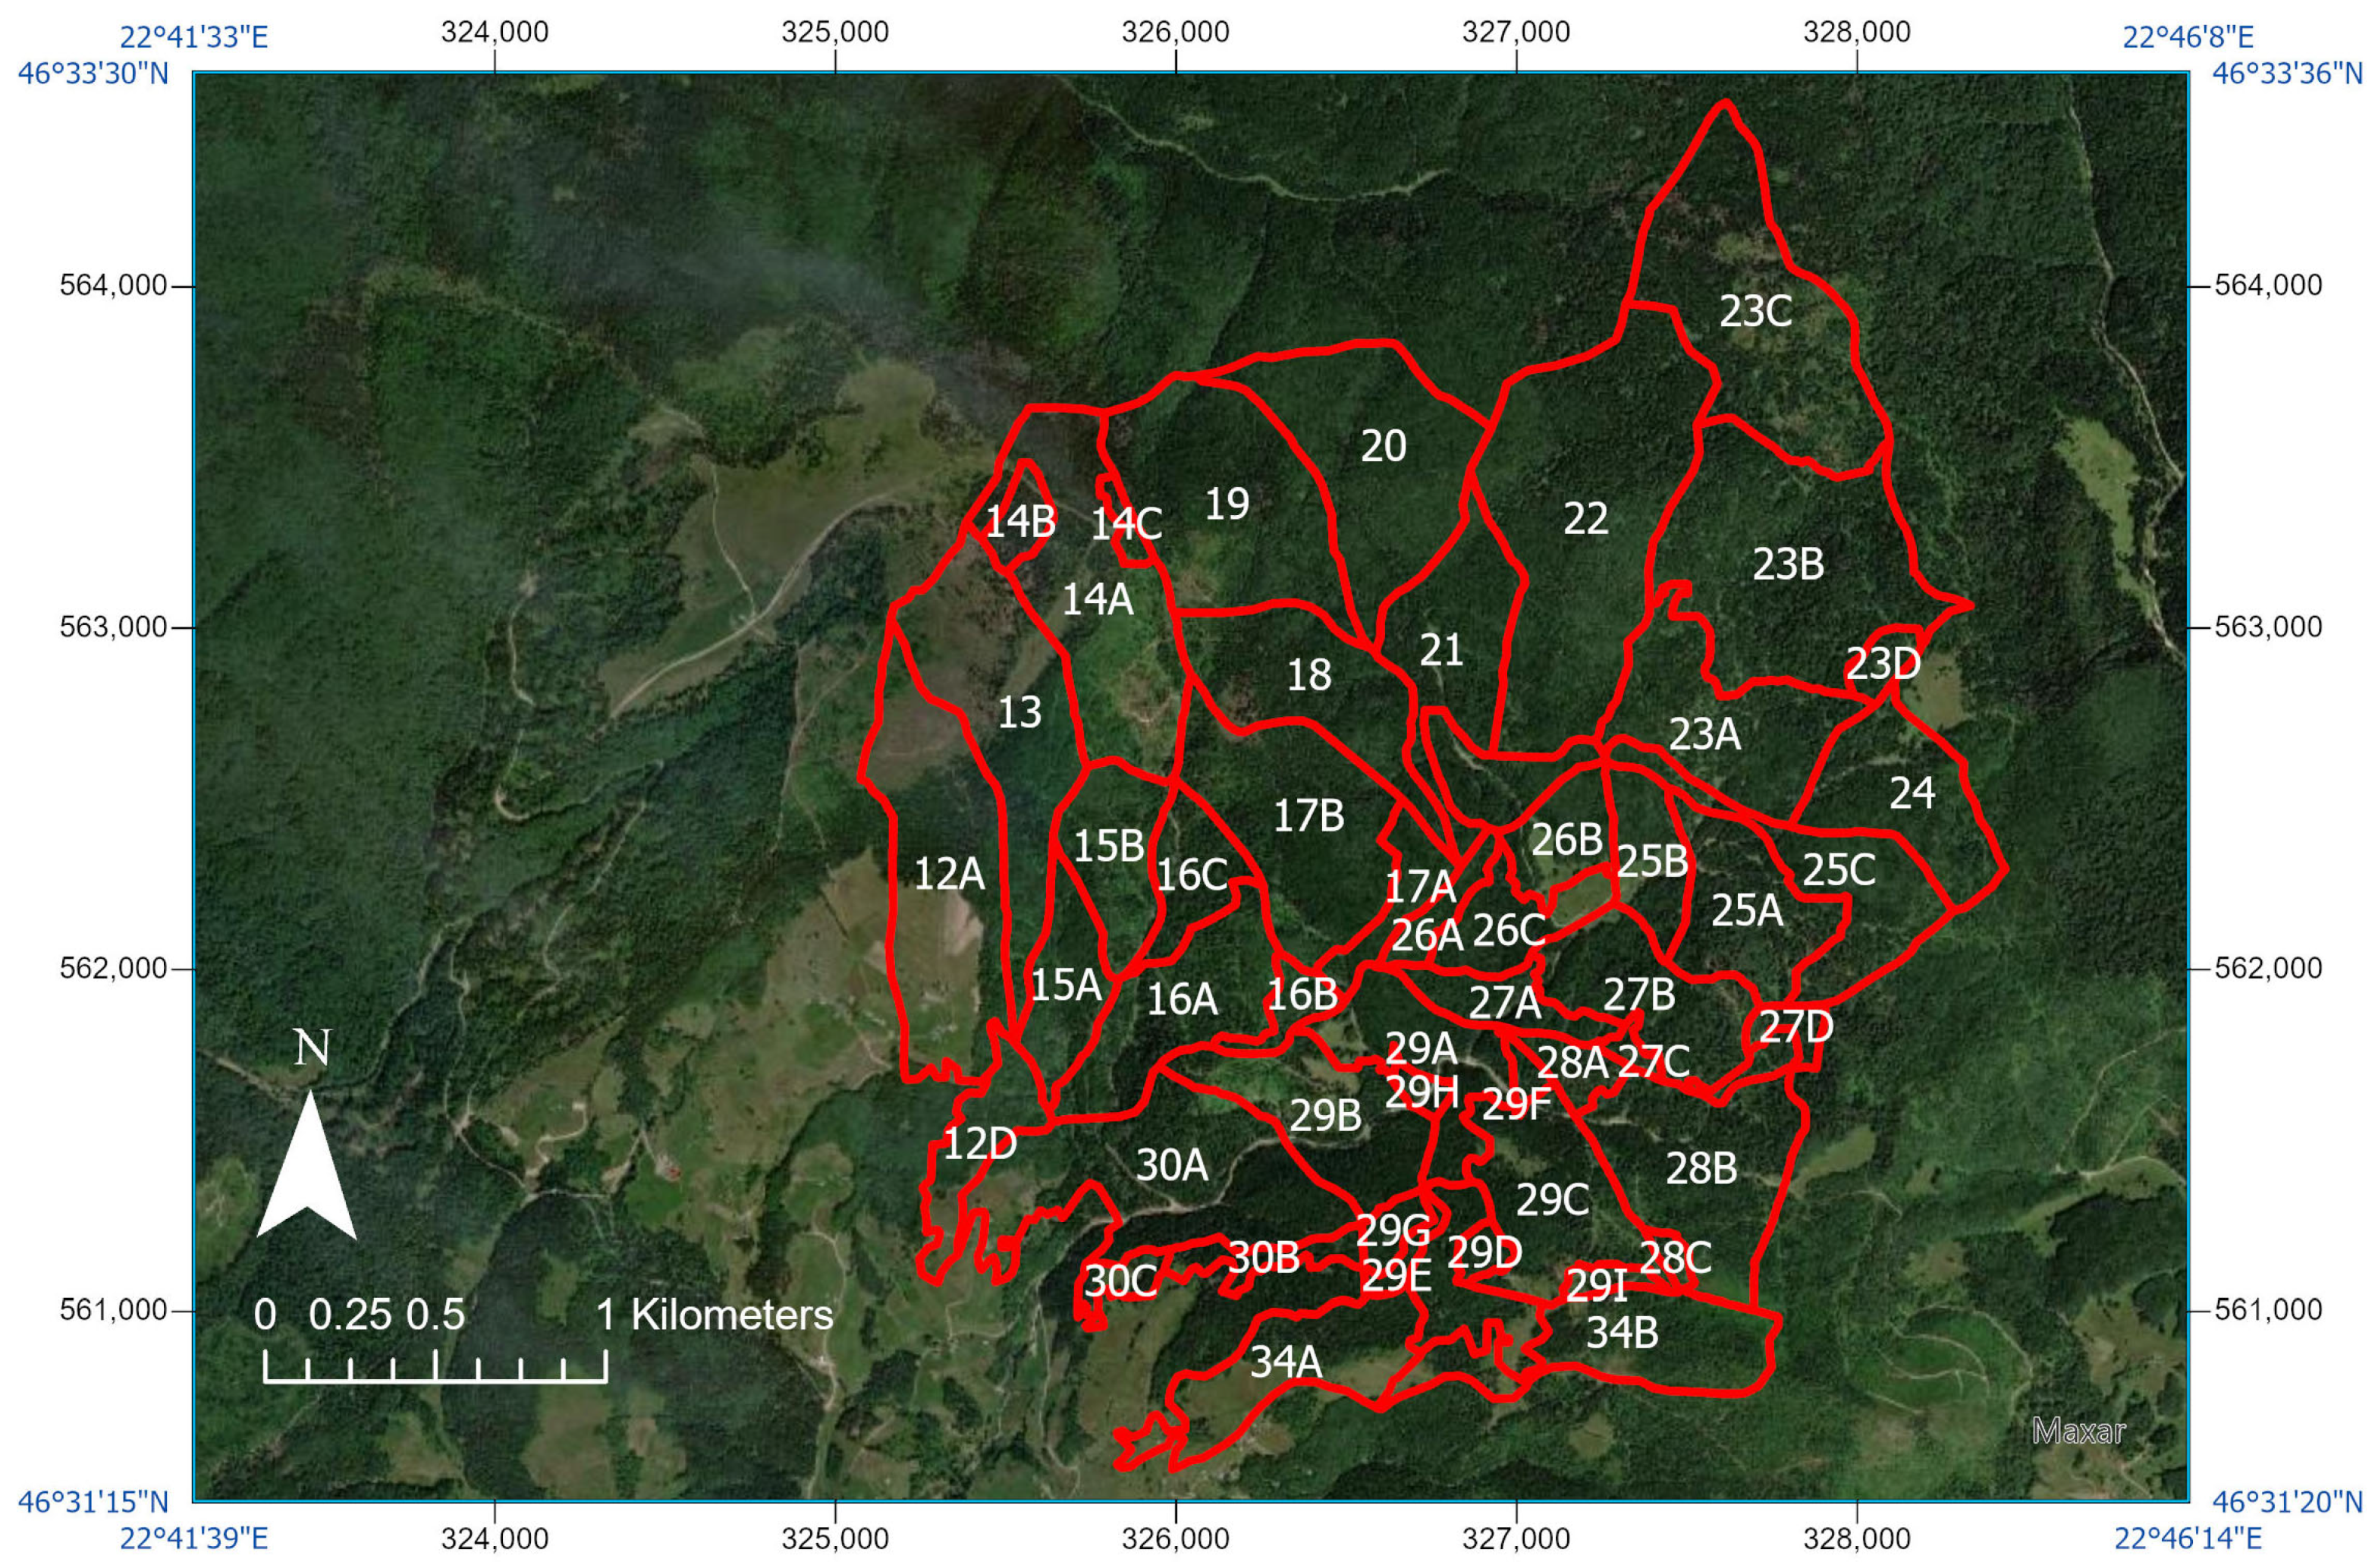
We designed the GIS and analyzed spatial data for 50 compartments (
Figure 3) covering 752.5 ha of PU V Arieseni, for which data were available.
Privately owned forests cover 130.6 ha of PU V, but data for these areas were not available. The smallest compartment is 28C, with an area of 1.2 ha, and the largest is compartment 22, with an area of 53.8 ha.
3.1. Forest Composition and Structure
3.1.1. Distribution of Tree Species by Compartment: Present and Target Composition
Optimizing stand composition is one of the objectives of the FMP. We analyzed the present distribution of tree species and the forest composition from a spatial perspective.
The actual composition and the target composition for each compartment are included in the FMP, expressed as the percentage of dominant species participation and of the area’s most valuable species, from an ecological and economic point of view. The FMP also addresses efforts to reduce destabilizing factors such as uprooting and breakage caused by strong winds and heavy snowfall. The dominant species found in the studied area are Norway spruce (Picea abies), silver fir (Abies alba), and beech (Fagus sylvatica), with Norway spruce present in all compartments. The target composition refers to the structure and diversity of tree species intended when the stand reaches maturity. It reflects the optimal proportion of species that best balance the biological needs of the forest with socio-economic objectives throughout the stand’s development.
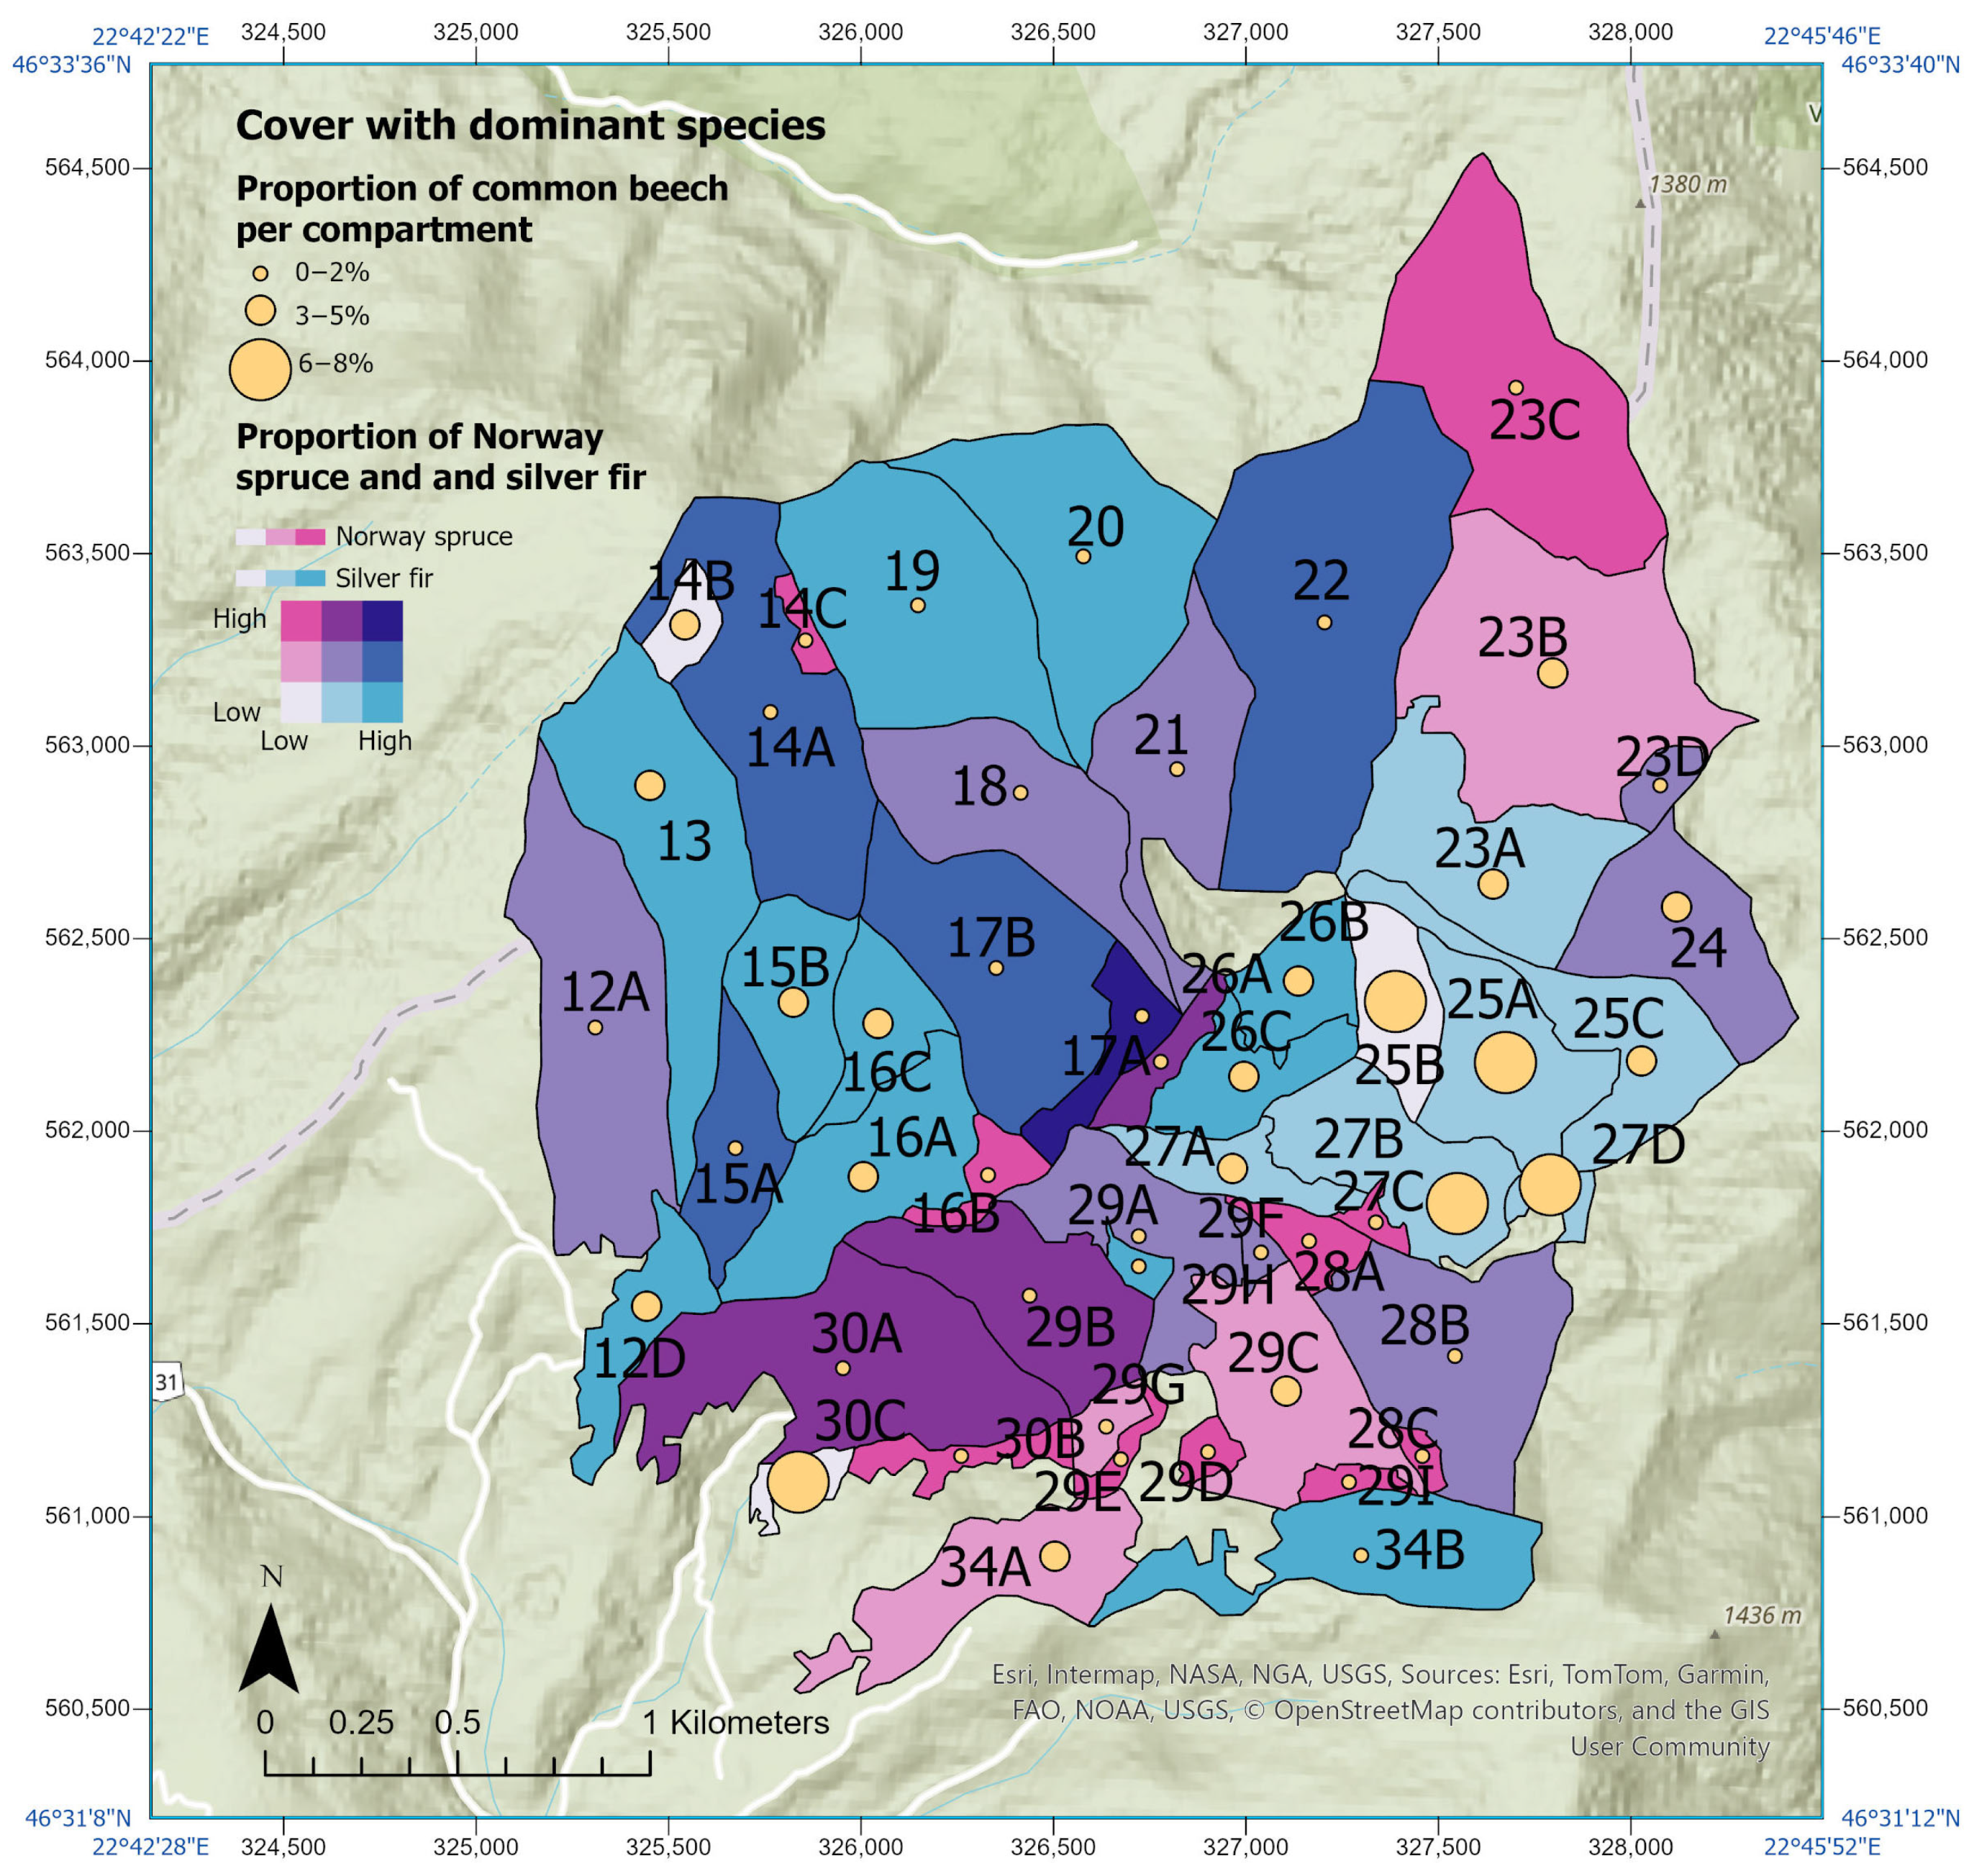
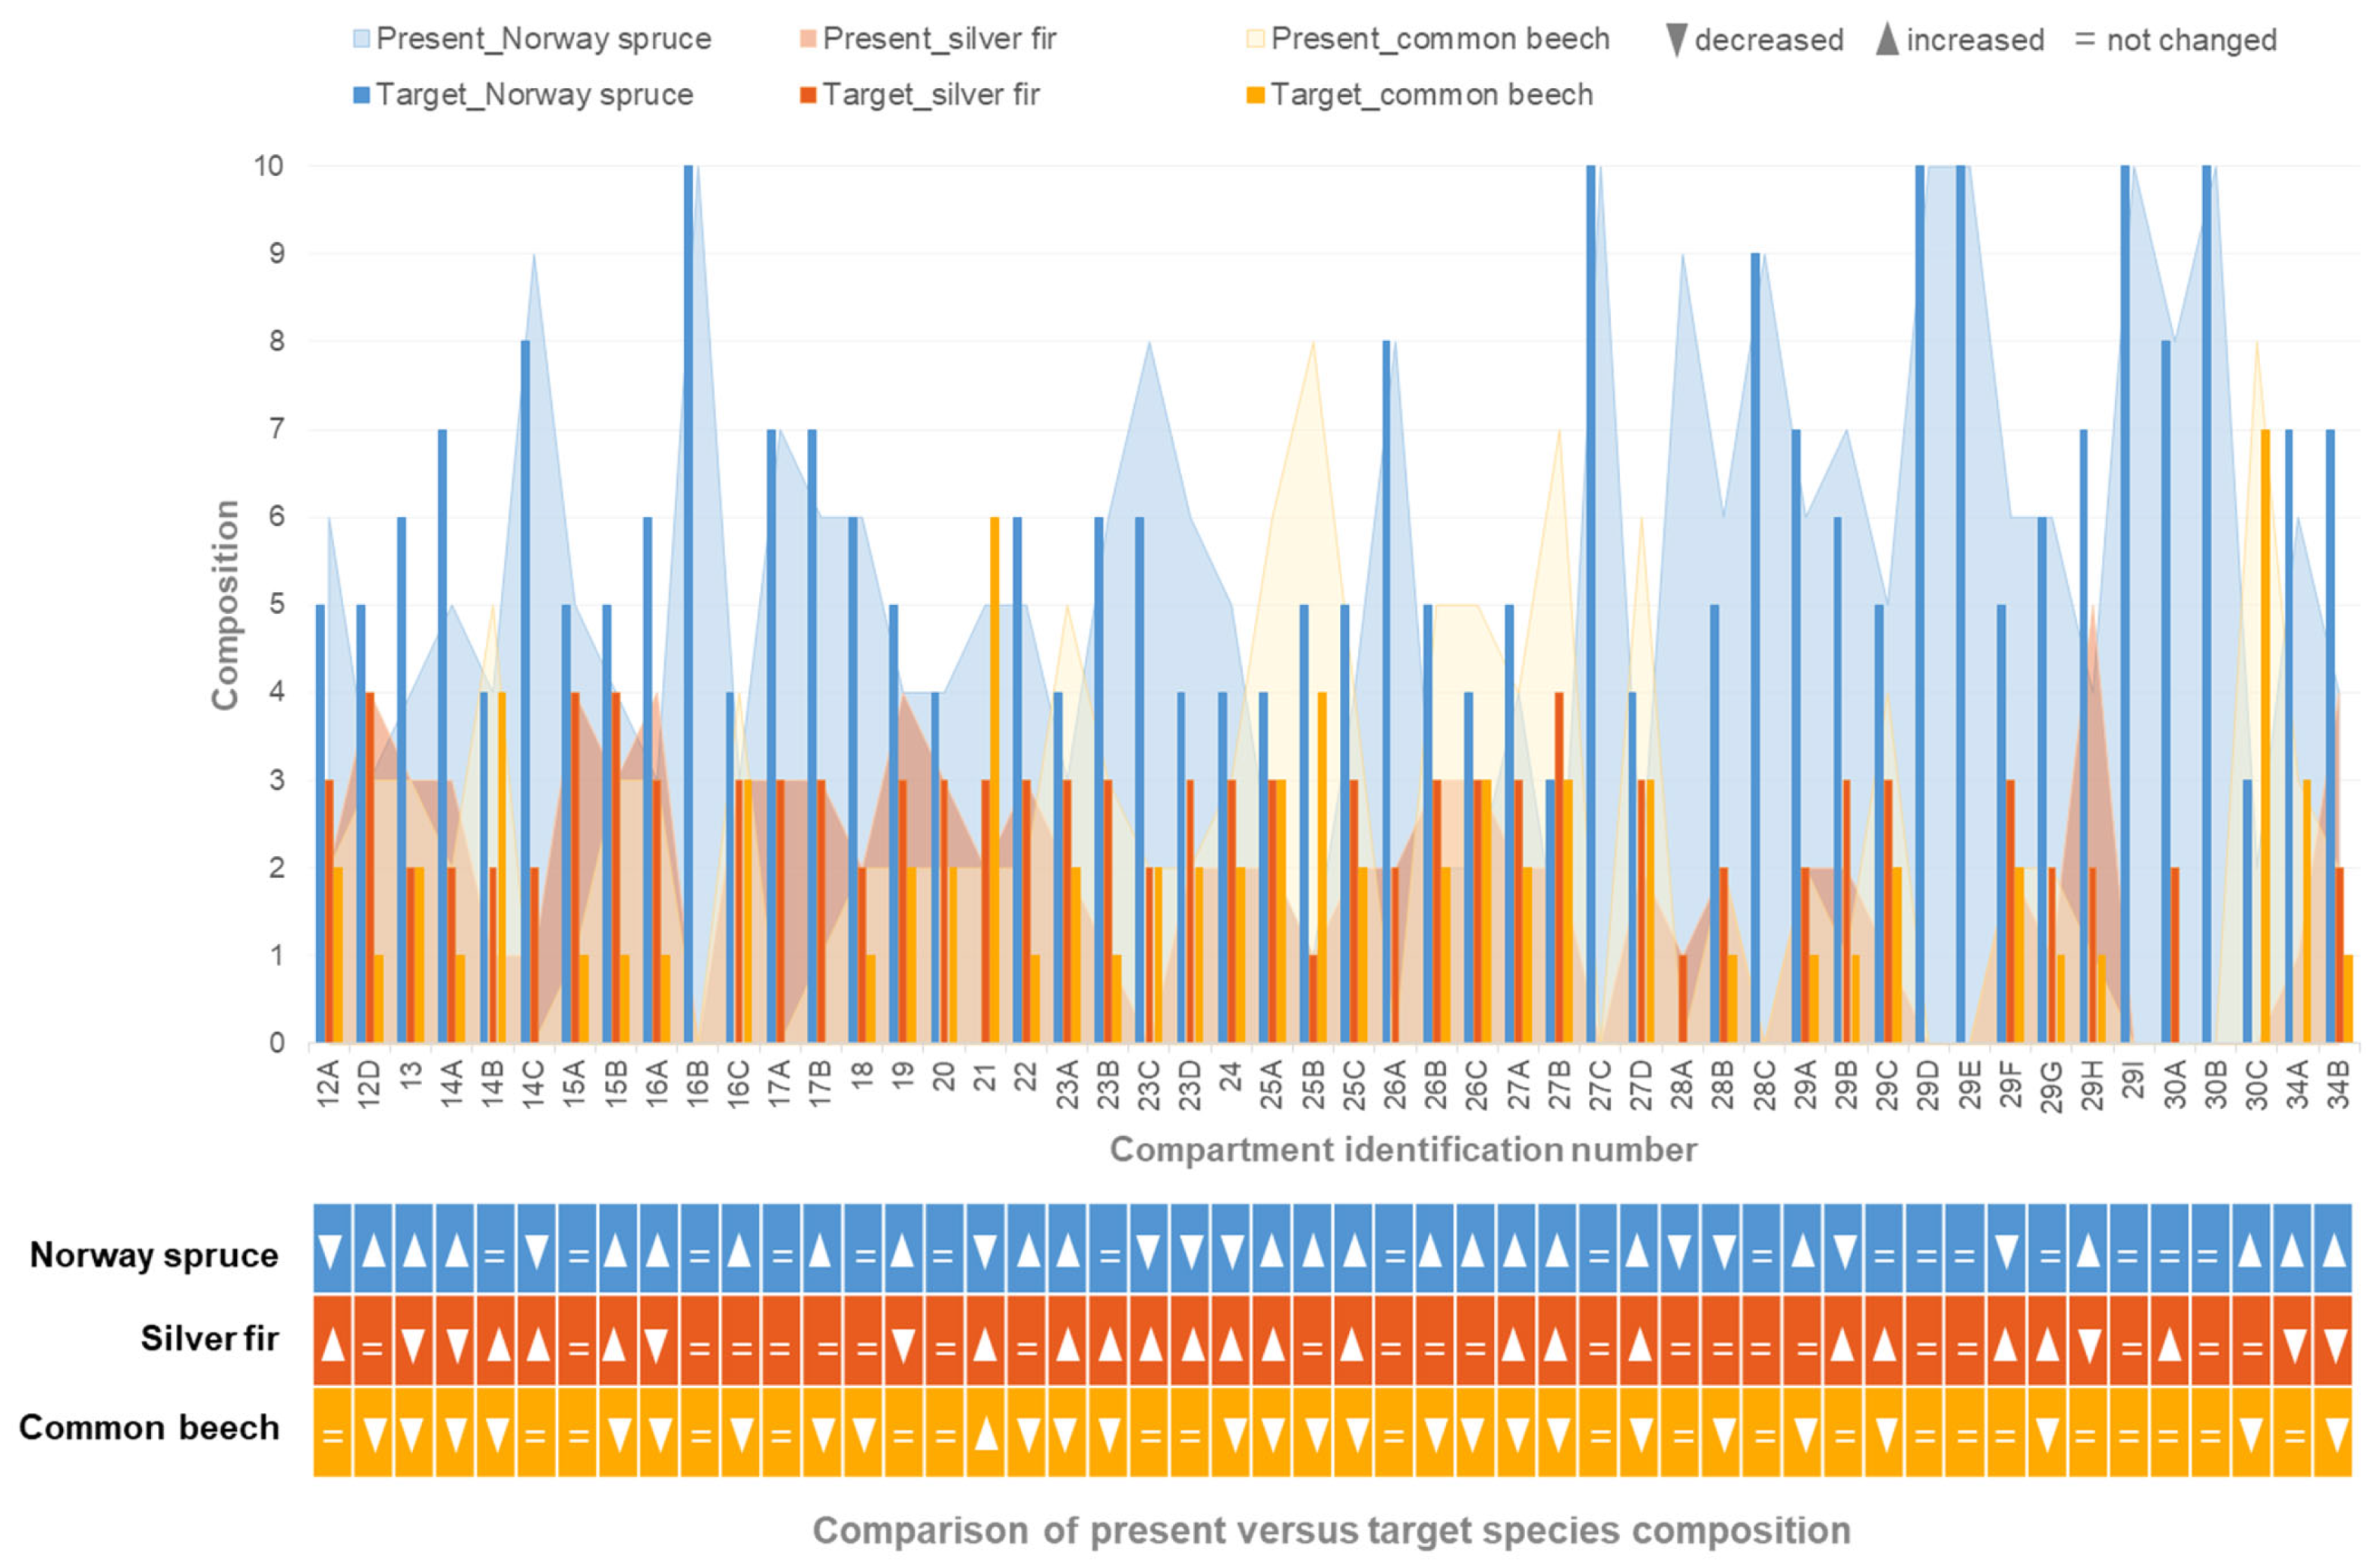
Figure 4 illustrates the current proportion of the three dominant species, while
Figure 5 compares the present and the target composition per compartment. Following the analysis of the cover with spruce, it was noticed that six compartments of the studied area are covered entirely (100%) with Norway spruce (
Figure 4 and
Figure 5). By assessing the present composition of the stand compared to the target composition per dominant species and compartment, we observed that the aim is to increase the percentage of cover with Norway spruce for 46% of the 50 compartments analyzed, keep the same rate for 34% of the 50 compartments and to decrease the percentage only for 20% of the 50 compartments. However, spruce is easily broken (by strong winds and heavy snowfall).
The maximum percentage of cover with silver fir per compartment is 50%, and 10 compartments do not contain silver fir at all (16B, 23C, 27C, 28C, 29D, 29E, 29I, 30B, and 30C). For 46% of the 50 compartments, the target is to keep the same percentage of silver fir cover; for 40% of the 50 compartments, the aim is to increase the silver fir cover; and for 14% of the 50 compartments, the aim is to decrease the percentage of silver fir cover (
Figure 5). It is not intended to increase the silver fir cover to 50%, although only compartment 29H is currently covered with silver fir up to 50%. Even for this one, the target is to decrease the percentage of silver fir cover by 20%, the difference being replaced by spruce.
Another objective of the FMP is to increase the presence of Norway spruce, and it could be noticed that the target composition is highest for this species. In contrast, for 54% of the 50 compartments, the aim is to decrease the present beech cover; for 44%, the aim is to keep it the same it currently is; and for only 2% of the 50 compartments, the aim is to increase the beech cover (
Figure 4 and
Figure 5). Detailed information on the tendency related to present versus targeted composition of the trees, per species, and compartments is illustrated in
Figure 5. Overall, there is no tendency to change the species composition in 10 compartments (i.e., 15A, 16B, 17A, 20, 27C, 28C, 29D, 29E, 29I, 30B) (
Figure 5).
3.1.2. Age Class Distribution: Compartments with Young Stands (5 or 10 Years of Age)
The spatial analysis based on the age of the trees highlighted the compartments with very young trees (i.e., 5 years old;
Figure S3), which need special care, and the age of the trees in compartments relevant to economic potential. The overall stand age per compartment was calculated based on the age of the tree species dominant in the respective compartment, as found in the FMP.
This spatial analysis creates the development perspective that increases the resilience of the local communities in the long term. Before fulfilling the production role, the forest will contribute to the sustainable landscape ecology. Along this forest path from seed to log, selecting the most economically and ecologically suitable forest species for regeneration will ensure the maintenance and improvement of biodiversity.
The compartments with 5-year-old trees (14B, 15B, 23D, 24, 25C, 27C, 28B, and 34B) and their composition (as a label) are easy to visualize in the thematic map shown in
Figure S3. Once these compartments have been identified, using the hypsometry results and the aspects of the area, the intervention method for the type of silvicultural treatments—will be decided.
Spatial age analyses highlight compartments with young trees (
Figure S3) and those of economic importance. In the study area, 16% of compartments contain very young trees. The overall stand age per compartment is 10 years, except for compartment 23D, which contains 5-year-old trees requiring care and release cutting. For 75% of the eight compartments with very young trees, the exploitability age is 110 years, while for compartments 28B and 34B the age of exploitability is 100 years.
The silvicultural treatment applied in all compartments shown in
Figure S3 was group shelterwood felling, except for compartments 25C and 29F, where previous silvicultural work data were unavailable. As for the recommended future silvicultural treatments (works), cleaning was proposed for 88%, care of young trees for 75%, release cutting for 50%, and thinning only in compartment 34B. This compartment includes 40% spruce, 40% silver fir, and 20% beech, and thinning is proposed in addition to care of young trees and cleaning.
3.2. Forest Site Characteristics and Environmental Factors
3.2.1. Site Type Classification by Compartment
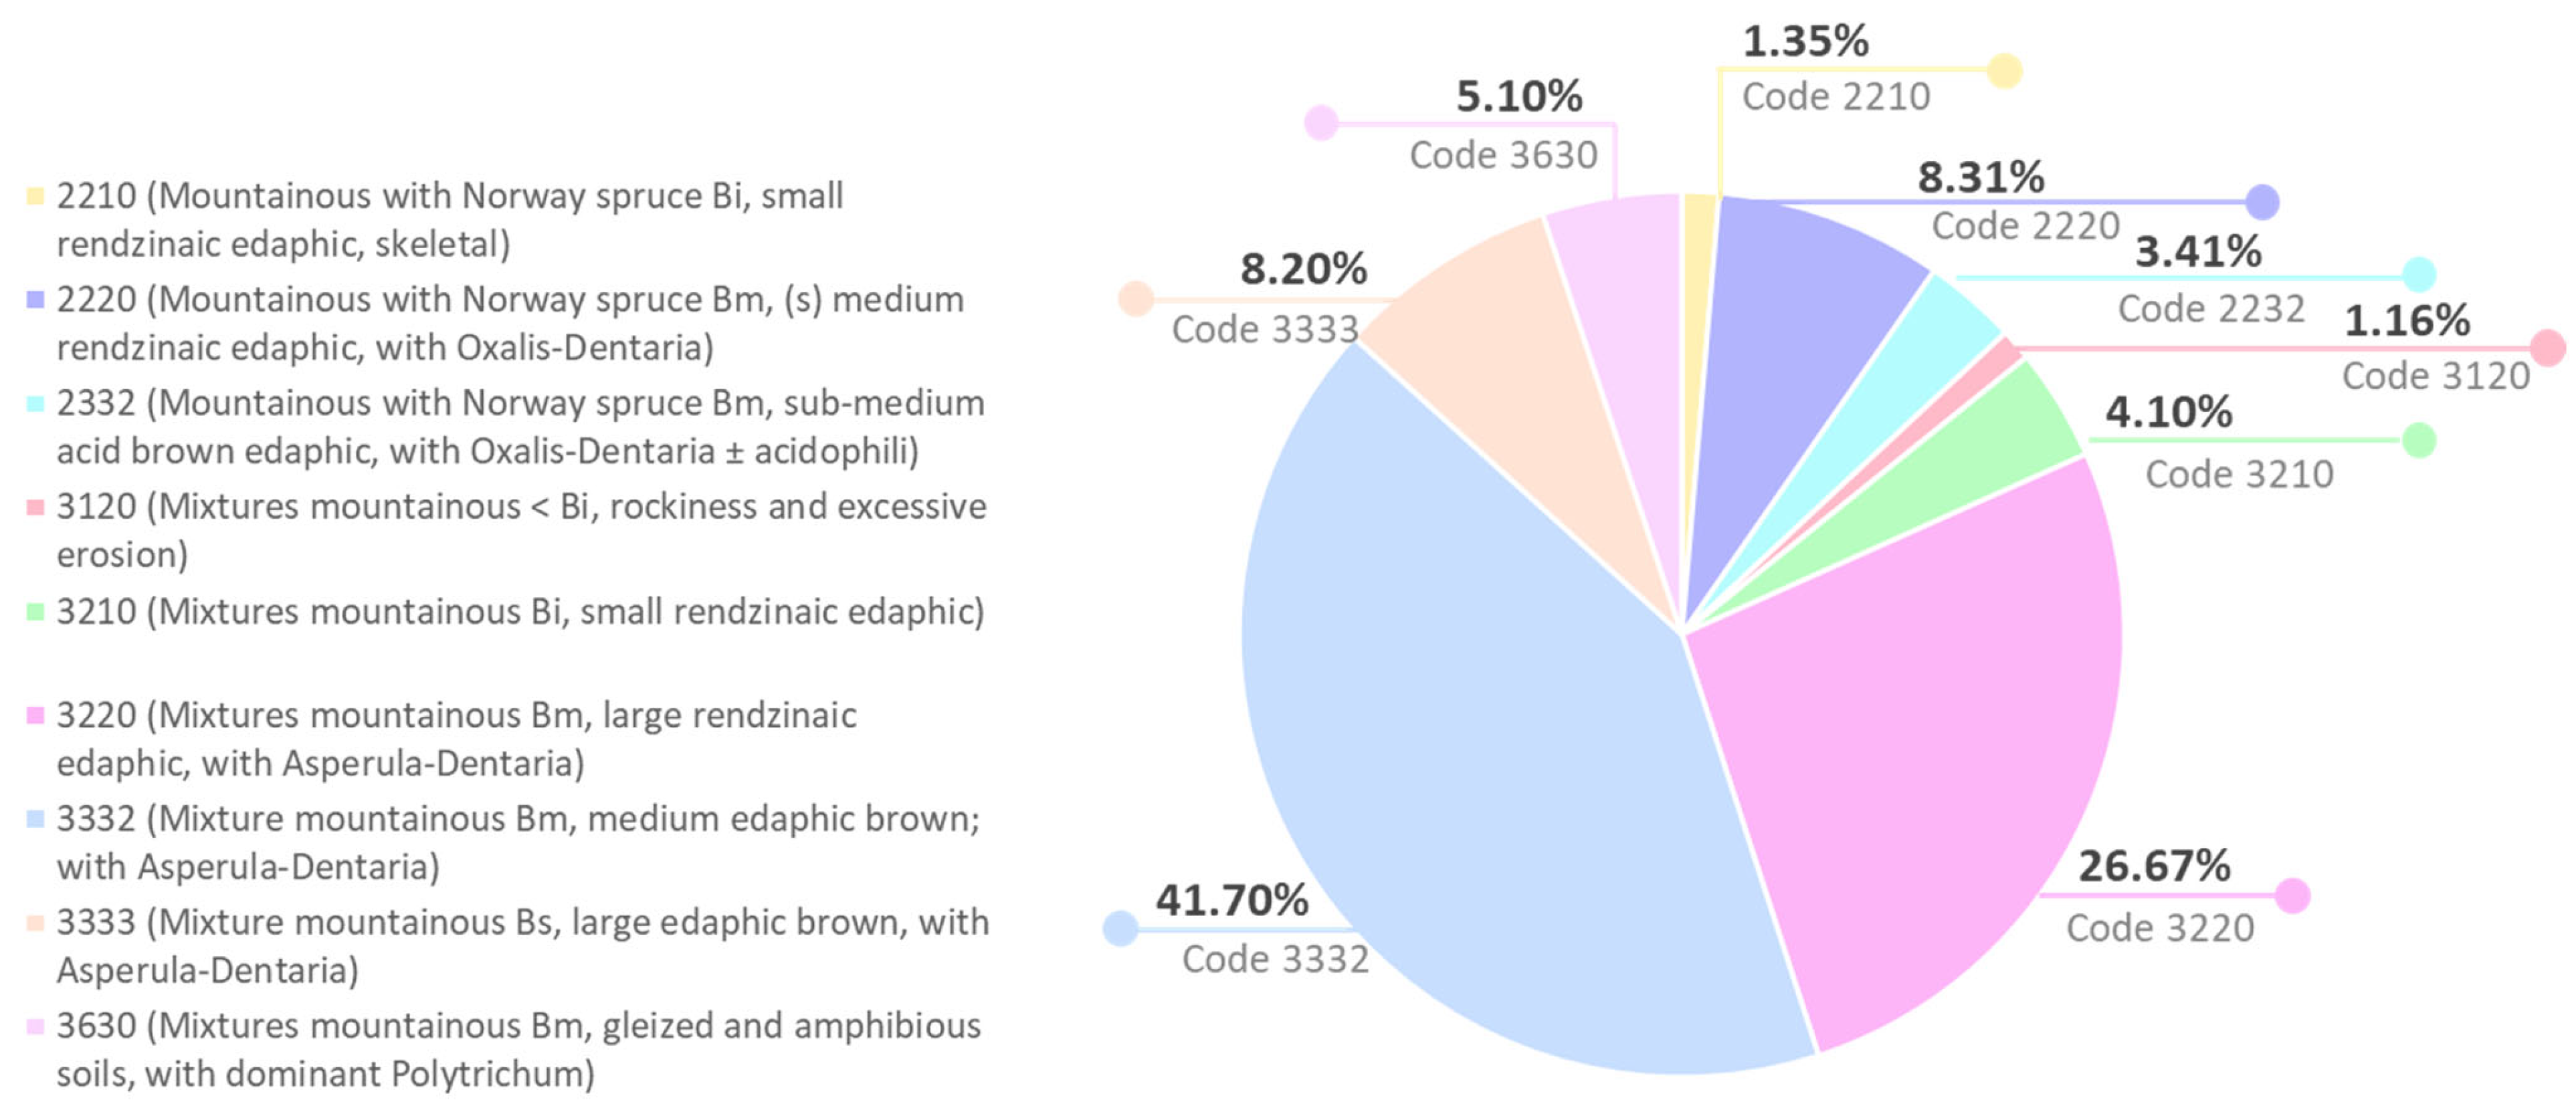
In forestry, site type is a key factor as it influences ecosystem processes, biodiversity, and the provision of ecosystem services. Spatial analysis of forest site type can help ecologists design landscape-level biodiversity strategies that balance conservation with human needs. Nine forest site types were identified in the study area. The two predominant types are (1) mixture mountainous, Bm, medium edaphic volume, brown, with Asperula-Dentaria (code 3332), covering 42% (313.8 ha), and (2) mixture mountainous, Bm, large edaphic volume, rendzinaic, with Asperula-Dentaria (code 3220), covering 27% (200.7 ha) (
Figure 6 and
Figure S4).
This result is consistent with the one for the entire PU V Arieseni, where the predominant site types were the same: forest site type 3332 covers 50% and type 3220 covers 14% of the entire area of PU V Arieseni [
15].
The forest types were determined for the entire PU, revealing that the dominant forest type is 134.1 (mixed coniferous and beech on skeletal soils [m]), covering 657.9 ha (44%) [
15].
3.2.2. Elevation Range of the Studied Area
Spatial analysis of the terrain provides essential insights into the physical characteristics of the forest landscape, enabling adaptive management through continuous monitoring of terrain and surface changes over time. This facilitates informed and effective decision-making. Elevation, slope, and aspect greatly influence tree growth, species distribution, and forest health. The hypsometric analysis showed that the study area’s elevation ranges from 1020 to 1420 m (represented in green and brown, respectively) (
Figure S5). Another advantage of the digitized FMP is that the elevation of a compartment is not given as an interval but can be determined for each point based on the DEM.
We used the DEM to analyze contour positions and slopes on the terrain. We delimited the area of interest and generated a raster for surface representation. To improve accuracy, we selected a 20 m interval between contour lines and labeled contours every 40 m to avoid overcrowding the map.
3.2.3. Slope Distribution
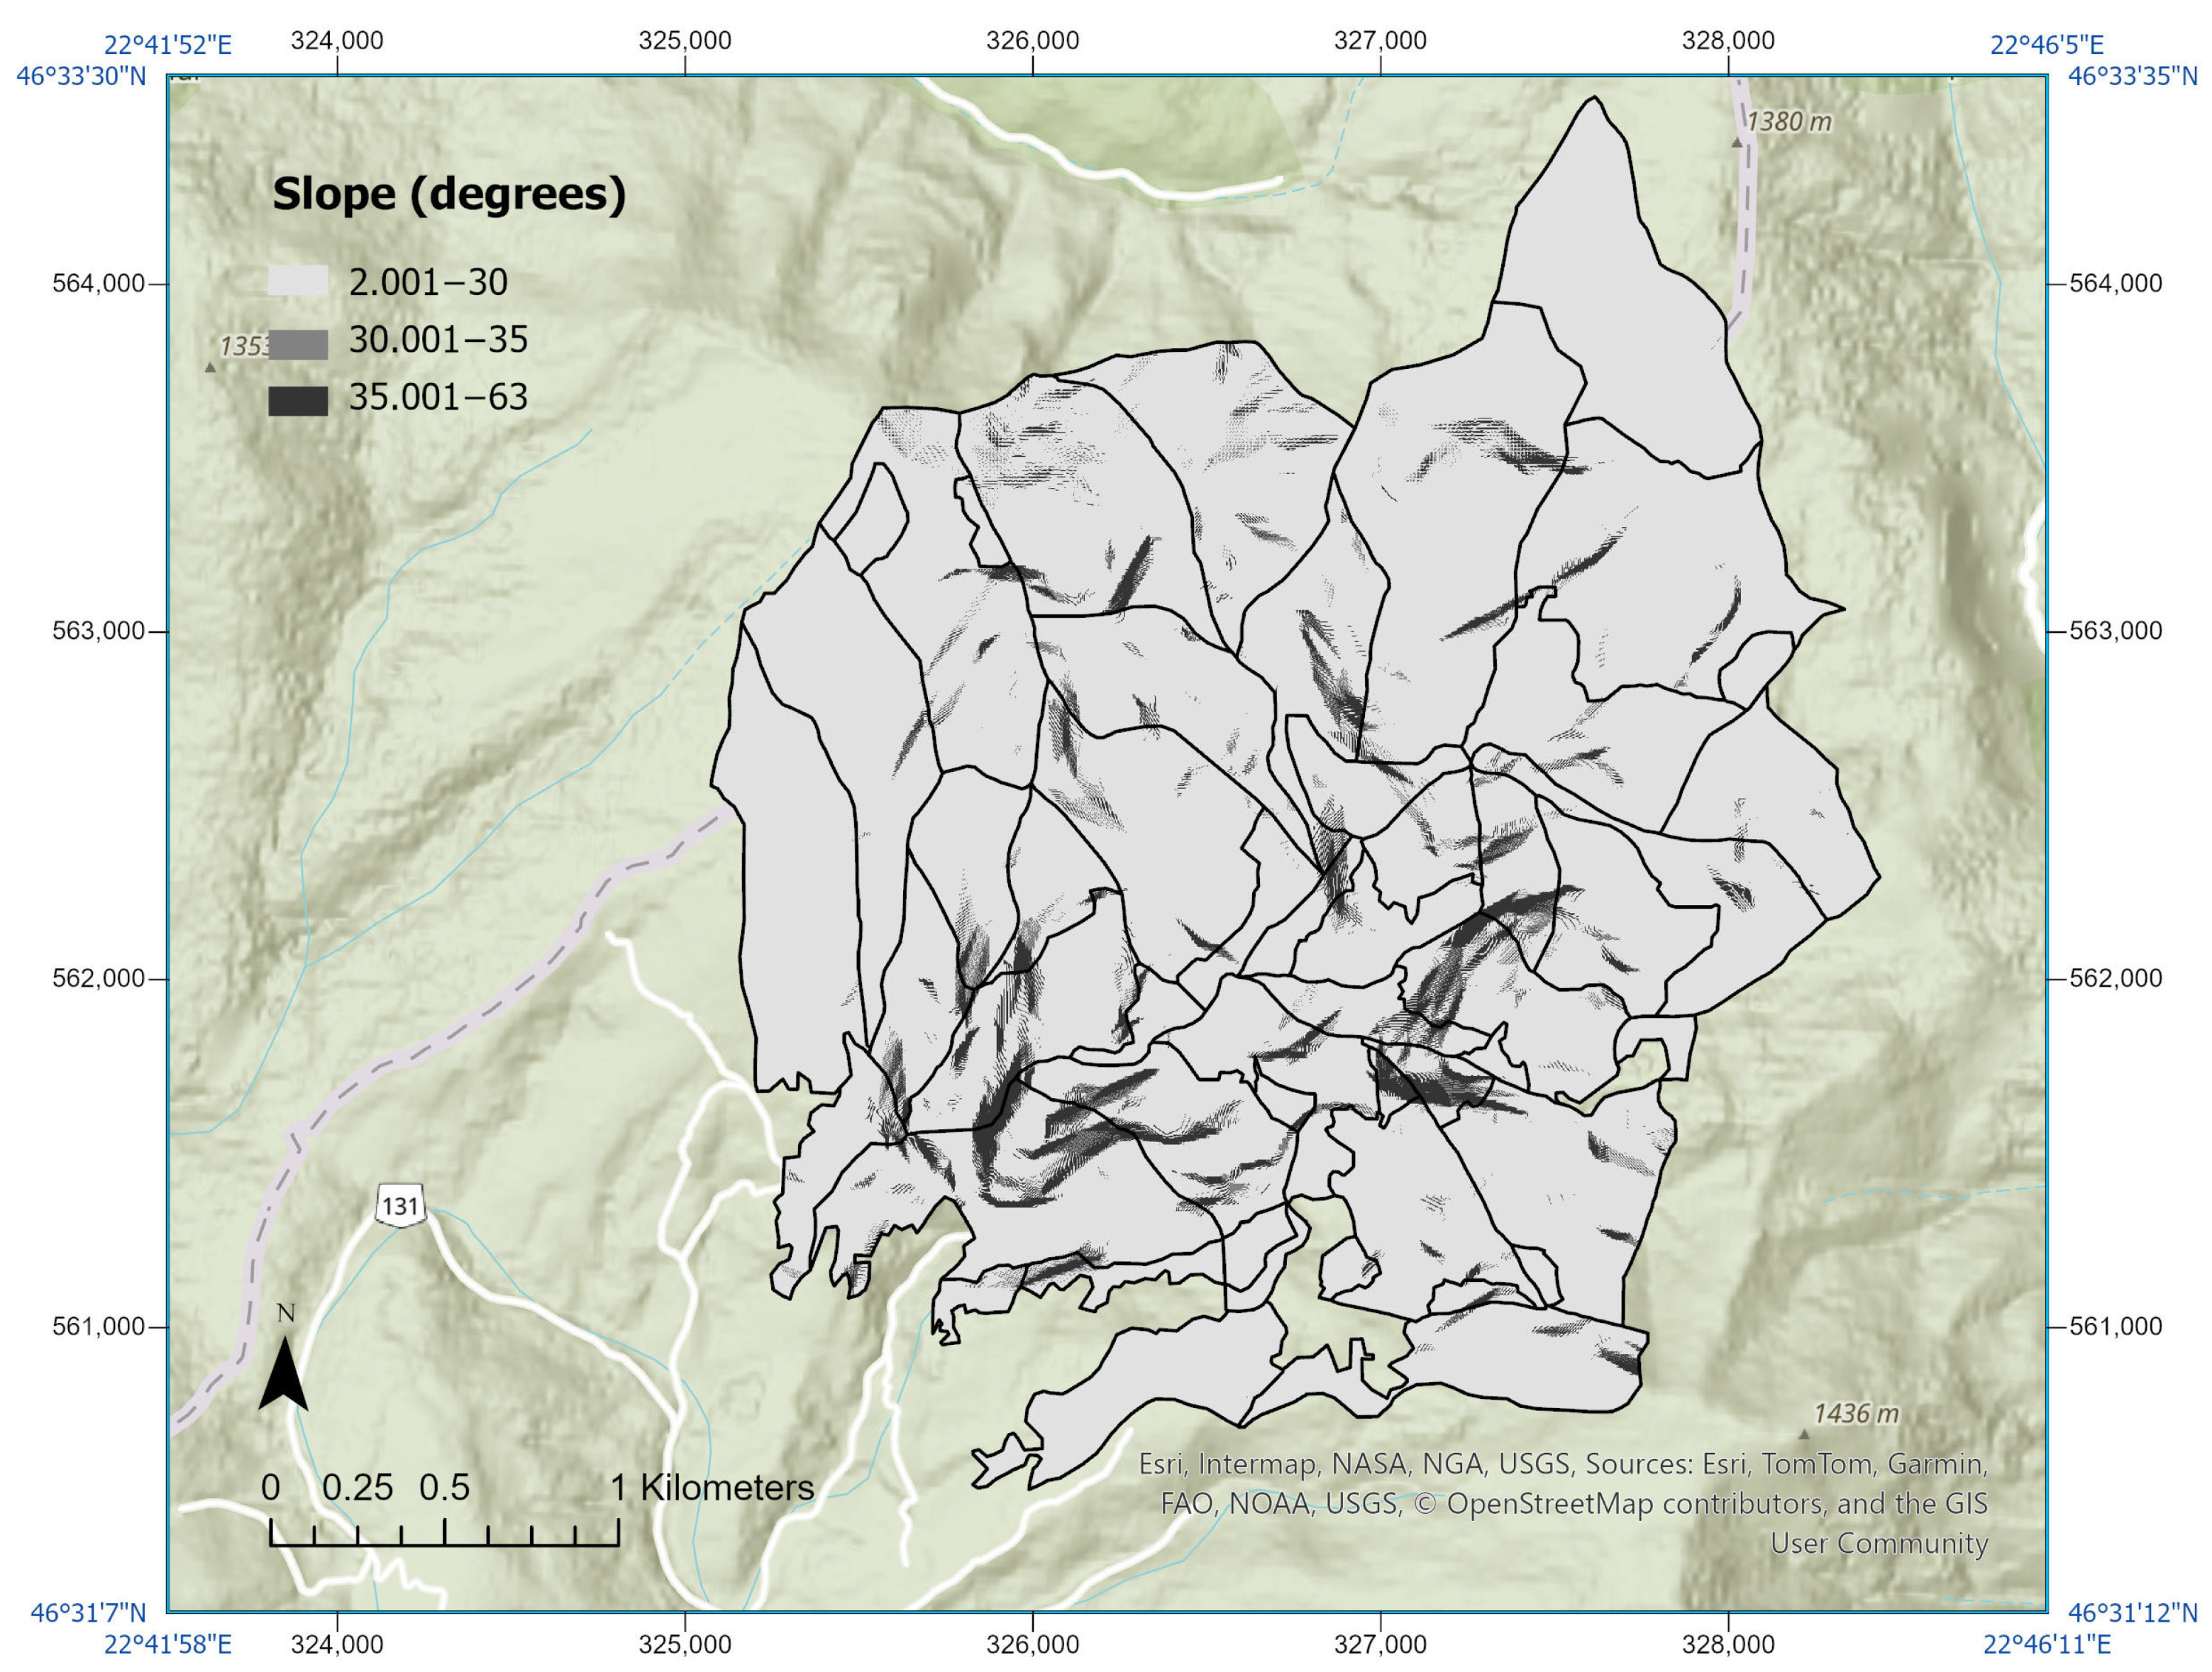
The slope map of the studied area (
Figure 7) is classified using 30°and 35° thresholds, chosen due to their silvicultural significance.
Of the entire area, 93% have slopes < 30°, representing areas with no restrictions. Forest exploitation on slopes between 30° and 35° involves significant ecological and operational risks that hinder mechanized work and accounts for 3% of the area studied. Areas with slopes > 35°, representing 4% of the studied area, serve a protective function. In Gârda Forest, groves located on cliffs, rocky outcrops, eroding land, and slopes > 30° on loam, sands, gravels in addition to slopes of >35° on other lithological substrates cover 18% of the forest. Areas with slopes > 30° belong to Group I, Subgroup 2, functional category “a”, functional type II of forests with land and soil protection functions, mainly pedological, where only preservation cuttings are permitted [
17].
3.2.4. Aspect of Orientation Across Compartments
Slope aspect influences species composition and practical factors such as solar exposure, microclimate, precipitation, and radiation, as well as identification of flatter areas. In the study area, slope aspects generally face South-East (17%) and South-West (13%), with a lesser extent toward North-East (5%) and East (8%) (
Figure S6). Slopes facing North-West account for 11%, North 9%, and West 10%, and South 10%. The remaining 16% corresponds to flat land without downslope direction (
Figure S6).
3.3. Regeneration Dynamics and Sustainability—Analysis of Regeneration Type, by Species Cover
The spatial analysis of the regeneration type plays a key role in the evolution of the forest as it determines its composition, structure, diversity, and long-term resilience. The appropriate choice of regeneration type influences the forest’s ability to adapt to environmental conditions, climate change, and human interventions. In the studied area, the regeneration type was either natural or via plantation (artificial). The spatial analysis of the regeneration mode is shown in
Figure S7, and the summary results are presented in
Table 1. Thus, it can be seen that for common beech, the regeneration mode is 100% natural. For silver fir, the regeneration mode is 88% natural, and the plots marked with a thicker outline indicate regeneration through silver fir.
Regarding Norway spruce, which is present in all plots, it regenerates through seedling planting in 46% of the cases, and these compartments are marked in green on the regeneration thematic map (
Figure S7). In the same figure, compartments that are not marked with a thick line or in green are those in which only natural regeneration takes place.
Target composition aims to increase the proportion of Norway spruce in the compartments we studied. Six compartments in the study area (i.e., 16B, 27C, 29D, 29E, 29I, and 30B) are entirely covered by spruce (
Figure S8). The ages of the trees in these compartments are 55 years, 40 years, 90 years, 55 years, 55 years, and 20 years, respectively. The corresponding thematic map (
Figure S8) shows that the regeneration type was natural in all these compartments, except for 27C, where regeneration occurred through seedling planting.
Where natural regeneration is insufficient or not possible, planting seedlings becomes necessary. The species of seedlings used for planting are determined by technical standards and the forest stand manager, and are specified in the regeneration work plan, considering the ecological group to which the compartment belongs (based on the forest site type and forest type). As a rule, the species that best fulfill the forest’s protection and production functions are selected for planting.
The compartments characterized by natural regeneration have North-, North-West- and East-facing aspects, whereas compartment 27C has South- and South-West-facing slopes (
Figure S4). Of these six compartments, four have slopes ≥ 30°, and two (i.e., 27C and 29E) have slopes < 30°. An assessment of these same compartments from the perspective of the target composition showed that the target composition for all is 100% spruce.
3.4. Forest Productivity and Economic Performance
3.4.1. Existing Forest Volume in the Studied Area
Forest volume provides critical information for sustainable forest management. It is used to assess forest resources, plan forestry interventions, and monitor forest health.
The assessment of existing forest volume (in m
3/ha) for each compartment and its analysis are based on the detailed information in the Compartment Description section of the FMP of Gârda Forest District [
15] regarding the stand component. It is important to note that this volume data was unavailable for trees younger than 5 years. Therefore, one compartment, i.e., 23D (with an area of 2.8 ha), was excluded from the analysis, as it is composed entirely of 5-year-old trees.
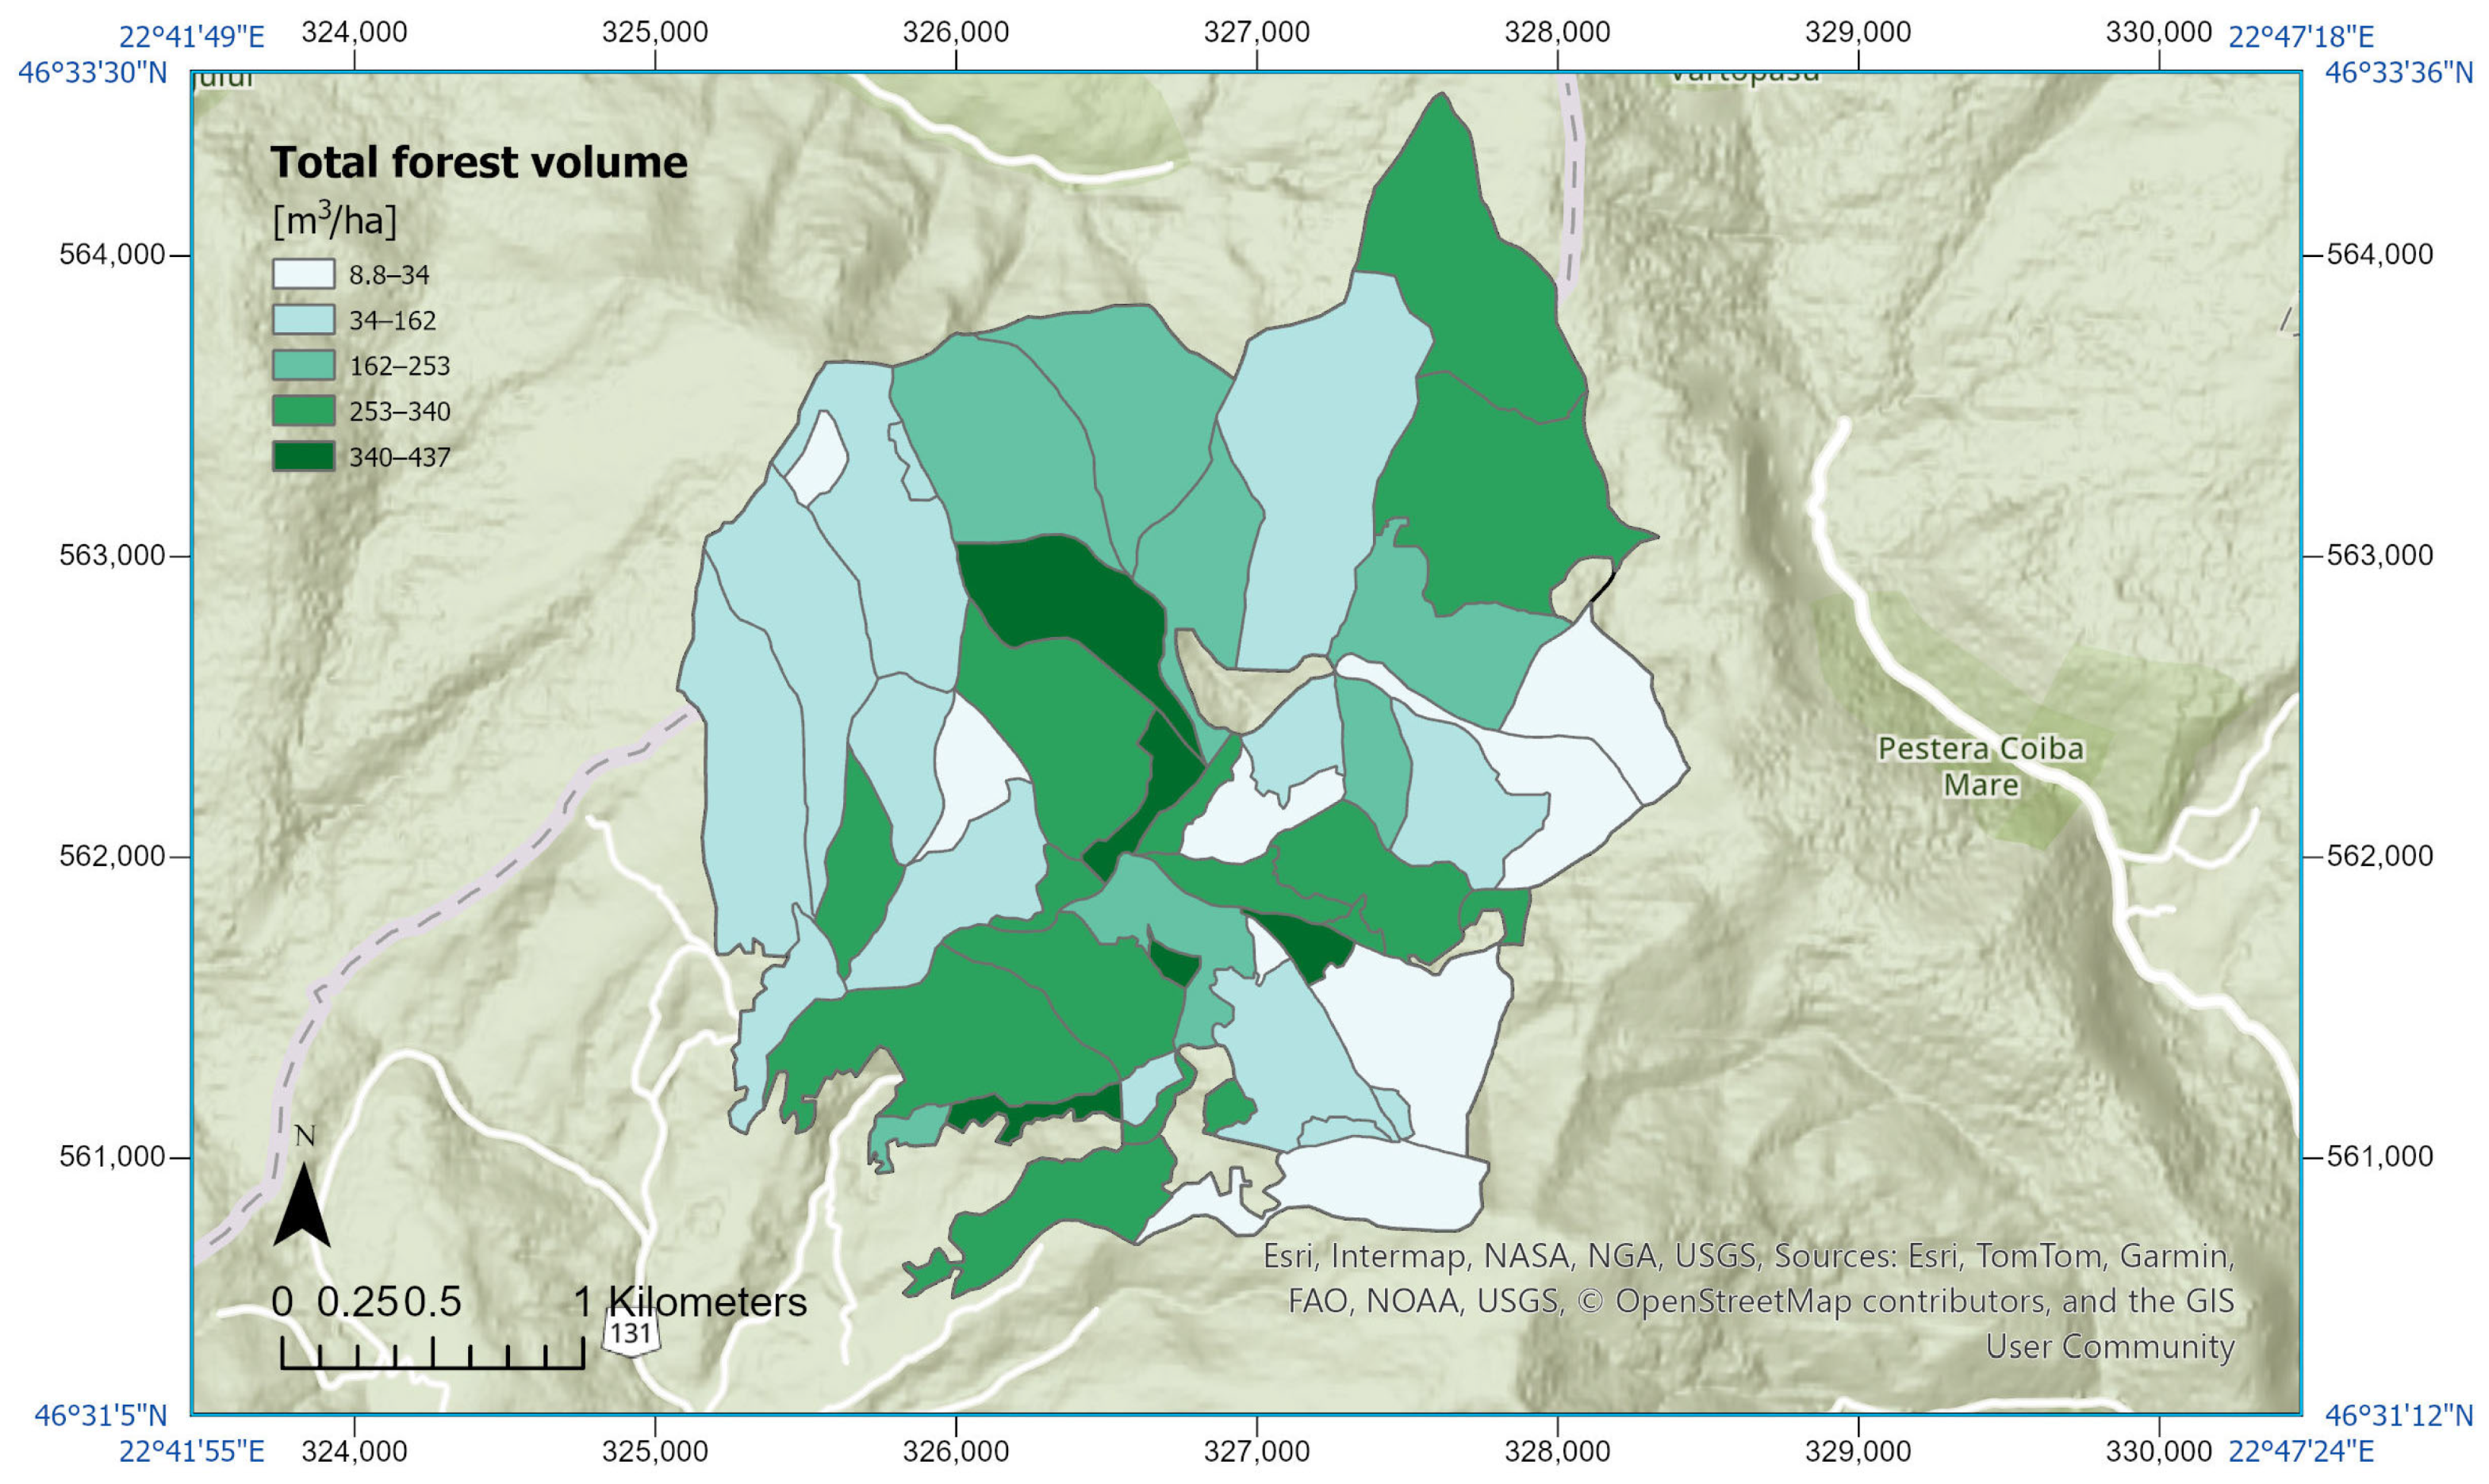
Figure 8 shows the thematic map of existing forest volume for the 50 compartments in Gârda Forest that we studied. The existing forest volume ranged from 8.8 to 436.9 m
3/ha. An analysis of the distribution of these values using the Shapiro–Wilk Test showed that they do not follow an approximately normal distribution (Sig = 0.02, α = 0.05). The median existing forest volume was 226.0 m
3/ha, with an interquartile range (IQR) of [91.95, 301.98]. From a statistical perspective, there were no outliers in forest volume (expressed in m
3/ha).
The total forest volume per compartment ranged from 13 to 12,507 m
3 per compartment, and did not follow an approximately normal distribution, as shown by the Shapiro–Wilk Test (Sig = 0.000, α = 0.05). The median value was 1565 m
3 per compartment, with an IQR of [460.50, 4750.00]. Unlike forest volume per hectare, in this case, outliers were present (
Figure S9). The compartments with outlier values for forest volume (expressed in m
3 per compartment) are 23C, 23B, and 30A (
Figure S9). These high values can be explained by the larger compartment areas and the older age of the trees, as shown in
Table 2.
3.4.2. Analysis by Sub-Unit of Production and Protection (S.U.P.) and by Age
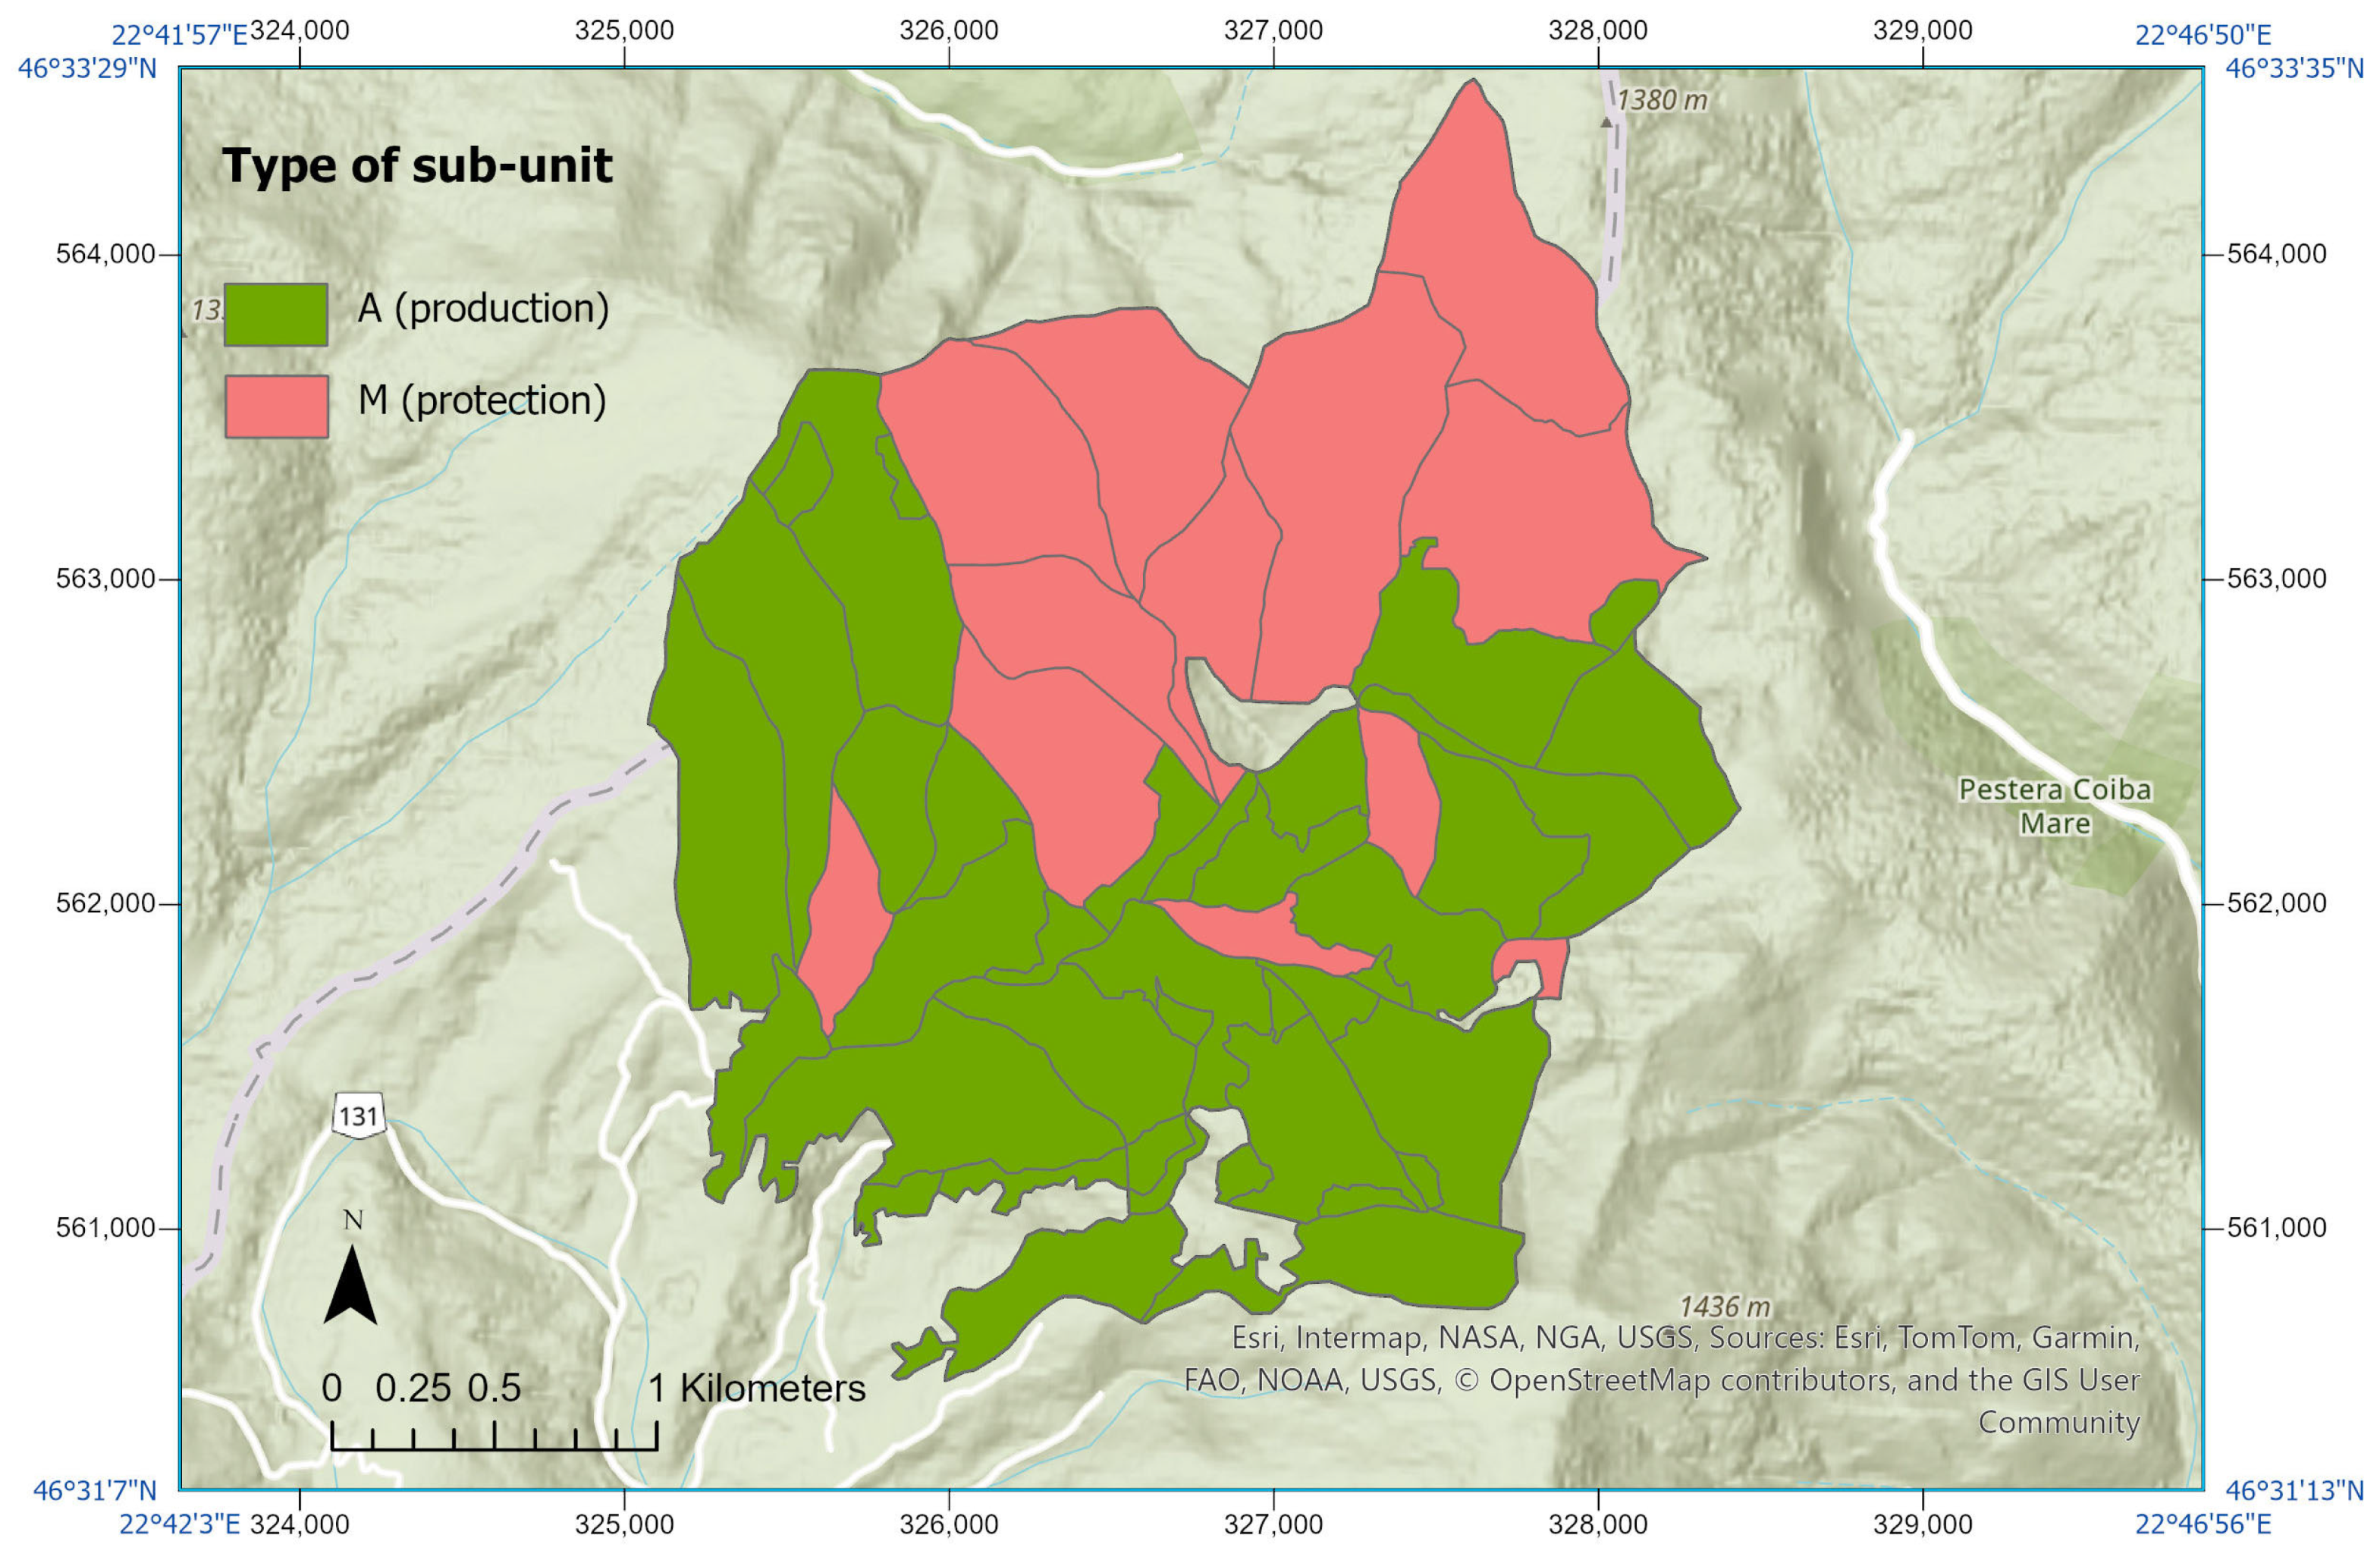
Identifying production and protection sub-units in forest management is essential for the efficient and sustainable organization of forest resources. These sub-units enable differentiated management according to the forest’s ecological, economic, and social functions, ensuring a balance between production and conservation.
Since each stand has both socio-economic and ecological roles, it cannot be harvested arbitrarily; certain rules must be followed, such as those determined by the S.U.P. classification. The following sub-units of production were defined:
S.U.P. “A” is a production sub-unit consisting of regular high forest, where timber extraction can occur, following specific regulations, resulting in various assortments of wood products (e.g., timber).
S.U.P. “M” is a protection sub-unit consisting of forests under a special conservation regime, where trees are only felled when the stand can no longer fulfill its protective effect (e.g., protection of soil, water, or against harmful climatic and industrial impacts).
Figure 9 shows the type of compartment in the study area, classified by sub-unit of production and protection. In this area, 60% of the 50 compartments were classified as type A and 40% as type M.
S.U.P. “A” has a production function, but trees can only be harvested when the target timber assortment is most abundant, an aspect determined by the age of technical exploitability. For timber harvesting, it is important to analyze tree age statistically, as the correlation between compartments with a production function and the optimum harvest age helps identify which compartments are eligible for logging.
Figure S10 shows the compartments in the S.U.P. “A” category along with the current stand age, another key structural feature analyzed in this study.
In regulating the production process, the provisions of the Forestry Code were considered, along with the “Technical Rules for Forest Management” that were in force [
46]. The following principles of forest management were adopted: (a) the regeneration regime; (b) target composition; (c) treatment methods, understood as the full range of forestry works carried out throughout the production cycle; (d) exploitability; (e) rotation (i.e., 110 years for S.U.P. “A”).
In
Figure S10, the compartments where harvesting is permitted are shown in green. For stands with special protection functions, where harvesting is not allowed (S.U.P. “M”), no age limits are set. The decision regarding exploitation is made by the forest management planner and specified in the FMP, once a tree can no longer fulfill its protective role. These stands are managed exclusively through care cuts, maintenance, and regeneration cuts specific to functional type II [
17].
3.5. Silvicultural Treatments and Management—Types of Silvicultural Works Proposed, Tendering and Wood Felling Plans, and Other Management Interventions
Silvicultural treatments directly influence forest composition, structure, and functionality. Analyzing these interventions is essential in forest management for evaluating, planning, and optimizing practices that promote healthy, productive, and sustainable forests. Data from silvicultural analyses is crucial because it can be shared with stakeholders to demonstrate the benefits of interventions and justify management decisions. This transparency helps build trust among local communities, industry partners, and conservation groups.
Mature stands that have reached the age of exploitability will undergo regeneration cuts during the first decade. The remaining stands affected will be managed and cared for, as they are young stands, capable of returning to a healthy condition through the implementation of the planned silvicultural works.
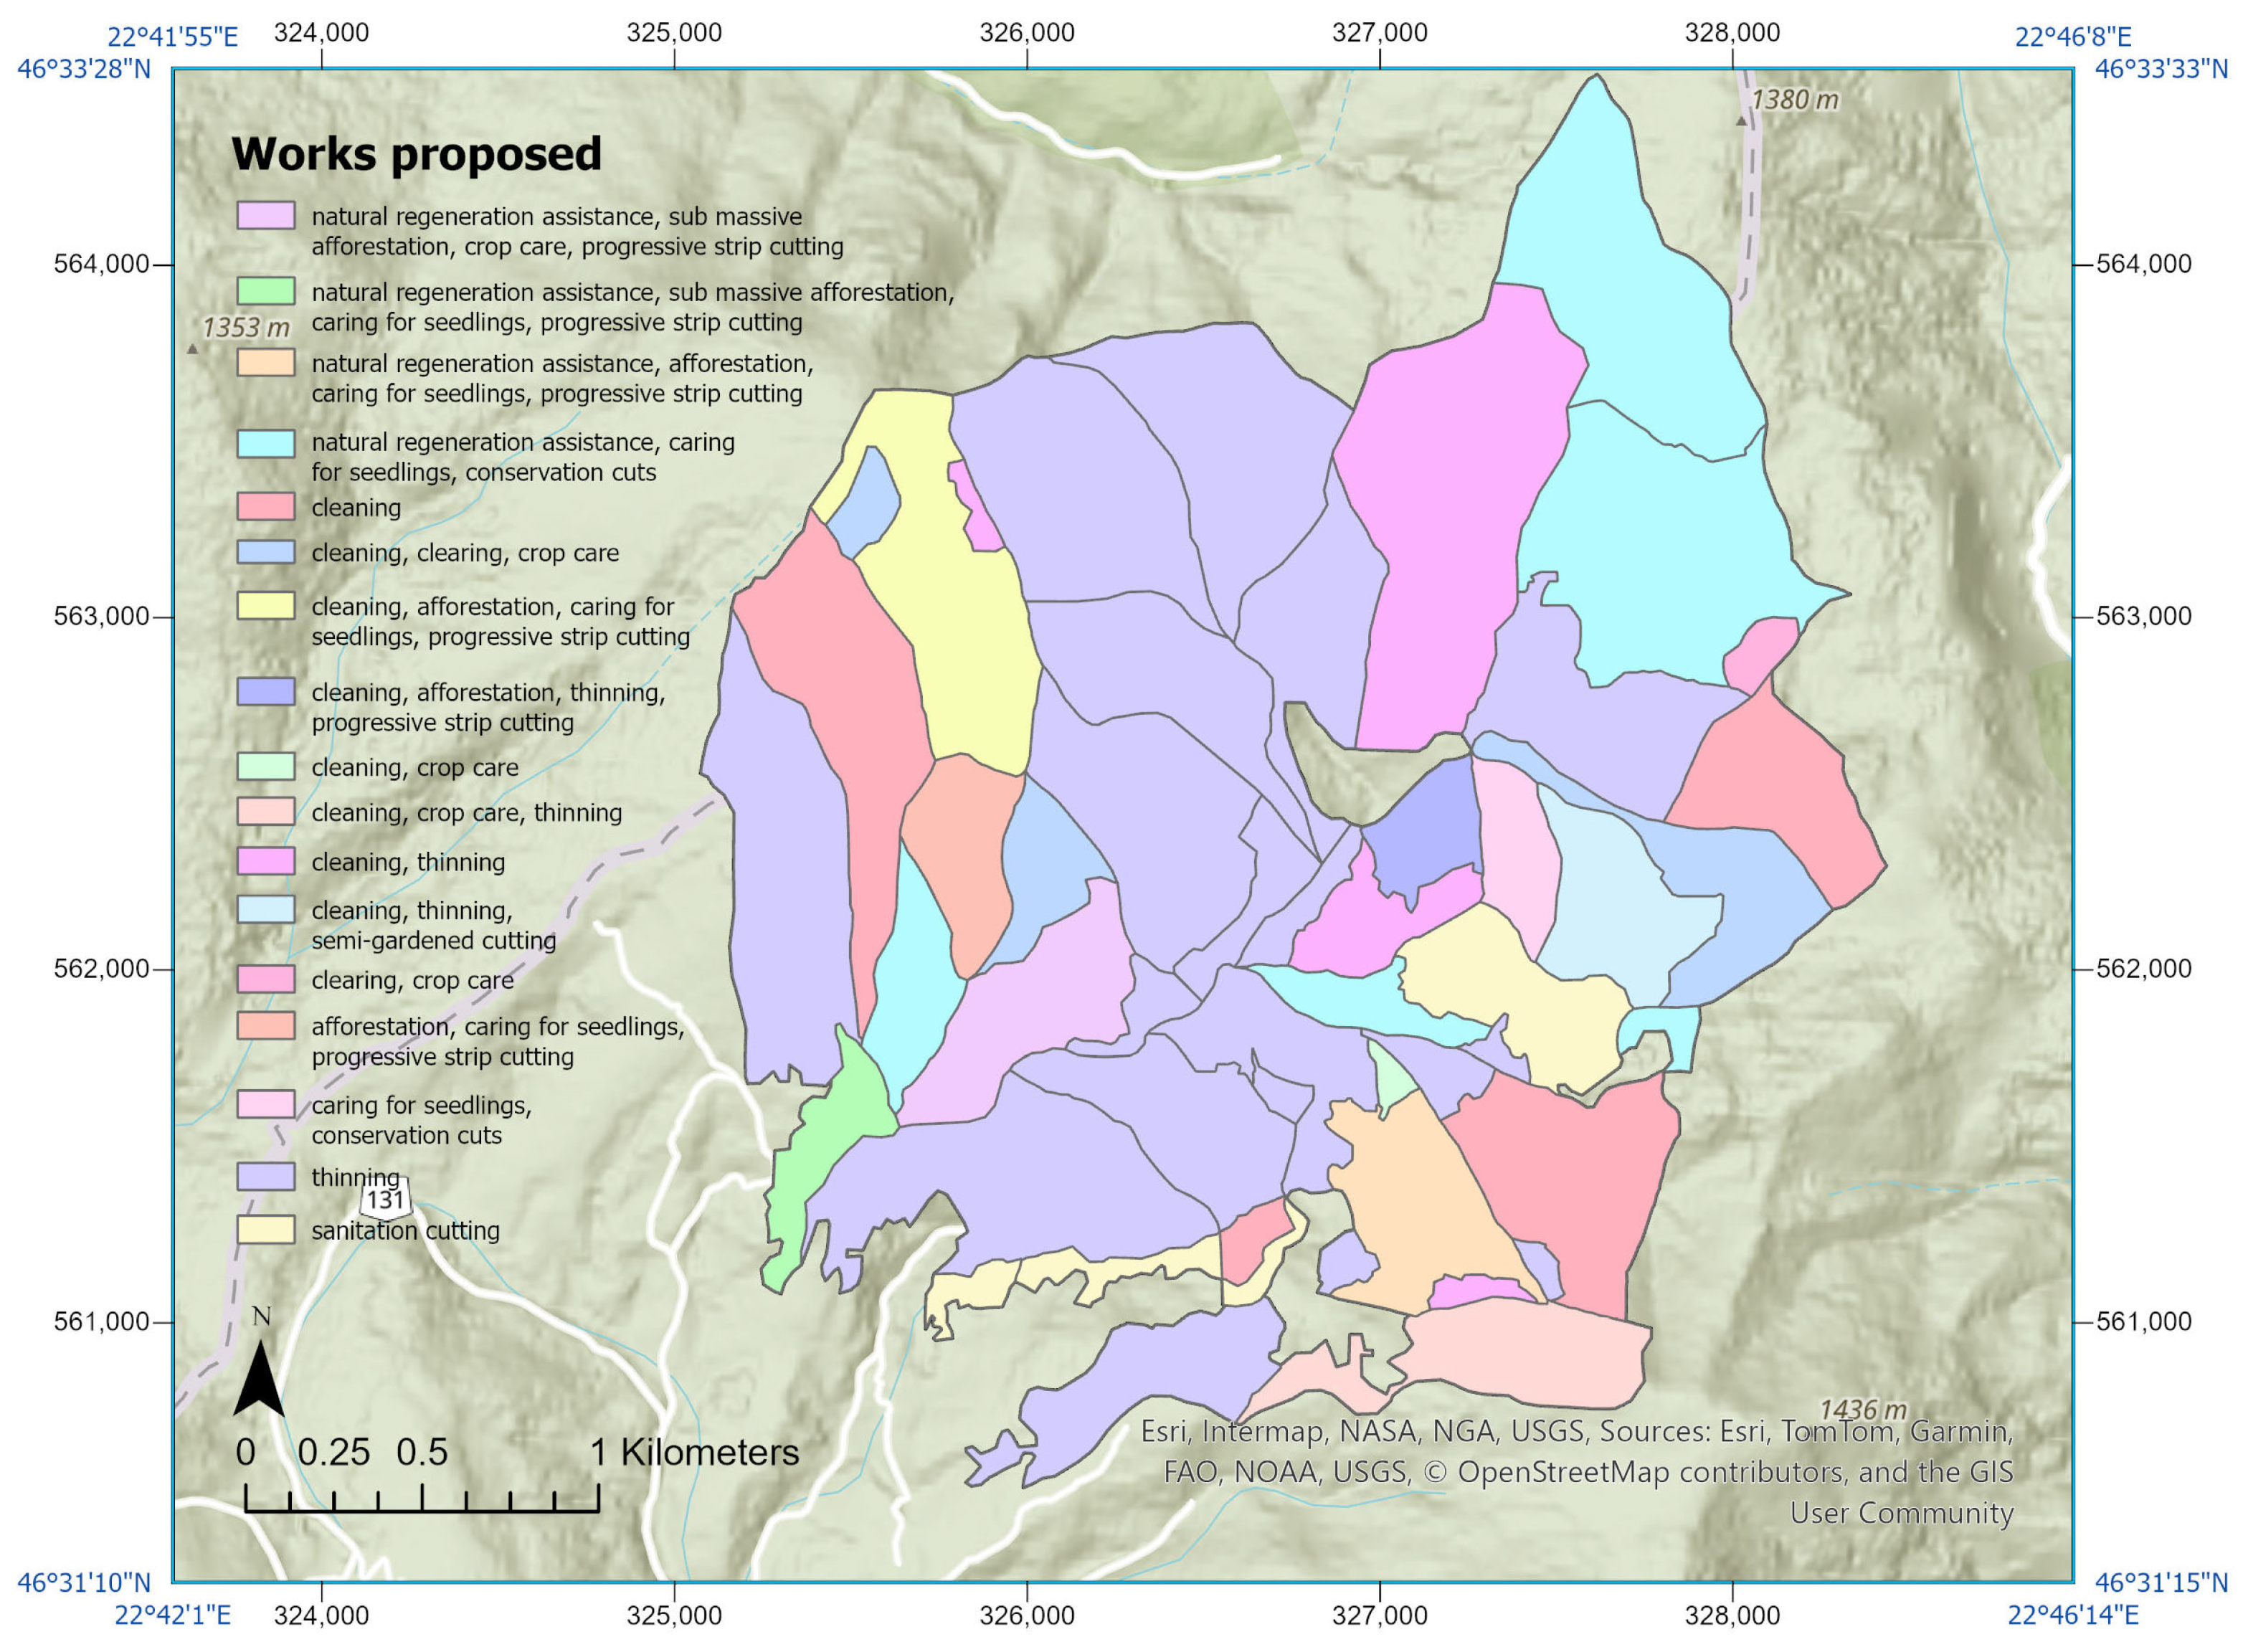
For 38% of the 50 compartments analyzed, the primary and only silvicultural work proposed is thinning (
Figure 10), and all have an overall stand age per compartment ranging between 25 and 55 years. In addition, there are five compartments where cleaning and thinning are proposed. For four of them (three of type S.U.P. “A” and one of type S.U.P. “M”), the overall stand age per compartment is <30 years. For the fifth one (i.e., 25A), a type S.U.P. “A” (production) compartment with an overall stand age of 150 years, the proposed silvicultural treatment was semi-selection felling, in addition to cleaning and thinning. For the other 22% of compartments, cleaning was proposed either as sole silvicultural treatment (in four compartments) or in combination with other works (e.g., release cutting, care of young trees, caring for seedlings) (
Figure 10). The law stipulates that the volume of harvested wood cannot exceed the amount indicated in the FMP, and harvesting may only occur in stands included in the FMP [
49]. Felling may only be conducted by an authorized forest harvesting provider [
49].
Another common silvicultural treatment proposed (for 16% of the studied compartments) was assistance for natural regeneration, never as a stand-alone intervention but always in combination with other silvicultural treatments (i.e., afforestation, care of young trees, group shelterwood felling, conservation cuts, and/or caring for seedlings). The planning of regeneration work takes into account (i) the situation recorded in the Compartment Description, (ii) the regeneration needs arising from implementation of the harvesting plan for main products, (iii) the necessity to ensure an appropriate stand structure aligned with the assigned functions, and (iv) the requirement to urgently reforest or afforest all empty forest land, except areas designated for administration or those that, due to their conditions, cannot be afforested (e.g., cliffs, swamps). Enhancing degraded or deforested areas through reforestation, afforestation, or assisted natural regeneration can support ecosystem restoration and promote biodiversity.
4. Discussion
By combining the ecological and economic functions of the forests, it is possible to ensure their sustainable and resilient management. We digitalized the FMP, which previously existed only on paper, and made it more accessible through spatial analysis to uncover the complexities of effective forest management. This involves (i) evaluating various forestry works and practices aimed at ensuring sustainability, conservation, and long-term ecological health and (ii) supporting wood production, as wood is one of the fundamental resources for global economic development.
The main strength of our research is that the proposed GIS includes all the information from the Compartment Description (an essential part of the FMP), without narrowing the research to isolated management concerns (e.g., species, compartment composition, or timber volume). The inclusion of silvicultural data for the studied area in our GIS is a valuable tool for assessing and updating the achievement of contemporary forest management goals (e.g., health, diversity, and productivity) [
50].
Another strength of our study is that the methodology can be applied to similar research in any forest area in Romania, since any production unit larger than 10 ha must have an FMP [
5]. The FMP follows a standardized format, which ensures the reproducibility of our research. Implementing GISs in forest management across multiple production units will support the application of the INSPIRE Directive in Romania and can help address other questions aimed at improving forest management by providing accurate and efficient methods for collecting, viewing, and analyzing spatial data [
21].
A unique aspect of our research is that we structured the FMP data into a functional GIS for spatial analysis and decision-making, while accounting for the different roles that the forest must fulfill. This was made possible by designing the GIS in a way that allowed integration of fields with multiple values in the attribute table of the compartment layer. This link between descriptive data and the spatial layers enabled thematic maps to highlight important characteristics of the analyzed compartments. Thematic maps provide clear and synthetic spatial visualization useful for informing sustainable forest management strategies for forest managers, policymakers, and other stakeholders.
This approach not only meets INSPIRE standards but also brings a new methodology to forest management, emphasizing the study’s innovation and its role in sustainable ecosystem management. Our findings are consistent with those already present; i.e., a simultaneous harmonization of the ecological, economic, and social benefits is required to achieve sustainable forest use [
31]. The ecological and economic aspects of forest management discussed in our study are mutually supportive because to harvest forest products, we must first care for the forest.
The tendency to increase the proportion of Norway spruce differs from other outcomes reported in the literature for Romanian Carpathian forests [
3] but it aligns with the requirements of the FMP for the studied PU. The amount and distribution of forest communities may have direct implications for available wildlife habitat, scenic quality, forest products, and recreational opportunities [
51]. Tourists are attracted to the aesthetic value of forests, which is influenced by the age and species composition of stands [
3]. Old-growth stands are more attractive for recreational activities and more valuable economically. However, it is not recommended to exceed a certain age limit; if trees lose their vitality and regenerative capacity, and the timber quality from regeneration cuttings declines [
3], then appropriate silvicultural treatment should be applied.
The economic potential of the study area is reflected in
Figure 9 (showing production compartments) and
Figure S10 (highlighting compartments where trees have reached the harvesting age). The surface analyses (
Figure 7,
Figures S5 and S6) are useful to verify whether harvesting occurs on slopes > 35°, as this requires additional regulations for landslide protection. Forest volume is a key metric in forest management, integrating ecological, economic, and social dimensions [
52]. The estimated median forest volume per compartment and silvicultural treatment analyses are cornerstones of effective forest management. They ensure that interventions are well-targeted, ecologically appropriate, and responsive to changing stand conditions, supporting forests that are healthy, resilient, and productive for both current and future generations. All forestry activities are planned, implemented, and monitored by Forest Management Enterprises in compliance with Romania’s mandatory Technical Norms for forestry [
49].
Limitations of this study include the fact that not all compartments within PU V Arieseni, Gârda Forest District, were included; some historical data were of variable quality; and no field-based validation was conducted. The analysis focused on a subset of representative compartments, selected based on ecological relevance and data availability, to allow for a rigorous and clear examination of key forest management factors. While expanding the study to a broader set of compartments would have increased complexity, it would not affect the structure of the GIS, which remains fully scalable and ready to accommodate additional data as needed.
5. Conclusions
Our study leverages a GIS to develop conservation strategies in Romania’s forests, demonstrating the potential of advanced spatial analysis in both forest conservation and sustainable wood production. It integrates technology with ecology, offering a comprehensive framework to assess and manage forest resources. This approach provides a valuable tool for foresters responsible for monitoring forest conditions, planning silvicultural interventionss, implementing management decisions, reporting outcomes, and updating related information. This scientific approach aligns with the EU’s INSPIRE Directive by emphasizing the role of spatial data in forest conservation and management. It highlights key indicators such as topography, forest volume, species composition and age structure, wood exploitation metrics, and forest works proposed, guiding interventions in Gârda Forest and promoting sustainable, modernized management. Our study illustrates how GIS-can be effectively used to implement the INSPIRE Directive for the spatial data themes related to forests and land use.
This study is novel in its integration of spatial analysis to enhance forest management, highlighting the potential of digital maps in monitoring and assessing the forest conditions and tracking planned or completed silvicultural treatments, as well as providing production-related information. The methodology we applied to collect, process, visualize, and interpret the extensive volume of data from the FMP may be useful for similar studies, and for other countries (in Europe or worldwide) that use similar FMP-based systems in forest administration. We described in detail the steps undertaken and the tools and techniques we used to get from the large volume of information on paper to the geodatabase, thematic maps, and spatial analyses, hence ensuring the replicability of our research. Furthermore, the applied focus of our work complements the review papers (e.g., [
21,
53]) and theoretical research (e.g., [
54]) on GISs in forest management. It enables efficient handling of complex forest data and contributes valuable insights into the responsible use of forest resources—balancing economic, ecological, and social objectives. We thus demonstrate that the GIS, through spatial analysis, is an indispensable decision-support tool that has the potential to advance environmental research and modernize forest management practices. This finding is in line with the conclusions of other works [
7,
11,
15,
21,
33,
34] in this research area.
Our study can be extended in two key directions: updating this GIS and transforming it into a web app. For updating this GIS, further analyses can incorporate new attributes based on stakeholder needs. During the 10 years in which an FMP is implemented, it is possible to update the numerous management concerns (e.g., the forestry works carried out, the volume of harvested wood) included in the designed GIS. This will contribute to efficient preparation and update of the new FMP (commencing in 2031). Similar analyses could be extended in the future for any forest and be aligned with further legislative requirements.
A recent study [
55] observed that web-mapping applications that provide information to the public were rated higher than the forest management applications. Hence, the second main direction for expanding our study is the design of a webmap which will support the development of a web app for mobile devices. This app, equipped with various widgets, will allow data updates from the field. In this case, a platform such as ArcGIS Field Maps should be used. This would enable data collection even in offline mode, and updates would take place when the mobile data connection is restored. At the same time, this web app could be shared with decision-makers for forest management, and part of the web app shared with the public.
Our research complies with European policy standards and introduces innovative spatial analysis methodologies in forest management, providing a tool that could greatly facilitate the work of the forest engineers who currently use only basic digital maps and descriptive information.
