Article

Edge Effects in the Amazon Rainforest in Brazil’s Roraima State

by
Paulo Eduardo Barni
1,
Liana Oighenstein Anderson
2,3,
Luiz Eduardo Oliveira e Cruz de Aragão
2,4,
Arthur Camurça Citó
5,
Reinaldo Imbrozio Barbosa
5,
Haron Abrahim Magalhães Xaud
6,
Maristela Ramalho Xaud
6 and
Philip Martin Fearnside
7,8,*
1
Campus Rorainópolis, Roraima State University (UERR), Av. Senador Hélio Campos, s/nº, Rorainópolis 69375-000, RR, Brazil
2
National Institute for Space Research (INPE), São José dos Campos 12227-010, SP, Brazil
3
National Center for Monitoring and Early Warning of Natural Disasters, São José dos Campos 12247-016, SP, Brazil
4
Department of Geography, College of Life and Environmental Sciences, University of Exeter, Exeter EX4 4RJ, UK
5
National Institute for Amazon Research (INPA), Rua Coronel Pinto, 315, Boa Vista 69301-150, RR, Brazil
6
Brazilian Agricultural Research Corporation—Embrapa/RR, Rodovia BR 174, Km 8, Distrito Industrial, Boa Vista 69301-970, RR, Brazil
7
National Institute for Amazon Research (INPA), Av. André Araújo, 2936, Manaus 69067-375, AM, Brazil
8
Brazilian Research Network on Global Climate Change (Rede Clima), Av. dos Astronautas, 1758, Jardim da Granja, São José dos Campos 70067-900, SP, Brazil
*
Author to whom correspondence should be addressed.
Forests 2025, 16(8), 1322; https://doi.org/10.3390/f16081322
Submission received: 30 May 2025 / Revised: 27 July 2025 / Accepted: 10 August 2025 / Published: 13 August 2025
(This article belongs to the Section Forest Ecology and Management)

Abstract

Forest degradation, characterized by the gradual loss of the forest’s ecological and ecosystem functions, has been happening rapidly in the Amazon. Its main anthropogenic vectors are deforestation, forest fragmentation, selective logging, forest fires, and the edge effect. Impacts on the forest canopy and biomass can be estimated using satellite images and field data. The present study examines the dynamics of edges created annually by forest clearing and the effects of these edges considering the annual extent and loss of forest biomass between 2007 and 2023 in the municipality of Rorainópolis, located in the southern portion of the state of Roraima, in the far north of the Brazilian Amazon. We (i) delimited the edge areas created annually by deforestation between 2007 and 2023; (ii) tested the hypothesis of the existence of a spatial gradient for forest degradation using the increasing distance from the edge as a reference and the spectral behavior of three vegetation indices (NDVI, NBR, and NDWI) at the pixel level from average values of images from the Landsat-5/8 and Sentinel-2 satellites; and (iii) estimated the biomass exposed to deforestation and the edge effect and the consequent loss of biomass due to these processes. The loss of biomass in the study area due to deforestation totaled 17.1 × 10⁶ Mg in 2023, and the forest edge areas totaled 244.9 km2, containing 10.5 × 10⁶ Mg of biomass. During 2023, we estimated a cumulative loss of 0.92 × 10⁶ Mg (8.73%). Analysis of the three vegetation indices showed that there is a gradient of forest degradation, characterized by an increase in the pixel index value from the edge to the interior of the forest. Forest degradation due to the edge effect is an important source of carbon emissions and should be included in national reports on greenhouse gas emissions.

1. Introduction

Over the last 50 years, Brazil’s Amazon rainforest has been subjected to a series of disturbances, including deforestation and selective logging (SL) (e.g., [1,2,3,4]) and, more recently, mining (e.g., [5,6]). These primary disturbances promote forest fragmentation and make way for other deleterious cascading effects, such as edge effects, the entry of fire, and the loss of biodiversity, forest biomass, and ecosystem services [7,8,9,10]. These processes, which contribute to the ongoing decline in the integrity of the forest environment, are relatively unstudied. For example, it is not yet clear how intensifying global climate change affects forest regeneration mechanisms in response to disturbances (e.g., [9,11,12]).
Considering deforestation in the Amazon itself, the first direct and visible cause of forest degradation is the edge effect. This effect is initially characterized by the death of trees that are damaged by fires that escape from the burning of biomass cut during deforestation or cattle pasture burning to suppress woody invaders, followed by a loss of biomass in dead trees [8,13,14]. After deforestation, the strip of forest in contact with the deforested area, known as the “forest edge,” suffers from the direct impacts of increased solar radiation and wind incidence, altering the forest’s temperature and humidity on a microclimatic scale [15,16,17,18]. These changes in the forest in the contact areas between deforestation and the forest interior can both kill trees through hydraulic stress and make the contact area more susceptible to fire, which occurs frequently since fire is used as a management tool in agricultural areas (e.g., [19,20]). Over the years, this contact zone can increase its influence and advance into the forest, which is characterized as forest degradation or decline [8,13,14,21].
In Roraima, located in the north of the Brazilian Amazon, primary forests covered 184,500.0 km2 (82.3% of the state’s total area) before the intensification of colonization began in the 1970s [22]. By 2023, 5.1% of this forest area had been completely deforested. Roraima has one of the lowest rates of deforestation in Brazil’s nine-state Legal Amazon region, surpassing only the states of Amapá and Tocantins. Between 2009 and 2023, the deforestation process cleared forests at an average rate of 232.1 ± 115.2 km2 per year [4]. In the last five years alone (2019–2023), with a peak of 590 km2 in 2019, average deforestation rate rose to 353 ± 119.2 km2, representing an increase of 138.3% over the previous five-year period. The low deforestation rates observed are largely due to the state’s geographical isolation from the rest of the Amazon and its great distance to Brazil’s largest consumer markets, located in the southeast of the country (e.g., [23]). Despite the rates of deforestation being considered low compared to the rest of the Amazon, these absolute figures are extremely high when one considers the state’s small population of 636,707 inhabitants at the time of the last census in 2022 [24].
Forests in Roraima are increasingly susceptible to understory forest fires due to edge degradation and climate change. In the El Niño years of 1997/98 and 2003, most of the forest areas that caught fire (11,394–13,928 km2 in 1997/1998 and 2147.7 km2 in 2003) were located around the state’s savanna areas [25,26,27]. Roraima’s savannas occupy an area of approximately 40,000 km2 in the central and northeastern portions of the state and are naturally dry environments where vegetation is dependent on fire to fully express its biological/ecological functions. Plants and animals in the savannas have co-evolved with fire, developing synergies and adaptations for this coexistence, while humid tropical forests have not adapted to fire due to the low frequency of these events (e.g., [28,29,30]). During the 2015/2016 El Niño, in addition to fires being recorded in drier areas near forest close to the savannas [27,31], ~2000 km2 of forest fires were recorded in the southern portion of Roraima (the wettest part of the state), where understory forest fires had not been previously observed [31,32]. After this first major fire, the region experienced two smaller forest fire events (during the 2019 and 2023/2024 El Niños), indicating that the fire regime is changing due to climate change (e.g., [20]).
The forest edge increases in conjunction with the opening of roads, invasions of government land, and the creation of settlement projects (SPs), which lead to increased deforestation and the consequent fragmentation of the forest [14,33]. The process of forest fragmentation can be monitored from multi-temporal satellite images and is characterized by patterns resembling a “fishbone” (e.g., [8,13,14,34]). This process is aggravated by SL, whether legal or illegal [1,2,35]. In addition to the degradation of the forest through the removal of trees and the opening of logging decks and skidding tracks, SL provides new roads, allowing deforestation and the edge effect to penetrate even further and contribute to the decline of forest cover (e.g., [2,36]).
The width of the edge strip, and consequently the scope of its effects, can be defined by the purpose of the study being conducted. For example, studies on forest fragmentation and biomass losses in the Amazon have used edge bands of up to 1000–1020 m (e.g., [34,37,38]). Microclimatic changes in forest edge areas, such as increased wind speed and turbulence, were detected at an average distance of 135 ± 105 m and 270 ± 230 m, for wind speed and turbulence, respectively, inducing an increase in tree mortality rates up to an average distance of 503 ± 497 m from the edge [37,39]. However, there seems to be a consensus among researchers that the greatest intensity of edge effects (tree mortality/loss of biomass/carbon) mainly occurs within the first 100 m away from the forest edge/deforestation (e.g., [8,14,17,40,41]).
In areas of consolidated deforestation, as is now the case in southern Roraima, SL takes place in forest areas that serve as “legal reserves” [42] in the lots within settlement areas, private ranches, and government forest areas that are in the process of being invaded. In areas of consolidated deforestation across the Amazon as a whole, the land cover is predominantly cattle pasture (~70%), followed by regenerating vegetation (~25%) and annual + perennial agriculture (~5%) [43]. Because the management of pasture areas still largely relies on fire, in years of severe drought, such as during El Niño events, landholders lose control of the fire, which reaches the vulnerable edges of the forest, causing understory forest fires [2,19,20,31,44,45,46]. In addition, ongoing global climate change is altering the individual characteristics of fires and changing fire regimes. In some extreme cases, fire regimes are being pushed outside the historical range of variability in terms of frequency, size, seasonality, or severity [47,48,49,50].
Detecting and monitoring forest degradation processes is essential for enabling the management and conservation of these areas [51,52]. With this vital information, government agencies can increase surveillance in critical areas and work on developing more efficient public policies that promote the conservation of forest resources. Actions to conserve existing forest resources should be designed both for areas already consolidated with deforestation (e.g., eradication or control of the use of fire) and for forested areas.
Tools (such as software and classification algorithms) and products (such as multispectral and multitemporal images) based on remote sensing of the forest can be used to detect and monitor areas that are constantly changing, mainly due to human actions in and around them [53,54,55,56]. Multitemporal images can be used to detect and point out patterns of ongoing forest degradation, providing valuable input for better decision-making to preserve and conserve forest resources for current and future generations [52].
Various vegetation indices are used in the Amazon to detect forest degradation. The Normalized Difference Vegetation Index (NDVI) is probably the best known and most widely used. Higher NDVI values indicate vigor or greater health of the forest canopy [57]. Another index that has been gaining prominence for assessing forest degradation due to fires is the Normalized Burn Rate (NBR) (e.g., [53,58,59,60,61]). A third index, the Normalized Difference Water Index (NDWI), is used to delineate water bodies and detect the presence of water in the internal structures of plants. A decrease in their values indicates a reduction in photosynthetic capacity and water accumulation by vegetation (e.g., [56]).
The general objective of this study was to analyze the dynamics of edges created annually by forest clearing and their effects, considering the area (extent: km2 y−1) and the loss of forest biomass (Mg y−1), between 2007 and 2023 in the municipality (county) of Rorainópolis, in the southern portion of the state of Roraima. The specific objectives were to (i) delineate the edge areas (a 100 m strip measured perpendicularly from the edge towards the interior of the forest) created annually by deforestation between 2007 and 2023; (ii) test the hypothesis of the existence of a spatial gradient for forest degradation using the increasing distance from the edge as a reference point, and the spectral behavior of three vegetation indices (NDVI, NBR, and NDWI), at the pixel level, from data (average values) extracted from Landsat-5/8 and Sentinel-2 satellite images of the forest edge; and (iii) estimate the biomass affected by deforestation and the edge effect, as well as the consequent loss of biomass due to these processes.

2. Materials and Methods

2.1. Materials

2.1.1. Study Area

Most of the study area is located in the municipality of Rorainópolis, Roraima. The study area covers 3103.4 km2 (60.1 km × 51.7 km) along 52.7 km of the BR-174 highway (Manaus—Boa Vista) and 796.5 km of secondary roads in the Anauá Managed Settlement Project and other smaller settlements (Figure 1). This area encompasses ecotone forests (or “ecological tension zones”), which are situated between dense ombrophilous forest and campinarana, between open ombrophilous forest and campinarana, and between dense and open ombrophilous forest [22]. The average annual rainfall (2181.2 ± 367.4 mm) ranged from 1813.8 mm to 2548.7 mm between 1988 and 2018 (n = 21 years), and the climate, according to the Köppen classification, is Af (equatorial forest) and Am (monsoon climate) [62].

2.1.2. Field Data

Signs of SL (stumps and remains of tree trunks and traces of log landings and skid trails), as well as signs of the non-occurrence of SL (absence of traces), were obtained from field observations. The fires in 2015/2016 in the study area were confirmed by data collected in 2016 by undergraduate students at the State University of Roraima (UERR) during their final course work, in which 21 plots measuring 4 m × 250 m (1000 m2 or 0.1 ha) were inventoried. Five of these inventoried plots (23.8%) were lost to deforestation by 2023. Fire scars (n = 230) were confirmed by students in university field classes through forest inventories and observation of the forest understory, the geographical coordinates of the sites were collected, and records were made of traces of fire (scars at the base of the trunk of living trees, presence of charcoal on the ground, partially burned branches and dead trees), or the non-occurrence of fires (absence of these signs). In the office, the data were transformed into vector point files (shapefiles).

2.1.3. Geographic Database

The geographic database was composed of the following items:
(1)
Point observations of the presence or absence of SL and of fire traces (n = 92) in a georeferenced file (shapefile file); data were collected at the edge of the forest through forest inventories and field visits (Table S1 in the Supplementary Materials).
(2)
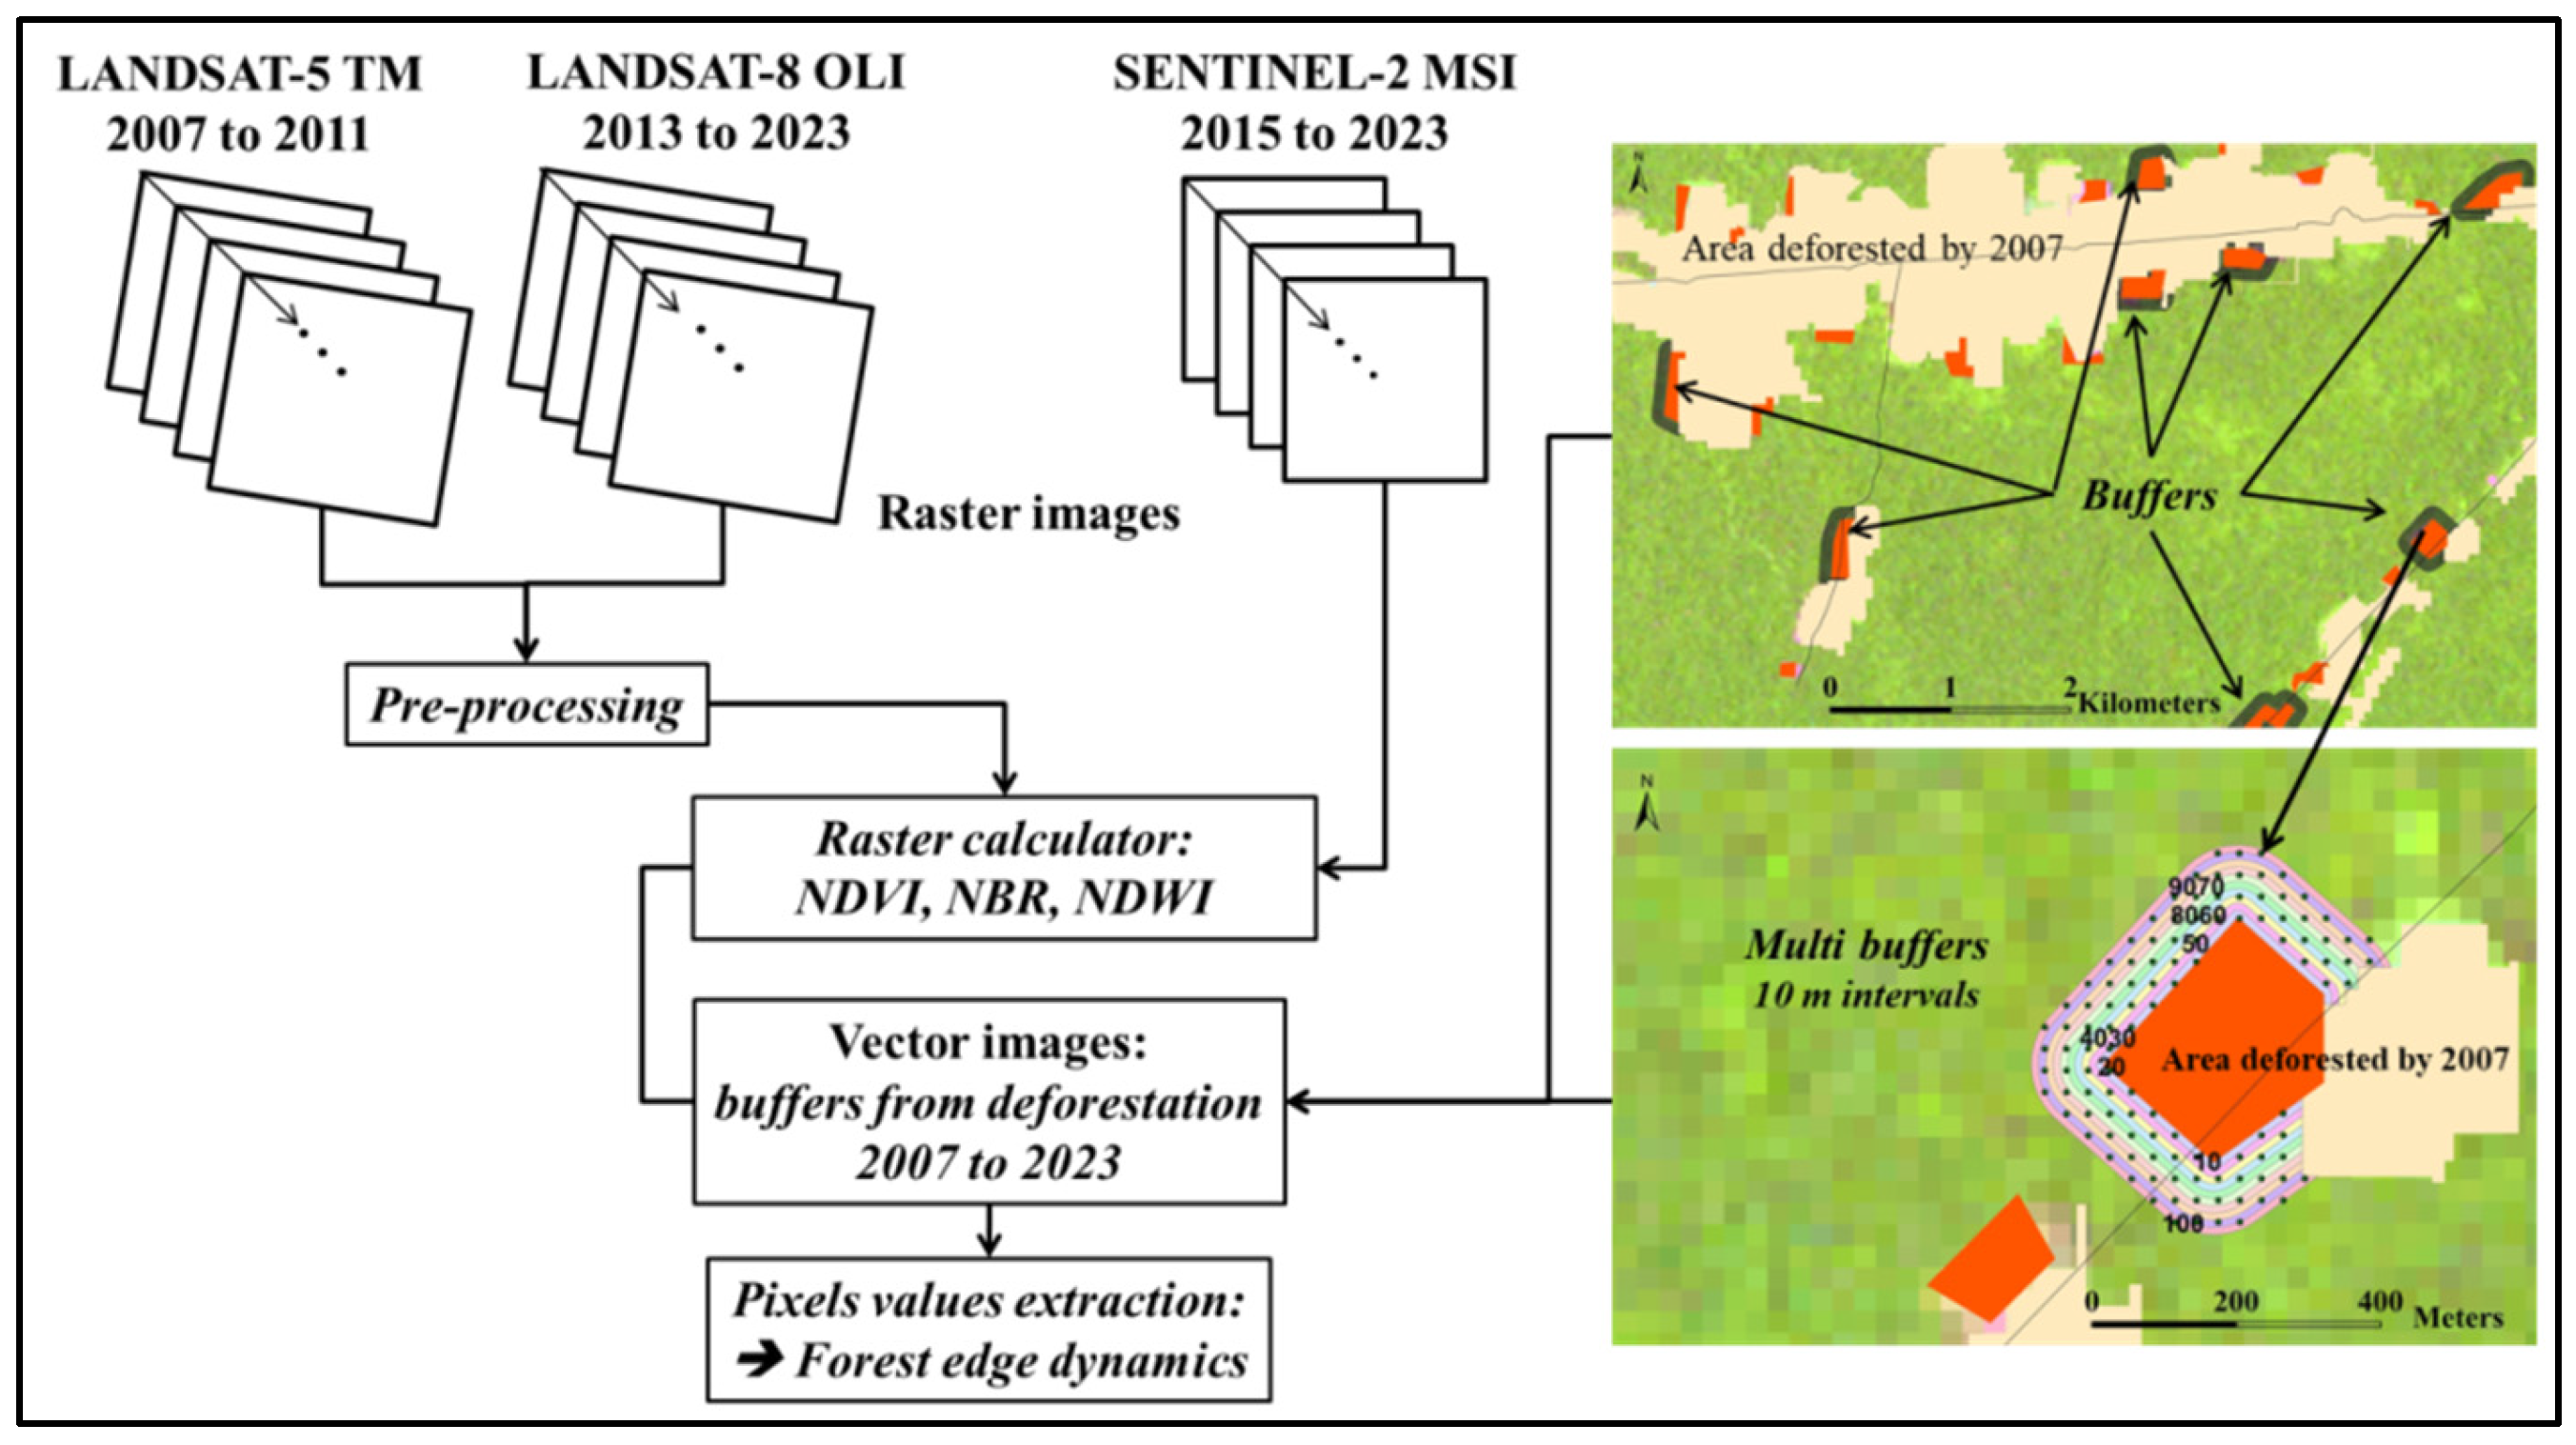
From Barni et al. [2], data were obtained from multi-temporal satellite images: (a) Landsat-5 TM (2006 to 2011), (b) Landsat-8 OLI (2013 to 2023) (collection 2, level 1, with a 30 m spatial resolution) at path 231/row 60 (https://earthexplorer.usgs.gov/, accessed on 9 August 2025) and (c) Sentinel-2 MSI, scene 20NQF, with 10 m spatial resolution (2015 to 2023) (https://dataspace.copernicus.eu/, accessed on 9 August 2025)) (Table S2). These images covered the analysis period from 2007 to 2023, except for 2012, which lacked usable images [2]. All Landsat 5 and 8 images were pre-processed for atmospheric correction by subtracting “dark objects” (DOS1) (e.g., [63]) using the “Semi-Automatic Classification Plugin” (SCP) [64]. The Sentinel-2 (L2A) images were obtained with atmospheric correction already carried out by the image provider, using the Bottom of the Atmosphere (BOA) Reflectance Algorithm, which filters out or attenuates interference in the reflectance of the lower part of the atmosphere (https://docs.sentinel-hub.com/api/latest/data/sentinel-2-l2a/, accessed on 9 August 2025)). Vegetation indices were then calculated by extracting the values of pixels overlapping the forest edges.
(3)
Annual deforestation maps (shapefiles) were cut out for the study area, based on the PRODES deforestation data available for the entire Brazilian Amazon [4]. These data were used to define the edges and analyze their annual dynamics.
(4)
Shapefile maps of the great fire of 2015–2016 and SL areas (2007 to 2015), cut out for the study area, were obtained from Barni et al. [2].
(5)
The SL maps from 2016 to 2023 were recorded by manually editing polygons (≥1 hectare (ha)) from the annual Landsat-8 and Sentinel-2 satellite images These data (fire area and SL) were used in the analysis by systematically cross-referencing them with the annual forest edge data.
(6)
Data on the spatial distribution of forest biomass (Mg ha−1) were obtained from the study by Barni et al. [22]. These data were used for estimates of biomass exposed to deforestation and the edge effect, as well as the losses due to these processes.
(7)
Precipitation data from 1990 to 2023 for the point 0.7000 north latitude and −60.4500 west latitude (the center of the study area) were acquired from the “Nasa/Power Ceres/Merra2” portal (https://power.larc.nasa.gov/beta/data-access-viewer/, accessed on 9 August 2025)). These data were used to indicate the degree of humidity in the month/year when the images were acquired during the analysis period (Table S2).

2.2. Methods

2.2.1. Edge Dynamics

The edge creation model was based on the forest remnant map and annual deforestation data from PRODES for the period from 2007 to 2023 [4]. A 100 m wide buffer zone around the edges of the deforested areas towards the forest interior was used [14,21,37,65]. To define the annual edge growth (km2 y−1), the edge area created in the previous year was subtracted from the edge area created in the following year. This procedure was carried out to determine the dynamics of edge creation in the study area and assess its progress over the analysis period (Figure S1 in the Supplementary Materials).

2.2.2. Forest Edge Degradation Levels

To test the hypothesis of the existence of a spatial gradient for forest degradation between 2007 and 2015, taking the edge as a reference point and considering the spectral behavior of three vegetation indices (NDVI, NBR, and NDWI), 100 m buffers were created, with 10 subdivisions of 10 m each (multi-buffers), perpendicular to the edge, around deforestation polygons (≥5 ha) recorded in 2007 (Figure 2). Subsequently, this same procedure was applied to deforestation polygons (≥5 ha) recorded in 2015 to test the hypothesis that a spatial gradient exists for forest degradation between 2015 and 2023. In this case, the remaining buffers, which originated from deforestation in 2007 and underwent successive exclusion operations due to deforestation in later years, were incorporated into the buffers created in 2015. This procedure was necessary due to the conversion of pixels mapped as forest in 2007 into pixels classified as deforestation in later years. This step allows for a comparison of the results obtained by the Landsat-8 satellite with those from the Sentinel-2 satellite for the period from 2015 to 2023. To assess whether the edge effect had progressed beyond the 100 m strip, a 200 m strip was created, subdivided into 20 (twenty) 10 m strips in the polygons ≥ 5 ha in area that were used in the previous analysis (which considered the 10 m to 100 m strip). In this case, the vegetation indices for the last four years of the edge (2020 to 2023) were evaluated, assuming the current state of the edge in the study area within this distance range. These distance ranges within the buffers were used as a mask to extract pixel information from annual satellite images, which were converted into vegetation indices (NDVI, NBR, and NDWI). The shapefile of points used to extract the pixel values of the 2023 Landsat-8 image was used to extract the pixel values of all images from the other years in the series (2015 to 2022), as well as the pixel values of vegetation indices from Sentinel-2 images (2015 to 2023) (Tables S3 and S4). The same procedure was followed for the analysis carried out to assess the edge effect beyond 100 m from the forest edge. To reduce uncertainties related to calculated values of vegetation indices between 2015 and 2023, we used the Quality QA_AEROSOL band (clouds) from the Landsat-8 image bank and the MSK_CLDPRB band (cloud probability) from the Sentinel-2 image bank (geodatabase) to identify and exclude pixels “contaminated” by clouds from the calculations.

2.2.3. Calculating Vegetation Indices

The vegetation indices (NDVI, NDWI, and NBR) used in this study are well known and widely used in research in the Amazon. However, our study area is poorly represented in terms of research on the behavior of vegetation using these indices. The exceptions are two studies that successfully used the NDVI and NBR [2] and the NDVI and NDWI [56] in part of the forest covered by our study area. The Normalized Difference Vegetation Index (NDVI) was calculated using Equation (1):
NDVI   =   ( N I R R e d ) ( N I R + R e d )
where NIR (near infrared) represents the wavelength range in the near infrared region (0.86 micrometer (µm): 0.85–0.88 µm) and R represents the red wavelength range (0.66 µm: 0.64–0.67 µm). High positive values are related to the greenness of vegetation (e.g., [66,67]).
The Normalized Burn Ratio (NBR) [68] was calculated using the NIR and short-wave infrared (SWIR2) bands (2.11–2.29 µm), according to Equation (2):
NBR   =   ( N I R S W I R 2 ) ( N I R + S W I R 2 )
The Normalized Difference Water Index (NDWI) was calculated using the NIR and SWIR1 or medium infrared (MIR) bands (1.57–1.65 µm), according to Equation (3):
NDWI   =   ( N I R S W I R 1 ) ( N I R + S W I R 1 )
The sensors do not have the same number of bands, and these do not necessarily occupy the same positions within the wavelength intervals of the electromagnetic spectrum. Therefore, the equations shown in Table 1 were used for the NDVI, NDWI, and NBR calculations for Landsat-5, Landsat-8, and Sentinel-2.

2.2.4. Estimates of Biomass Loss

To estimate biomass loss due to deforestation and the edge effect, we used the map of total dry biomass (live + dead, below- and above-ground) developed by [22] for the entire state of Roraima. This map (resolution 1 km2), which assumes that the biomass of the original forest was in dynamic equilibrium prior to the colonization of the Amazon [69], was used as an initial reference for the calculations of the biomass exposed to various drivers of forest loss and degradation, including the edge effect. Based on this reference, the estimate of annual biomass loss due to deforestation (clear-cutting) was made by subtracting the biomass of the deforested areas and adding their extent, without considering spontaneous regeneration (secondary vegetation), the planting of forests (silviculture), perennial crops (e.g., citrus), or annual crops or pasture. The biomass losses due to SL, fire, and the edge effect in areas that were subsequently deforested were discounted from the biomass computed for deforestation, since they had already been accounted for while the forest was still standing.
The loss of biomass due to forest degradation by the edge effect was calculated using the loss fraction of 0.0875 deduced from the study by Nunes et al. [14] on effects up to 100 m from the forest edge. This fraction was applied to extract total biomass values (pixel by pixel) within the edge strip from the biomass map (Mg ha−1) developed by Barni et al. [22]. Note that [14] calculated biomass loss considering only dry above-ground live biomass (282.2 ± 15.3 Mg ha−1), while in our study, we considered total dry biomass (live + dead, below- and above-ground). In the area of overlap between the edge and the SL area, an 8.2% percentage of biomass loss (multiplication factor of 0.082) was applied to calculate the biomass loss from SL. This loss fraction was also used by Barni et al. [2], assuming an average total dry biomass content (live + dead, above- and below-ground) of 435.3 Mg ha−1 for the dense ombrophilous forest in the study area. In this case, the average loss would be 35.7 Mg ha−1, subject to variations (either up or down), depending on spatial and environmental variations (forest types) of the land surface covered by the biomass map. For the area of overlap between the edge area and the 2015/2016 fire, a biomass loss percentage of 22.15% was used in accordance with Barni et al. [2] and added to the edge loss percentage. When there was overlap among all three effects (edge, SL, and fire), these rates were added to define the total loss. All calculations were performed using Equation (4):
ΣBiomassi = (Σpixelsi × BM × PA)/10,000
where ΣBiomassi is the biomass map (Mg) for year i; Σpixelsi are the pixels in the map for year i; BM is the reference biomass map (Mg ha−1); and PA is the pixel area (m2). The reference to dividing by 10,000 refers to the units of measurement in hectares (ha), where 1 ha = 10,000 m2.

2.2.5. Evaluation of Error Propagation in Biomass Estimation

To assess the propagation of error in biomass estimation, a multibuffer of edge samples was used, with 10 strips of 10 m each (513.6 ha in total). Next, the vector file was used to extract biomass values specific to each distance strip. In this case, the amount of biomass per distance strip (Mg), the average (Mg ha−1), the standard deviation (Sd), and the coefficient of variation (CV%) were evaluated. This evaluation was performed in a generalized manner and by considering forest types (Ombrophilous and Campinarana) individually.

2.3. Statistical Analysis

To analyze forest degradation patterns using data extracted from annual index images in forest edge areas, an analysis of descriptive statistics was performed. The observed parameters included 1. the number of pixels sampled in each range of distances from the edge; 2. minimum and maximum values; and 3. the mean and standard deviation of the mean, considering the 100 m range, counted from the forest edge and subdivided into 10 sub-ranges 10 m in width each. This same procedure was applied to the analysis of the ranges within the 200 m buffer, but only for the years from 2020 to 2023. Inferential statistical analysis was performed using normality tests (Liliefors), ANOVA, Kruskal–Wallis, correlation tests, and simple linear regression. All analyses were performed with a statistical confidence level of 95% (type I error: α = 0.05).

Hypothesis Testing

To test the hypothesis of the non-existence of a gradient of edge degradation, in the direction from the edge to the interior of the forest (null hypothesis: h0), simple regression tests (β1 + β2X) were applied. We used the values of the distance bands, ranging from 10 to 100 m from the forest edge, as the independent or explanatory variable (x-axis) and the average values of the vegetation indices extracted annually (2007 to 2023) within these respective distance bands as the dependent or explained variables (y-axis). In this case, the significance of the slope coefficient of the regression line (β2) was observed for each test:
1. β2 = 0 or α > 0.05: accept h0; 2. β2 ≠ 0 or α < 0.05: reject the null hypothesis (h0) and accept the alternative hypothesis, h1. β1 is the intercept coefficient of the regression line.
The procedures described above were also applied to assess whether edge effects persisted beyond the 100 m range. In other words, the procedure determines whether there is a gradient of edge degradation in the direction from the edge to the interior of the forest, considering a 200 m edge range and taking into account the time interval from 2020 to 2023.

3. Results

3.1. Quantification of Deforestation, SL, and Fire by Land Cover

Cumulative deforestation in the study area totaled 1010 km2 in 2023 [4], representing 33.4% of the originally forested area (3021 km2). Deforestation during the analysis period was 436.7 km2, with an average annual rate of 27.3 ± 15.6 km2. Of this total deforestation, 204.3 km2 (46.8%) had already been affected by the edge effect, SL, and fire. SL occurred in 759.3 km2 between 2007 and 2023, representing 25.1% of the originally forested portion of the study area (Table 2). Of this logged area, 21.8% (165.2 km2) was deforested during this period. Forest degradation by understory fires was recorded in two occurrences: the first and most impactful in 2016, affecting 489 km2 of forest (16.2%), and the second in 2019, impacting 21.0 km2 and representing only 0.7% of the original forest area. Both fire occurrences occurred during El-Niño years [2]. The Anauá National Forest (FLONA) was affected by 31 km2 of burned areas in 2016. Of the areas affected by the fire in 2016, 127.7 km2 (26.1%) was deforested by 2023. In this degradation process, the dense ombrophilous forest [70] was most impacted: 94.1% by deforestation and 89.4% by SL and 75.2% (weighted average) by fire areas in two fire events. Of the fire area in 2019, 64.2% (13.5 km2) occurred in dense ombrophilous forest, and the other 35.8% (7.5 km2) occurred in campinarana vegetation formation. Of the total area burned in 2019 (21.0 km2), 15.4 km2 (77.2%) occurred in an area that had already burned in 2016.

3.2. Dynamics of Deforestation and Edge Growth

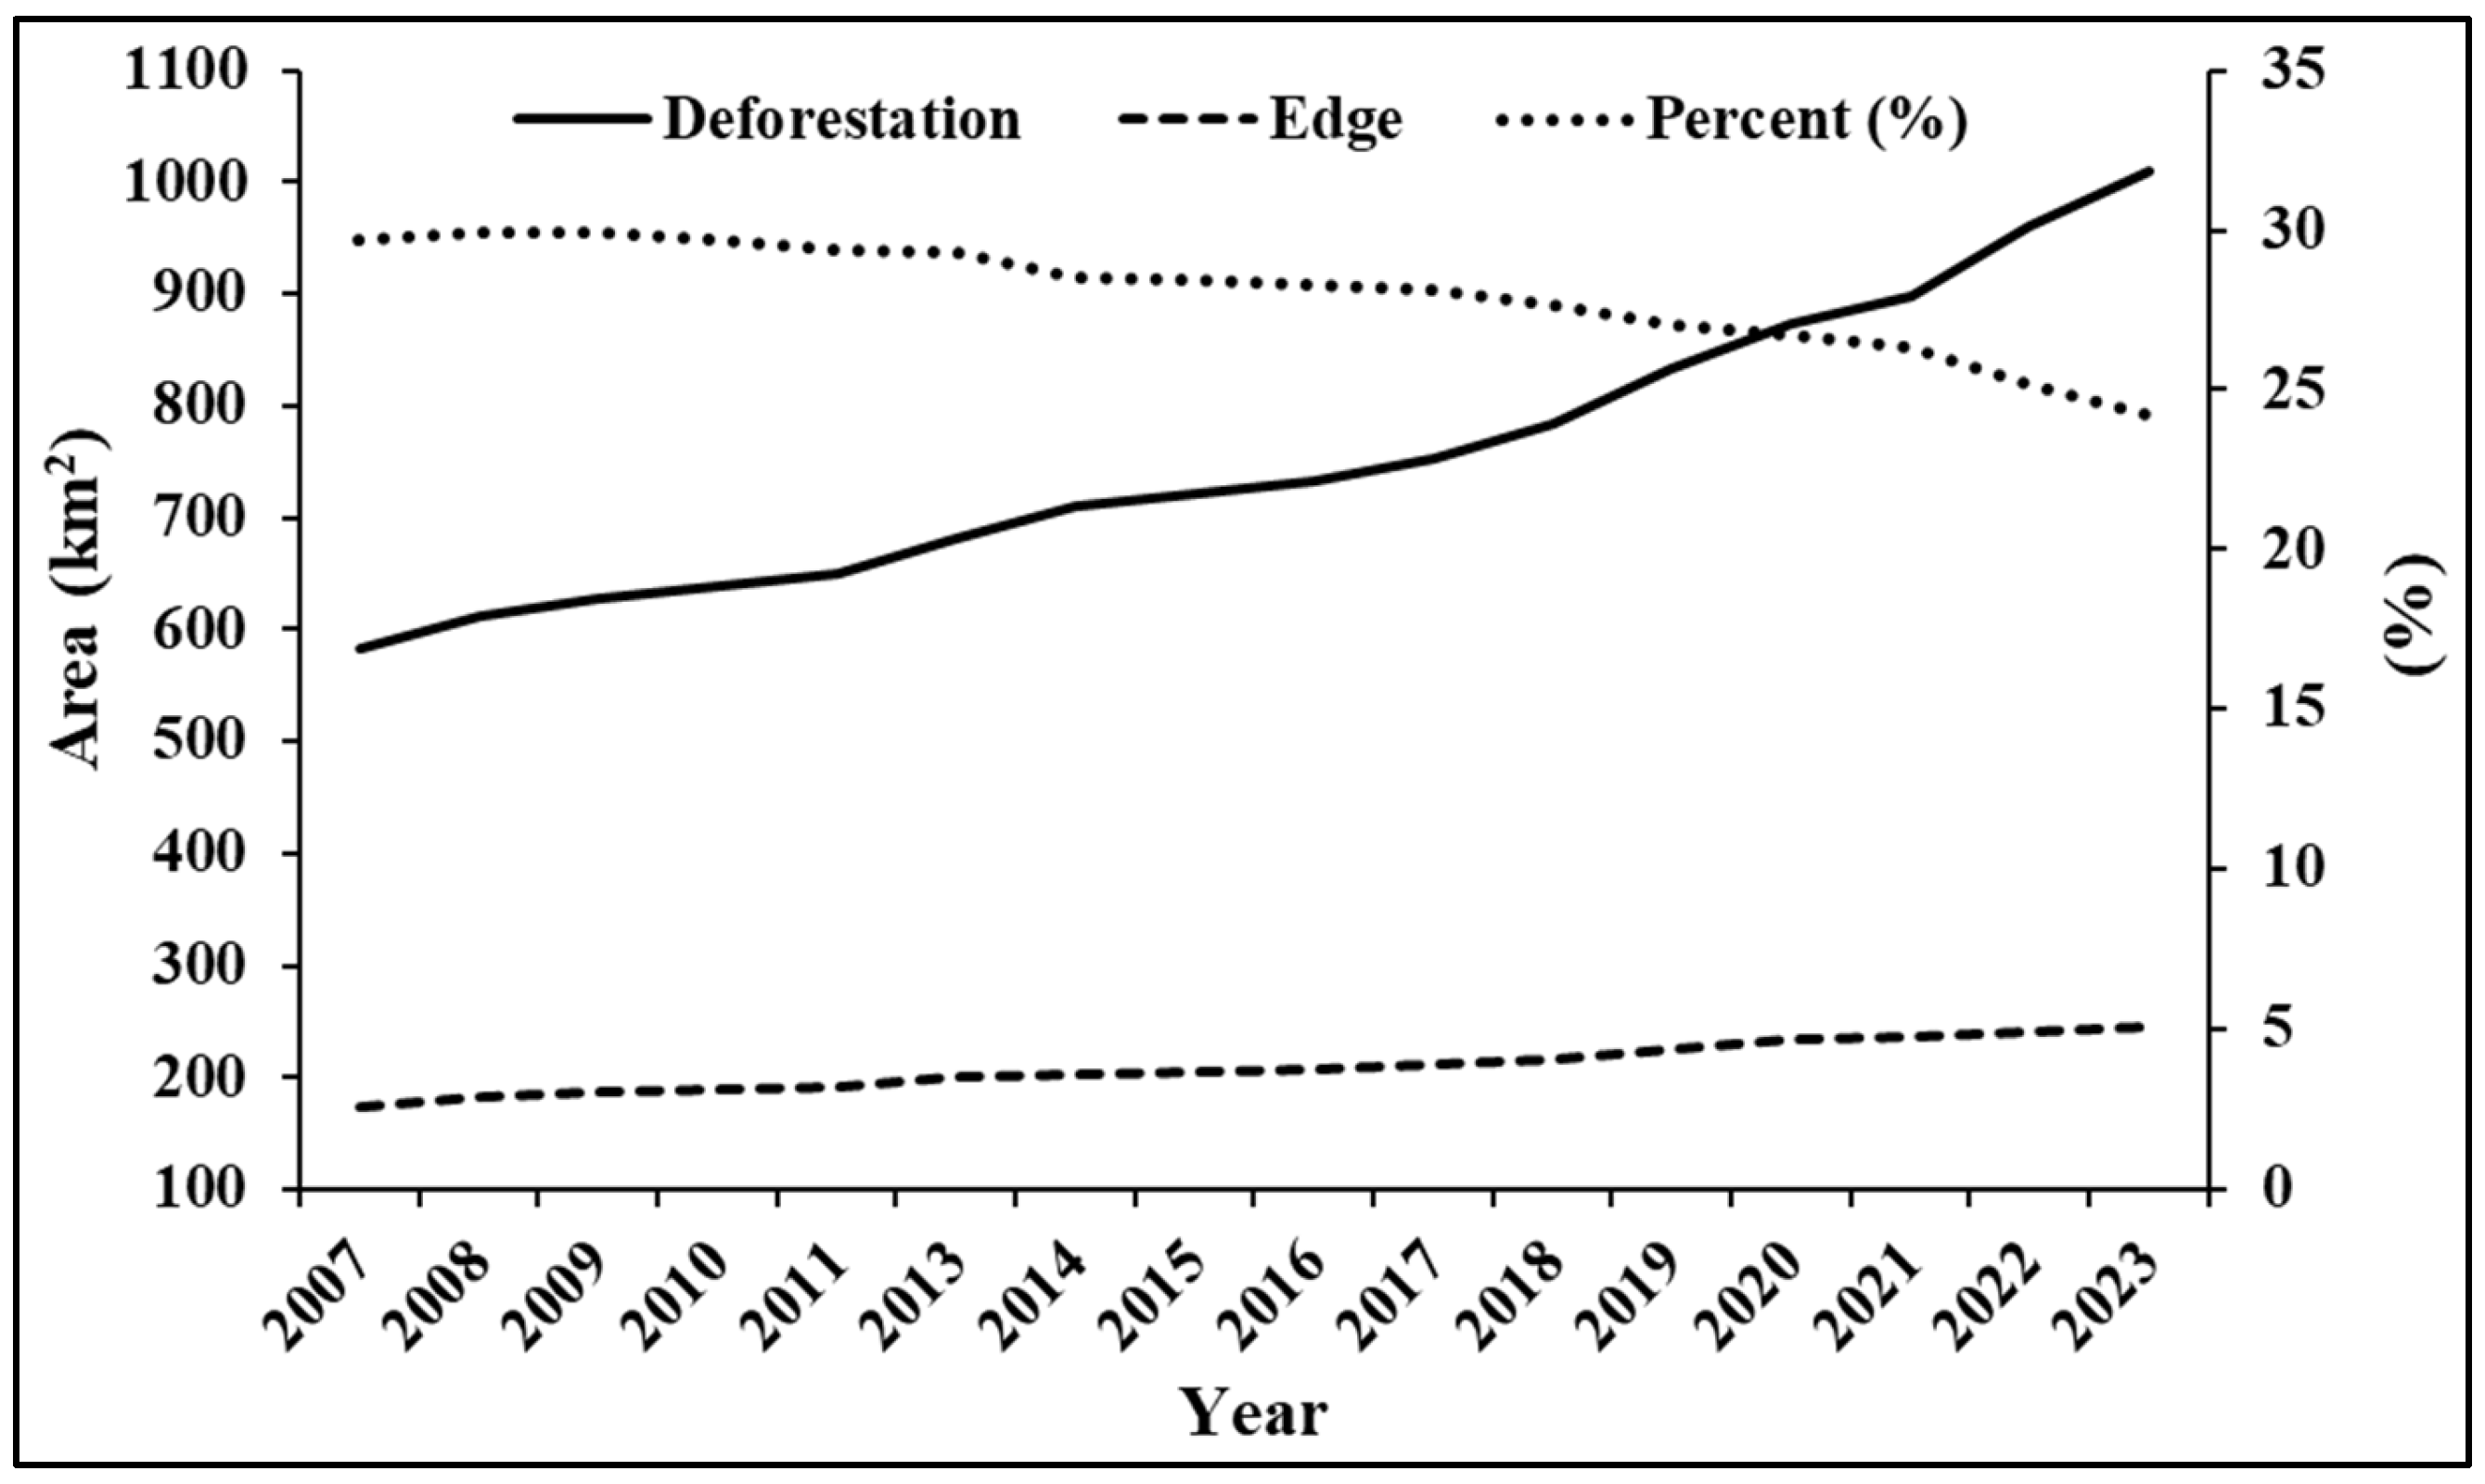
In 2007, the study area had 573.3 km2 of cumulative deforestation and 173.4 km2 of edge area, considering a 100 m-wide strip along the deforestation line. During the analysis period, cumulative deforestation grew by 73.0% (average rate of 3.5% per year), reaching 1010 km2 in 2023, while the edge increased its area by 37.5% (rate of 2.1% per year), reaching 244.9 km2 in 2023 (Table S5; Figure 3). The annual increase in deforestation during the period explained 30.2% of the variation in the annual percentage decreases (%) of the edge areas within the buffers created in 2007 (adjusted R2 = 0.3025; p = 0.0196). It also explained 60.8% of the variation in the decay annual percentage decreases in the edge areas created in 2010 (Tables S6 and S7).

3.3. Spectral Behavior of Pixels at the Forest Edge from 2007 to 2015

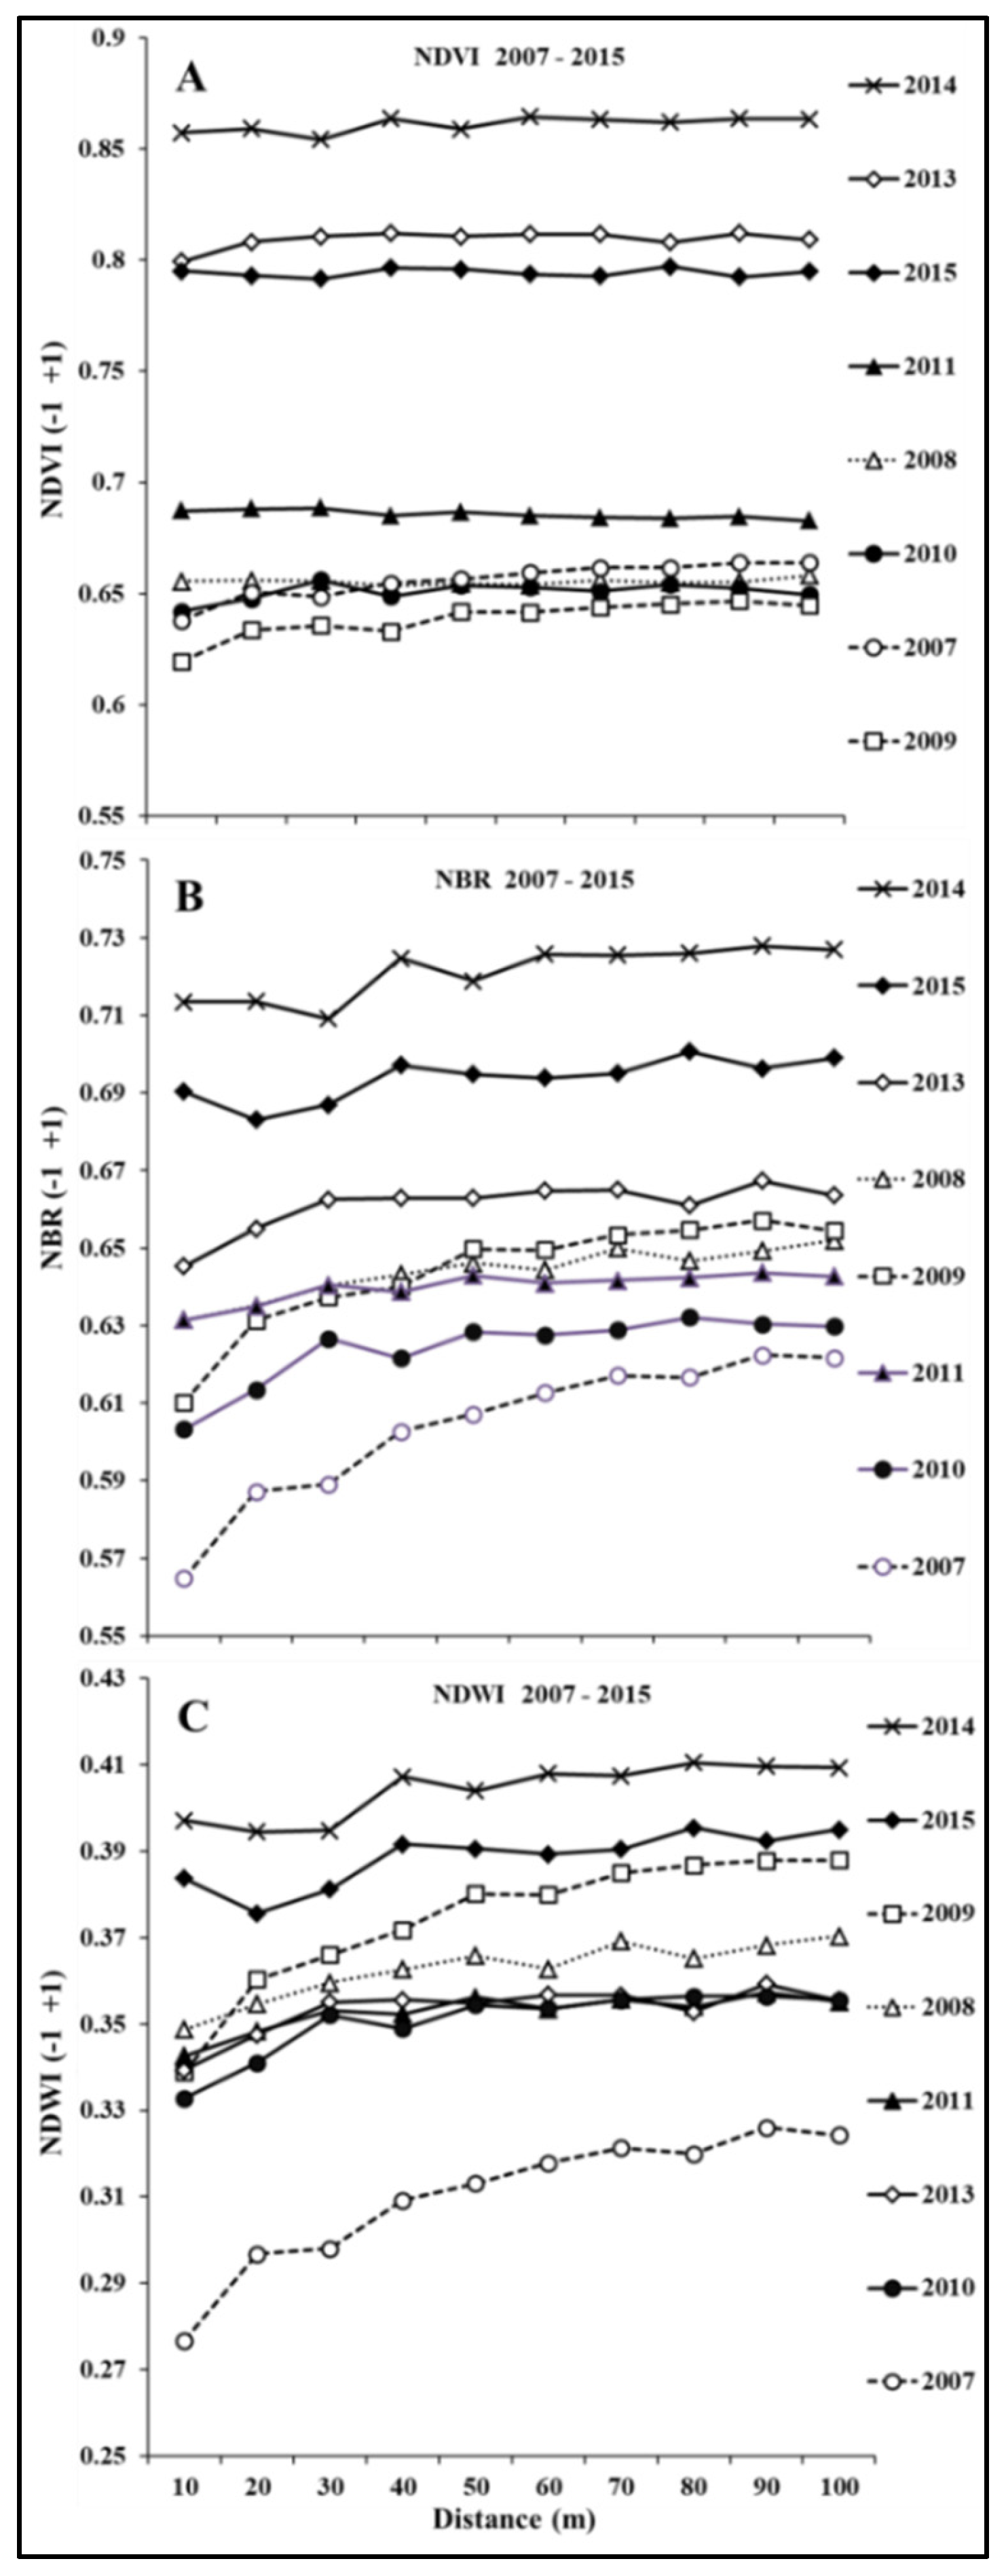
The spectral behavior of the pixels at the forest edge was evaluated based on the mean values of NDVI, NBR, and NDWI, with N ranging from 6712 Landsat-5 pixels in 2007 to 3721 Landsat-8 pixels in 2015, with a loss of 44.6% due to deforestation. The NBR and NDWI values appear to show a pattern of an increasing trend for the brightest signal (reflectance) recorded from the shortest distance from the forest edge (10 m) to the 100 m distance limit we considered. This effect was most pronounced in 2007 based on these two indices, while NDVI did not demonstrate this behavior (Figure 4). However, from simple linear regression analysis with increasing distance from the forest edge as the explanatory variable, the NDVI failed to reflect this effect in only four years: 2008 (R2adj = −0.0221; p = 0.6009), 2010 (R2adj = 0.0969; p = 0.1968), 2013 (R2adj = 0.1506; p = 0.1436) and 2015 (R2adj = −0.1156; p = 0.7961), with the other 12 years reflecting a significant effect of increasing brightness with increasing distance from the forest edge (Table 3). Confirming the visual analysis, in all observed years, NBR and NDWI presented a significant effect with increasing distance from the forest edge. For example, increasing the distance from the forest edge had an exponential effect on the increase in the pixel index value of NBR, explaining 98.2% (R2adj = 0.9819; p = 0.0001) of the variation in this effect, and the NDWI accounted for 97.6% (R2adj = 0.9756; p < 0.00001) of the variation in this effect for the year 2007. Although the NDVI was also highly correlated with the NBR and NDWI in most observed years, in the images from the years 2008, 2011, and 2015, the relationship (R2) between these indices was not significant (Table S8). The results of the analysis of variance for non-normal data (Kruskal–Wallis) comparing the mean values of the NDVI, NBR, and NDWI between years are reported in Table S9. The results indicate that there is indeed a gradient of forest degradation detected between 2007 and 2015 by the three vegetation indices used in the present study, confirming our hypothesis.

3.4. Spectral Behavior of Pixels at the Forest Edge from 2015 to 2023

The years 2019 and 2023 had the highest incidence of clouds in the Landsat-8 index images. Only 2631 (60.4%) pixels were evaluated for the year 2019, and 2600 (59.7%) pixels were evaluated for the year 2023, considering the images obtained from Landsat-8. The other seven years used an average of 97.5% of their pixels for analysis (Tables S3 and S4). On the other hand, considering the pixels obtained from Sentinel-2 images, the average use of pixels was 99.2%.
The three indices showed a significant effect of increasing pixel values with increasing distance from the edge toward the forest interior, except for the NDVI obtained from the Landsat-8 images for the years 2018, 2021, and 2022, which did not show statistical significance. The year 2017 showed the highest R2 (0.8852) calculated for the NBR in the Landsat-8 images (Table 4, first part). The lowest coefficient of determination (R2adj = 0.637; p = 0.0038) was observed between the NDVI and NBR values for the year 2021 (Table S10). Table S11 presents the results of the analysis of variance for non-normal data (Kruskal–Wallis) of the three vegetation indices from 2015 to 2023 based on Landsat-8 data.
Considering the Sentinel-2 images, the highest R2 value (0.8589) was calculated for 2019 from the NBR image. However, only the years 2015 and 2016 had R2 values that were all high and statistically significant. In the year 2018, all R2 values were very low, and the year was therefore not statistically significant, demonstrating no relationship between vegetation index values and increasing distance from the forest edge (Table 4, second part). In the simple linear regression analysis, the coefficient of determination (R2) for the NDVI and NBR in 2017, 2019, 2020, and 2021 was not significant (Table S12). The same case was observed for 2017 involving the NDVI and NDWI (R2adj = −0.0569; p = 0.5013). Table S13 presents the results of the analysis of variance for non-normal data (Kruskal–Wallis) for the three vegetation indices for the period from 2015 to 2023 based on data from the Sentinel-2 satellite.
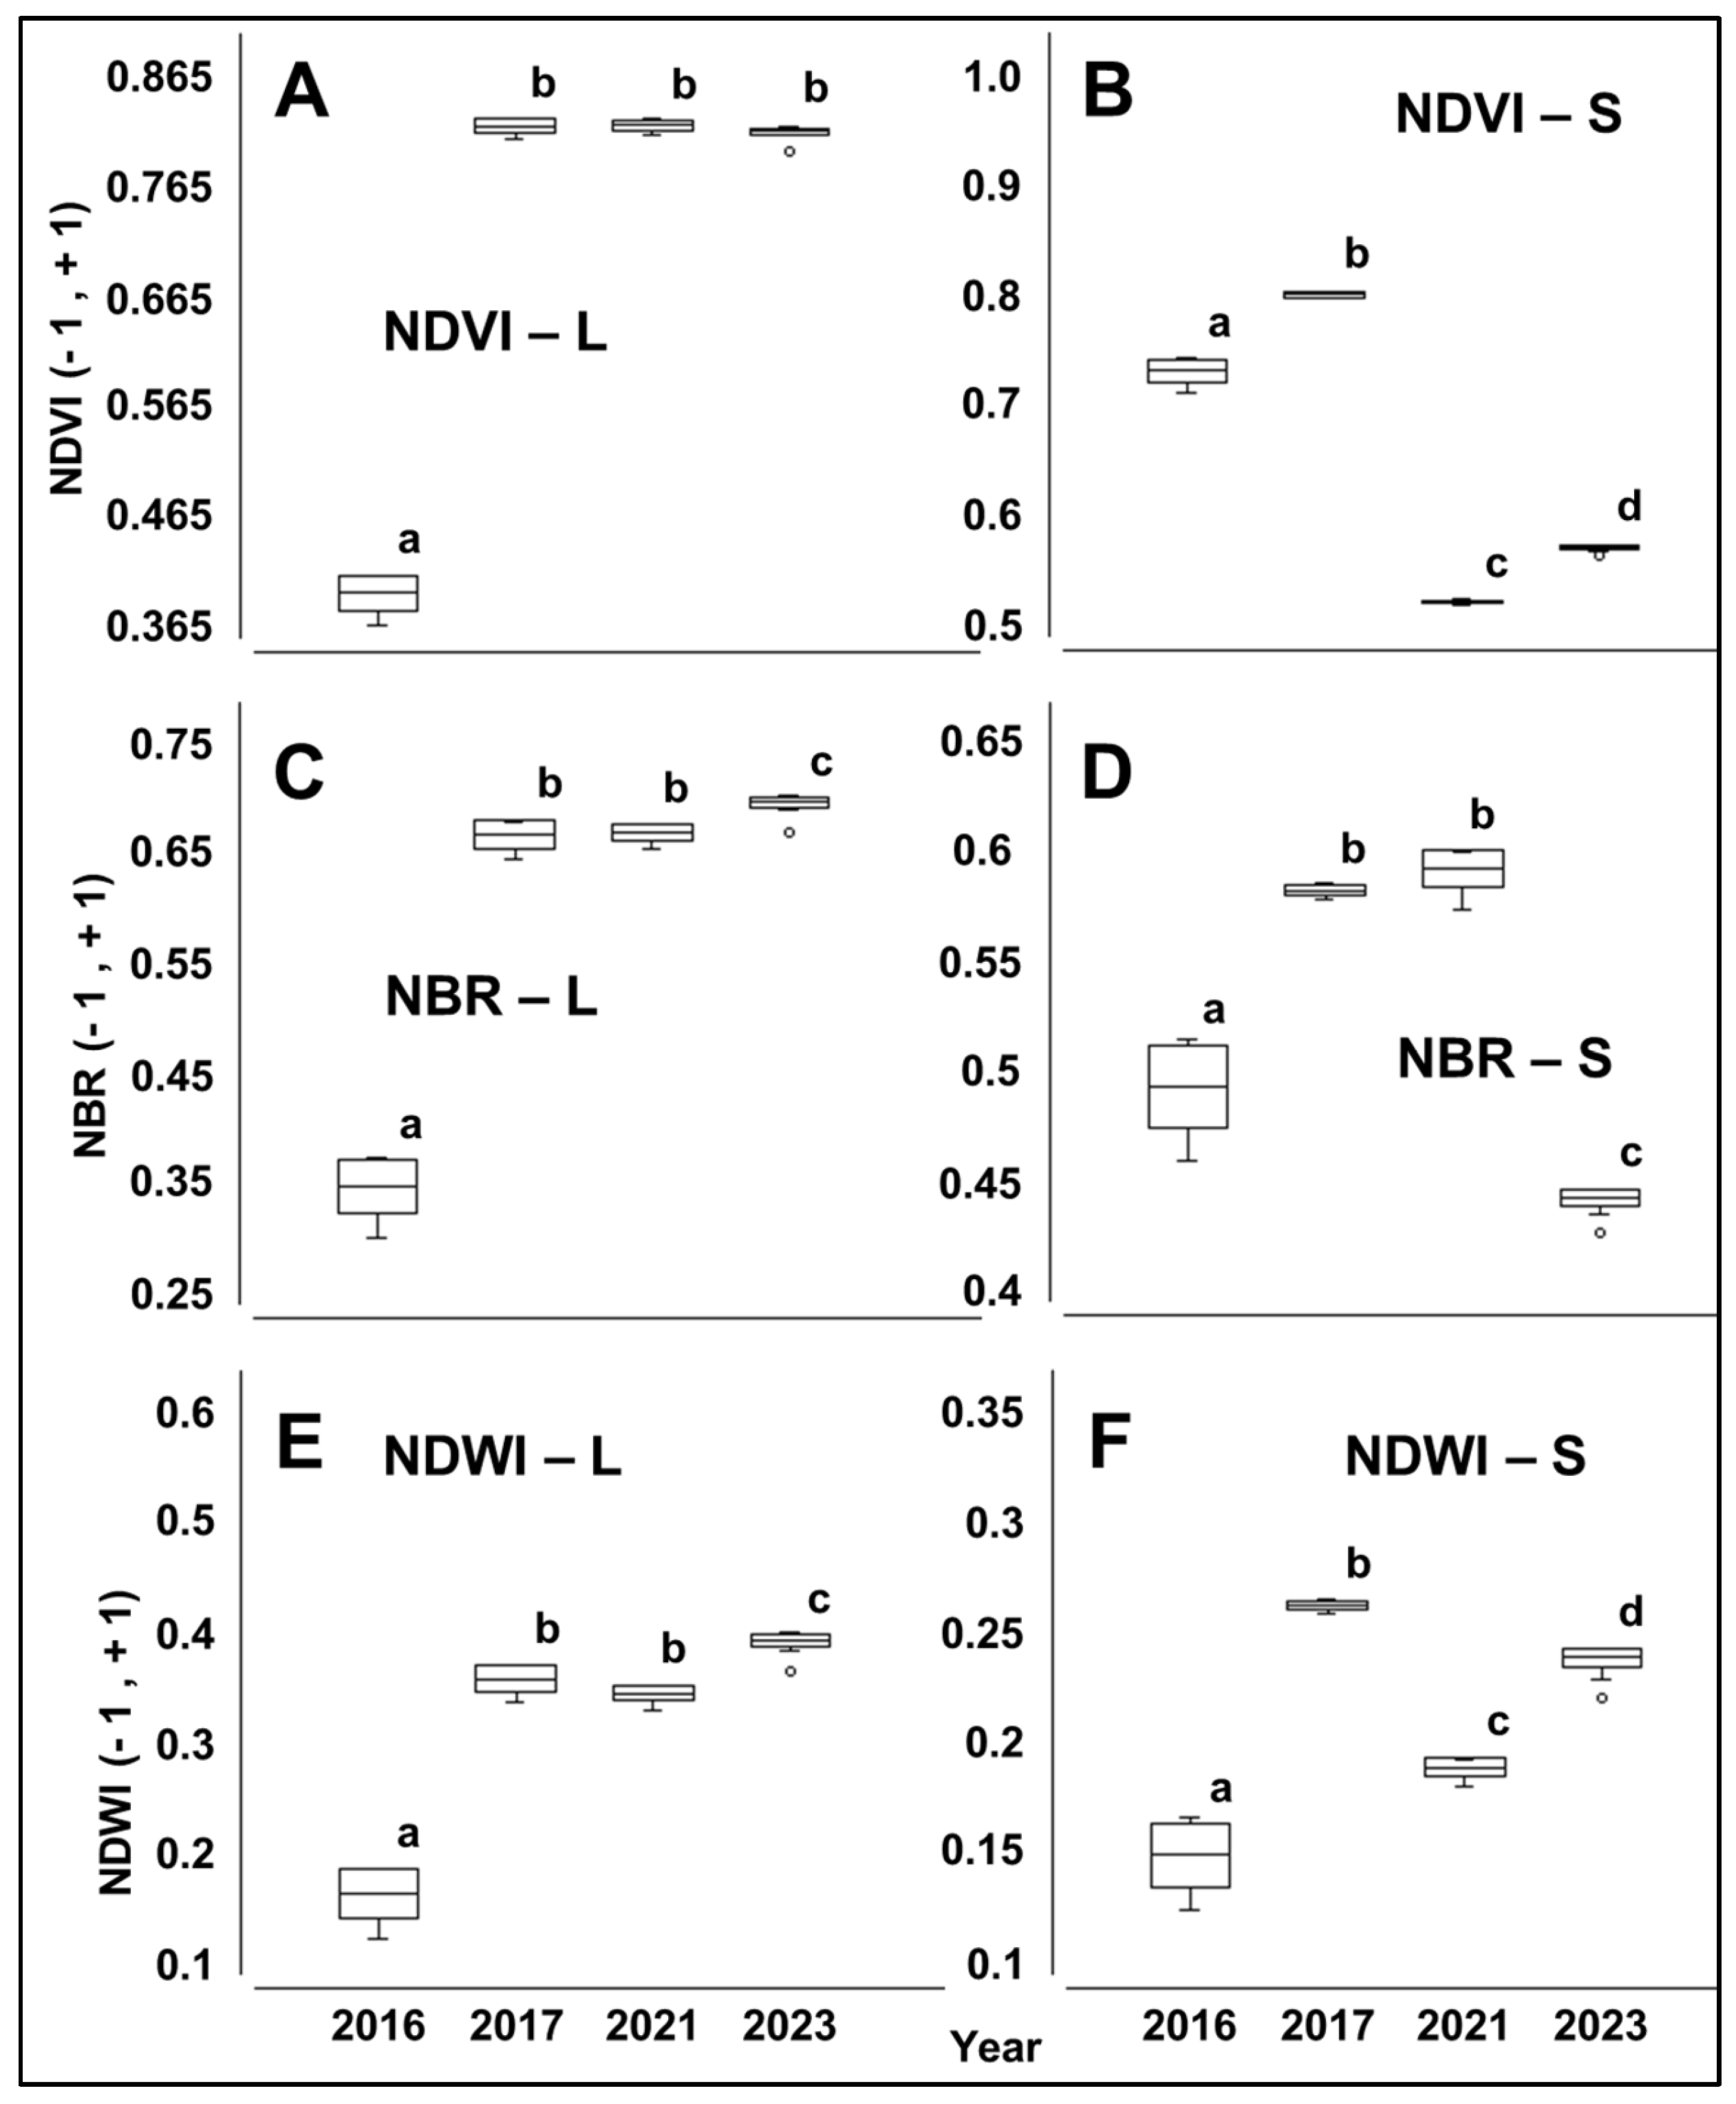
In general, the NDVI, NBR, and NDWI values were higher when detected by the Landsat-8 LDO sensor compared to those detected by the Sentinel-2 MSI sensor, from 2015 to 2023. The graphical analysis of this interval shows the significant impact of the large fire that occurred in the 2015–2016 El Niño on the values of the vegetation indices taken from Landsat-8. The values of the indices for the year 2016, as measured by Landsat-8, were clearly below those of all other years (Figure 5 and Figures S3–S5). On the other hand, the values of the indices based on Sentinel-2 data (Figures S6–S8) did not exhibit this pattern of effect for the year 2016 (with the exception of the NDWI, for which 2016 had the lowest value among all years), and there was a strong positive relationship that explained 72.6% of the variation in the increase in brightness (pixels values) with the increase in distance from the edge (R2adj = 0.7257; p = 0.0014) (Table 4, second part). Therefore, the results indicate that, for both Landsat-8 and Sentinel-2 data, there is indeed a gradient of decreasing forest degradation from the edge to the interior of the forest during the period of analysis, confirming our hypothesis.

3.5. Spectral Behavior of Pixels Beyond the 100 m Edge

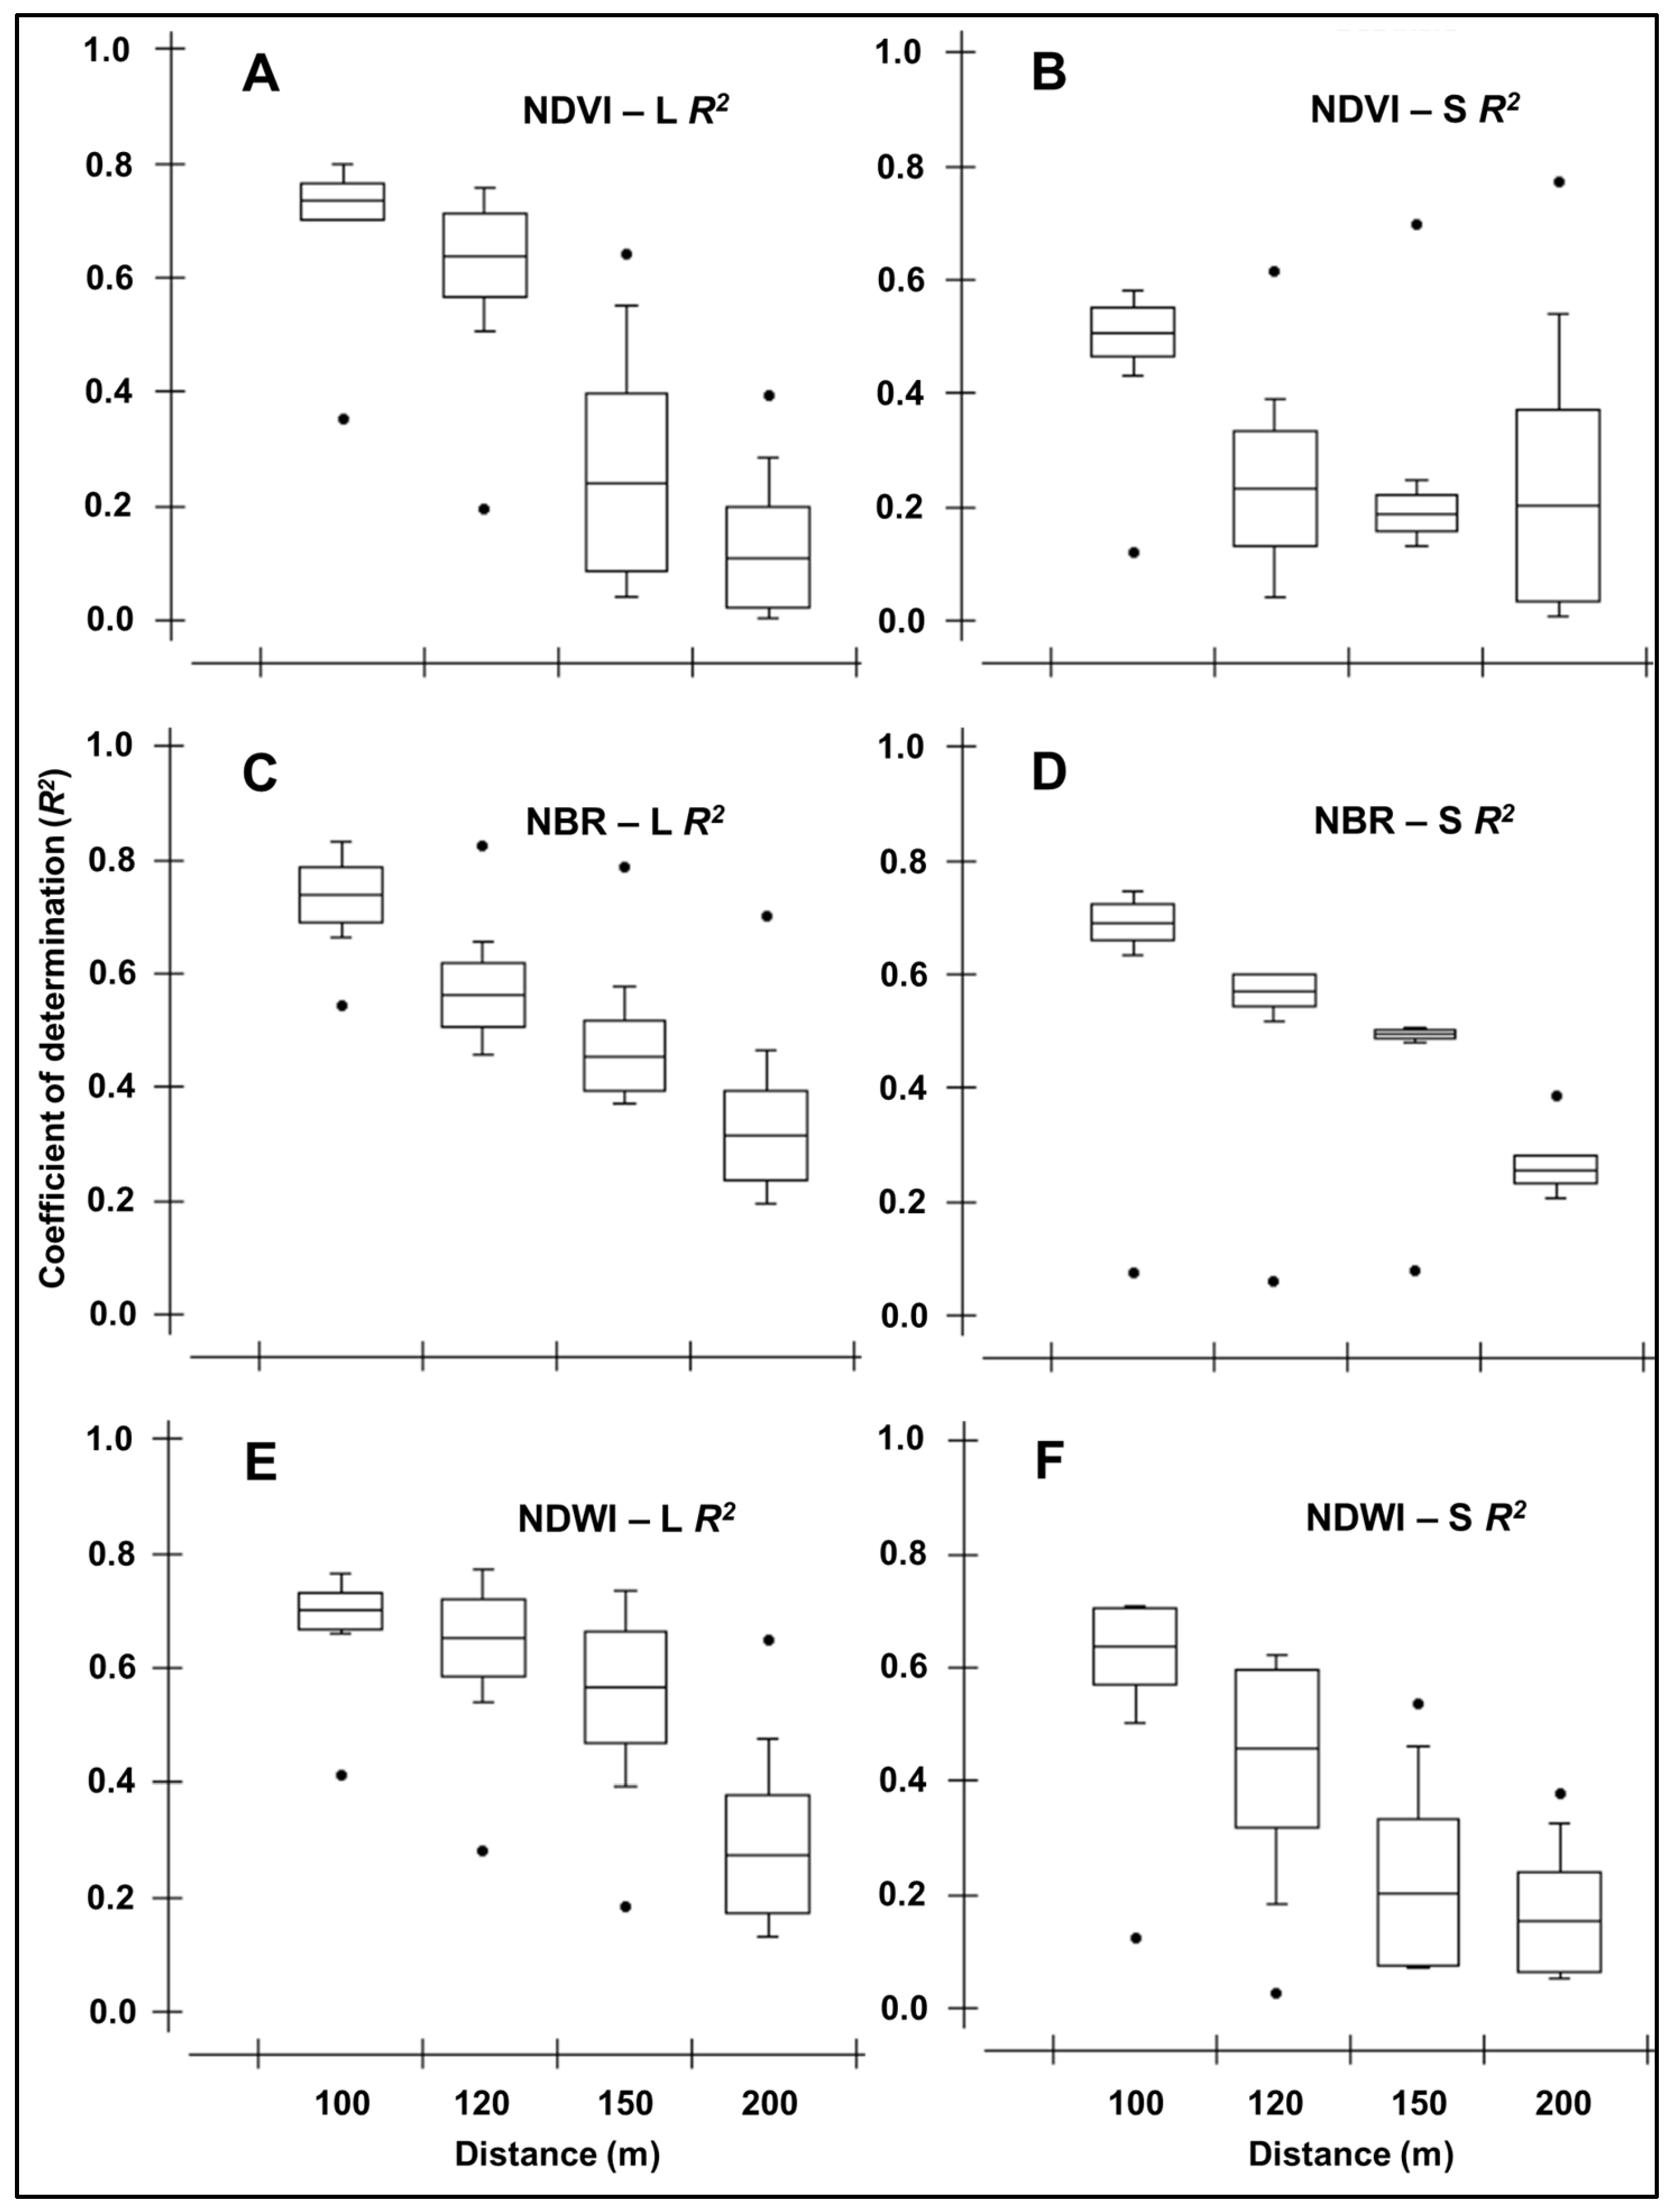
As expected, the effects of the edge radiated beyond the 100 m limit from the deforestation line. However, as one moves away from the edge and approaches the 200 m limit toward the interior of the forest, the regression model gradually loses its explanatory power. For example, the highest values of the coefficient of determination (adjusted R2) were observed at the 100 and 120 m limits. This effect was observed for all three vegetation indices, regardless of the sensor used. However, in general, the adjusted R2 values calculated for Landsat-8 data were slightly higher than those calculated for Sentinel-2 data (Figure 6; Tables S14 and S15). Both the coefficients of determination obtained from Landsat-8 data and those obtained from Sentinel-2 data showed no significant differences when compared to each other at different distances (ANOVA, Tukey test; α = 0.05).

3.6. Biomass Impact and Biomass Loss

3.6.1. Biomass Loss Due to Deforestation

During the entire analysis period (2007 to 2023), ~19.0 million Megagrams (Mg) of biomass were lost due to deforestation (without considering losses due to edge effects, SL, and fire). This amount represented 43.8% of the total biomass loss due to deforestation in the study area since 1988 (43.4 × 10⁶ Mg), when INPE began monitoring deforestation in the Brazilian Amazon (Table S16) [4]. The year 2022 had the largest biomass loss (2.7 × 10⁶ Mg) because the largest area of deforestation in the study area was recorded in that year (62.0 km2), representing 13.8% of the total biomass lost during the analysis period. The average biomass content (below- and above-ground) per hectare (ha) ranged from 429.3 Mg in 2022 to 438.0 Mg ha−1 in 2008.
The biomass lost due to edge effects, SL, and fire before deforestation was calculated at 1.89 × 10⁶ Mg in an area of 204.3 km2, where there was an overlap of the effects of edge (88.6 km2), SL (165.2 km2), and fire (127.7 km2) in 2016 (Table S17). To avoid double counting, this lost biomass was discounted from the total biomass lost due to deforestation.

3.6.2. Biomass Loss Due to the Edge Effect

In 2023, there was a cumulative area of 244.9 km2 exposed to the edge effect within a 100 m radius from the edge. The “cumulative” edge area in a given year is the area of edge present in that year, independent of when each part of this area became an edge. The total biomass (above- and below-ground) affected or exposed to the edge effect in this area was calculated at 10.5 × 10⁶ Mg (Table S18). Considering this area of exposed biomass, the loss was calculated at 0.92× 10⁶ Mg (37.4 Mg ha−1) of biomass in 2023, representing 8.73% of the biomass exposed to the edge effect (Table S17). The highest annual loss of biomass due to the edge effect occurred in 2013 with 0.036 × 10⁶ Mg, representing a loss of 38.3 Mg ha−1 in an area of 9.3 km2 of edge. Biomass loss in the 2007–2023 analysis period across 71.4 km2 of edges created annually (on average) by deforestation totaled 0.271 × 10⁶ Mg and represented 29.5% of the biomass lost in the edge area in 2023 (244.9 km2). These impacted areas implied biomass losses of 37.9 Mg ha−1 (Table S19).
The analysis of error propagation in the estimation of biomass loss due to the edge effect showed that the model was able to capture the variation in biomass values, considering the 10 distance ranges from the edge. When the estimate was made without stratification of forest types, the average variation in mean loss values (37.3 Mg ha−1) was 13.9% (±Sd 5.2 Mg ha−1) (Table 5). Considering the forest types separately, the coefficient of variation reached 1.9% on average for the biomass estimate for the ombrophilous forest (38.9 ± 0.74 Mg ha−1) and 2.0% on average for the Campinarana biomass loss estimate (21.0 ± 0.42 Mg ha−1) (Tables S20 and S21).

3.6.3. Biomass Loss in 2016 and 2023 Due to Fire and SL in Edge Areas

The area affected by the 2016 fire in the strip up to 100 m from the 2016 forest edge, which was logged by SL in the years before the fire, totaled 17.8 km2, of which 15.5 km2 (86.8%) was in ombrophilous forest and 2.4 km2 (13.2%) was in campinarana. The biomass in this edge area (considering both vegetation types) totaled 0.7 × 10⁶ Mg at the time of the 2016 fire, and, of this, 0.27 × 10⁶ Mg was lost to SL, fire, and the edge effect, representing 38.6% of the biomass affected by all three degradation factors (with the SL having been performed prior to 2016), considering the loss percentages by fire of 22.15%, by edge effect of 8.75%, and by SL of 8.2% (Table S22). The loss percentage of 38.6% is a weighted average for the biomass in these areas.
The area in the 100 m-wide edge strip that was exposed to the 2016 fire and subsequently exposed to logging by SL (but recorded in 2023) was 28.0 km2, of which 23.3 km2 (83.2%) was in ombrophilous forest and 4.7 km2 (16.8%) was in campinarana. Biomass in this area (considering the two main vegetation types) totaled 1.1 × 10⁶ Mg. The biomass lost in this area, with all three degradation factors, but with the SL occurring after 2016, totaled 0.44 × 10⁶ Mg, representing 36.4% of biomass exposed, weighted by the areas of occurrence and considering the loss percentages of 22.15% due to fire, 8.20% due to SL, and 8.75% due to the edge effect (Table S22).

3.6.4. Biomass Loss in Overlapping Areas

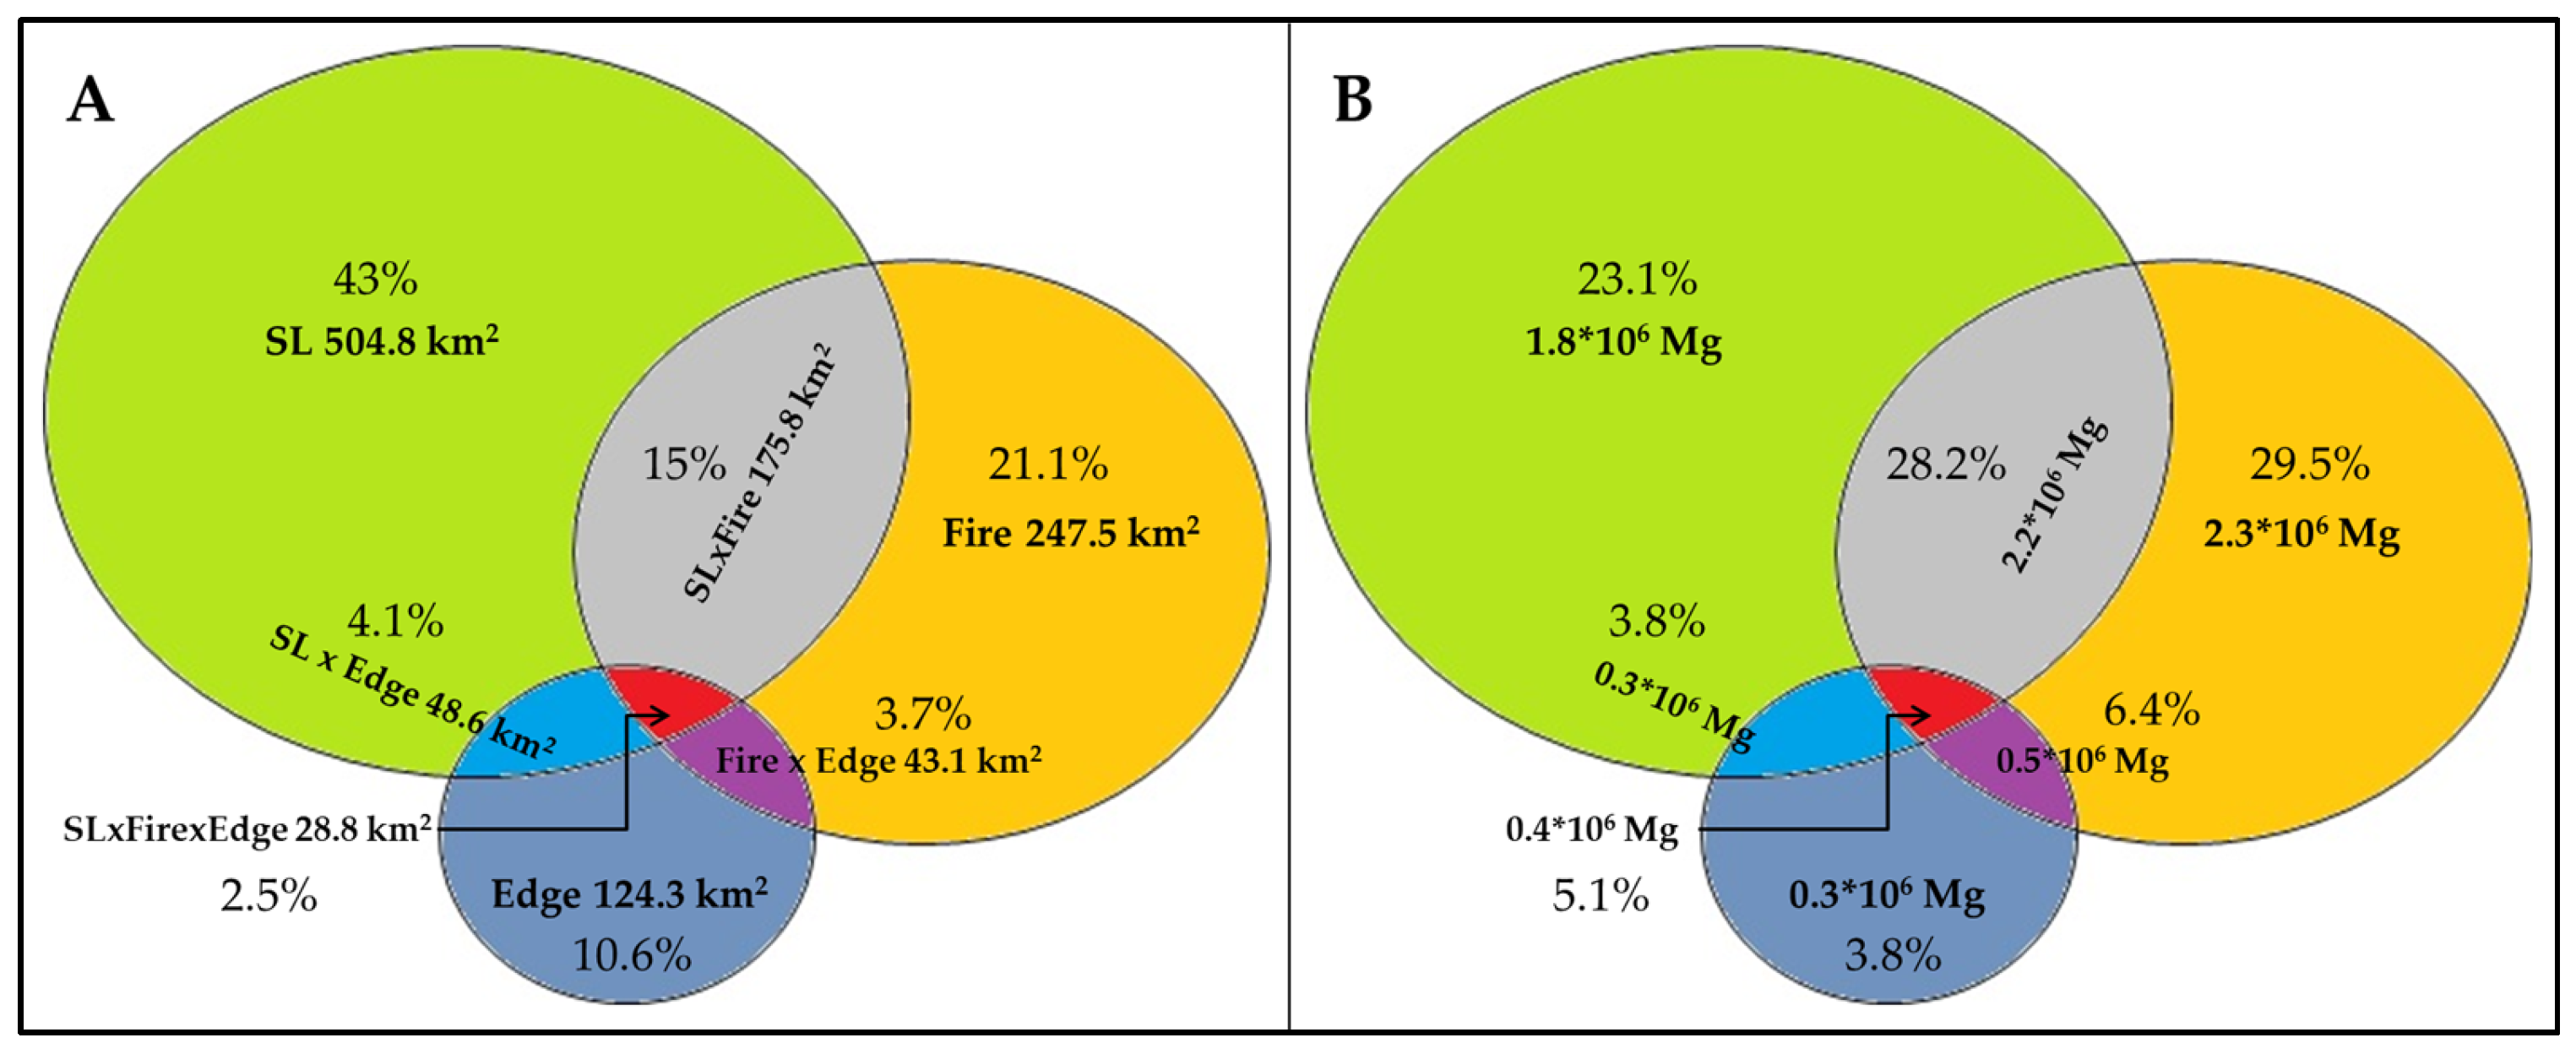
Adding up all areas of occurrence of SL, fire, and the edge effect in 2023, the total area was 1172.9 km2. Of this, the areas without overlap (“pure” areas) totaled 876.5 km2, representing 74.7% of the total mapped. SL was measured in 504.8 km2 (57.6%) of the area, fire scars totaled 247.5 km2 (28.2%), and the edge area to 100 m totaled 124.3 km2, or 14.2% of the total mapped in this category (Table S23).
The areas of overlap for forest degradation types totaled 296.3 km2, representing 25.3% of the total. The largest overlap area (175.8 km2) was between SL and fire, representing 59.3% of the total. The smallest area (28.8 km2) was that of the simultaneous occurrence of SL, fire, and edge effects, representing 9.7% of the total mapped in this category (Figure 7A).
In terms of biomass, the areas exposed only to fire (with no overlap from other sources of degradation) had the greatest loss (2.3 × 10⁶ Mg), representing a loss of 29.5% of the total biomass (above- and below-ground) in the study area, which is 7.8 × 10⁶ Mg. This value was 27.8% greater than the loss from pure SL, although SL affected an area that was 103.8% larger (Figure 7B). These differences in the amounts of biomass lost are explained by the different degradation percentages used to compute the losses.

4. Discussion

4.1. Forest Degradation in the Study Area

The size of the study area we delimited is justified by the enormous pressure exerted by deforestation and the consequent creation and elimination of edges in the southern portion of the state of Roraima [4]. Forest degradation due to deforestation and the edge effect in the period between 2007 and 2023 was exacerbated by SL activity [1,2,56], as well as the occurrence of agricultural and pasture burnings and forest fires, leading to a significant loss of biomass. In this part of the Amazon, landscape fragmentation (e.g., [37,71]), represented by edges from cumulative and annual deforestation, advanced even further into the forest due to the opening of new local roads and the creation of new Settlement Projects (SP) during the period of analysis. For example, to the northwest of Vila Colina, about 20 km away, the Sucurijú SP was created in 2008; however, the lots (300 m frontage by 2000 m depth, totaling 60 ha) were only acquired in 2009 (Figure S1). In that year, four access roads to the lots were opened, totaling ~50 km of side roads. In 2022, another road was opened in this SP (PEB personal information).
In our study area, the disturbances that led to forest degradation, analyzed here as the edge effect, SL, and fire leading to tree mortality and biomass loss, acted together and were aggravated by local human actions (landscape fragmentation due to deforestation and burning to maintain pastures and crops) and by decisions made by the state government itself. The state government’s executive branch issued decrees in 2022 that aggravated the threat to the forest [72,73]. Decree 33,467-E, signed on 31 October 2022 [74], provides for the reduction of the Legal Reserve (LR) area of rural lots in the state, from the current 80% specified by federal law in the Amazon “biome” [43] to 50%. This change was made during the presidential administration of former President Jair Bolsonaro and was aligned with his views on environmental issues (e.g., [75]). Of the deforestation that occurred in the study area up to 2023 (1010.1 km2), 13.4% (135.4 km2) exceeded the maximum that can be cleared under current federal legislation (Law 12,651 of 25 May 2012), which authorizes legal deforestation in up to 20% of the area of each landholding in the Amazon.

4.2. Deforestation and Edge Growth Dynamics

The southern portion of Roraima has been experiencing extremely high levels of deforestation and forest degradation, and in January 2021, Rorainópolis was included in the federal environmental agency’s list of priority municipalities for controlling deforestation in the Amazon. The criteria that led Rorainópolis to appear on this list are as follows: 1. the total area of deforested forest in 2019 was equal to or greater than 80 km2; 2. the total area of deforested forest over the last three years was equal to or greater than 160 km2; and 3. there was an increase in the deforestation rate in at least three of the last five years. Municipalities on the list are subject to sanctions, such as blocking credit for agriculture and ranching [76]. In comparative terms, the deforestation rate in 2023, within our study area only, was 25.0% higher than the mean annual deforestation rate between 2007 and 2022 in the municipality of Rorainópolis as a whole [4]. During this period, our study area accounted for 69.9% of all deforestation in the municipality (558 km2). This demonstrates the importance of the study area and indicates the speed of forest loss and its potential for degradation via forest fragmentation and the creation of edges [37,74,77].
Forest edges overlap a large part of the area that is deforested annually, and these edge areas are incorporated into the deforested area, moving the edge into the forest over time. This process leads to a decrease in edge areas in relation to the cumulative deforested area (Figure 3 and Figure S2). This occurs in edges in areas with highly consolidated deforestation, generally deforested in years prior to 2007, close to the main access highway to Rorainópolis (BR-174) and within settlement projects (e.g., [24,34]). In this case, a large part of the forest edge does not change due to the low stock of forest available for deforestation and legal restrictions [43].
In the case of “hotspot” regions for deforestation, represented by fronts in new settlement projects (e.g., [24]), the edges overlap at some points and move further into the forest at other points as deforestation advances. In other words, the creation of edges and their annual accumulation do not have direct linear relationships with deforestation. For example, the annual increase in deforestation explained only 18.4% of the increase observed in edge areas (buffer), and this result was not statistically significant at the 95% confidence level (R2adj = 0.1842; p = 0.0622). However, the annual increase in deforestation during our 2007–2023 analysis period explained 30.2% of the variation in the decay rates (%) of edge areas within buffers created in 2007 (R2adj = 0.3025; p = 0.0196) and 60.8% of the variation in annual loss rates of edge areas created in 2010 (Table S4), demonstrating that deforestation significantly contributed to the reduction of edge areas over the period of analysis.
This seems counterintuitive, but it can occur when two deforestation fronts meet and “absorb” a large part of these edges. It is true that new edge areas are created in this process, but with their size reduced in relation to the length of the edges created in previous years (e.g., [69]). For example, the contact surface (edge area) of an isolated forest fragment is larger than if it had some direct connection with the adjacent forest. Its deforestation implies a significant reduction in the edge area in relation to the size of the already-consolidated edge (e.g., [35]). In other words, the speed of deforestation growth is greater than the speed of the growth of the edges. Generally, the effective gain of edge areas occurs in the first five years of a new deforestation front initiated by the creation of settlement projects and the opening of roads, particularly in places where large areas are demarcated for farms and ranches through invasion and land grabbing on “undesignated public land” (e.g., [24,33,78]).
A declining rate of edge creation can be an indication that the deforestation front or agricultural frontier is approaching or has reached the limit imposed by the lack of available forests for further deforestation. This behavior would be characterized by the stabilization or consolidation of the deforestation frontier (e.g., [24,44]).
This finding implies difficulties in calculating biomass loss due to the creation of edges, where the deforestation front is quite dynamic, as is the case in our study area. The solution found was the one suggested by [69], which involves discounting the biomass lost not only due to the edge effect but also due to SL and fire from the biomass computed by deforestation in deforested areas with overlapping locations where these events occurred in previous years. However, in places where deforestation has been stabilized, forest degradation due to the edge effect is an important factor in carbon emissions and should be considered for inclusion in national reports of greenhouse gas emissions.

4.3. Interaction Among the Forest Edge, SL, and Fire

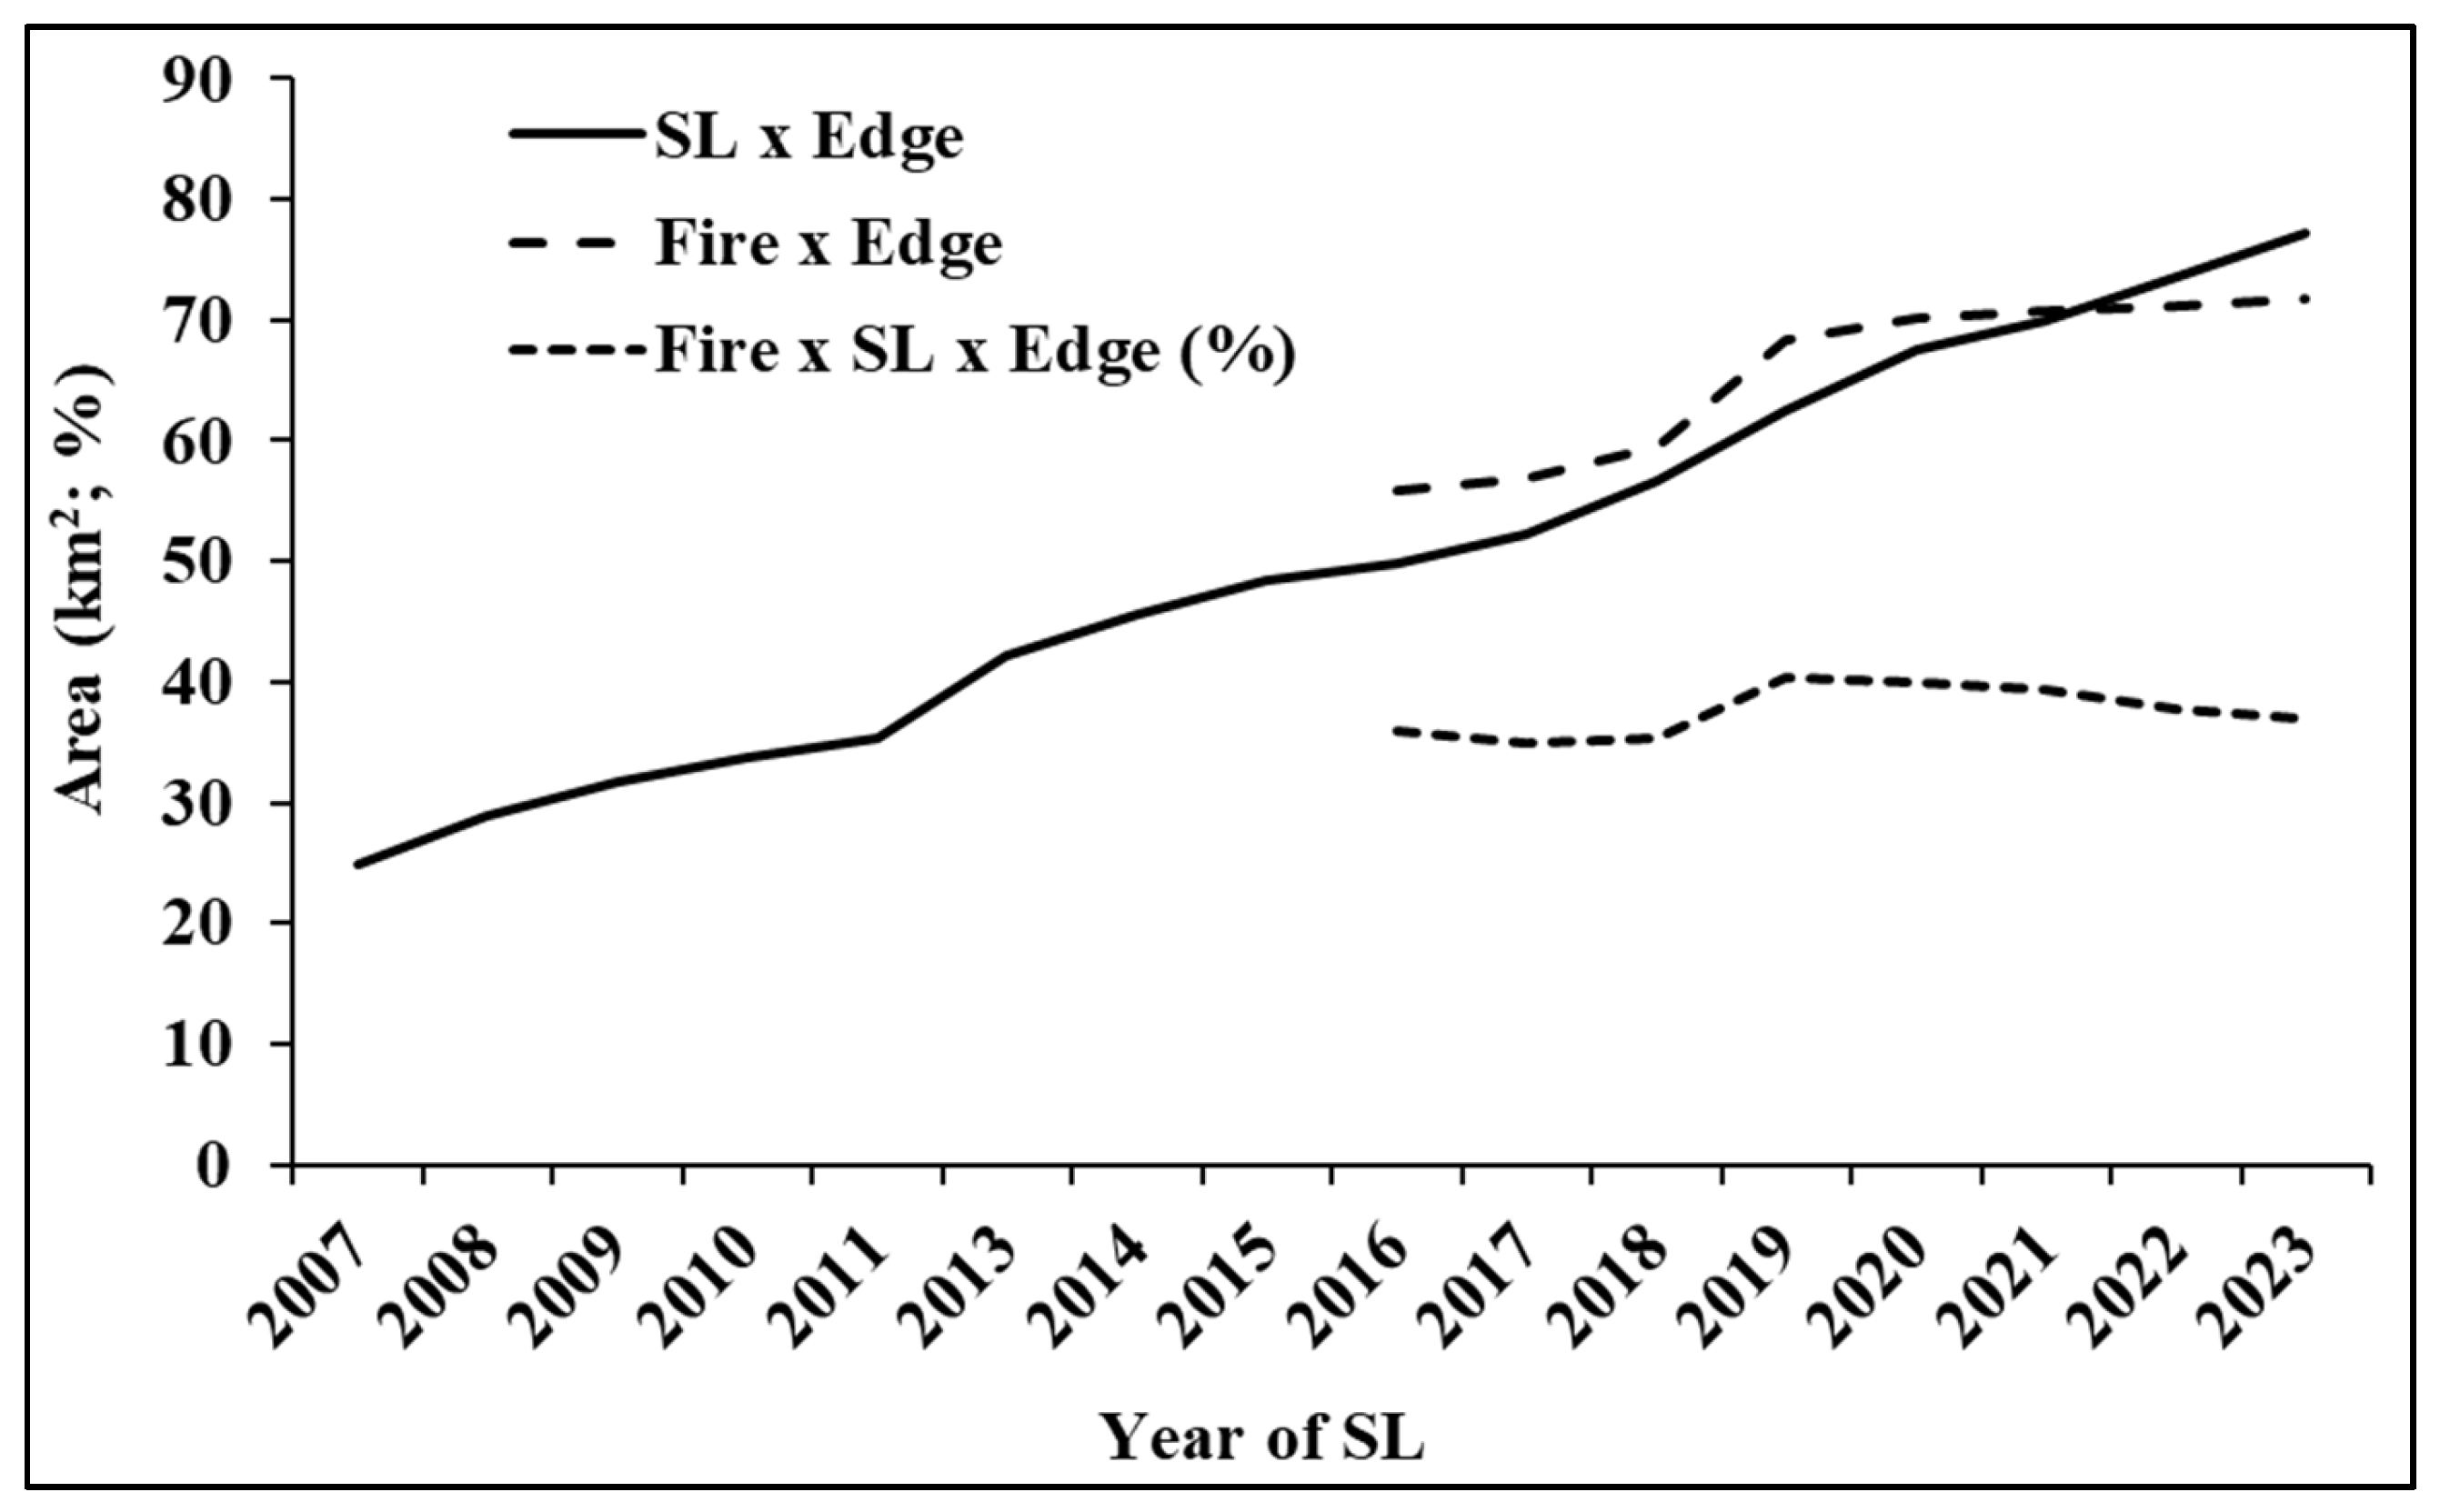
The area of SL at the forest edge has increased consistently alongside the edge area over the years in the study area (R2adj. = 0.9949; p < 0.0000), with an annual average of 50.2 km2 and an average percentage of 23.5%. Considering the occurrence of SL in relation to the total logged area (759.3 km2), the average percentage was 6.6% (Figure 8). This means that almost all logging (93.3%) is occurring far from the edge, impacting the “interior” of the forest. This finding is important in explaining degradation that extends beyond the limits of the forest edge. In this case, SL can be considered a significant impacting factor and a precursor to forest degradation by allowing or facilitating the spread of fire both in these areas and in adjacent areas where there are no traces of SL (e.g., [1,2]).
These facts corroborate the records of fires that occurred in the study area in 2016 (489.7 km2). In this case, fire impacted 18.1 km2 (36.2%) of the edge area where traces of SL were present in 2016, representing 3.7% of the total area burned in the study area as a whole and 32.2% of the 56.1 km2 burned in the edge area that year (11.5% of the total burned in the study area). In other words, 88.5% of the area burned in 2016 impacted the forest beyond the limits of the edge. With the creation of more edge areas annually from 2017 to 2023, the area representing the synergy in forest degradation between edge, SL and fire effects reached 28.8 km2 in 2023 (including the 2019 fire), representing 31.6% of the edge areas impacted by SL and 37.2% of the areas burned on the edges impacted by SL (Figure 9). The areas burned in 2016 and 2019 collectively impacted 72.0 km2 of the edge area in 2023, representing 14.5% of the total burned area (Table S5).
Considering the impacted area in forest edges in 2023, by both SL and the 2016 and 2019 fires (21.3 km2), the fire impacted, in relative terms, an area 42.1% greater than SL: (14.5−10.2)/10.2 × 100. The 2019 fire had a recurrence area of 15.4 km2 (59.2% in ombrophilous forests), representing 77.2% of the total area burned that year. In other words, if there had not been this overlap between the areas burned in 2019 and 2016, this effect would probably have been much greater. For example, in 2016, the impact of fire on biomass in forest edges was 73.0% greater than the impact of SL on the edges that year.
Our study area consists of a vast mosaic of forests fragmented by deforestation and impacted by the edge effect and fire. In this scenario, biomass loss and forest regeneration (not computed in the study, but present after disturbances) progress together on a landscape scale but not necessarily at the same speed or intensity. Regeneration cannot replace the biomass losses suffered by the forest due to degradation caused by these three factors (e.g., [37,77]).

4.4. Spectral Behavior of Pixels at the Forest Edge

Souza Jr. et al. [35] assumed that the edge effect in the Brazilian Amazon would be 1 km, measured from the deforested area toward the interior of the forest. Compared to current techniques and technological advances, the approximation made by Souza Jr. et al. [35] was quite bold but valid for its time. More recent studies assume a zone of influence or edge effect measuring 100 m (e.g., [14,22,67]), where edge effects are more pronounced [38].
In our study, the spectral behavior of vegetation indices in pixels clearly demonstrated that values indicate more intact vegetation increases as one moves from the edge toward the interior of the forest, confirming our hypothesis. This gradual increase in index values was shown by both the NBR and NDWI; however, this effect was less evident when considering the NDVI, as indicated by Landsat-5, Landsat-8, and Sentinel-2 data. This behavior of vegetation indices can be useful for constructing regression models to estimate levels of biomass loss, using the distance from the forest edge as one of the main parameters to investigate. In this case, it is essential that data obtained in the field through forest inventories be incorporated or associated with data obtained via models.
The analysis of pixel behavior beyond the 100 m distance limit from the forest edge demonstrated a maximum effect around 120–150 m, beyond which the model’s explanatory power drops considerably, although it remains statistically significant (Figure 6). These results indicate that the forest edge may be vulnerable at a much greater distance than the 100 m typically used to assess edge effects (e.g., [8,14,17,37,77]).

4.5. Estimation of Biomass Loss

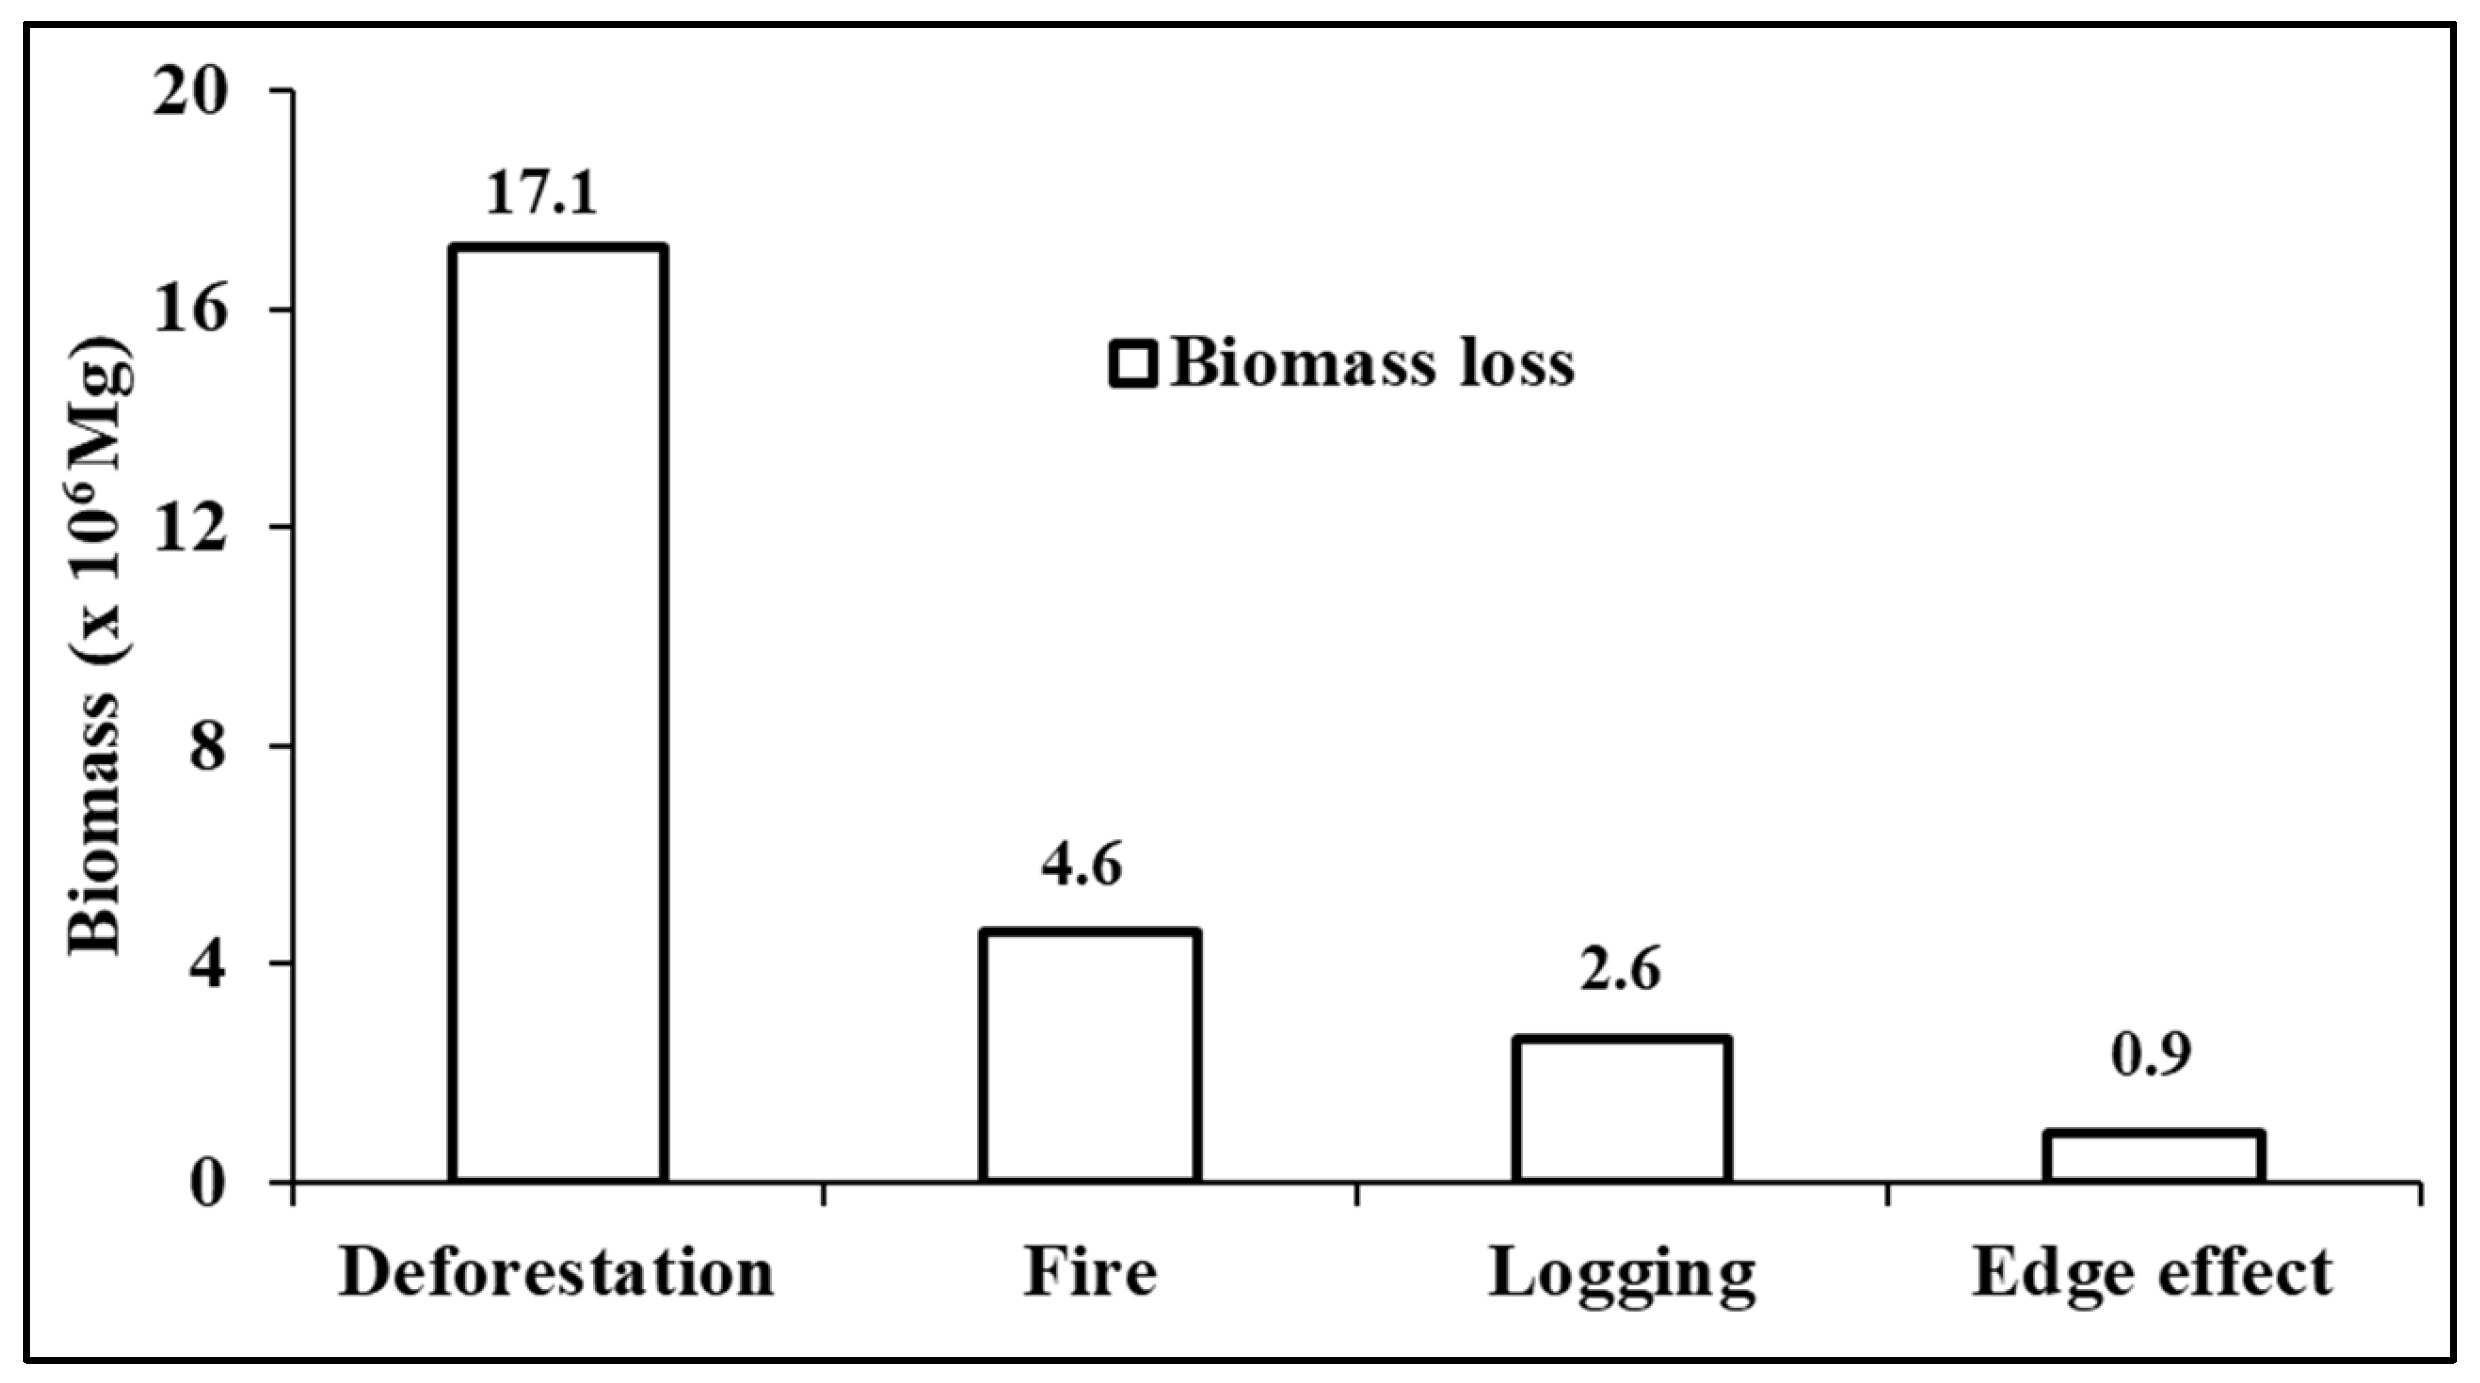
Understanding and accurately quantifying the effects of forest degradation is a crucial and extremely important factor for conserving carbon stocks in the Amazon. In this study, we quantified the biomass lost by considering a delimited area of each “disturbance” in the study area using data from the literature (Figure 10). Ideally, the amount of biomass lost should be deducted directly from satellite images by type of degradation (e.g., [79,80]). However, this is an almost impossible task and requires further technological advances. Our analysis of the behavior of pixels at the edge of the forest represents an important step in this direction, since it introduces new elements to be explored in future research projects in this area.
The estimated loss of biomass due to deforestation was the most significant in terms of quantity (Figure 10). Secondary vegetation in deforested areas was not considered in the calculations due to the low amount observed in our study area. The deforested areas (cumulative deforestation over the years) are mostly occupied by pasture under extensive cattle management [81], while silvicultural plantations are practically non-existent, although there are some small plantations of Acacia mangium in the backyards of houses along local roads; these trees are used for firewood but not commercially. Acacia is an invasive plant along many local roads in the southern portion of the state (PEB, personal observation), as is also the case in the savannas of Roraima (e.g., [82,83]). There are commercial oil palm plantations (Elaeis guineensis) (Palmaplan Company) along BR-174 near Vila do Equador [84].
Although biomass loss due to the edge effect is the factor with the least impact in our study area, compared to losses from deforestation, SL, and fire, its estimation is of fundamental importance. Our finding of the existence of a spatial gradient for possible forest degradation with increasing distance from the edge, based on Landsat 8 (30 m) and Sentinel-2 (10 m) satellite data, needs to be confirmed by empirical studies in the field (e.g., [14]).
Our results can be compared to those found at the Biological Dynamics of Forest Fragments Project (BDFFP) near Manaus. While Nunes et al. [14] studied the edges of forest fragments formed in the mid-1980s, our study area began to be settled in the mid-1990s, and we believe that the same effects may also be occurring here. The edges studied by Nunes et al. [14] at the BDFFP were completely isolated and largely spared understory forest fires that spread from burning associated with deforestation, the clearing of secondary forests, and the maintenance of pastures adjacent to the forest edge (e.g., [8,14,22,77,78]). In contrast, the forest edges in our study area, located approximately 400 km north of the BDFFP area studied by Nunes et al. [14], are subject to all these factors together, which can act synergistically with the edge effect and result in even greater biomass loss. In addition, of the 244.9 km2 of edge areas recorded up to 2023 in our study area, only 74.1 km2 (29.1%) were created between 2007 and 2023, with an average age of 8 years. In the remaining edge areas (170.8 km2 or 70.9% of the edge area present in 2023), the average age of the edges at the time of our study could be 14–15 years, given that settlement in the area began in the mid-1990s.
Nunes et al. [14] found an average live above-ground biomass loss of 24.7 Mg ha−1 (8.75%) caused by the edge effect in the 100 m edge strip at the BDFFP site. The live above-ground biomass of intact forest at our study site (309.7 ± 2.7 Mg ha−1) is 9.7% higher than the 282.2 ± 15.3 Mg ha−1 found at the BDFFP site and studied by Nunes et al. [14]. The biomass loss estimated in our study (27.1 ± 0.3 Mg ha−1, or 8.75%) was similar to the value of 24.5 Mg ha−1 (8.8% ± 10.2%, n = 30) found by [38] in the interval of 10 to 17 years after creation of the edges of the forest fragments they studied at the BDFFP site. Comparing the results of Nunes et al. [14] with those of Laurance et al. [37], there was a stabilization in the loss of biomass in the first 100 m from the edge of the fragments studied, probably due to the growth of natural regeneration in recent decades (e.g., [85]).
The joint action of forest fragmentation and the edge effect + SL + fires implies the facilitation of the continuation of the forest degradation process (e.g., [77,85]), resulting in greater biomass losses and carbon emissions. Wildfires in the Amazon will likely increase in the future due to a warmer and drier climate (e.g., [48,49,50,51]) and also because there will be an increasing number of ignition points spread across the region as human occupation and deforestation increase [2,20,21,32,45,46,47]. Increased deforestation is also expected, following the state government’s reduction of the area of legal reserves required in Roraima [75,76].
Emissions from degradation are not yet included in national communications to the Climate Convention, although the national communications do account for wood products in the “Land Use, Land Use Change and Forestry” (LULUCF) sector [86]. Due to their importance for Earth’s climate, emissions from forest degradation (e.g., [14]) should be included in national communications on greenhouse gas emissions. The omission of any emissions, including those from forest degradation, implies that the mitigation measures agreed by countries at COP-15 in Paris, or those that may be agreed in future negotiations, will be insufficient to contain global warming.

5. Conclusions

The rapid loss of forest cover caused by deforestation in the southern part of the state of Roraima is creating new edges each year while simultaneously eliminating old edges in areas that are absorbed by consolidated deforestation. This decline in edge creation indicates the stabilization of the deforestation frontier.
The degradation of the forest in the study area was exacerbated by selective logging (SL) and forest fires, resulting in a significant loss of biomass. The containment of forest degradation in this portion of Roraima is deeply compromised due to decisions made by the state government, which contradict forest conservation policies.
We found that the degradation of edges, as measured via three vegetation indices (NDVI, NBR, and NDWI), decreases along a spatial gradient from the edge of the forest to the interior. Edge effects can impact the forest far beyond the 100 m strip considered in this study and in most other studies of edge effects. Empirical studies are needed for field confirmation of the effects revealed by satellite data.
This study provides valuable information about the creation of edges and their behavior both after and during the stabilization of the deforestation frontier. The edge effect is an important factor in carbon emissions to the atmosphere, and it should be included in the national communications submitted to the United Nations Framework Convention on Climate Change.

Supplementary Materials

The following supporting information can be downloaded at: https://www.mdpi.com/article/10.3390/f16081322/s1.

Author Contributions

Conceptualization, P.E.B.; Formal analysis, P.E.B.; Investigation, P.E.B. and A.C.C.; Data curation, P.E.B.; Writing—original draft, P.E.B.; Writing—review & editing, L.O.A., L.E.O.e.C.d.A., R.I.B., H.A.M.X., M.R.X. and P.M.F.; Supervision, P.M.F. All authors have read and agreed to the published version of the manuscript.

Funding

This research was funded by (National Institute of Amazonian Research) grant number (PRJ15.125), (Financiadora de Estudos e Projetos) grant number (FINEP/Rede CLIMA Process 01.13.0353-00, 312450/2021-4, 406941/2022-0 and 314473/2020-3) and (Fundação de Amparo à Pesquisa do Estado de São Paulo) grant number (2020/15230-5 and 01.02.016301.02529/2024-87).

Data Availability Statement

Data are contained within the article and Supplementary Materials.

Acknowledgments

We thank the State University of Roraima (UERR) for granting PEB a period of leave from teaching to dedicate himself to his postdoctoral internship. We thank the National Institute for Space Research (INPE) for institutional and logistical support and the UERR Forestry Engineering students who began in 2016 and 2019 for their help with fieldwork. PMF thanks INPA (PRJ15.125), the Brazilian Research Network on Climate Change (FINEP/Rede CLIMA) (Process 01.13.0353-00), the National Council for Scientific and Technological Development (CNPq) (Processes 312450/2021-4; 406941/2022-0), and Fundação de Amparo à Pesquisa do Estado do Amazonas (FAPEAM) (Process 01.02.016301.02529/2024-87). LOA thanks the São Paulo Research Foundation (FAPESP, Process: 2020/15230-5) and CNPq (process: 314473/2020-3).

Conflicts of Interest

Authors Haron Abrahim Magalhães Xaud and Maristela Ramalho Xaud was employed by the company Brazilian Agricultural Research Corporation—Embrapa/RR. The remaining authors declare that the research was conducted in the absence of any commercial or financial relationships that could be construed as a potential conflict of interest.

References

  1. Condé, T.M.; Higuchi, N.; Lima, A.J.N. Illegal selective logging and forest fires in the northern Brazilian Amazon. Forests 2019, 10, 61. [Google Scholar] [CrossRef]
  2. Barni, P.E.; Rego, A.C.M.; Silva, F.C.F.; Lopes, R.A.S.; Xaud, H.A.M.; Xaud, M.R.; Barbosa, R.I.; Fearnside, P.M. Logging Amazon forest increased the severity and spread of fires during the 2015-2016 El Niño. For. Ecol. Manag. 2021, 500, 119652. [Google Scholar] [CrossRef]
  3. Vidal, E.; West, T.A.P.; Lentini, M.; Souza, S.E.X.F.; Klauberg, C.; Waldhoff, P. Sustainable forest management (SFM) of tropical moist forests: The case of the Brazilian Amazon. In Achieving Sustainable Management of Tropical Forests; Blaser, J., Hardcastle, P.D., Eds.; Burleigh Dodds: Cambridge, UK, 2021; Chapter 24. [Google Scholar] [CrossRef]
  4. Brazil, INPE (Instituto Nacional de Pesquisas Espaciais). Projeto de Desmatamento, Incrementos de desmatamento—Terra Brasilis: Amazônia Legal—Estados. Available online: https://terrabrasilis.dpi.inpe.br/app/dashboard/deforestation/biomes/legal_amazon/rates (accessed on 17 May 2024).
  5. Gerson, J.R.; Szponar, N.; Zambrano, A.A.; Bergquist, B.; Broadbent, E.; Driscoll, C.T.; Erkenswick, G.; Evers, D.C.; Fernandez, L.E.; Hsu-Kim, H.; et al. Amazon forests capture high levels of atmospheric mercury pollution from artisanal gold mining. Nat. Commun. 2022, 13, 559. [Google Scholar] [CrossRef]
  6. Vasconcellos, A.C.S.; Ferreira, S.R.B.; Sousa, C.C.; Oliveira, M.W.; Oliveira Lima, M.; Basta, P.C. Health risk assessment attributed to consumption of fish contaminated with mercury in the Rio Branco Basin, Roraima, Amazon, Brazil. Toxics 2022, 10, 516. [Google Scholar] [CrossRef]
  7. Fearnside, P.M. Amazon forest maintenance as a source of environmental services. An. Acad. Bras. Ciências 2008, 80, 101–114. [Google Scholar] [CrossRef]
  8. Silva Junior, C.H.L.; Aragão, L.E.O.C.; Anderson, L.O.; Fonseca, M.G.; Shimabukuro, O.E.; Vancutsem, C.; Achard, F.; Beuchle, R.; Numata, I.; Silva, C.A.; et al. Persistent collapse of biomass in Amazonian forest edges following deforestation leads to unaccounted carbon losses. Sci. Adv. 2020, 6, 40. [Google Scholar] [CrossRef]
  9. Chagas, V.B.P.; Chaffe, P.L.B.; Blöschl, G. Climate and land management accelerate the Brazilian water cycle. Nat. Commun. 2022, 13, 5136. [Google Scholar] [CrossRef]
  10. Broggio, I.S.; Silva-Junior, C.H.L.; Nascimento, M.T.; Villela, D.M.; Aragão, L.E.O.C. Quantifying landscape fragmentation and forest carbon dynamics over 35 years in the Brazilian Atlantic Forest. Environ. Res. Lett. 2024, 19, 034047. [Google Scholar] [CrossRef]
  11. Staal, A.; Tuinenburg, O.A.; Bosmans, J.H.C.; Holmgren, M.; van Nes, E.H.; Scheffer, M.; Zemp, D.C.; Dekker, S.C. Forest-rainfall cascades buffer against drought across the Amazon. Nat. Clim. Change 2018, 8, 539–543. [Google Scholar] [CrossRef]
  12. Anderson, L.; Dutra, D.; Jones, C.; Mataveli, G.; Ferreira, I.; Leão, H.; Cabral, B.; Fearnside, P.; Graça, P.; Yanai, A.; et al. Prediction of forest degradation as a subsidy for mitigating actions to preventing fires and wildfires in a new Amazonian frontier. In Proceedings of the EGU General Assembly 2024, Vienna, Austria, 14–19 April 2024. EGU24–6369. [Google Scholar] [CrossRef]
  13. Silva Junior, C.H.L.; Aragão, L.E.O.C.; Anderson, L.O.; Carvalho, N.S.; Pessôa, A.C.M.; Reis, J.B.C.; Dalagnol, R.; Wagner, F.; Saatchi, S.S. 2023 Emissions from forest degradation counteracted more than half of the Brazilian Amazon deforestation Redd+ Results. In Proceedings of the Anais do XX Simpósio Brasileiro de Sensoriamento Remoto, Florianópolis, Brazil, 2–5 April 2023; I.N.P.E.: São José dos Campos, Brazil, 2023. Available online: https://proceedings.science/sbsr-2023/trabalhos/emissions-from-forest-degradation-counteracted-more-than-half-of-the-brazilian-a (accessed on 22 April 2023).
  14. Nunes, M.H.; Vaz, M.C.; Camargo, J.L.C.; Laurance, W.F.; de Andrade, A.; Vicentini, A.; Laurance, S.; Raumonen, P.; Jackson, T.; Zuquim, G.; et al. Edge effects on tree architecture exacerbate bio-mass loss of fragmented Amazonian forests. Nat. Commun. 2023, 14, 8129. [Google Scholar] [CrossRef]
  15. Ray, D.; Nepstad, D.C.; Moutinho, P. Micrometeorological and canopy controls of flammability in mature and disturbed forests in an east-central Amazon landscape. Ecol. Appl. 2005, 15, 1664–1678. [Google Scholar] [CrossRef]
  16. Balch, J.K.; Nepstad, D.C.; Curran, L.M.; Brando, P.M.; Portela, O.; Guilherme, P.; Reuning-Scherer, J.D.; de Carvalho, O., Jr. Size, species, and fire behavior predict tree and liana mortality from experimental burns in the Brazilian Amazon. For. Ecol. Manag. 2011, 261, 68–77. [Google Scholar] [CrossRef]
  17. Nunes, M.H.; Camargo, J.L.C.; Vincent, G.; Calders, K.; Oliveira, R.S.; Huete, A.; de Moura, Y.M.; Nelson, B.; Smith, M.N.; Stark, S.C.; et al. Forest fragmentation impacts the seasonality of Amazonian evergreen canopies. Nat. Commun. 2022, 13, 917. [Google Scholar] [CrossRef] [PubMed]
  18. Cawson, J.G.; Collins, L.; Parks, S.A.; Nolan, R.H.; Penman, T.D. Atmospheric dryness removes barriers to the development of large forest fires. Agric. For. Meteorol. 2024, 350, 109990. [Google Scholar] [CrossRef]
  19. Alencar, A.A.; Brando, P.M.; Asner, G.P.; Putz, F.E. Landscape fragmentation, severe drought and the new Amazon forest fire regime. Ecol. Appl. 2015, 25, 1493–1505. [Google Scholar] [CrossRef]
  20. Alencar, A.A.C.; Arruda, V.L.S.; da Silva, W.V.; Conciani, D.E.; Costa, D.P.; Crusco, N.; Duverger, S.G.; Ferreira, N.C.; Franca-Rocha, W.; Hasenack, H.; et al. Long-term Landsat-based monthly burned area dataset for the Brazilian biomes using deep learning. Remote Sens. 2022, 14, 2510. [Google Scholar] [CrossRef]
  21. Tyukavina, A.; Hansen, M.C.; Potapov, P.V.; Stehman, S.V.; Smith-Rodriguez, K.; Okpa, C.; Aguilar, R. Types and rates of forest disturbance in Brazilian Legal Amazon, 2000–2013. Sci. Adv. 2017, 3, e1601047. [Google Scholar] [CrossRef]
  22. Barni, P.E.; Manzi, A.O.; Condé, T.M.; Barbosa, R.I.; Fearnside, P.M. Spatial distribution of forest biomass in Brazil’s state of Roraima, northern Amazonia. For. Ecol. Manag. 2016, 377, 170–181. [Google Scholar] [CrossRef]
  23. Barni, P.E.; Pereira, V.B.; Manzi, A.O.; Barbosa, R.I. Deforestation and forest fires in Roraima and their relationship with phytoclimatic regions in the northern Brazilian Amazon. Environ. Manag. 2015, 55, 1124–1138. [Google Scholar] [CrossRef]
  24. Brazil, IBGE (Instituto Brasileiro de Geografia e Estatística). População de Roraima. Available online: https://cidades.ibge.gov.br/brasil/rr (accessed on 21 April 2023).
  25. Barbosa, R.I.; Fearnside, P.M. Incêndios na Amazônia: Estimativa da emissão de gases de efeito estufa pela queima de diferentes ecossistemas de Roraima na passagem do evento El-Niño (1997/1998). Acta Amaz. 1999, 29, 513–534. [Google Scholar] [CrossRef]
  26. Barbosa, R.I.; Xaud, M.R.; Silva, G.N.F.; Cattâneo, A.C. Forest fires in Roraima, Brazilian Amazonia. Int. For. Fire News (IFFN) 2003, 28, 51–56. [Google Scholar]
  27. Barni, P.E.; Fearnside, P.M.; de Alencastro Graça, P.M.L. Simulating deforestation and carbon loss in Amazonia: Impacts in Brazil’s Roraima state from reconstructing Highway BR-319 (Manaus-Porto Velho). Environ. Manag. 2015, 55, 259–278. [Google Scholar] [CrossRef] [PubMed]
  28. Adeney, J.M.; Christensen, N.L.; Vicentini, A.; Cohn-Haft, M. White-sand ecosystems in Amazonia. Biotropica 2016, 48, 7–23. [Google Scholar] [CrossRef]
  29. Flores, W.M.; França, I.; Santos, G.G.A.; Miranda, I.S.; Moraes, E.F.S.; Sánchez, G.H.; Silva, S.D.B.D.; Hernández-Ruz, E.J. Diametric growth of a forest under reduced-impact logging in the eastern region of the Brazilian Amazon. Land 2023, 12, 704. [Google Scholar] [CrossRef]
  30. Pivello, V.R.; Vieira, I.; Christianini, A.V.; Ribeiro, D.B.; Menezes, L.S.; Berlinck, C.N.; Melo, F.P.L.; Marengo, J.A.; Tornquist, C.G.; Tomas, W.M.; et al. Understanding Brazil’s catastrophic fires: Causes, consequences and policy needed to prevent future tragedies. Perspect. Ecol. Conserv. 2021, 19, 233–255. [Google Scholar] [CrossRef]
  31. Fonseca, M.G.; Anderson, L.O.; Arai, E.; Shimabukuro, Y.E.; Xaud, H.A.M.; Xaud, M.R.; Madani, N.; Wagner, F.H.; Aragão, L.E.O.C. Climatic and anthropogenic drivers of northern Amazon fires during the 2015-2016 El Niño event. Ecol. Appl. 2017, 27, 2514–2527. [Google Scholar] [CrossRef]
  32. Barni, P.E.; Silva, E.B.R.; Silva, F.C.F. Incêndios florestais de sub-bosque na zona de florestas úmidas do sul de Roraima: Área atingida e biomassa morta. In Anais do Simpósio Brasileiro de Sensoriamento Remoto 2017 Campinas; Galoá: São Paulo, Brazil, 2017; pp. 6280–6287. Available online: https://bityl.co/5JeV (accessed on 17 May 2024).
  33. Soares-Filho, B.S.; Nepstad, D.C.; Curran, L.M.; Cerqueira, G.C.; Garcia, R.A.; Ramos, C.A.; Voll, E.; McDonald, A.; Lefebvre, P.; Schlesinger, P. Modelling conservation in the Amazon basin. Nature 2006, 440, 520–523. [Google Scholar] [CrossRef]
  34. Skole, D.L.; Tucker, C.J. Tropical deforestation and habitat fragmentation in the Amazon: Satellite data from 1978 to 1988. Science 1993, 260, 1905–1910. [Google Scholar] [CrossRef]
  35. Souza, C.M., Jr.; Siqueira, J.V.; Sales, M.H.; Fonseca, A.V.; Ribeiro, J.G.; Numata, I.; Cochrane, M.A.; Barber, C.P.; Roberts, D.A.; Barlow, J. Ten-year Landsat classification of deforestation and forest degradation in the Brazilian Amazon. Remote Sens. 2013, 5, 5493–5513. [Google Scholar] [CrossRef]
  36. Buras, A.; Rammig, A.; Zang, C.S. The European forest condition monitor: Using remotely sensed forest greenness to identify hot spots of forest decline. Front. Plant Sci. 2021, 12, 1–19. [Google Scholar] [CrossRef]
  37. Laurance, W.F.; Laurance, S.G.; Ferreira, L.V.; Rankin-de-Merona, J.M.; Gascon, C.; Lovejoy, T.E. Biomass collapse in Amazonian forest fragments. Science 1997, 278, 1117–1118. [Google Scholar] [CrossRef]
  38. Vedovato, L.B.; Fonseca, M.G.; Arai, E.; Anderson, L.O.; Aragão, L.E.O.C. The extent of 2014 forest fragmentation in the Brazilian Amazon. Reg. Environ. Change 2016, 16, 2485–2490. [Google Scholar] [CrossRef]
  39. Laurance, W.F.; Laurance, S.G.; Delamonica, P. Tropical forest fragmentation and greenhouse gas emissions. For. Ecol. Manag. 1998, 110, 173–180. [Google Scholar] [CrossRef]
  40. Brinck, K.; Fischer, R.; Groeneveld, J.; Lehmann, S.; de Paula, M.D.; Pütz, S.; Sexton, J.O.; Song, D.; Huth, A. High resolution analysis of tropical forest fragmentation and its impact on the global carbon cycle. Nat. Commun. 2017, 8, 14855. [Google Scholar] [CrossRef]
  41. Numata, I.; Silva, S.S.; Cochrane, M.A.; d’Oliveira, M.V.N. Fire and edge effects in a fragmented tropical forest landscape in the southwestern Amazon. For. Ecol. Manag. 2017, 401, 135–146. [Google Scholar] [CrossRef]
  42. Igari, A.; Brites, A.; Valdiones, A.P.; Junior, B.; Salgado, B.; Vello, B.G.; Pinto, E.; Martins Neto, F.L.; Prioste, F.G.; Sousa, F.C.; et al. Código Florestal Avaliação 2017|2020; Observatório do Código Florestal e Instituto de Pesquisas da Amazônia (IPAM): Brasília, Brazil, 2021; p. 80. Available online: https://observatorioflorestal.org.br/avaliacao-do-codigo-florestal-2017-2020/ (accessed on 14 December 2023).
  43. Barona, E.; Ramankutty, N.; Hyman, G.; Coomes, O.T. The role of pasture and soybean in deforestation of the Brazilian Amazon. Environ. Res. Lett. 2010, 5, 024002. [Google Scholar] [CrossRef]
  44. Aragão, L.E.O.C.; Shimabukuro, Y.E. The incidence of fire in Amazonian forests with implications for REDD. Science 2010, 328, 1275–1278. [Google Scholar] [CrossRef]
  45. Morton, D.C.; Defries, R.S.; Nagol, J.; Souza, C.M., Jr.; Kasischke, E.S.; Hurtt, G.C.; Dubayah, R. Mapping canopy damage from understory fires in Amazon forests using annual time series of Landsat and MODIS data. Remote Sens. Environ. 2011, 115, 1706–1720. [Google Scholar] [CrossRef]
  46. Silva, C.V.J.; Aragão, L.E.O.C.; Barlow, J.; Fernando Espírito-Santo, F.; Young, P.J.; Anderson, L.A.; Berenguer, E.; Brasil, I.; Brown, I.F.; Castro, B.; et al. Drought-induced Amazonian wildfires instigate a decadal-scale disruption of forest carbon dynamics. Philos. Trans. R. Soc. B 2018, 373, 20180043. [Google Scholar] [CrossRef]
  47. Balch, J.; Schoennagel, T.; Williams, A.; Abatzoglou, J.; Cattau, M.; Mietkiewicz, N.; Denis, L. Switching on the big burn of 2017. Fire 2018, 1, 17. [Google Scholar] [CrossRef]
  48. Walker, X.J.; Rogers, B.M.; Baltzer, J.L.; Cumming, S.G.; Day, N.J.; Goetz, S.J.; Johnstone, J.F.; Schuur, E.A.G.; Turetsky, M.R.; Mack, M.C. Cross-scale controls on carbon emissions from boreal forest megafires. Glob. Change Biol. 2018, 24, 4251–4265. [Google Scholar] [CrossRef]
  49. Brando, P.M.; Paolucci, L.; Ummenhofer, C.C.; Ordway, E.M.; Hartmann, H.; Cattau, M.E.; Rattis, L.; Medjibe, B.; Coe, M.T.; Balch, J. Droughts, wildfires, and forest carbon cycling: A pantropical synthesis. Annu. Rev. Earth Planet. Sci. 2019, 47, 555–581. [Google Scholar] [CrossRef]
  50. Miller, R.G.; Tangney, R.; Enright, N.J.; Fontaine, J.B.; Merritt, D.J.; Ooi, M.K.J.; Ruthrof, K.X.; Miller, B.P. Mechanisms of fire seasonality effects on plant populations. Trends Ecol. Evol. 2019, 34, 1104–1117. [Google Scholar] [CrossRef]
  51. Dalagnol, R.; Phillips, O.L.; Gloor, E.; Galvão, L.S.; Wagner, F.H.; Locks, C.J.; Aragão, L.E.O.C. Quantifying canopy tree loss and gap recovery in tropical forests under low-intensity logging using VHR satellite imagery and airborne LiDAR. Remote Sens. 2019, 11, 817. [Google Scholar] [CrossRef]
  52. Dalagnol, R.; Wagner, F.H.; Galvão, L.S.; Braga, D.; Osborn, F.; Sagang, L.B.; Bispo, P.C.; Payne, M.; Silva Junior, C.; Favrichon, S.; et al. Mapping tropical forest degradation with deep learning and Planet NICFI data. Remote Sens. Environ. 2023, 298, 113798. [Google Scholar] [CrossRef]
  53. Chuvieco, E.; Martín, M.P.; Palacios, A. Assessment of different spectral indices in the red-near infrared spectral domain of burned land discrimination. Int. J. Remote Sens. 2002, 23, 5103–5110. [Google Scholar] [CrossRef]
  54. Bastarrika, A.; Chuvieco, E.; Martín, M.P. Automatic burned land mapping from MODIS time series images: Assessment in Mediterranean ecosystems. IEEE Trans. Geosci. Remote Sens. 2011, 49, 3401–3413. [Google Scholar] [CrossRef]
  55. Bullock, E.L.; Woodcock, C.E.; Olofsson, P. Monitoring tropical forest degradation using spectral unmixing and Landsat time series analysis. Remote Sens. Environ. 2020, 238, 110968. [Google Scholar] [CrossRef]
  56. Condé, T.M.; Higuchi, N.; Lima, A.J.N.; Campos, M.A.A.; Condé, J.D.; de Oliveira, A.C.; de Miranda, D.L.C. Spectral patterns of pixels and objects of the forest phytophysiognomies in the Anauá National Forest, Roraima State, Brazil. Ecologies 2023, 4, 686–703. [Google Scholar] [CrossRef]
  57. Cordeiro, A.P.A.; Berlato, M.A.; Fontana, D.C.; de Melo, R.W.; Shimabukuro, Y.E.; Fior, C.S. Regiões homogêneas de vegetação utilizando a variabilidade do NDVI. Ciência Florest. 2017, 27, 883–896. [Google Scholar] [CrossRef]
  58. Sims, D.A.; Gamon, J.A. Relationships between leaf pigment content and spectral reflectance across a wide range of species, leaf structures and developmental stages. Remote Sens. Environ. 2002, 81, 337–354. [Google Scholar] [CrossRef]
  59. Jensen, J.R. Sensoriamento Remoto do Ambiente: Uma Perspectiva em Recursos Terrestres, 2nd ed.; Prentice Hall/Parêntesis: São Paulo, Brazil, 2009. [Google Scholar]
  60. Alcaras, E.; Costantino, D.; Guastaferro, F.; Parente, C.; Pepe, M. Normalized Burn Ratio Plus (NBR+): A new index for Sentinel-2 imagery. Remote Sens. 2022, 14, 1727. [Google Scholar] [CrossRef]
  61. Simes, T.; Pádua, L.; Moutinho, A. Wildfire burnt area severity classification from UAV-based RGB and multispectral imagery. Remote Sens. 2024, 16, 30. [Google Scholar] [CrossRef]
  62. Barni, P.E.; Barbosa, R.I.; Xaud, H.A.M.; Xaud, M.R.; Fearnside, P.M. Precipitation in northern Amazonia: Spatial distribution in Brazil’s state of Roraima. Soc. Nat. 2020, 32, 439–456. [Google Scholar] [CrossRef]
  63. Song, C.; Woodcock, C.E.; Seto, K.C.; Lenney, M.P.; Macomber, S.A. Classification and change detection using landsat TM data. Remote Sens. Environ. 2001, 75, 230–244. [Google Scholar] [CrossRef]
  64. Congedo, L. Semi-automatic classification plugin: A Python tool for the download and processing of remote sensing images in QGIS. J. Open Source Softw. 2021, 6, 3172. [Google Scholar] [CrossRef]
  65. Broadbent, E.N.; Asner, G.P.; Keller, M.; Knapp, D.E.; Oliveira, P.J.C.; Silva, J.N. Forest fragmentation and edge effects from deforestation and selective logging in the Brazilian Amazon. Biol. Conserv. 2008, 141, 1745–1757. [Google Scholar] [CrossRef]
  66. Chen, X.; Vogelmann, J.; Rollins, M.; Ohlen, D.; Key, C.; Yang, L.; Shi, H. Detecting postfire burn severity and vegetation recovery using multitemporal remote sensing spectral indices and field-collected composite burn index data in a ponderosa pine forest. Int. J. Remote Sens. 2011, 32, 7905–7927. [Google Scholar] [CrossRef]
  67. Jiang, Z.; Huete, A.R.; Didan, K.; Miura, T. Development of a two-band enhanced vegetation index without a blue band. Remote Sens. Environ. 2008, 112, 3833–3845. [Google Scholar] [CrossRef]
  68. Zhang, P.; Hu, X.; Ban, Y.; Nascetti, A.; Gong, M. Assessing Sentinel-2, Sentinel-1, and ALOS-2 PALSAR-2 Data for large-scale wildfire-burned area mapping: Insights from the 2017–2019 Canada wildfires. Remote Sens. 2024, 16, 556. [Google Scholar] [CrossRef]
  69. Fearnside, P.M. Global warming and tropical land-use change: Greenhouse gas emissions from biomass burning, decomposition and soils in forest conversion, shifting cultivation and secondary vegetation. Clim. Change 2000, 46, 115–158. [Google Scholar] [CrossRef]
  70. Brazil, IBGE (Instituto Brasileiro de Geografia e Estatística). Manual Técnico da Vegetação Brasileira—Manuais Técnicos em Geociências no 1. 2ª Edição revista e ampliada; Fundação Instituto Brasileiro de Geografia e Estatística: Rio de Janeiro, Brazil, 2012; p. 267. Available online: https://uc.socioambiental.org/sites/uc/files/2019-12/liv63011.pdf (accessed on 17 January 2024).
  71. Laurance, W.F.; Camargo, J.L.C.; Fearnside, P.M.; Lovejoy, T.E.; Williamson, G.B.; Mesquita, R.C.G.; Meyer, C.F.J.; Bobrowiec, P.E.D.; Laurance, S.G.W. An Amazonian rainforest and its fragments as a laboratory of global change. Biol. Rev. 2018, 93, 223–247. [Google Scholar] [CrossRef] [PubMed]
  72. Correia, C. Governo Publica Redução da Reserva Legal em Terras Rurais de Roraima. Folha de Boa Vista, 4 November 2022. Available online: https://www.folhabv.com.br/economia/governo-publica-reducao-da-reserva-legal-em-terras-rurais-de-roraima/ (accessed on 17 May 2024).
  73. Lopes, C.L.; Minsky, E. Implementação do código florestal em Roraima: Redução de reserva legal de 80% para 50% pode acelerar o desmatamento no Estado. Climate Policy Initiative, Rio de Janeiro, RJ, Brazil. 2023. Available online: https://www.climatepolicyinitiative.org/pt-br/publication/implementacao-do-codigo-florestal-em-roraima-reducao-de-reserva-legal-de-80-para-50-pode-acelerar-o-desmatamento-no-estado/ (accessed on 29 January 2024).
  74. Roraima. Diário Oficial do Estado—DOE. Diário Oficial. Decreto Nº 33.467-E, de 31 de Outubro de 2022. 2022. Available online: https://www.imprensaoficial.rr.gov.br/app/_visualizar-mes/?ano=2022&mes=10 (accessed on 3 February 2025).
  75. Ferrante, L.; Fearnside, P.M. Brazil’s new president and ‘ruralists’ threaten Amazonia’s environment, traditional peoples and the global climate. Environ. Conserv. 2019, 46, 261–263. [Google Scholar] [CrossRef]
  76. Oliveira, S. Rorainópolis, em RR, Entra na Lista de Municípios Com Prioridade no Controle ao Desmatamento na Amazônia. G1, 13 January 2021. Available online: https://bityl.co/5Jdh (accessed on 29 January 2024).
  77. Laurance, W.F.; Nascimento, H.E.M.; Laurance, S.G.; Andrade, A.C.; Fearnside, P.M.; Ribeiro, J.E.L.; Capretz, R.L. Rain forest fragmentation and the proliferation of successional trees. Ecology 2006, 87, 469–482. [Google Scholar] [CrossRef] [PubMed]
  78. Ribeiro, A. Mais da Metade do Desmatamento na Amazônia Ocorre em Terras Públicas. O Globo, 15 February 2022. Available online: https://oglobo.globo.com/brasil/mais-da-metade-do-desmatamento-na-amazonia-ocorre-em-terras-publicas-25395036 (accessed on 2 January 2024).
  79. Fararoda, R.; Reddy, R.S.; Rajashekar, G.; Chand, T.R.K.; Jha, C.S.; Dadhwal, V.K. Improving forest above ground biomass estimates over Indian forests using multi source data sets with machine learning algorithm. Ecol. Inform. 2021, 5, 1013922021. [Google Scholar] [CrossRef]
  80. Guo, Q.; Du, S.; Jiang, J.; Guo, W.; Zhao, H.; Yan, X.; Zhao, Y.; Xiao, W. Combining GEDI and sentinel data to estimate forest canopy mean height and aboveground biomass. Ecol. Inform. 2023, 78, 102348. [Google Scholar] [CrossRef]
  81. MapBiomas (Mapeamento dos Biomas Brasileiros). Alertas Consolidados em 2022: Dados por Estados. Available online: https://lookerstudio.google.com/u/0/reporting/11f468f3-fcf2-4957-865a-e47f1d7cfdc5/page/NUYRD (accessed on 21 March 2024).
  82. Aguiar, A., Jr.; Barbosa, R.I.; Barbosa, J.B.F.; Mourão, M., Jr. Invasion of Acacia mangium in Amazonian savannas following planting for forestry. Plant Ecol. Divers. 2013, 7, 359–369. [Google Scholar] [CrossRef]
  83. Souza, A.O.; Chaves, M.P.S.R.; Barbosa, R.I.; Clement, C.R. Spatial distribution and abundance of Acacia mangium on indigenous lands in the Serra da Lua region, Roraima state, Brazil. Human. Ecol. 2019, 47, 303–310. [Google Scholar] [CrossRef]
  84. Ionova, A. New Palm Oil Frontier Sparks Scramble for Land in the Brazilian Amazon. Mongabay Series: Forest Trackers, Global Palm Oil. Available online: https://news.mongabay.com/2021/04/new-palm-oil-frontier-sparks-scramble-for-land-in-the-brazilian-amazon/ (accessed on 2 May 2024).
  85. Lapola, D.M.; Pinho, P.; Barlow, J.; Aragão, L.E.O.C.; Berenguer, E.; Carmenta, R.; Liddy, H.M.; Seixas, H.; Silva, C.V.J.; Silva-Junior, C.H.L.; et al. The drivers and impacts of Amazon forest degradation. Science 2023, 379, eabp8622. [Google Scholar] [CrossRef]
  86. Brazil, MCTI (Ministério da Ciência, Tecnologia e Inovação). Estimativas Anuais de Emissões de Gases de Efeito Estufa no Brasil. Sexta Edição; MCTI: Brasília, Brazil, 2024; p. 137. Available online: http://gov.br/mcti/pt-br/acompanhe-o-mcti/sirene/publicacoes/estimativas-anuais-de-emissoes-gee/arquivos/6a-ed-estimativas-anuais.pdf (accessed on 30 April 2024).
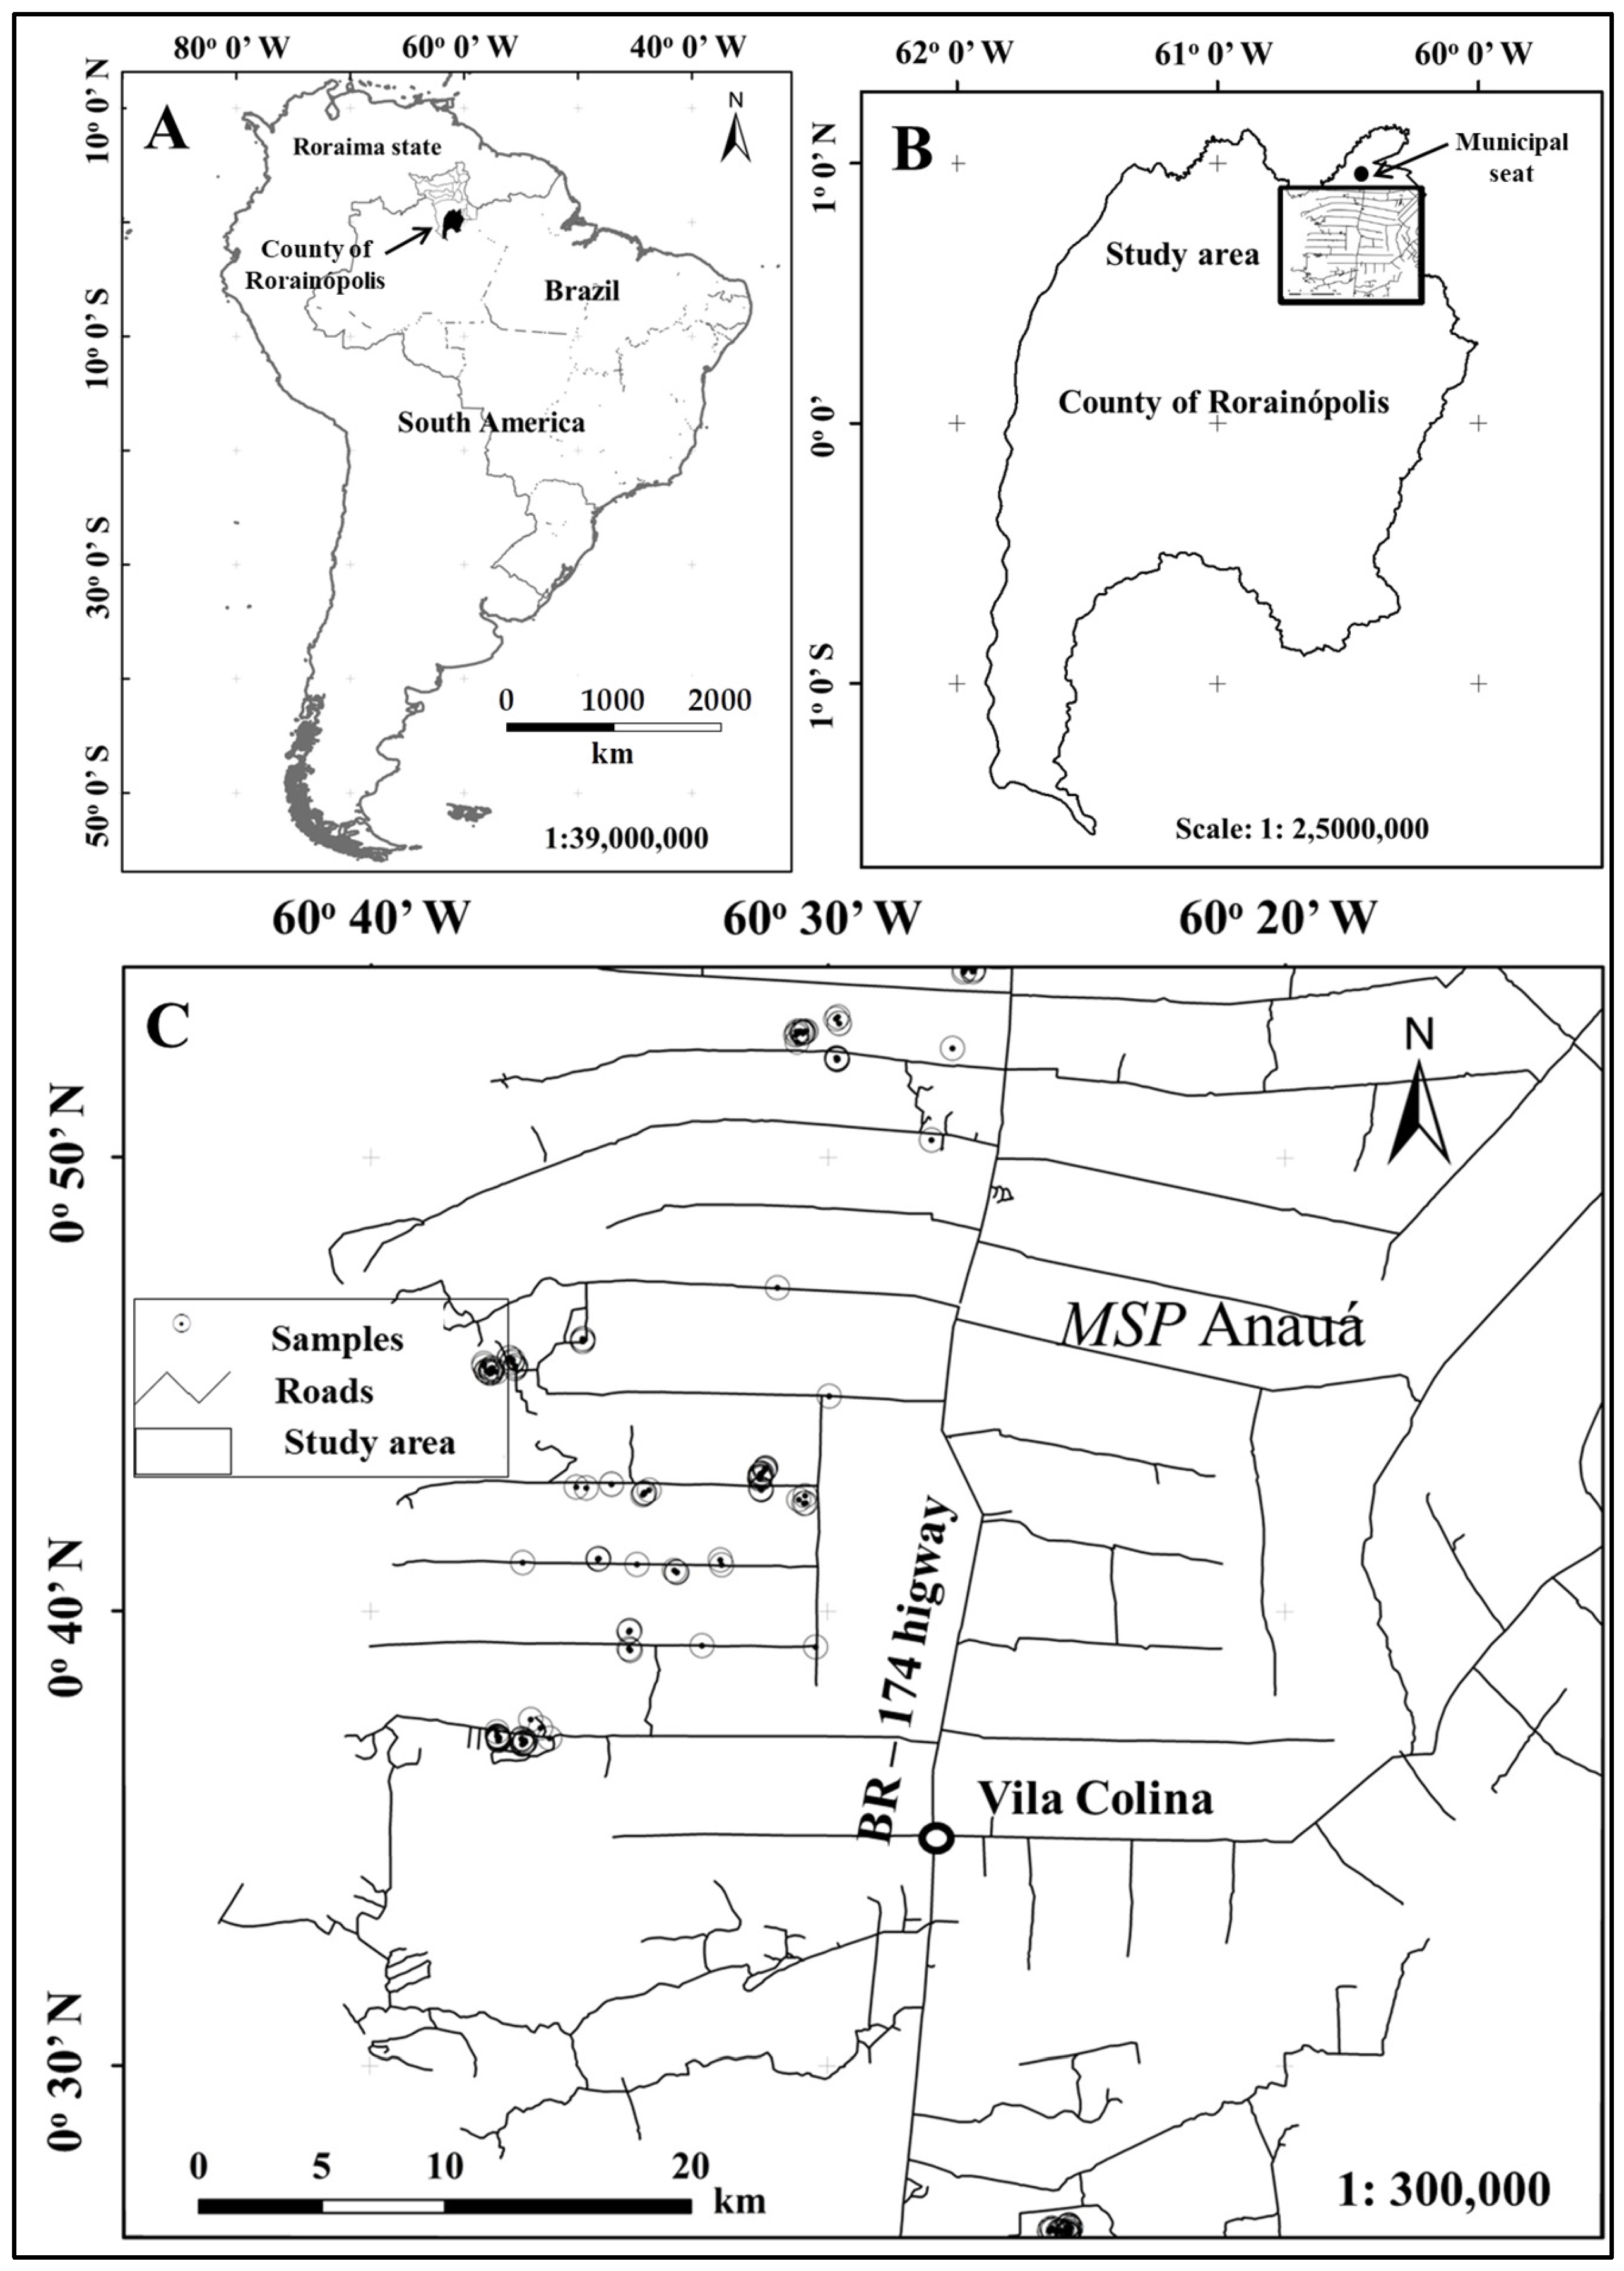
Figure 1. (A) Location of the state of Roraima, with an indication of the municipality (county) of Rorainópolis in relation to Brazil and South America. (B) Study area within the municipality of Rorainópolis, and (C) enlargement of the study area with the locations of the sampling points and the side or secondary roads. MSP = Managed Settlement Project.
Forests 16 01322 g001
Figure 2. Flowchart for characterizing forest edge dynamics.
Forests 16 01322 g002
Figure 3. Cumulative deforestation and edge areas in the study area and percentage of participation of edge areas (%) in relation to cumulative deforestation.
Forests 16 01322 g003
Figure 4. Spectral behavior of pixels at the forest edge from 2007 to 2015 according to the NDVI (A), NBR (B), and NDWI (C). The curves are arranged in sequence from the highest pixel index value to the lowest pixel index value observed at the 100 m limit from the edge.
Forests 16 01322 g004
Figure 5. Spectral behavior of pixels at the forest edge in 2016, 2017, 2021, and 2023 according to the NDVI (A,B), NBR (C,D), and NDWI (E,F), considering the Landsat-8 (A,C,E) and Sentinel-2 (B,D,F) sensors. The central horizontal line in each box plot represents the mean of the values. The boxes represent 1 standard deviation above and below the midline. The same lowercase letters above the plots indicate a non-significant difference between the coefficients of determination obtained at 100, 120, 150, and 200 m from the forest edge. The points above or below the boxes represent values outside the statistical normality curve.
Forests 16 01322 g005
Figure 6. Behavior of the coefficient of determination (adjusted R2) of the three vegetation indices calculated for the years from 2020 to 2023 from the Landsat-8 (- L: (A,C,E)) and Sentinel-2 satellites (- S: (B,D,F)) as a function of the distance from the forest edge. The central horizontal line in each box plot represents the mean value. The boxes represent 1 standard error above and below the midline. The points above or below the boxes represent values outside the statistical normality curve.
Forests 16 01322 g006
Figure 7. (A) Percentage (%) and area (km2) of occurrence of SL, fire, and the edge effect. (B) Percentage and quantity of biomass lost to SL, fire, and the edge effect. The percentage values of area and biomass refer to the total area (1172.9 km2) and the total biomass lost (7.8 × 10⁶ Mg) in the study area. The areas of the polygons in the figure are not proportional to the values indicated.
Forests 16 01322 g007
Figure 8. Occurrence of fire in in the SL area (km2) within 100 m of a forest edge.
Forests 16 01322 g008
Figure 9. Degradation in the study area due to deforestation, the edge effect, fire, and SL. (A) Forest area before the events (RGB composite image). (B) Forest in the process of degradation (vector layers superimposed on the RGB composite image in (A)).
Forests 16 01322 g009
Figure 10. Biomass loss by type of degradation during the analysis period.
Forests 16 01322 g010
Table 1. Composition of bands for calculating vegetation indices.
Sensor/IndexNDVINBRNDWI
Landsat-5 TM ( b 4 b 3 ) ( b 4 + b 3 ) ( b 4 b 7 ) ( b 4 + b 7 ) ( b 4 b 5 ) ( b 4 + b 5 )
Landsat-8 OLI ( b 5 b 4 ) ( b 5 + b 4 ) ( b 5 b 7 ) ( b 5 + b 7 ) ( b 5 b 6 ) ( b 5 + b 6 )
Sentinel-2 SMI ( b 8 b 4 ) ( b 8 + b 4 ) ( b 8 b 12 ) ( b 8 + b 12 ) ( b 8 b 11 ) ( b 8 + b 11 )
Table 2. Areas occupied by forest, deforestation, selective logging (SL), and the forest fires (Fire) that occurred during the analysis period in the study area.
Land Cover* IBGE CodeArea DeforestationSL Fire_1Fire_2
(km2)(%)(km2)(%)(km2)(%)(km2)(%)(km2)(%)
Water 7.80.3
CampinaLa70.82.3
CampinaranaLd601.419.459.25.979.310.5108.322.17.535.8
EcotoneLO1.300.50.10.80.10.030.01
Open Ombrophilous forestAs33.71.13.10.30.80.1
Dense Ombrophilous forestDs2385.476.9947.394.1678.889.4381.577.913.564.2
TOTAL 3103.41001010.1100759.3100489.710021100
* Brazilian vegetation classification abbreviations [70].
Table 3. Results of simple linear regression analysis (adjusted R2) considering increasing distance from the forest edge (10 to 100 m) as an independent variable.
YearNDVI-R2NBR-R2NDWI-R2
20070.8402 ***0.8536 ***0.8323 ***
2008−0.02210.8530 ***0.7898 ***
20090.8765 ***0.7626 ***0.7983 ***
20100.09690.6222 **0.6455 **
20110.7476 **0.6550 **0.5727 **
20130.15060.4575 *0.4301 *
20140.4226 *0.6783 **0.7162 **
2015−0.11560.5539 **0.6331 **
* Significant at 95% statistical confidence. ** Significant at 99% statistical confidence. *** Significant at 99.99% statistical confidence.
Table 4. Results of simple linear regression analysis (adjusted R2) considering the increasing distance from the forest edge (10 to 100 m) as an independent variable and the annual values of the NDVI, NBR, and NDWI, from Landsat-8 (first part of table) and Sentinel-2 images (second part of table), as dependent variables.
YearNDVI-R2NBR-R2NDWI-R2
Landsat-820150.638 **0.6716 **0.678 **
20160.8094 ***0.8105 ***0.8131 ***
20170.8700 ***0.8852 ***0.8397 ***
2018−0.00220.5211 *0.4432 *
20190.6992 **0.7902 ***0.6417 **
20200.5153 *0.7148 **0.6338 **
20210.28140.6095 **0.4004 *
20220.29380.5164 *0.4742 *
20230.5000 *0.6413 **0.6678 **
Sentinel-220150.5261 *0.6472 **0.6284 **
20160.6535 **0.7502 **0.7257 **
20170.6637 **0.07890.0135
20180.00760.1716−0.1087
20190.02240.8589 ***0.5191 *
20200.17940.4363 *−0.1239
2021−0.02580.3867 *0.0468
2022−0.05370.3627 *0.4465 *
20230.17120.4623 *0.5366 **
* Significant at 95% statistical confidence. ** Significant at 99% statistical confidence. *** Significant at 99.99% statistical confidence.
Table 5. Buffer area (ha) and amount of biomass lost by distance range from the edge.
Distance (m)Area (ha)Biomass (Mg)%Mean (Mg ha−1)SdCV%
1040.21490.07.837.15.514.9
2043.31620.48.537.45.013.3
3045.31668.58.736.85.815.7
4047.41775.29.337.45.013.4
5049.71882.29.837.94.211.2
6052.21917.61036.75.815.8
7054.72046.410.737.45.013.5
8057.32162.511.337.74.612.2
9060.32217.211.636.85.815.8
10063.32362.312.337.35.113.6
Total513.619,142.4100.037.35.213.9
Disclaimer/Publisher’s Note: The statements, opinions and data contained in all publications are solely those of the individual author(s) and contributor(s) and not of MDPI and/or the editor(s). MDPI and/or the editor(s) disclaim responsibility for any injury to people or property resulting from any ideas, methods, instructions or products referred to in the content.