Abstract
Habitat fragmentation is one of the main causes of biodiversity loss and the alteration of the structure and function of habitat types. This study aimed to assess the conservation status of forest habitats by examining fragmentation and naturalness. As a case study, we examined the Oak forests of Calabria, which play an important structural and ecological role in the region. The vegetation analysis enabled us to define six forest communities, corresponding to six habitat types or subtypes, as defined by the EEC Directive 92/43. The ecological characteristics of the habitat types were analyzed using Ellenberg–Pignatti indicators. Temperature (T) and moisture (U) are the most significant ecological factors for distinguishing the different habitat types and are strongly correlated with naturalness. The analysis of landscape parameters revealed that habitat types 91AA* and 9330 are the most fragmented and punctuated, with an observed correlation between naturalness and patch density, a parameter expressing the number of patches per unit area. The study of ecological characteristics in relation to biodiversity and landscape indices contributes to the characterization of oak woodland habitats and provides guidelines for the implementation of active conservation measures.
1. Introduction
Landscape structure refers to the composition and arrangement of different habitat types within an area. It encompasses both the quantity of these habitats and their configuration—including the size, shape, and spatial arrangement of individual habitat patches [1]—which plays a significant role in guiding ecological processes [2,3,4]. To ensure the long-term conservation of biodiversity in the face of global climate change, it is essential to define and assess the anthropogenic pressures that impact ecosystems and landscape structure. Such pressures include the invasion of alien species [5], land use change, and changes in the structure and function of natural and semi-natural habitats [6]. Habitat fragmentation into smaller and isolated patches affects the migration and colonization potential of species at the landscape level [7,8] and poses a serious threat to the conservation of biological diversity [8,9,10,11,12].
Numerous studies analyze the relationship between biodiversity and landscape structure [13,14,15,16]. In fragmented habitats, a decrease in their quality can be measured by assessing the plant species assemblage, a method often used in national and supranational regulations to monitor the ecological integrity of ecosystems [17]. Vegetation studies are important tools for ecology, biodiversity, nature conservation, and environmental monitoring [18]. Species are a useful vector of ecological information for identifying and describing vegetation patterns and interpreting their characteristics and dynamics [19]. The fragmentation of natural habitats affects the structure and species composition of plant communities by exposing them to anthropogenic disturbances, either directly or indirectly due to expanding margins. This results in the disappearance of ecologically specialized species with narrow niches, and the emergence of synanthropic and alien species. As highlighted by various authors, the invasion of alien species results in severe alterations to ecosystems, affecting both physical processes [6,20] and species composition and diversity [21]. Several studies [22,23,24] highlight that the habitats of community interest under EEC Directive 92/43 are useful for defining environmental diversity and interpreting the naturalistic value of the landscape.
Although the floristic and structural composition of the vegetation in Calabrian habitats has been widely researched, there are gaps in the literature regarding detailed studies of the relationship between landscape structure and plant communities belonging to the genus Quercus L.
In this study, we investigate the relationship between landscape structure and habitat naturalness by comparing analyses of habitat fragmentation and diversity, considering the ecological characteristics of plant communities. The forest characterized by the dominance of species of the genus Quercus in the Calabria Region, for which an updated distribution map is available thanks to the recent publication of Nature Map [25], was used as a case study. Oak forests are an important component of the Mediterranean forest ecosystems that would potentially occupy a wide belt of land from sea level to the mountain range [26]. The forest vegetation of Calabria, a region in the center of the Mediterranean, is quite well-known thanks to various studies that have examined its ecological, floristic, and structural characteristics [27,28,29,30,31,32,33,34,35,36,37,38]. Although the floristic and structural composition of the vegetation in Calabrian habitats has been widely researched, there are gaps in the literature regarding detailed studies of the relationship between landscape structure and plant communities of the genus Quercus.
The specific objectives of this study are: (i) identifying the different habitat types of the EEC Directive 92/43 through species assemblages and their relationship with ecological factors; (ii) analyzing the fragmentation and naturalness of habitat types at the patch scale; (iii) assessing the conservation status of different habitat types.
The overall aim is to develop tools that can assess the conservation status of different habitat types. These tools will provide insights that will inform effective management strategies to counteract degradation and fragmentation.
2. Materials and Methods
2.1. Study Area
The study was conducted in oak forests in Calabria, a region in southern Italy located at the center of the Mediterranean basin (see Figure 1). The Southern Apennine Mountain Range runs north to south through the region, reaching heights of almost 2000 m, and creates a strong climatic gradient. This results in two distinct bioclimatic regions—the Mediterranean region, extending from sea level to about 1000 m, and the temperate region, located in the mountain belt above 1000 m. The temperate region is characterized by lower average annual temperatures, greater water availability, and the absence of summer droughts. Using habitat mapping from the Nature Map of the Calabria Region [25], we identified habitats dominated by species of the genus Quercus.
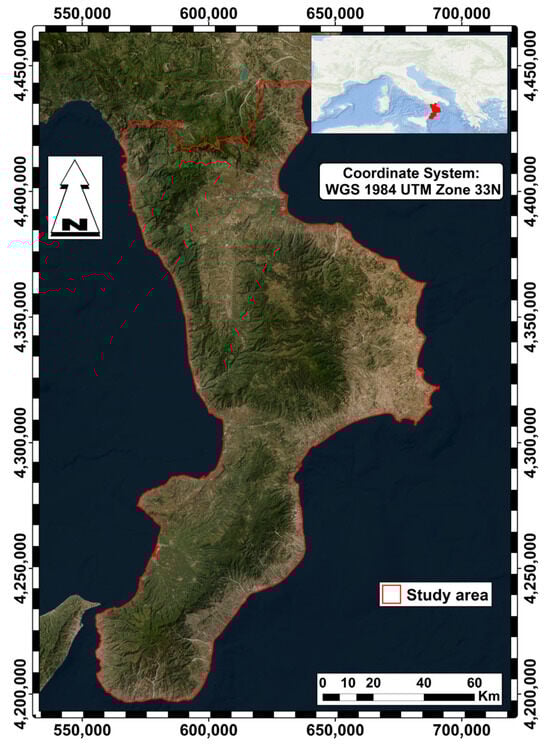
Figure 1.
The study area.
2.2. Vegetation Analysis
The analysis of oak woodland habitats was based on vegetation surveys carried out between 2018 and 2022. These surveys employed the Zurich–Montpellier phytosociological method, which is a widely used approach for classifying and studying plant communities, especially in Europe [39]. Phytosociological relevés consist of lists of tracheophyte taxa present in different vegetation layers, along with information on their abundance and dominance within a homogeneous stand. To capture environmental heterogeneity and facilitate a comprehensive analysis of the forest ecosystem, the phytosociological relevés were conducted using a stratified sampling method. We did this within areas identified on the Nature Map as having forests dominated by Quercus species. Specifically, relevé points were randomly placed within the Nature Map [25] polygons, which refer to Quercus woodlands. The sampling effort was proportionate to the area occupied by the habitat at the regional scale. A total of 59 unpublished georeferenced relevés containing 237 species were carried out throughout the Calabrian region (see Supplementary Materials Tables S1 and S2). The nomenclature of the plant species follows the “Portal to the Flora of Italy” [40]. The phytosociological relevés matrix was subjected to a multivariate analysis to define homogeneous groups on an effective statistical basis. To this end, the abundance–dominance values of each species reported using the Braun–Blanquet scale were converted using the numerical scale proposed by Van der Mareel [41]. The raw data were organized using Microsoft Excel 2010 software. To interpret the habitat types of Directive EEC 92/43, we used the manual for the interpretation of habitats of community interest in Europe and Italy [42,43].
The ecological characteristics of the identified habitat types were assessed through a statistical analysis, utilizing the Ellenberg–Pignatti ecological indicator values modified by Pignatti for the Italian flora [44,45,46,47]. The ecological indicators under consideration were continentality (C), substrate reaction (R), temperature (T), moisture or water availability (U), light (L), and nutrients (N).
2.3. Diversity Analysis
Habitat diversity was evaluated with Shannon’s index [48] (H+) applied to vegetation relevés of habitat types:
Here, pi = coverage percentage of the ith species compared to the entire plant community, and S = number of plant species.
Shannon’s index considers both the number of species and their relative abundance in each habitat types.
We also calculated the Evenness index (J), which quantifies the degree of homogeneity that characterizes a community.
Hmax highlights the maximum potential diversity for a habitat type [49]. Evenness (J) ranges from 1 (communities with a uniform distribution of individuals among the species) to 0, which indicates that all individuals belong to a single species.
The naturalness (Na) of habitat types was assessed using the index proposed by Grünewald [50] applied to vegetation relevés. This index considers not only the biodiversity contributed by alien species, but also that related to anthropogenic disturbance [38], as illustrated by Formula (3).
The Na index ranges from 0 to 1. A value of 0 indicates that all plant diversity is attributable to alien and ruderal species, while a value of 1 shows that these species are absent from plant communities [50]. Alien species were identified according to the “Portal to the Flora of Italy” [40].
Disturbing plants were identified based on their association with synanthropic vegetation types, as defined in “Italian Vegetation Prodrome” [51] and other studies [30]. In particular, disturbing species were those typical of the following vegetation classes:
- Stellarietea mediae, includes ephemeral, nitrophilous, and semi-nitrophilous annual vegetation growing in fertilized agricultural fields and other disturbed sites within human settlements, such as ruderal habitats.
- Galio aparines–Urticetea dioicae, being nitrophilous, mainly perennial vegetation typical of mesophilous habitats with high soil moisture, shade, or both.
- Filipendulo ulmariae–Convolvuletea sepium, being semi-natural perennial vegetation of megaforbs on the edges of disturbed forests and in forest clearings with eutrophic or mesotrophic moist soils, as well as on nutrient-rich riparian strips.
The pressures observed during the vegetation survey were recorded using the classification system of Article 17 of the Habitats Directive [52] (Supplementary Material Table S3).
2.4. Statistical Analysis
The R Core Team 4.4.3 software [53] was used to classify a matrix containing 59 phytosociological relevés and 237 species via a hierarchical cluster analysis. This analysis grouped the relevés according to their species composition. To quantitatively assess dissimilarity between relevés, a distance matrix was calculated using the Euclidean distance metric. Clustering was then performed using the UPGMA (unweighted pair group method with arithmetic mean) hierarchical algorithm, a recognized robust method for analyzing ecological data. The cophylogenetic correlation coefficient (CCC) was then calculated on the relevés–species matrix. The optimal number of clusters (k) was determined using the Silhouette index. The R Core Team 4.4.3 software package was also used to test the significance of differences between various habitat groups with respect to ecological factors using a non-parametric Kruskal–Wallis test and to generate box plots.
A linear correlation analysis was performed on the entire relevé matrix using PAST 4.13 software [54]. The Durbin–Watson and Breusch–Pagan tests were then applied to the linear regression to verify homoscedasticity and describe the relationship between the variables.
2.5. Landscape Metrics
Landscape metrics are statistical tools used to quantify the spatial and temporal patterns and structures of a landscape. These metrics are useful for understanding the relationship between natural habitats and human land use, as well as for assessing habitat fragmentation [55,56,57]. As class-level parameters are more closely correlated with ecological response variables than landscape-level parameters, we analyzed fragmentation at the class level in this study. For this analysis, we used FRAGSTATS software (version 4.2.1), which calculates various landscape fragmentation parameters [58]. Assessing the fragmentation process required us to verify the extent and arrangement of various oak forest patches within the landscape. For this purpose, we examined the cartography of these habitats, using the Natura Map of Calabria [25] in a GIS environment. In this study, we assessed habitat fragmentation using landscape parameters that quantify the landscape configuration and composition. Specifically, we used the shape index (SHAPE), which measures the complexity of a patch’s shape relative to a standard square of the same size [4]. This index, along with the fractal dimension, is widely used in landscape ecology to characterize patch forms [1,58] We also quantified several other landscape metrics. The fractal dimension (FRAC) was used to measure the complexity of flat shapes [5]. Patch number (NP) and patch density (PD) were used as measures of subdivision and fragmentation, with NP representing the number of patches of a given habitat type and PD expressing the number of patches per unit area [6]. Additionally, we calculated the mean patch size (AREA_MN), which is the total area of the class divided by the number of patches. We also considered the total area of the habitat in hectares (surface). The formulas of the parameters considered to quantify the configuration and composition of the landscape are reported below:
SHAPE = shape index; pij = perimeter (m) of the patch ij; aij = area (m2) of the patch ij.
FRAC = fractal dimension index; pij = perimeter (m) of patch ij; aij = area (m2) of patch ij.
PD = patch density; ni = number of patches in the patch-like landscape (class) i; A = total landscape area (m2).
3. Results
3.1. Habitat Types
The Silhouette index, which is used to determine the optimal number of clusters, shows a maximum value of 0.20 at K = 6 (see Figure 2). This suggests that six clusters would provide the best balance of compactness and separation for our data.
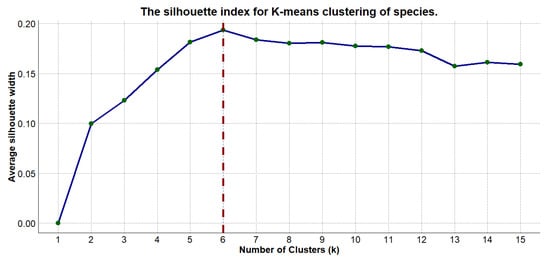
Figure 2.
The Silhouette index analysis used to validate the optimal number of clusters.
The cluster analysis of the relevé–species matrix from the oak forest produced the dendrogram shown in Figure 3. The high cophenetic correlation coefficient (CCC) of 0.8456 suggests a strong correlation between the dissimilarities in the original dataset and the hierarchical structure of the dendrogram. The abscissa of the dendrogram displays the relevés, while the ordinate shows the similarity scale. The first subdivision occurs at a similarity level of 1.4, with subsequent subdivisions occurring at similarity coefficients of 1.3, 1.2, 1.1, and 1.0, revealing six distinct groups of oak relevés. According to the European and Italian interpretation manuals of the Habitats Directive 92/43/EEC [42,43], and considering the diagnostic species, the groups correspond to the following habitats:
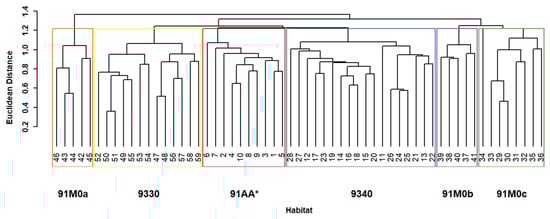
Figure 3.
The hierarchical cluster analysis dendrogram of vegetation data from oak woodland habitat types (Euclidean distance coefficient and UPGMA clustering algorithm) revealing six distinct habitat types: red—91AA*: Eastern white oak woods; yellow—9330: Quercus suber forests; blue—9340: Quercus ilex and Quercus rotundifolia forests; orange—91M0a Pannonian–Balkan sessile oak forestsdominated by Quercus cerris; purple—91M0b: Pannonian–Balkan sessile oak groves dominated by Quercus frainetto; green—91M0c: Pannonian–Balkan sessile oak groves dominated by Quercus petraea subsp. austrotyrrhenica.
Group 1–10: Habitat 91AA*: (Eastern white oak woods.
Group 11–28: Habitat 9340: Quercus ilex and Quercus rotundifolia forests.
Group 29–36: Habitat 91M0c: Pannonian–Balkanic Turkey oak–Sessile oak forests, characterized by the dominance of Quercus petraea subsp. austrotyrrhenica.
Group 37–41: Habitat 91M0b: Pannonian–Balkanic Turkey oak–sessile oak forests), dominated by Quercus frainetto.
Group 42–46: Habitat 91M0c: Pannonian–Balkanic Turkey oak–sessile oak forests, dominated by Quercus cerris.
Group 47–59: Habitat 9330: Quercus suber forests.
3.2. Ecological Analysis
The ecological characteristics of the six identified habitats are shown in Figure 4 using boxplots with the ecological indicator values of moisture (U), temperature (T), light (L), nutrients (N), continentality (C), and substrate reaction (R). The Kruskal–Wallis test was applied to quantify the separability of the various habitat groups considering the mean values of the ecological index.
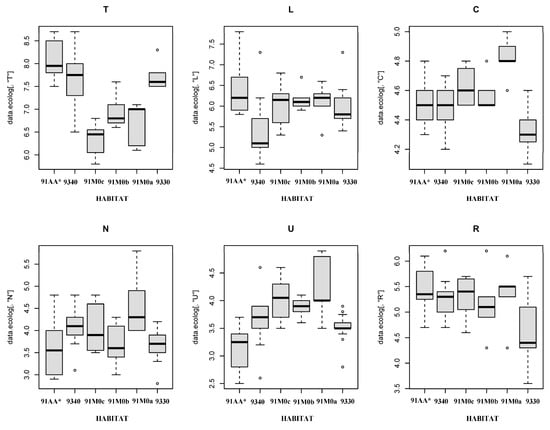
Figure 4.
Box plot of Ellenberg–Pignatti indicator values for each habitat type: 91AA*: Eastern white oak woods; 9340: Quercus ilex and Quercus rotundifolia forests; 91M0c: Pannonian–Balkanic Turkey oak–sessile oak forests dominated by Quercus petraea subsp. austrotyrrhenica; 91M0b: Pannonian–Balkanic Turkey oak–sessile oak forests dominated by Quercus frainetto; 91M0a: Pannonian–Balkanic Turkey oak–sessile oak forests dominated by Quercus cerris; 9330: Quercus suber forests. Box plots show median, interquartile range, maximum, minimum, and outlier values (U = moisture; C = continentality; R = substrate reaction; T = temperature; L = light; N = nutrients).
The ecological light indicator (L) is highest in habitat 91AA*, with lower values shown in habitat 9340. Significant differences for this ecological indicator were found between habitats 91AA* and 9340 (p < 0.001). Further significant differences were observed between habitat 9340 and habitats 91M0c, 91M0b, 91M0a, and 9330 (p values of 0.02, 0.04, and 0.02, respectively).
The ecological temperature indicator (T) is highest in habitats 91AA* and 9330 and lowest in habitats 91M0a, 91M0b, and 91M0c. Statistically significant differences were found between habitats 91AA* and 91M0c (p < 0.001), 91M0b (p = 0.027), and 91M0a (p = 0.02). Finally, habitat 9330 differs significantly from habitats 91M0c (p < 0.0001), 91M0b (p = 0.04), and 91M0a (p = 0.0025).
The continentality indicator (C) is highest in habitats 91M0c, 91M0b, and 91M0a, and lowest in habitats 9330 and 9340. Significant differences were found between habitat 9330 and habitats 91M0c (p < 0.0001), 91M0b (p = 0.0081), and 91M0a (p < 0.0001). Additionally, significant differences were found between habitats 9340 and 91M0a (p = 0.0284).
The moisture indicator (U) values are highest in habitats 91M0c, 91M0b, and 91M0a, and lowest in habitats 91AA* and 9330. Statistically significant differences were observed between habitats 91AA* and 91M0c (p < 0.001), 91M0b (p = 0.0314), 91M0a (p = 0.0490), and 9340 (p = 0.0017). Significant differences were also found between habitat 9330 and habitats 91M0c (p < 0.001), and 91M0a (p = 0.0092). Overall, this analysis showed that the ecological indicators of moisture (U), continentality (C), temperature (T), and light (L) are the most important in characterizing species composition in the analyzed dataset. The overall table of this evaluation is shown as Supplementary Material Table S4.
3.3. Diversity and Naturalness of Habitats
The analysis of oak woodland biodiversity (Figure 5a) shows maximum total Shannon (H+) and evenness (J) values in habitats 91M0c, 9330, and 9340, with minimum values in habitats 91M0a and 91M0b. Figure 5b presents the habitats’ naturalness values, which were calculated as the ratio of total H+ to the H+ values excluding disturbance and exotic species. The highest naturalness values occur in habitats 91M0a, 91M0b, and 91M0c, while habitats 9330 and 91AA* show lower values. This indicates a greater contribution of disturbance species to the total diversity in the latter habitats (see Supplementary Material Table S5).
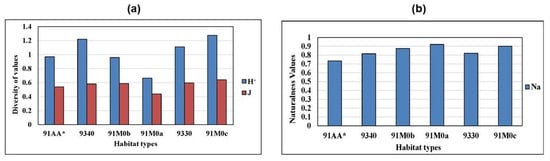
Figure 5.
Values of the biodiversity indices of the different habitat types (H+ = Shannon’s index, J = Evenness) (a). Naturalness index (Na) values for different habitat types (b).
3.4. Relationship Between Naturalness and Ellenberg–Pignatti Indicator Values
The linear regression model found a highly significant correlation between the naturalness index (Na) and the ecological factors of temperature (T) and moisture (U) in 25 of the 59 relevés (Supplementary Material Table S6). Specifically, Figure 6 shows a highly significant linear regression between naturalness and temperature, with a p-value for the slope of 0.000000015981 (p < 0.05). This relationship is further characterized by a correlation coefficient of r = −0.87 and a regression coefficient of r2 = 0.76 (Supplementary Material Table S7).
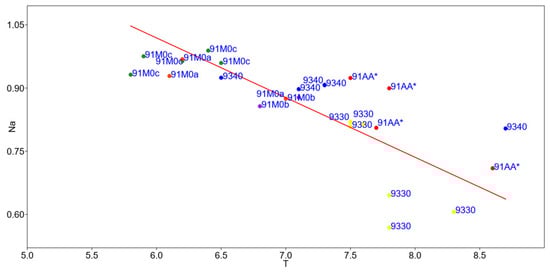
Figure 6.
Linear regression model between the naturalness index (Na) and the Ellenberg–Pignatti temperature indicator value (T): 91AA* (red); 91M0a (orange); 91M0b (violet); 91M0c (green); 9330 (yellow); 9340 (blue).
To verify the autocorrelation analyses, we applied the Durbin–Watson statistical test, which produced a value of 1.41 and an autocorrelation probability of 6%. The Breusch–Pagan test was used to calculate the variance of the residuals and confirm homoscedasticity, yielding a value of 3.26 and a homoscedasticity probability of 11% (see Supplementary Material Table S8). This analysis indicates that natural habitats become less natural with increasing temperature. This is because low-lying habitats are more affected by human activity and are often located near urbanized areas.
The regression model between naturalness and the ecological moisture indicator (U) confirms a strong positive correlation. This is shown by a p-value for the slope of 0.000010336 (p < 0.05), a correlation coefficient of r = 0.76, and a coefficient of determination (r2) of 0.57 (Supplementary Material Table S8).
To verify the autocorrelation analyses, we applied the Durbin–Watson statistical test, which produced a value of 1.4 and an autocorrelation probability of 10%. The Breusch–Pagan test was used to calculate the variance of the residuals and confirm homoscedasticity, yielding a value of 0.37 and a homoscedasticity probability of 54%. This analysis shows that natural habitats become less natural as temperature increases. This is because low-lying habitats are more affected by human activity and are often located near urbanized areas (see Supplementary Material Table S9).
3.5. Landscape Analysis
Starting from the Nature map of the Calabria Region [25], all polygons coded as habitat types characterized by the dominance of Quercus species were highlighted (Figure 7).
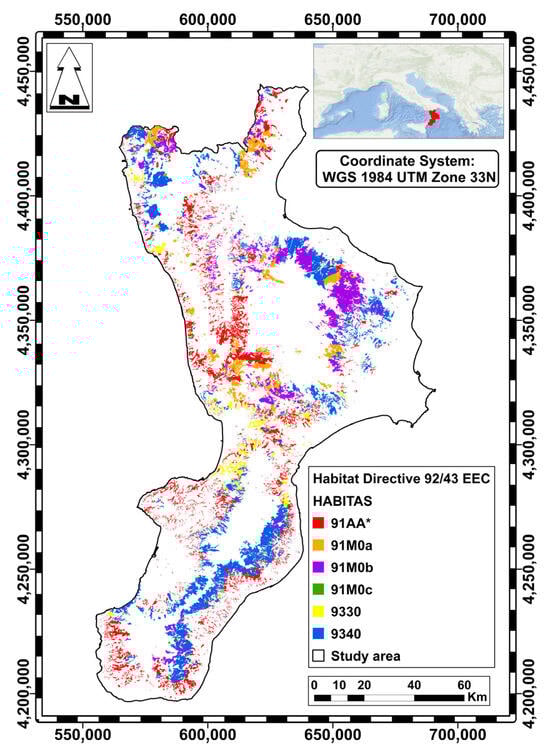
Figure 7.
Distribution of oak-dominated forest habitats in Calabria region: 91AA* (red); 91M0a (orange); 91M0b (violet); 91M0c (green); 9330 (yellow); 9340 (blue).
The landscape metrics used to analyze the fragmentation of oak-dominated habitats are reported in Table 1. These forests constitute an important part of the region’s natural heritage, occupying a total area of 252,301 hectares and representing 44.8% of the regional forested area (563,541 hectares) [25]. The largest habitat is 9340, followed by 91AA*. The number of patches (NP) varies greatly across habitat types, with the highest values found in the Quercus pubescens oak forest habitat (91AA*). These high values indicate that this habitat is the most fragmented.

Table 1.
Landscape metrics of habitat types (NP—number of patches; AREA_MN—mean patch area; PD—patch density; FRAC_MN—mean fractal dimension index; SHAPE_MN—mean shape index; Surface—total surface area in Calabria region (ha).
The mean area (AREA_MN) has maximum values for habitats 91M0a (Pannonian–Balkanic Turkey oak–sessile oak forests, dominated by Quercus cerris) and 9340, (Quercus ilex and Q. rotundifolia forests), while the minimum values are recorded for habitat 91AA*, (Eastern white oak woods), and 91M0c, (Pannonian–Balkanian Turkey oak-Sessile oak forests), which are dominated by Quercus petraea subsp. austrotyrrhenica.
The patch density (PD) is higher in Eastern white oak (Quercus pubescens) woods (91AA*) and in Quercus ilex and Quercus rotundifolia forests (9340). By contrast, lower values are found in Pannonian–Balkanic Turkey oak–sessile oak forests dominated by Quercus petraea subsp. austrotyrrhenica (91M0c).
The Shape index (SHAPE_MN) shows higher values in habitats 9340 and 9330 (2.11 and 2.05, respectively) due to their irregular shapes. However, these irregular habitats are less effective at protecting the integrity of their ecosystems due to a loss of surface area and an increase in species associated with human disturbance [59].
The values of the mean fractal dimension index (FRAC_MN) are higher for habitats 91AA*, 9340, and 9330 than habitat 91M0, thereby showing higher fragmentation.
3.6. Relationship Between Fragmentation and the Naturalness Index
The patch density (PD) values were compared with the naturalness values of the various habitat types (see Figure 8). Although the number of cases is not very high, it can be seen that habitat 91AA* is characterized by lower naturalness and higher patch density, confirming the high fragmentation of this habitat. The model shows a significant p-slope of less than 0.05 (0.00000048404) and a correlation of 0.82. To check the autocorrelation analysis, the Durbin–Watson statistical test was applied, which gave a value of 1.6 and an autocorrelation probability of 41%. The variance of the residuals and the homoscedasticity was calculated using the Breusch–Pagan test, which gave a value of 1.78 and a homoscedasticity probability of 18% (Supplementary Material Table S9).
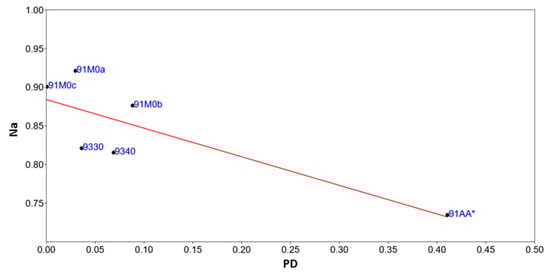
Figure 8.
Linear regression model between Patch Density (PD) and Naturalness (Na) values of different habitat types.
4. Discussion
Oak-dominated forests constitute important natural and economic heritage for the Calabria Region. They cover 252,301 ha, representing 44.8% of the region’s total wooded surface area of 563,541 ha [25]. This study assesses the naturalness of habitats (Na) by analyzing biodiversity data and excluding species associated with human-caused disturbance, such as alien and ruderal species. The findings are then integrated with a habitat fragmentation analysis. This combined approach offers a more comprehensive assessment of habitat conservation status than previous studies, which typically focused on either detailed vegetation characterization [29,30] or landscape analyses alone [60,61,62,63].
The cluster analysis of relevés from oak-dominated forests identified six distinct groups, which were attributed to the same number of habitat types or subtypes defined by the Italian and European interpretation manuals of EEC Directive 92/43 [42,43]. These groups also correspond to phytosociological syntaxa found in the literature [18,51]. Phytosociological analyses and the formal classification of plant communities (syntaxa) have indeed been fundamental in defining and interpreting EEC Directive 92/43 habitat types [64].
Habitat 9340, characterized by forests dominated by holm oak (Quercus ilex L.), is distributed across the Mediterranean region [51], and occupies the largest area in Calabria (see Table 1 and Figure 7). Habitat 9330 is characterized by cork oak (Quercus suber L.) forests, which are spread over limited areas with acidic, sandy soils, especially on the Tyrrhenian side of Calabria [34].
Habitat 91M0 is rather heterogeneous. In the Calabria region, it consists of deciduous mesophilous and meso-termophilous oak forests tending towards silicicolous and sub-acidic. These forests are multilayered and form in the supra-Mediterranean and meso-temperate bioclimatic zones. This habitat includes forests dominated by Turkey oak (Quercus cerris L.) (91M0a), Hungarian oak (Q. frainetto Ten.) (91M0b), or sessile oak (Q. petraea (Matt.) Liebl. subsp. austrotyrrhenica Brullo, Guarino & Siracusa) (91M0c). Habitat 91AA* is characterized by Mediterranean and sub-Mediterranean thermophilic and often xerophilic forests dominated by Quercus pubescens Willd. This is a complex species, and various entities within it are classified differently from a taxonomic perspective [36,44,65]. This habitat is widely distributed throughout the Italian Peninsula and is particularly widespread in Calabria (see Table 1 and Figure 7).
The ecological indicators that most differentiate the various habitats types are temperature (T), light (L), nutrients (N), and moisture (U). These factors have a significant influence on the floristic composition of the oak forest habitats identified (Figure 4).
From a phytosociological perspective, two main habitat groups can be identified and classified into the main types of forest vegetation found in Mediterranean regions. The first group consists of plant communities belonging to the Querco roboris–Fagetea sylvaticae class. These communities represent the mesophilic, winter–deciduous forest vegetation that is typical of temperate macroclimatic areas of Europe. In contrast, the second group includes forest communities belonging to the Quercetea ilicis class. This class encompasses thermophilic woods and scrub, which are predominantly evergreen and sclerophyllous. These communities are widespread throughout the Mediterranean bioclimatic region [18].
Holm oak forests (habitat type 9340) are widespread in the region, occupying an extensive altitudinal range from sea level to the mountain belt. Temperature and moisture are key factors in the ecological characterization of this habitat type. The lowest values of continentality (higher oceanicity) are observed in habitat 9330, which is why cork oak forests are mainly found in the Tyrrhenian regions of the Italian peninsula and in Western Mediterranean countries bordering the Atlantic Ocean. In Calabria, these forests are mainly found on the Tyrrhenian side of the region. Habitat 91M0 exhibits higher continentality; subtype 91M0a is characterized by the dominance of Quercus cerris and displays the highest continentality values. This explains why these forests are distributed in continental biogeographical regions, as detailed in the literature [66].
Furthermore, the results indicate that habitats with lower moisture index values (U) and higher temperature index values (T) exhibit lower naturalness index values. This is evident in habitats 9330 and 91AA*, which have undergone significant changes in community composition due to the introduction of non-native species [67,68]. Habitat 91AA* exhibited higher levels of the ecological indicator of light reaching the ground, thereby increasing the diversity of the herbaceous layer [69], as well as a greater abundance of ruderal species, in line with the findings of Pérez-Ramos et al. [70]. The deciduous forests of habitats 91M0a, 91M0b, and 91M0c demonstrate high naturalness. This is positively correlated with ecological indicators of moisture and soil nitrogen and negatively correlated with temperature values. This confirms that environmental factors such as light availability [70] and soil conditions [71] affect the species richness in the herbaceous layer.
Our results are consistent with those of other studies conducted in various Mediterranean regions [60,61,62]. These studies suggest that human activities alter the floristic composition and the conservation status of habitats, thereby negatively impacting the ecological integrity. They also advocate methods that can assess and sustain biodiversity.
However, our results, in line with those of other studies [72,73], suggest that the lower naturalness of these habitats, associated with a higher presence of ruderal and alien species, can be interpreted as an indicator of the initial stages of regression succession caused by various anthropogenic disturbances. Conversely, habitats with greater naturalness and diversity are in a more stable condition, closer to potential natural vegetation. Furthermore, the presence of ruderal and alien species in more fragmented habitats indicates specific ecological mechanisms. These species are characterized by biological traits such as intense competition and broad ecological tolerance, making them particularly well suited to colonizing and enduring in various human-altered environments [73].
Spatial heterogeneity at landscape scales has a significant influence on habitat conservation [54]. The greater the complexity of a shape, the more edges it has, which has harmful effects on fauna and flora [74]. Complex shapes can be more easily divided into smaller areas, increasing habitat fragmentation [75]. The results of the landscape analysis show that habitat 91AA* is the most fragmented. It is characterized by a greater number of patches, a smaller average area, a higher density, and a larger fractal size than other habitats.
Habitats 9330 and 91AA* have high SHAPE and FRAC_MN values. This results in irregularly shaped polygons, which are easily penetrated and susceptible to fragmentation. According to the literature [23,34,76], this fragmentation is caused by repeated fires (PH04), excessive grazing (PA08), and the replacement of these forest formations with cultivated land (PA02) or forest plantations (PF04). This results in scattered patches of forest habitat in areas used for agriculture or grazing, which negatively affects the naturalness of habitats 91AA* and 9330. These habitats are subject to the greatest anthropogenic impact due to their locations at lower altitudes where human settlement is concentrated. In contrast, habitats 91M0a and 91M0c are typically located at higher elevations within protected areas and exhibit higher naturalness values.
Several authors [77,78] have highlighted that population growth and the subsequent demand for new agricultural and urban land is a significant cause of natural habitat degradation, particularly in forests by causing changes in dominant species, their diversity, and the areas they cover. The expansion of artificial and agricultural areas also promotes the proliferation of exotic species (PI01, PI02), many of which are closely associated with landscape features such as roads, boundaries, and specific land uses [79,80]. Numerous studies emphasize that protected areas are essential for safeguarding ecosystems, habitats, and species threatened by changes in land use and the spread of alien species [81].
5. Conclusions
Forest fragmentation is a leading cause of habitat alteration. It often begins with selective logging and progresses through changes related to agricultural land use, ultimately resulting in isolated forest patches. Over the latter half of the 20th century, urbanization and infrastructure development accelerated this process. Compared to contiguous forests, fragmented forests exhibit reduced biodiversity and impaired ecological processes [81]. Based on our floristic and ecological characterization of habitats, our study found a correlation between the most fragmented habitats and lower levels of naturalness. At first glance, this finding appears to contradict other research [82]. However, in line with previous studies [83,84], we found that changes in the structure of the landscape are the main cause of invasive and ruderal species becoming established in forest habitats.
The study highlights which habitats to focus on for monitoring and conservation, particularly those that are more fragmented and degraded. This includes white oak forests (91AA*), a priority habitat important for biodiversity conservation at a European level. They are fragmented into numerous small patches that are frequently located near agricultural or urban areas. This proximity fosters the presence of non-native species that compromise the structure and functionality of these habitats, reducing their naturalness and threatening their conservation.
Specific conservation measures should also target rare, localized habitats with very low cover and high conservation value. These include cork oak woods (9330) and Quercus petraea-dominated woods (91M0c), both of which are at high risk of extinction in the near future due to significant impacts.
The ecological and diversity-based characterization of habitat types is fundamental for addressing issues in forest resource management. Consequently, applying diversity indices linked to landscape analyses is an effective way of identifying the causes of change driven by invasive and disruptive species. Our results show that habitats of community interest, particularly priority habitats such as 91AA*, are under pressure and require urgent attention. This aligns with the conservation objectives set out in the Habitats Directive and the Biodiversity Strategy 2030 of the European Green Deal.
While the Habitats Directive’s “conservation objectives and measures” are in place at the local level, the challenge lies in their effective implementation through the involvement of Natura 2000 sites and protected area management authorities.
To counter fragmentation, specific management measures must, therefore, be applied to promote ecological connectivity between forest fragments through targeted interventions such as reforestation and the creation of ecological corridors. Invasive alien species must be combated through monitoring and eradication projects, especially those listed at the EU level [85]. For more fragmented habitats, such as 91AA* and 9330, controlling fire through specific indications in AIB fire plans is essential [86]. Concurrently, grazing intensity should be reduced to encourage regeneration processes.
The approach outlined in this study, based on vegetation analyses, can be used to monitor habitat fragmentation and assess the conservation status of other European territories.
Supplementary Materials
The following supporting information can be downloaded at: https://www.mdpi.com/article/10.3390/f16081320/s1, Table S1. Phytosociological relevés. Table S2. Relevés sites. Table S3. List of pressures observed according to the classification system set out in Article 17 of the Habitats Directive (92/43 EEC). Table S4. The Kruskal-Wallis test. Table S5. Values of biodiversity indices for each habitat type (H+ = Shannon total species, J = Evenness, Na = Naturalness). Table S6. Relevés showing a highly significant correlation between the naturalness index (Na) and the ecological factors of temperature (T) and moisture (U). Table S7. Linear regression between the naturalness index (Na) and temperature ecological factor (T). Table S8. Linear regression between the naturalness index (Na) and the moisture ecological indicator (U). Table S9. Linear regression model between Pacth Density (PD) and naturalness (Na) values of different habitat types.
Author Contributions
Conceptualization, A.M. and G.S.; methodology, A.M. and G.S.; software, A.M.; validation, A.M. and G.S.; formal analysis, A.M. and G.S.; investigation, A.M. and G.S.; data curation, A.M. and G.S.; writing—original draft preparation, A.M. and G.S.; writing—review and editing, G.S. and A.M.; visualization, A.M. and G.S.; supervision, G.S.; funding acquisition, G.S. All authors have read and agreed to the published version of the manuscript.
Funding
This research was partially supported by the Nature Map System project signed between the AGRARIA Department—Mediterranean University of Reggio Calabria and the Territory and Environment Department of Calabria Region, Sector 5, Parks and Protected Natural Areas, under the Regional Operational Program (ROP) 2014/2020—Action 6.5.A.1—with actions provided for in the Action Framework (PAF) and in the Natura 2000 Network Management Plans, under scientific manager Giovanni Spampinato.
Data Availability Statement
Data are contained within the article and Supplementary Materials.
Conflicts of Interest
The authors declare no conflicts of interest.
References
- Forman, R.T.T.; Godron, M. Landscape Ecology; John Wiley & Sons: New York, NY, USA, 1986. [Google Scholar]
- O’Neill, R.V.; Krummel, J.R.; Gardner, R.E.A.; Sugihara, G.; Jackson, B.; DeAngelis, D.L.; Graham, R.L. Indices of landscape pattern. Landsc. Ecol. 1988, 1, 153–162. [Google Scholar] [CrossRef]
- Turner, M.G.; O’Neill, R.V.; Gardner, R.H.; Milne, B.T. Effects of changing spatial scale on the analysis of landscape pattern. Landsc. Ecol. 1989, 3, 153–162. [Google Scholar]
- Gustavson, E.J.; Parker, G.R. Relationships between landcover proportion and indices of landscape spatial pattern. Landsc. Ecol. 1992, 7, 101–110. [Google Scholar] [CrossRef]
- Šipek, M.; Kutnar, L.; Marinšek, A.; Šajna, N. Contrasting responses of alien and ancient forest indicator plant species to fragmentation process in the temperate lowland forests. Plants 2022, 11, 3392. [Google Scholar] [CrossRef] [PubMed]
- Gordon, D.R. Effects of invasive, nonindigenous plant species on ecosystem process: Lessons from Florida. Ecol. Appl. 1998, 8, 975–989. [Google Scholar] [CrossRef]
- Ahlqvist, O.; Shortridge, A. Spatial and semantic dimensions of landscape heterogeneity. Landsc. Ecol. 2010, 25, 573–590. [Google Scholar] [CrossRef]
- Ibáñez, I.; Katz, D.S.; Peltier, D.; Wolf, S.M.; Connor Barrie, B.T. Assessing the integrated effects of landscape fragmentation on plants and plant communities: The challenge of multiprocess–multiresponse dynamics. J. Ecol. 2014, 102, 882–895. [Google Scholar] [CrossRef]
- Henle, K.; Lindenmayer, D.B.; Margules, C.R.; Saunders, D.A.; Wissel, C. Species survival in fragmented landscape: Where are we now? Biodivers. Conserv. 2004, 13, 1–8. [Google Scholar] [CrossRef]
- Krauss, J.; Klein, A.M.; Steffan-Dewenter, I.; Tscharntke, T. Effects of habitat area, isolation, and landscape diversity on plant species richness of calcareous grasslands. Biodivers. Conserv. 2004, 13, 1427–1439. [Google Scholar] [CrossRef]
- Kolb, A.; Diekman, M. Effects of life-history traits on responses of plant species to forest fragmentation. Conserv. Biol. 2005, 19, 929–938. [Google Scholar] [CrossRef]
- Lindenmayer, D.B.; Fischer, J. Tackling the habitat fragmentation panchreston. Trends Ecol. Evol. 2007, 22, 127–132. [Google Scholar] [CrossRef]
- Bissonette, J.A. (Ed.) Wildlife and Landscape Ecology: Effects of Pattern and Scale; Springer: New York, NY, USA, 1997; pp. 3–31. [Google Scholar]
- Dufour, A.; Gadallah, F.; Wagner, H.H.; Guisan, A.; Buttler, A. Plant species richness and environmental heterogeneity in a mountain landscape. Effects of variability and spatial configuration. Ecography 2006, 29, 573–584. [Google Scholar] [CrossRef]
- Schindler, S.; Curado, N.; Nikolov, S.; Kret, E.; Cárcamo, B.; Poirazidis, K.; Catsadorakis, G.; Wrbka, T.; Kati, V. From research to implementation: Nature conservation in the Eastern Rhodopes mountains (Greece and Bulgaria), European Green Belt. J. Nat. Conserv. 2011, 19, 193–201. [Google Scholar] [CrossRef]
- Bailey, D.; Herzog, F.; Augenstein, I.; Aviron, S.; Billeter, R.; Szerencsits, E.; Baudry, J. Thematic resolution matters: Indicators of landscape pattern for European agro-ecosystems. Ecol. Indic. 2007, 7, 692–709. [Google Scholar] [CrossRef]
- Brooks, R.P.; O’Connell, T.J.; Wardrop, D.H.; Jackson, L.E. Towards a regional index of biological integrity: The example of forested riparian ecosystems. In Monitoring Ecological Condition at Regional Scales, Proceedings of the Third Symposium on the Environmental Monitoring and Assessment Program (EMAP) Albany, NY, USA, 8–11 April 1998; Springer: Cham, Switzerland, 1998; pp. 131–143. [Google Scholar]
- Novák, P.; Willner, W.; Zukal, D.; Kollár, J.; Roleček, J.; Świerkosz, K.; Ewald, J.; Wohlgemuth, T.; Csiky, V.; Onyshchenko, J.; et al. Oak-hornbeam forests of central Europe: A formalized classification and syntaxonomic revision. Preslia 2020, 92, 1–34. [Google Scholar] [CrossRef]
- Mucina, L.; Bultmann, H.; Dierßen, K.; Theurillat, J.P.; Raus, T.; Carni, A.; Šumberová, K.; Willner, W.; Dengler, J.; Gavilán García, R.; et al. Vegetation of Europe: Hierarchical floristic classification system of plant, lichen, and algal communities. Appl. Veg. Sci. 2016, 19, 3–264. [Google Scholar] [CrossRef]
- Gritti, E.S.; Smith, B.; Sykes, M.T. Vulnerability of Mediterranean Basin ecosystems to climate change and invasion by exotic plant species. J. Biogeogr. 2006, 33, 145–157. [Google Scholar] [CrossRef]
- Alvarez, M.E.; Cushman, J.H. Community-level consequences of a plant invasion: Effects on three habitats in coastal California. Ecol. Appl. 2002, 12, 1434–1444. [Google Scholar] [CrossRef]
- Cantarello, E.; Newton, A.C. Identifying cost-effective indicators to assess the conservation status of forested habitats in Natura 2000 sites. For. Ecol. Manag. 2008, 256, 815–826. [Google Scholar] [CrossRef]
- La Mela Veca, D.S.; Clementi, G.; Cullotta, S.; Maetzke, F.; Traina, G. Analisi dello stato di conservazione degli habitat Natura 2000 nel Sito di Interesse Comunitario “ITA040005—Monte Cammarata, Contrada Salaci”, Monti Sicani (Sicilia Centro-occidentale). For @—Riv. Di Selvic. Ed Ecol. For. 2006, 3, 222–237. [Google Scholar] [CrossRef]
- Pavone, P.; Spampinato, G.; Tomaselli, V.; Minissale, P.; Costa, R.; Sciandrello, S.; Ronsisvalle, F. Cartografia degli habitat della Direttiva CEE 92/43 nei biotopi della Provincia di Siracusa (Sicilia orientale). Fitosociologia 2007, 44 (Suppl. 1), 183–193. [Google Scholar]
- Aramini, G.; Bernardo, L.; Spampinato, G. (Eds.) Carta Natura; Geografia degli Habitat; Monografia Calabria; Arti Grafiche Cardamone Decollatura (CZ): Decollatura, Italy, 2023; ISBN 9788894601312. Available online: https://www.isprambiente.gov.it/it/servizi/sistema-carta-della-natura/cartografia/carta-della-natura-alla-scala-1-50.000/calabria (accessed on 26 March 2025).
- Quézel, P.; Médail, F. Ecologie et Biogéographie des Forêts du Bassin Méditerranéen; Elsevier: Paris, France, 2003; p. 571. [Google Scholar]
- Bonin, G.; Gamisans, J. Contribution à l’étude des forêts de l’étage supraméditerranéen de l’Italie méridionale. Doc. Phytosoc. 1976, 19–20, 73–88. [Google Scholar]
- Schneider, R.; Sutter, R. Beitrag zur Flora und Vegetation Südkalabriens. Phytocoenologia 1982, 10, 323–373. [Google Scholar] [CrossRef]
- Scelsi, F.; Spampinato, G. Analisi fitosociologica dei boschi a Quercus frainetto della Calabria. Coll. Phytosoc. 1996, 24, 535–547. [Google Scholar]
- Brullo, S.; Scelsi, F.; Spampinato, G. La Vegetazione Dell’aspromonte; Laruffa: Reggio Calabria, Italy, 2001; 370p. [Google Scholar]
- Maiorca, G.; Spampinato, G. La vegetazione della riserva naturale orientata “Valle del Fiume Argentino” (Calabria nord-occidentale). Fitosociologia 1999, 36, 15–60. [Google Scholar]
- Maiorca, G.; Spampinato, G.; Caprio, A. La vegetazione di Monte Mancuso (Calabria centro-occidentale). Fitosociologia 2006, 43, 141–175. [Google Scholar]
- Biondi, E.; Casavecchia, S.; Gigante, D. Contribution to the syntaxonimic knowledge of the Quercus ilex L. woods of the Central European Mediterranean Basin. Fitosociologia 2003, 40, 129–156. [Google Scholar]
- Mercurio, R.; Musarella, C.M.; Spampinato, G. Tipologie Forestali Della Calabria; Youcanprint: Tricase, Italy, 2022; p. 218. ISBN 9791221426786. [Google Scholar]
- Spampinato, G.; Cameriere, P.; Caridi, D.; Crisafulli, A. Carta della biodiversità vegetale del Parco Nazionale dell’Aspromonte. Quad. Bot. Amb. Appl. 2008, 19, 3–36. [Google Scholar]
- Musarella, C.M.; Cano Ortiz, A.; Piñar Fuentes, J.C.; Navas Ureña, J.; Pinto Gomes, C.J.; Quinto Canas, R.; Spampinato, G.; Cano, E. Similarity analysis between species in the Quercus genus in southern Italy based on the fractal dimension. PhytoKeys 2018, 113, 79–95. [Google Scholar] [CrossRef]
- Morabito, A.; Allegrezza, M.; Angiolini, C.; Bagella, S.; Bazan, G.; Bonini, F.; Camilletti, M.; Cannucci, S.; Crisafulli, A.; Desimone, L.; et al. New national and regional Annex I Habitat records: From# 60 to# 82. Plant Sociol. 2023, 60, 51–65. [Google Scholar] [CrossRef]
- Morabito, A.; Musarella, C.M.; Spampinato, G. Diversity and Ecological Assessment of Grasslands Habitat Types: A Case Study in the Calabria Region (Southern Italy). Land 2024, 13, 719. [Google Scholar] [CrossRef]
- Braun-Blanquet, J. Pflanzensoziologie, Grundzüge der Vegetationskunde, 3rd ed.; Springer: Vienna, Austria, 1964. [Google Scholar] [CrossRef]
- Portal to the Flora of Italy. Available online: http://dryades.units.it/floritaly/ (accessed on 20 February 2025).
- Van der Maarel, E. Trasformation of cover-abundance values in phytosociology and its effects on community similarity. Vegetatio 1979, 39, 97–144. [Google Scholar]
- EC/European Commission. Interpretation Manual of European Union Habitats. EUR 28; 2013; pp. 1–144. Available online: https://circabc.europa.eu/ui/group/3f466d71-92a7-49eb-9c63-6cb0fadf29dc/library/37d9e6d9-b7de-42ce-b789-622e9741b68f/details (accessed on 26 March 2025).
- Biondi, E.; Blasi, C.; Burrascano, S.; Casavecchia, S.; Copiz, R.; Del Vico, E.; Galdenzi, D.; Gigante, D.; Lasen, C.; Spampinato, G.; et al. Italian Interpretation Manual of the 92/43/EEC Directive Habitats; Società Botanica Italiana—Ministero dell’Ambiente e della tutela del Territorio e del Mare, Direzione Protezione della Natura: Florence, Italy, 2009; Available online: http://vnr.unipg.it/habitat/ (accessed on 24 June 2024).
- Pignatti, S. Volume 1: Flora d’Italia & Flora Digitale. In Flora d’Italia: In 4 Volumi, 2nd ed.; Edagricole-Edizioni Agricole di New Business Media srl: Milano, Italy, 2017. [Google Scholar]
- Pignatti, S. Volume 2: Flora d’Italia & Flora Digitale. In Flora d’Italia: In 4 Volumi, 2nd ed.; Edagricole-Edizioni Agricole di New Business Media srl: Milano, Italy, 2017. [Google Scholar]
- Pignatti, S. Volume 3: Flora d’Italia & Flora Digitale. In Flora d’Italia: In 4 Volumi, 2nd ed.; Edagricole-Edizioni Agricole di New Business Media srl: Milano, Italy, 2018. [Google Scholar]
- Pignatti, S.; Guarino, R.; La Rosa, M. Volume 4: Flora d’Italia & Flora Digitale. In Flora d’Italia: In 4 Volumi, 2nd ed.; Edagricole-Edizioni Agricole di New Business Media srl: Milano, Italy, 2019. [Google Scholar]
- Shannon, C.E.; Weaver, W. The Mathematical Theory of Communication; University of Illinois Press: Urbana, IL, USA, 1949. [Google Scholar]
- Pielou, E.C. The measurement of diversity in different types of biological collections. J. Theor. Biol. 1966, 13, 131–144. [Google Scholar] [CrossRef]
- Grunewald, R.; Schubert, H. The definition of a new plant diversity index “H′ dune” for assessing human damage on coastal dunes–derived from the Shannon index of entropy H′. Ecol. Indic. 2007, 7, 1–21. [Google Scholar] [CrossRef]
- Biondi, E.; Blasi, C. Prodromo della vegetazione italiana. Ministero dell’Ambiente e della Tutela del Territorio e del Mare. 2015. Available online: www.prodromo-vegetazione-italia.org (accessed on 26 March 2025).
- EEA. List of Pressures and Threats for the Period 2019–2024 with Indicative Crosslinks to WFD and MSFD (Last Updated 05/02/2024). 2025. Available online: https://cdr.eionet.europa.eu/help/habitats_art17 (accessed on 16 May 2025).
- R Core Team. R: A Language and Environment for Statistical Computing, R Foundation for Statistical Computing: Vienna, Austria, 2025. Available online: https://www.R-project.org/ (accessed on 26 March 2025).
- Hammer, Ø.; Harper, D.A.T.; Ryan, P.D. Past: Paleontological Statistics Software Package for Education and Data Analysis. Palaeontol. Electron. 2001, 4, 1–9. [Google Scholar]
- McGarigal, K.; McComb, W.C. Relationships between landscape structure and breeding birds in the Oregon Coast range. Ecol. Monogr. 1995, 65, 235–260. [Google Scholar] [CrossRef]
- Tischendorf, L. Can landscape indices predict ecological processes consistently? Landsc. Ecol. 2001, 16, 235–254. [Google Scholar] [CrossRef]
- Luck, M.; Wu, J. A gradient analysis of urban landscape pattern: A case study from the Phoenix metropolitan region, Arizona, USA. Landsc. Ecol. 2002, 17, 327–339. [Google Scholar] [CrossRef]
- McGarigal, K.; Ene, E. Fragstats: Spatial Pattern Analysis Program for Categorical Maps, Version 4.2; Computer Software Program Produced by the Authors at the University of Massachusetts: Amherst, MA, USA, 2015. Available online: https://www.fragstats.org (accessed on 27 March 2025).
- Ripple, W.J.; Bradshaw, G.A.; Spies, T.A. Measuring landscape pattern in the Cascade Range of Oregon, USA. Biol. Conserv. 1991, 57, 73–88. [Google Scholar] [CrossRef]
- Forman, R.T.T.; Godron, M. Patches and structural components for a landscape ecology. Bioscience 1981, 31, 733–740. [Google Scholar] [CrossRef]
- Acácio, V.; Dias, F.S.; Catry, F.X.; Rocha, M.; Moreira, F. Landscape dynamics in Mediterranean oak forests under global change: Understanding the role of anthropogenic and environmental drivers across forest types. Glob. Change Biol. 2017, 23, 1199–1217. [Google Scholar] [CrossRef]
- Gülçin, D.; Yılmaz, T. Evaluation of forest fragmentation with particular reference to landscape-based ecological assessment and wildlife conservation. Turk. J. For. 2020, 21, 84–93. [Google Scholar] [CrossRef][Green Version]
- Hernando, A.; Velázquez, J.; Valbuena, R.; Legrand, M.; García-Abril, A. Influence of the resolution of forest cover maps in evaluating fragmentation and connectivity to assess habitat conservation status. Ecol. Indic. 2017, 79, 295–302. [Google Scholar] [CrossRef]
- Rodwell, J.S.; Evans, D.; Schaminée, J.H. Phytosociological relationships in European Union policy-related habitat classifications. Rend. Lincei-Sci. Fis. Nat. 2018, 29, 237–249. [Google Scholar] [CrossRef]
- Di Pietro, R.; Conte, A.L.; Di Marzio, P.; Gianguzzi, L.; Spampinato, G.; Caldarella, O.; Fortini, P.A. Multivariate morphometric analysis of diagnostic traits in southern Italy and Sicily pubescent oaks. Folia Geobot. 2020, 55, 163–183. [Google Scholar] [CrossRef]
- Selvi, F.; Valleri, M. Cork oak woodlands in the north Tyrrhenian area (Italy): Distribution and plant species diversity of a relict forest ecosystem. Biodivers. Conserv. 2012, 21, 3061–3078. [Google Scholar] [CrossRef]
- Biondi, E.; Lasen, C.; Spampinato, G.; Zivkovic, L.; Angelini, P. Habitat. In Specie e Habitat di Interesse Comunitario in Italia: Distribuzione, Stato di Conservazione e Trend; Genovesi, P., Angelini, P., Bianchi, E., Dupré, E., Ercole, S., Giacanelli, V., Ronchi, F., Stoch, F., Eds.; Serie Rapporti 194/2014c; ISPRA: Roma, Italy, 2014; pp. 107–110. ISBN 978-88-448-0644-6. [Google Scholar]
- Touza, J.; Dehnen-Schmutz, K.; Jones, G. Economic Analysis of Invasive Species Policies. In Biological Invasions. Ecological Studies (Analysis and Synthesis); Nentwig, W., Ed.; Springer: Berlin/Heidelberg, Germany, 2008; p. 193. [Google Scholar]
- Montecchiari, S.; Tesei, G.; Allegrezza, M. Effects of Robinia pseudoacacia coverage on diversity and environmental conditions of central-northern Italian Quercus pubescens sub-Mediterranean forests (Habitat code 91AA*): A threshold assessment. Ann. Bot. (Rome) 2020, 10, 33–54. [Google Scholar] [CrossRef]
- Pérez-Ramos, I.M.; Zavala, M.A.; Maranón, T.; Díaz-Villa, M.D.; Valladares, F. Dynamics of understorey herbaceous plant diversity following shrub clearing of cork oak forests: A fiveyear study. For. Ecol. Manag. 2008, 255, 3242–3253. [Google Scholar] [CrossRef]
- Dormann, C.F.; Bagnara, M.; Boch, S.; Hinderling, J.; Janeiro-Otero, A.; Schäfer, D.; Schall, P.; Hartig, F. Plant species richness increases with light availability, but not variability, in temperate forests understorey. BMC Ecol. 2020, 20, 43. [Google Scholar] [CrossRef]
- Chytrý, M.; Tichý, L.; Roleček, J. Local and regional patterns of species richness in Central European vegetation types along the pH/calcium gradient. Folia Geobot. 2003, 38, 429–442. [Google Scholar] [CrossRef]
- Ballesteros, M.; Vitovcova, K.; Řehounková, K.; Müllerová, A.; Janečková, P.; Pospíšilová, P.; Prach, K. Alien species in vegetation succession: Participation, temporal trends and determining factors in various central European series. Biol. Invasions 2021, 23, 3435–3445. [Google Scholar] [CrossRef]
- Mogîldea, D.; Biță-Nicolae, C. Ruderal Plant Diversity as a Driver for Urban Green Space Sustainability. Urban Sci. 2024, 8, 159. [Google Scholar] [CrossRef]
- Rivas, C.A.; Guerrero-Casado, J.; Navarro-Cerrillo, R.M. A new combined index to assess the fragmentation status of a forest patch based on its size, shape complexity, and isolation. Diversity 2022, 14, 896. [Google Scholar] [CrossRef]
- Ewers, R.M.; Thorpe, S.; Didham, R.K. Synergistic Interactions between Edge and Area Effects in a Heavily Fragmented Landscape. Ecology 2007, 88, 96–106. [Google Scholar] [CrossRef]
- Ercole, S.; Angelini, P.; Carnevali, L.; Casella, L.; Giacanelli, V.; Grignetti, A.; Genovesi, P. Rapporti Direttive Natura (2013–2018). In Sintesi Dello Stato di Conservazione Delle Specie e Degli Habitat di Interesse Comunitario e Delle Azioni di Contrasto Alle Specie Esotiche di Rilevanza Unionale in Italia; Serie Rapporti 349/2021; ISPRA: Roma, Italy, 2021. [Google Scholar]
- Southworth, J.; Munroeb, D.; Nagendra, H. Land covers change and landscape fragmentation comparing the utility of continuous and discrete analyses for a western Honduras region. Agric. Ecosyst. Environ. 2004, 101, 185–205. [Google Scholar] [CrossRef]
- Abdullah, S.A.; Nakagoshi, N. Forest fragmentation and its correlation to human land use change in the state of Selangor, peninsular Malaysia. For. Ecol. Manag. 2007, 241, 39–48. [Google Scholar] [CrossRef]
- Brosofske, K.D.; Chen, J.; Crow, T.R.; Saunders, S.C. Vegetation responses to landscape structure at multiple scales across a Northern Wisconsin, USA, pine barrens landscape. Plant Ecol. 1999, 143, 203–218. [Google Scholar] [CrossRef]
- Butchart, S.H.; Clarke, M.; Smith, R.J.; Sykes, R.E.; Scharlemann, J.P.; Harfoot, M.; Buchanan, G.M.; Angulo, A.; Balmford, A.; Bertzky, B.; et al. Shortfalls and solutions for meeting national and global conservation area targets. Conserv. Lett. 2015, 8, 329–337. [Google Scholar] [CrossRef]
- Seidler, R. Patterns of Biodiversity Change in Anthropogenically Altered Forests; Elsevier: Amsterdam, The Netherlands, 2017. [Google Scholar] [CrossRef]
- Petrášová-Šibíková, M.; Bacigál, T.; Jarolímek, I. Fragmentation of hardwood floodplain forests–how does it affect species composition? Community Ecol. 2017, 18, 97–108. [Google Scholar] [CrossRef]
- Pyšek, P.; Bacher, S.; Chytrý, M.; Jarošík, V.; Wild, J.; CelestiGrapow, L.; Gassó, N.; Kenis, M.; Lambdon, P.W.; Nentwig, W.; et al. Contrasting patterns in the invasions of European terrestrial and freshwater habitats by alien plants, insects and vertebrates. Glob. Ecol. Biogeogr. 2010, 19, 317–331. [Google Scholar] [CrossRef]
- European Union. Regulation (EU) No 1143/2014 of the European Parliament and of the Council of 22 October 2014 on the Prevention and Management of the Introduction and Spread of Invasive Alien Species, Official Journal of the European Union, L 317/35, 4 November 2014, pp. 35–55. Available online: https://eur-lex.europa.eu/eli/reg/2014/1143/oj/eng (accessed on 26 March 2025).
- Regione Calabria, Civil Protection Department. Regional Plan for Prevention, Fighting and Fight Against Forest Fires (AIB) 2024–2026. Approved by Resolution of the Regional Council no. 123 of 15/01/2024. Available online: https://www.regione.calabria.it/wp-content/uploads/2025/04/PianoAIB2025-2.pdf (accessed on 27 March 2025).
Disclaimer/Publisher’s Note: The statements, opinions and data contained in all publications are solely those of the individual author(s) and contributor(s) and not of MDPI and/or the editor(s). MDPI and/or the editor(s) disclaim responsibility for any injury to people or property resulting from any ideas, methods, instructions or products referred to in the content. |
© 2025 by the authors. Licensee MDPI, Basel, Switzerland. This article is an open access article distributed under the terms and conditions of the Creative Commons Attribution (CC BY) license (https://creativecommons.org/licenses/by/4.0/).