

Climate-Driven Shifts in the Distribution of Valonia Oak from the Last Glaciation to the Antropocene

 ,
,  , , ,
, , ,  , and
, and 
Abstract
1. Introduction
2. Material and Methods
2.1. Species and Occurrence Records
2.2. Environmental Layers
2.3. MaxEnt Algorithm
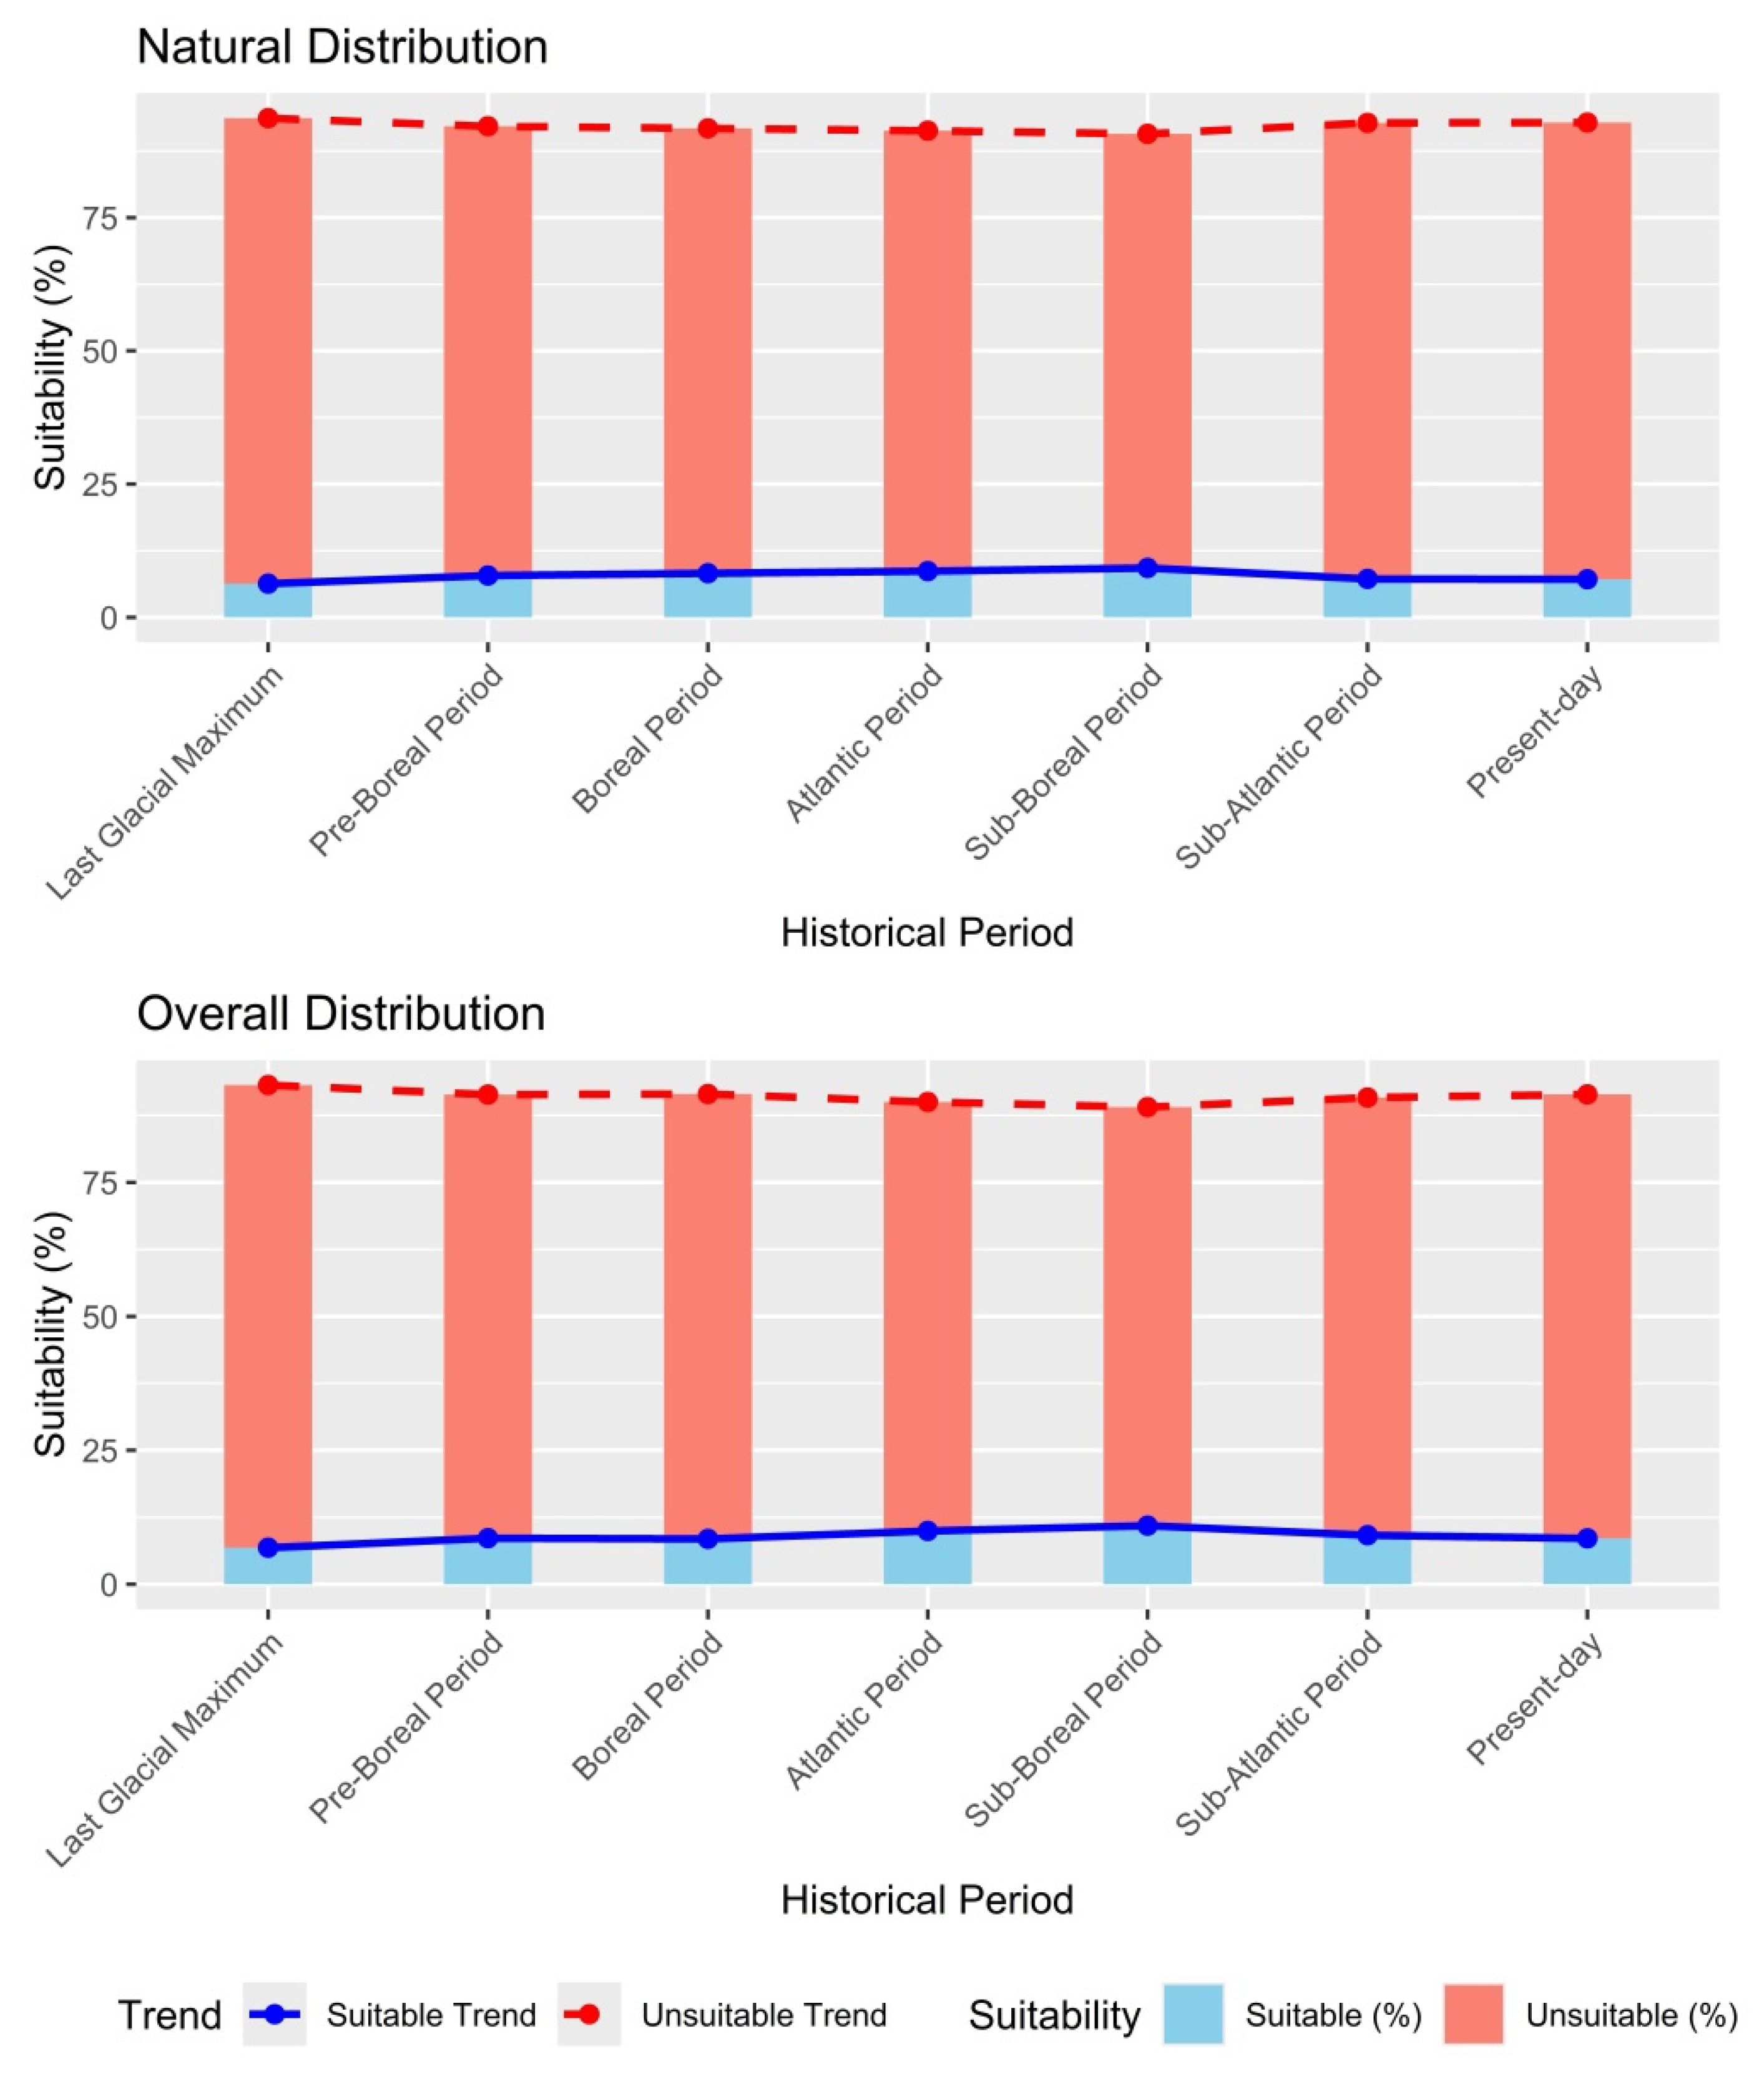
3. Results
4. Discussion
5. Conclusions
Author Contributions
Funding
Data Availability Statement
Acknowledgments
Conflicts of Interest
Appendix A

| Statistic | auc.train | cbi.train | auc.val | auc.diff | cbi.val | or.mtp | or.10p |
|---|---|---|---|---|---|---|---|
| emp.mean | 0.97258 | 0.997 | 0.968683 | 0.005924 | 0.925 | 0.005334 | 0.12027 |
| emp.sd | NA | NA | 0.007724 | 0.007194 | 0.029758 | 0.011247 | 0.052882 |
| null.mean | 0.606 | 0.958 | 0.739802 | 0.149249 | 0.722052 | 0.008072 | 0.079539 |
| null.sd | 0.0118 | 0.045938 | 0.021306 | 0.014759 | 0.116549 | 0.020024 | 0.031473 |
| zscore | 31.09 | 0.848534 | 10.74234 | −9.71087 | 1.741315 | −0.13671 | 1.294164 |
| p value | 0 | 0.19807 | 3.22 × 10⁻²⁷ | 1.36 × 10⁻²² | 0.040814 | 0.445629 | 0.902196 |
| fc | rm | tune.args | auc.train | cbi.train | auc.diff.avg | auc.diff.sd | auc.val.avg | auc.val.sd | cbi.val.avg | cbi.val.sd | or.10p.avg | or.10p.sd | or.mtp.avg | or.mtp.sd | AICc | delta.AICc | w.AIC | ncoef | |
|---|---|---|---|---|---|---|---|---|---|---|---|---|---|---|---|---|---|---|---|
| 1 | L | 0.5 | fc.L_rm.0.5 | 0.89 | 0.86 | 0 | 0 | 0.9 | 0 | 0.8 | 0.1 | 0.102 | 0.045 | 0.002 | 0.009 | 11963 | 604.052645 | 6.77E-132 | 8 |
| 2 | LQ | 0.5 | fc.LQ_rm.0.5 | 0.92 | 0.99 | 0 | 0 | 0.9 | 0 | 0.8 | 0.1 | 0.104 | 0.057 | 0.002 | 0.009 | 11770.8 | 411.8414 | 3.71E-90 | 15 |
| 3 | H | 0.5 | fc.H_rm.0.5 | 0.95 | 0.99 | 0 | 0 | 0.9 | 0 | 0.9 | 0 | 0.111 | 0.045 | 0.005 | 0.018 | 11471.8 | 112.899095 | 3.04E-25 | 41 |
| 4 | LQH | 0.5 | fc.LQH_rm.0.5 | 0.95 | 0.99 | 0 | 0 | 0.9 | 0 | 0.9 | 0.1 | 0.116 | 0.05 | 0.005 | 0.018 | 11493.4 | 134.491631 | 6.23E-30 | 49 |
| 5 | LQHP | 0.5 | fc.LQHP_rm.0.5 | 0.96 | 0.98 | 0 | 0 | 1 | 0 | 0.9 | 0.1 | 0.118 | 0.053 | 0.005 | 0.018 | 11358.9 | 0 | 0.997933683 | 54 |
| 6 | LQHPT | 0.5 | fc.LQHPT_rm.0.5 | 0.97 | 1 | 0 | 0 | 1 | 0 | 0.9 | 0 | 0.137 | 0.065 | 0.005 | 0.018 | 11416.1 | 57.134003 | 3.91E-13 | 94 |
| 7 | L | 1 | fc.L_rm.1 | 0.89 | 0.84 | 0 | 0 | 0.9 | 0 | 0.8 | 0.1 | 0.099 | 0.047 | 0.002 | 0.009 | 11964 | 605.071934 | 4.07E-132 | 8 |
| 8 | LQ | 1 | fc.LQ_rm.1 | 0.92 | 0.96 | 0 | 0 | 0.9 | 0 | 0.8 | 0.1 | 0.1 | 0.055 | 0.002 | 0.009 | 11796.8 | 437.8538 | 8.32E-96 | 14 |
| 9 | H | 1 | fc.H_rm.1 | 0.95 | 0.96 | 0 | 0 | 0.9 | 0 | 0.8 | 0.1 | 0.116 | 0.046 | 0.005 | 0.018 | 11493.3 | 134.41247 | 6.48E-30 | 36 |
| 10 | LQH | 1 | fc.LQH_rm.1 | 0.95 | 0.96 | 0 | 0 | 0.9 | 0 | 0.8 | 0.1 | 0.109 | 0.042 | 0.005 | 0.018 | 11478.8 | 119.887599 | 9.24E-27 | 31 |
| 11 | LQHP | 1 | fc.LQHP_rm.1 | 0.96 | 0.99 | 0 | 0 | 1 | 0 | 0.9 | 0.1 | 0.111 | 0.05 | 0.005 | 0.018 | 11371.3 | 12.3941379 | 0.002031182 | 40 |
| 12 | LQHPT | 1 | fc.LQHPT_rm.1 | 0.96 | 1 | 0 | 0 | 1 | 0 | 0.9 | 0.1 | 0.126 | 0.06 | 0.005 | 0.018 | 11379.5 | 20.6148711 | 3.33E-05 | 51 |
| 13 | L | 1.5 | fc.L_rm.1.5 | 0.89 | 0.85 | 0 | 0 | 0.9 | 0 | 0.8 | 0.1 | 0.099 | 0.047 | 0.002 | 0.009 | 11963.6 | 604.68469 | 4.94E-132 | 7 |
| 14 | LQ | 1.5 | fc.LQ_rm.1.5 | 0.92 | 0.94 | 0 | 0 | 0.9 | 0 | 0.8 | 0.1 | 0.102 | 0.054 | 0.002 | 0.009 | 11817.2 | 458.272705 | 3.07E-100 | 13 |
| 15 | H | 1.5 | fc.H_rm.1.5 | 0.95 | 0.95 | 0 | 0 | 0.9 | 0 | 0.8 | 0.1 | 0.106 | 0.043 | 0.005 | 0.018 | 11494.7 | 135.738074 | 3.34E-30 | 23 |
| 16 | LQH | 1.5 | fc.LQH_rm.1.5 | 0.95 | 0.96 | 0 | 0 | 0.9 | 0 | 0.9 | 0.1 | 0.109 | 0.044 | 0.005 | 0.018 | 11492 | 133.113644 | 1.24E-29 | 28 |
| 17 | LQHP | 1.5 | fc.LQHP_rm.1.5 | 0.96 | 1 | 0 | 0 | 1 | 0 | 0.9 | 0.1 | 0.116 | 0.044 | 0.005 | 0.018 | 11388.8 | 29.9164045 | 3.18E-07 | 35 |
| 18 | LQHPT | 1.5 | fc.LQHPT_rm.1.5 | 0.96 | 1 | 0 | 0 | 1 | 0 | 0.9 | 0.1 | 0.128 | 0.057 | 0.005 | 0.018 | 11385.7 | 26.8138453 | 1.50E-06 | 39 |
| 19 | L | 2 | fc.L_rm.2 | 0.88 | 0.84 | 0 | 0 | 0.9 | 0 | 0.8 | 0.1 | 0.099 | 0.047 | 0.002 | 0.009 | 11965.9 | 606.92851 | 1.61E-132 | 7 |
| 20 | LQ | 2 | fc.LQ_rm.2 | 0.91 | 0.95 | 0 | 0 | 0.9 | 0 | 0.8 | 0.1 | 0.1 | 0.051 | 0.002 | 0.009 | 11846.2 | 487.284341 | 1.54E-106 | 13 |
| 21 | H | 2 | fc.H_rm.2 | 0.95 | 0.94 | 0 | 0 | 0.9 | 0 | 0.8 | 0.1 | 0.106 | 0.043 | 0.005 | 0.018 | 11517.4 | 158.442845 | 3.92E-35 | 22 |
| 22 | LQH | 2 | fc.LQH_rm.2 | 0.95 | 0.98 | 0 | 0 | 0.9 | 0 | 0.8 | 0.1 | 0.114 | 0.047 | 0.005 | 0.018 | 11501.8 | 142.837769 | 9.60E-32 | 24 |
| 23 | LQHP | 2 | fc.LQHP_rm.2 | 0.96 | 0.99 | 0 | 0 | 1 | 0 | 0.9 | 0.1 | 0.111 | 0.045 | 0.005 | 0.018 | 11422.1 | 63.2112431 | 1.87E-14 | 35 |
| 24 | LQHPT | 2 | fc.LQHPT_rm.2 | 0.96 | 0.99 | 0 | 0 | 1 | 0 | 0.9 | 0 | 0.121 | 0.056 | 0.005 | 0.018 | 11417.1 | 58.1541786 | 2.35E-13 | 38 |
| 25 | L | 2.5 | fc.L_rm.2.5 | 0.88 | 0.85 | 0 | 0 | 0.9 | 0 | 0.8 | 0.1 | 0.102 | 0.045 | 0.002 | 0.009 | 11968.6 | 609.677201 | 4.07E-133 | 7 |
| 26 | LQ | 2.5 | fc.LQ_rm.2.5 | 0.91 | 0.93 | 0 | 0 | 0.9 | 0 | 0.8 | 0.1 | 0.102 | 0.05 | 0.002 | 0.009 | 11857.3 | 498.361225 | 6.04E-109 | 11 |
| 27 | H | 2.5 | fc.H_rm.2.5 | 0.95 | 0.94 | 0 | 0 | 0.9 | 0 | 0.8 | 0.1 | 0.109 | 0.042 | 0.005 | 0.018 | 11533.8 | 174.820333 | 1.09E-38 | 22 |
| 28 | LQH | 2.5 | fc.LQH_rm.2.5 | 0.95 | 0.99 | 0 | 0 | 0.9 | 0 | 0.8 | 0.1 | 0.114 | 0.049 | 0.005 | 0.018 | 11517.8 | 158.867516 | 3.17E-35 | 24 |
| 29 | LQHP | 2.5 | fc.LQHP_rm.2.5 | 0.95 | 0.99 | 0 | 0 | 1 | 0 | 0.9 | 0.1 | 0.107 | 0.047 | 0.005 | 0.018 | 11445.5 | 86.5257759 | 1.62E-19 | 32 |
| 30 | LQHPT | 2.5 | fc.LQHPT_rm.2.5 | 0.95 | 0.99 | 0 | 0 | 1 | 0 | 0.9 | 0 | 0.116 | 0.057 | 0.005 | 0.018 | 11431.9 | 72.9265439 | 1.46E-16 | 32 |
| 31 | L | 3 | fc.L_rm.3 | 0.88 | 0.86 | 0 | 0 | 0.9 | 0 | 0.8 | 0.1 | 0.104 | 0.051 | 0.002 | 0.009 | 11971.9 | 612.937067 | 7.97E-134 | 7 |
| 32 | LQ | 3 | fc.LQ_rm.3 | 0.91 | 0.93 | 0 | 0 | 0.9 | 0 | 0.8 | 0.1 | 0.104 | 0.051 | 0.002 | 0.009 | 11873.2 | 514.233289 | 2.16E-112 | 11 |
| 33 | H | 3 | fc.H_rm.3 | 0.95 | 0.93 | 0 | 0 | 0.9 | 0 | 0.8 | 0.1 | 0.114 | 0.043 | 0.007 | 0.02 | 11548.3 | 189.397107 | 7.45E-42 | 21 |
| 34 | LQH | 3 | fc.LQH_rm.3 | 0.95 | 0.97 | 0 | 0 | 0.9 | 0 | 0.8 | 0.1 | 0.116 | 0.053 | 0.002 | 0.009 | 11538.5 | 179.571297 | 1.01E-39 | 26 |
| 35 | LQHP | 3 | fc.LQHP_rm.3 | 0.95 | 0.99 | 0 | 0 | 0.9 | 0 | 0.9 | 0.1 | 0.111 | 0.051 | 0.005 | 0.018 | 11474.2 | 115.249209 | 9.40E-26 | 32 |
| 36 | LQHPT | 3 | fc.LQHPT_rm.3 | 0.95 | 0.99 | 0 | 0 | 0.9 | 0 | 0.9 | 0.1 | 0.121 | 0.063 | 0.005 | 0.018 | 11467.6 | 108.639804 | 2.56E-24 | 35 |
| 37 | L | 3.5 | fc.L_rm.3.5 | 0.88 | 0.86 | 0 | 0 | 0.9 | 0 | 0.8 | 0.1 | 0.102 | 0.05 | 0.002 | 0.009 | 11975.6 | 616.677446 | 1.23E-134 | 7 |
| 38 | LQ | 3.5 | fc.LQ_rm.3.5 | 0.9 | 0.92 | 0 | 0 | 0.9 | 0 | 0.8 | 0.1 | 0.104 | 0.051 | 0.002 | 0.009 | 11890.4 | 531.509539 | 3.83E-116 | 11 |
| 39 | H | 3.5 | fc.H_rm.3.5 | 0.95 | 0.97 | 0 | 0 | 0.9 | 0 | 0.8 | 0.1 | 0.107 | 0.045 | 0.002 | 0.009 | 11574.7 | 215.766217 | 1.40E-47 | 25 |
| 40 | LQH | 3.5 | fc.LQH_rm.3.5 | 0.95 | 0.96 | 0 | 0 | 0.9 | 0 | 0.8 | 0.1 | 0.111 | 0.052 | 0.002 | 0.009 | 11548.3 | 189.354024 | 7.61E-42 | 23 |
| 41 | LQHP | 3.5 | fc.LQHP_rm.3.5 | 0.95 | 0.99 | 0 | 0 | 0.9 | 0 | 0.9 | 0.1 | 0.111 | 0.051 | 0.002 | 0.009 | 11499.1 | 140.182982 | 3.62E-31 | 30 |
| 42 | LQHPT | 3.5 | fc.LQHPT_rm.3.5 | 0.95 | 0.99 | 0 | 0 | 0.9 | 0 | 0.9 | 0.1 | 0.121 | 0.06 | 0.005 | 0.018 | 11484.1 | 125.185315 | 6.54E-28 | 30 |
| 43 | L | 4 | fc.L_rm.4 | 0.88 | 0.86 | 0 | 0 | 0.9 | 0 | 0.8 | 0.1 | 0.102 | 0.049 | 0.002 | 0.009 | 11979.8 | 620.900028 | 1.49E-135 | 7 |
| 44 | LQ | 4 | fc.LQ_rm.4 | 0.9 | 0.92 | 0 | 0 | 0.9 | 0 | 0.8 | 0.1 | 0.104 | 0.051 | 0.002 | 0.009 | 11909 | 550.103872 | 3.51E-120 | 11 |
| 45 | H | 4 | fc.H_rm.4 | 0.95 | 0.98 | 0 | 0 | 0.9 | 0 | 0.8 | 0.1 | 0.111 | 0.052 | 0.002 | 0.009 | 11579.4 | 220.438626 | 1.35E-48 | 20 |
| 46 | LQH | 4 | fc.LQH_rm.4 | 0.95 | 0.96 | 0 | 0 | 0.9 | 0 | 0.8 | 0.1 | 0.114 | 0.056 | 0.002 | 0.009 | 11555.8 | 196.829934 | 1.81E-43 | 19 |
| 47 | LQHP | 4 | fc.LQHP_rm.4 | 0.95 | 0.99 | 0 | 0 | 0.9 | 0 | 0.9 | 0.1 | 0.116 | 0.057 | 0.002 | 0.009 | 11514.6 | 155.620461 | 1.61E-34 | 26 |
| 48 | LQHPT | 4 | fc.LQHPT_rm.4 | 0.95 | 0.98 | 0 | 0 | 0.9 | 0 | 0.9 | 0.1 | 0.118 | 0.06 | 0.002 | 0.009 | 11499.9 | 140.925814 | 2.50E-31 | 28 |
| 49 | L | 4.5 | fc.L_rm.4.5 | 0.88 | 0.85 | 0 | 0 | 0.9 | 0 | 0.8 | 0.1 | 0.102 | 0.049 | 0.002 | 0.009 | 11984.7 | 625.810539 | 1.28E-136 | 7 |
| 50 | LQ | 4.5 | fc.LQ_rm.4.5 | 0.9 | 0.91 | 0 | 0 | 0.9 | 0 | 0.8 | 0.1 | 0.1 | 0.054 | 0.002 | 0.009 | 11928.9 | 570.007312 | 1.67E-124 | 11 |
| 51 | H | 4.5 | fc.H_rm.4.5 | 0.95 | 0.99 | 0 | 0 | 0.9 | 0 | 0.8 | 0.1 | 0.116 | 0.05 | 0.002 | 0.009 | 11584.7 | 225.737135 | 9.57E-50 | 17 |
| 52 | LQH | 4.5 | fc.LQH_rm.4.5 | 0.94 | 0.97 | 0 | 0 | 0.9 | 0 | 0.8 | 0.1 | 0.114 | 0.064 | 0.002 | 0.009 | 11572.9 | 213.9275 | 3.51E-47 | 20 |
| 53 | LQHP | 4.5 | fc.LQHP_rm.4.5 | 0.95 | 0.98 | 0 | 0 | 0.9 | 0 | 0.8 | 0.1 | 0.114 | 0.064 | 0.002 | 0.009 | 11532.6 | 173.677721 | 1.93E-38 | 25 |
| 54 | LQHPT | 4.5 | fc.LQHPT_rm.4.5 | 0.95 | 0.98 | 0 | 0 | 0.9 | 0 | 0.8 | 0.1 | 0.116 | 0.055 | 0.002 | 0.009 | 11512.8 | 153.887739 | 3.83E-34 | 26 |
| 55 | L | 5 | fc.L_rm.5 | 0.88 | 0.86 | 0 | 0 | 0.9 | 0 | 0.8 | 0.1 | 0.104 | 0.05 | 0.002 | 0.009 | 11989.6 | 630.668208 | 1.13E-137 | 7 |
| 56 | LQ | 5 | fc.LQ_rm.5 | 0.89 | 0.91 | 0 | 0 | 0.9 | 0 | 0.8 | 0.1 | 0.102 | 0.05 | 0.002 | 0.009 | 11942.5 | 583.59591 | 1.87E-127 | 9 |
| 57 | H | 5 | fc.H_rm.5 | 0.95 | 0.99 | 0 | 0 | 0.9 | 0 | 0.8 | 0.1 | 0.116 | 0.057 | 0.002 | 0.009 | 11597.6 | 238.718436 | 1.45E-52 | 18 |
| 58 | LQH | 5 | fc.LQH_rm.5 | 0.94 | 0.97 | 0 | 0 | 0.9 | 0 | 0.8 | 0.1 | 0.111 | 0.069 | 0.002 | 0.009 | 11579.6 | 220.631836 | 1.23E-48 | 17 |
| 59 | LQHP | 5 | fc.LQHP_rm.5 | 0.95 | 0.98 | 0 | 0 | 0.9 | 0 | 0.8 | 0.1 | 0.114 | 0.061 | 0.002 | 0.009 | 11540.3 | 181.353374 | 4.16E-40 | 22 |
| 60 | LQHPT | 5 | fc.LQHPT_rm.5 | 0.95 | 0.98 | 0 | 0 | 0.9 | 0 | 0.8 | 0.1 | 0.114 | 0.051 | 0.002 | 0.009 | 11519 | 160.07979 | 1.73E-35 | 23 |
| 61 | L | 5.5 | fc.L_rm.5.5 | 0.87 | 0.86 | 0 | 0 | 0.9 | 0 | 0.8 | 0.1 | 0.106 | 0.052 | 0.002 | 0.009 | 11995.1 | 636.182211 | 7.14E-139 | 7 |
| 62 | LQ | 5.5 | fc.LQ_rm.5.5 | 0.89 | 0.9 | 0 | 0 | 0.9 | 0 | 0.8 | 0.1 | 0.099 | 0.049 | 0.002 | 0.009 | 11953.4 | 594.479681 | 8.12E-130 | 9 |
| 63 | H | 5.5 | fc.H_rm.5.5 | 0.95 | 0.99 | 0 | 0 | 0.9 | 0 | 0.8 | 0.1 | 0.123 | 0.057 | 0.002 | 0.009 | 11611.3 | 252.364681 | 1.58E-55 | 18 |
| 64 | LQH | 5.5 | fc.LQH_rm.5.5 | 0.94 | 0.96 | 0 | 0 | 0.9 | 0 | 0.8 | 0.1 | 0.114 | 0.073 | 0.002 | 0.009 | 11584.3 | 225.369422 | 1.15E-49 | 15 |
| 65 | LQHP | 5.5 | fc.LQHP_rm.5.5 | 0.95 | 0.98 | 0 | 0 | 0.9 | 0 | 0.8 | 0 | 0.116 | 0.064 | 0.002 | 0.009 | 11550.8 | 191.881941 | 2.15E-42 | 21 |
| 66 | LQHPT | 5.5 | fc.LQHPT_rm.5.5 | 0.95 | 0.97 | 0 | 0 | 0.9 | 0 | 0.8 | 0.1 | 0.116 | 0.053 | 0.002 | 0.009 | 11525.9 | 166.972213 | 5.52E-37 | 20 |
| 67 | L | 6 | fc.L_rm.6 | 0.87 | 0.87 | 0 | 0 | 0.9 | 0 | 0.8 | 0.1 | 0.104 | 0.058 | 0.002 | 0.009 | 12001.1 | 642.129037 | 3.65E-140 | 7 |
| 68 | LQ | 6 | fc.LQ_rm.6 | 0.89 | 0.9 | 0 | 0 | 0.9 | 0 | 0.8 | 0.1 | 0.1 | 0.054 | 0.002 | 0.009 | 11962.3 | 603.323258 | 9.75E-132 | 8 |
| 69 | H | 6 | fc.H_rm.6 | 0.94 | 0.98 | 0 | 0 | 0.9 | 0 | 0.8 | 0.1 | 0.123 | 0.062 | 0.002 | 0.009 | 11625.4 | 266.500284 | 1.35E-58 | 18 |
| 70 | LQH | 6 | fc.LQH_rm.6 | 0.94 | 0.96 | 0 | 0 | 0.9 | 0 | 0.8 | 0.1 | 0.114 | 0.068 | 0.002 | 0.009 | 11595.8 | 236.851533 | 3.69E-52 | 16 |
| 71 | LQHP | 6 | fc.LQHP_rm.6 | 0.95 | 0.98 | 0 | 0 | 0.9 | 0 | 0.8 | 0 | 0.111 | 0.062 | 0.002 | 0.009 | 11557 | 198.054785 | 9.82E-44 | 18 |
| 72 | LQHPT | 6 | fc.LQHPT_rm.6 | 0.95 | 0.97 | 0 | 0 | 0.9 | 0 | 0.8 | 0.1 | 0.118 | 0.057 | 0.002 | 0.009 | 11541.9 | 182.943273 | 1.88E-40 | 21 |
| 73 | L | 6.5 | fc.L_rm.6.5 | 0.87 | 0.87 | 0 | 0 | 0.9 | 0 | 0.8 | 0.1 | 0.104 | 0.058 | 0.002 | 0.009 | 12007.6 | 648.685285 | 1.38E-141 | 7 |
| 74 | LQ | 6.5 | fc.LQ_rm.6.5 | 0.88 | 0.9 | 0 | 0 | 0.9 | 0 | 0.8 | 0.1 | 0.111 | 0.056 | 0.002 | 0.009 | 11973.7 | 614.720571 | 3.27E-134 | 8 |
| 75 | H | 6.5 | fc.H_rm.6.5 | 0.94 | 0.99 | 0 | 0 | 0.9 | 0 | 0.8 | 0.1 | 0.111 | 0.063 | 0.002 | 0.009 | 11642.2 | 283.256195 | 3.10E-62 | 19 |
| 76 | LQH | 6.5 | fc.LQH_rm.6.5 | 0.94 | 0.97 | 0 | 0 | 0.9 | 0 | 0.8 | 0.1 | 0.116 | 0.072 | 0.002 | 0.009 | 11601.9 | 242.919735 | 1.78E-53 | 15 |
| 77 | LQHP | 6.5 | fc.LQHP_rm.6.5 | 0.95 | 0.98 | 0 | 0 | 0.9 | 0 | 0.8 | 0.1 | 0.116 | 0.067 | 0.002 | 0.009 | 11569.4 | 210.485703 | 1.96E-46 | 18 |
| 78 | LQHPT | 6.5 | fc.LQHPT_rm.6.5 | 0.95 | 0.97 | 0 | 0 | 0.9 | 0 | 0.8 | 0.1 | 0.118 | 0.057 | 0.002 | 0.009 | 11553.6 | 194.635025 | 5.43E-43 | 20 |
| 79 | L | 7 | fc.L_rm.7 | 0.87 | 0.88 | 0 | 0 | 0.9 | 0 | 0.8 | 0.1 | 0.102 | 0.059 | 0.002 | 0.009 | 12014.1 | 655.189262 | 5.33E-143 | 7 |
| 80 | LQ | 7 | fc.LQ_rm.7 | 0.88 | 0.89 | 0 | 0 | 0.9 | 0 | 0.8 | 0.1 | 0.102 | 0.059 | 0.002 | 0.009 | 11985.4 | 626.478288 | 9.14E-137 | 8 |
| 81 | H | 7 | fc.H_rm.7 | 0.94 | 0.99 | 0 | 0 | 0.9 | 0 | 0.8 | 0.1 | 0.107 | 0.066 | 0.002 | 0.009 | 11656.5 | 297.52596 | 2.47E-65 | 19 |
| 82 | LQH | 7 | fc.LQH_rm.7 | 0.94 | 0.97 | 0 | 0 | 0.9 | 0 | 0.8 | 0.1 | 0.118 | 0.074 | 0.002 | 0.009 | 11610.6 | 251.632562 | 2.28E-55 | 15 |
| 83 | LQHP | 7 | fc.LQHP_rm.7 | 0.94 | 0.98 | 0 | 0 | 0.9 | 0 | 0.8 | 0.1 | 0.118 | 0.069 | 0.002 | 0.009 | 11584.4 | 225.485799 | 1.09E-49 | 19 |
| 84 | LQHPT | 7 | fc.LQHPT_rm.7 | 0.95 | 0.97 | 0 | 0 | 0.9 | 0 | 0.8 | 0.1 | 0.121 | 0.055 | 0.002 | 0.009 | 11566.6 | 207.630951 | 8.18E-46 | 20 |
| 85 | L | 7.5 | fc.L_rm.7.5 | 0.86 | 0.86 | 0 | 0 | 0.9 | 0 | 0.8 | 0.1 | 0.1 | 0.055 | 0.002 | 0.009 | 12019 | 660.057611 | 4.67E-144 | 6 |
| 86 | LQ | 7.5 | fc.LQ_rm.7.5 | 0.88 | 0.89 | 0 | 0 | 0.9 | 0 | 0.8 | 0.1 | 0.102 | 0.059 | 0.002 | 0.009 | 11993.4 | 634.440378 | 1.71E-138 | 7 |
| 87 | H | 7.5 | fc.H_rm.7.5 | 0.94 | 0.99 | 0 | 0 | 0.9 | 0 | 0.8 | 0.1 | 0.104 | 0.064 | 0.002 | 0.009 | 11666.8 | 307.900975 | 1.38E-67 | 18 |
| 88 | LQH | 7.5 | fc.LQH_rm.7.5 | 0.94 | 0.97 | 0 | 0 | 0.9 | 0 | 0.8 | 0 | 0.116 | 0.076 | 0.002 | 0.009 | 11620.7 | 261.803234 | 1.41E-57 | 16 |
| 89 | LQHP | 7.5 | fc.LQHP_rm.7.5 | 0.94 | 0.98 | 0 | 0 | 0.9 | 0 | 0.8 | 0.1 | 0.116 | 0.076 | 0.002 | 0.009 | 11588.7 | 229.739381 | 1.29E-50 | 16 |
| 90 | LQHPT | 7.5 | fc.LQHPT_rm.7.5 | 0.95 | 0.97 | 0 | 0 | 0.9 | 0 | 0.8 | 0.1 | 0.116 | 0.061 | 0.002 | 0.009 | 11573.2 | 214.254895 | 2.98E-47 | 18 |
| 91 | L | 8 | fc.L_rm.8 | 0.86 | 0.86 | 0 | 0 | 0.9 | 0 | 0.8 | 0.1 | 0.1 | 0.055 | 0.002 | 0.009 | 12022.2 | 663.2353 | 9.54E-145 | 5 |
| 92 | LQ | 8 | fc.LQ_rm.8 | 0.88 | 0.89 | 0 | 0 | 0.9 | 0 | 0.8 | 0.1 | 0.102 | 0.059 | 0.002 | 0.009 | 11996.3 | 637.382393 | 3.92E-139 | 6 |
| 93 | H | 8 | fc.H_rm.8 | 0.94 | 0.99 | 0 | 0 | 0.9 | 0 | 0.8 | 0.1 | 0.097 | 0.071 | 0.002 | 0.009 | 11674.7 | 315.745167 | 2.73E-69 | 16 |
| 94 | LQH | 8 | fc.LQH_rm.8 | 0.94 | 0.97 | 0 | 0 | 0.9 | 0 | 0.8 | 0 | 0.116 | 0.076 | 0.002 | 0.009 | 11629.4 | 270.433028 | 1.89E-59 | 16 |
| 95 | LQHP | 8 | fc.LQHP_rm.8 | 0.94 | 0.98 | 0 | 0 | 0.9 | 0 | 0.8 | 0.1 | 0.111 | 0.071 | 0.002 | 0.009 | 11596.2 | 237.308908 | 2.94E-52 | 15 |
| 96 | LQHPT | 8 | fc.LQHPT_rm.8 | 0.95 | 0.97 | 0 | 0 | 0.9 | 0 | 0.8 | 0.1 | 0.116 | 0.061 | 0.002 | 0.009 | 11584.9 | 226.003463 | 8.38E-50 | 19 |
| 97 | L | 8.5 | fc.L_rm.8.5 | 0.86 | 0.87 | 0 | 0 | 0.9 | 0 | 0.8 | 0.1 | 0.1 | 0.055 | 0.002 | 0.009 | 12025 | 666.096195 | 2.28E-145 | 5 |
| 98 | LQ | 8.5 | fc.LQ_rm.8.5 | 0.88 | 0.89 | 0 | 0 | 0.9 | 0 | 0.8 | 0.1 | 0.102 | 0.059 | 0.002 | 0.009 | 12001.3 | 642.414022 | 3.17E-140 | 6 |
| 99 | H | 8.5 | fc.H_rm.8.5 | 0.94 | 0.99 | 0 | 0 | 0.9 | 0 | 0.8 | 0.1 | 0.1 | 0.069 | 0.002 | 0.009 | 11684.4 | 325.466205 | 2.11E-71 | 15 |
| 100 | LQH | 8.5 | fc.LQH_rm.8.5 | 0.94 | 0.97 | 0 | 0 | 0.9 | 0 | 0.8 | 0 | 0.116 | 0.076 | 0.002 | 0.009 | 11636.9 | 277.92398 | 4.45E-61 | 15 |
| 101 | LQHP | 8.5 | fc.LQHP_rm.8.5 | 0.94 | 0.98 | 0 | 0 | 0.9 | 0 | 0.8 | 0.1 | 0.107 | 0.072 | 0.002 | 0.009 | 11605.9 | 246.947532 | 2.37E-54 | 15 |
| 102 | LQHPT | 8.5 | fc.LQHPT_rm.8.5 | 0.94 | 0.97 | 0 | 0 | 0.9 | 0 | 0.8 | 0.1 | 0.116 | 0.061 | 0.002 | 0.009 | 11595.4 | 236.450022 | 4.51E-52 | 19 |
| 103 | L | 9 | fc.L_rm.9 | 0.86 | 0.87 | 0 | 0 | 0.9 | 0 | 0.8 | 0.1 | 0.102 | 0.059 | 0.002 | 0.009 | 12027.9 | 669.008047 | 5.32E-146 | 5 |
| 104 | LQ | 9 | fc.LQ_rm.9 | 0.87 | 0.88 | 0 | 0 | 0.9 | 0 | 0.8 | 0.1 | 0.1 | 0.055 | 0.002 | 0.009 | 12006.6 | 647.635068 | 2.33E-141 | 6 |
| 105 | H | 9 | fc.H_rm.9 | 0.94 | 0.99 | 0 | 0 | 0.9 | 0 | 0.8 | 0.1 | 0.104 | 0.071 | 0.002 | 0.009 | 11696.6 | 337.620855 | 4.85E-74 | 15 |
| 106 | LQH | 9 | fc.LQH_rm.9 | 0.94 | 0.97 | 0 | 0 | 0.9 | 0 | 0.8 | 0 | 0.114 | 0.077 | 0.002 | 0.009 | 11646.5 | 287.577673 | 3.57E-63 | 15 |
| 107 | LQHP | 9 | fc.LQHP_rm.9 | 0.94 | 0.98 | 0 | 0 | 0.9 | 0 | 0.8 | 0.1 | 0.107 | 0.072 | 0.002 | 0.009 | 11617.7 | 258.750803 | 6.49E-57 | 16 |
| 108 | LQHPT | 9 | fc.LQHPT_rm.9 | 0.94 | 0.97 | 0 | 0 | 0.9 | 0 | 0.8 | 0.1 | 0.116 | 0.063 | 0.002 | 0.009 | 11603.9 | 244.921973 | 6.53E-54 | 18 |
| 109 | L | 9.5 | fc.L_rm.9.5 | 0.86 | 0.86 | 0 | 0 | 0.9 | 0 | 0.8 | 0.1 | 0.102 | 0.059 | 0.002 | 0.009 | 12030.9 | 671.970204 | 1.21E-146 | 5 |
| 110 | LQ | 9.5 | fc.LQ_rm.9.5 | 0.87 | 0.88 | 0 | 0 | 0.9 | 0 | 0.8 | 0.1 | 0.102 | 0.059 | 0.002 | 0.009 | 12012 | 653.039672 | 1.56E-142 | 6 |
| 111 | H | 9.5 | fc.H_rm.9.5 | 0.94 | 0.99 | 0 | 0 | 0.9 | 0 | 0.8 | 0.1 | 0.104 | 0.071 | 0.002 | 0.009 | 11713.1 | 354.135594 | 1.26E-77 | 17 |
| 112 | LQH | 9.5 | fc.LQH_rm.9.5 | 0.94 | 0.97 | 0 | 0 | 0.9 | 0 | 0.8 | 0 | 0.109 | 0.072 | 0.002 | 0.009 | 11654.1 | 295.133581 | 8.16E-65 | 14 |
| 113 | LQHP | 9.5 | fc.LQHP_rm.9.5 | 0.94 | 0.98 | 0 | 0 | 0.9 | 0 | 0.8 | 0.1 | 0.104 | 0.072 | 0.002 | 0.009 | 11630.7 | 271.802462 | 9.50E-60 | 17 |
| 114 | LQHPT | 9.5 | fc.LQHPT_rm.9.5 | 0.94 | 0.97 | 0 | 0 | 0.9 | 0 | 0.8 | 0.1 | 0.109 | 0.063 | 0.002 | 0.009 | 11614.7 | 255.758502 | 2.90E-56 | 18 |
| 115 | L | 10 | fc.L_rm.10 | 0.86 | 0.87 | 0 | 0 | 0.9 | 0 | 0.8 | 0.1 | 0.102 | 0.059 | 0.002 | 0.009 | 12033.9 | 674.982053 | 2.68E-147 | 5 |
| 116 | LQ | 10 | fc.LQ_rm.10 | 0.87 | 0.88 | 0 | 0 | 0.9 | 0 | 0.8 | 0.1 | 0.102 | 0.059 | 0.002 | 0.009 | 12017.6 | 658.622323 | 9.57E-144 | 6 |
| 117 | H | 10 | fc.H_rm.10 | 0.94 | 0.99 | 0 | 0 | 0.9 | 0 | 0.8 | 0.1 | 0.104 | 0.071 | 0.002 | 0.009 | 11722.4 | 363.42287 | 1.21E-79 | 16 |
| 118 | LQH | 10 | fc.LQH_rm.10 | 0.94 | 0.98 | 0 | 0 | 0.9 | 0 | 0.8 | 0 | 0.111 | 0.08 | 0.002 | 0.009 | 11666 | 307.047532 | 2.11E-67 | 15 |
| 119 | LQHP | 10 | fc.LQHP_rm.10 | 0.94 | 0.98 | 0 | 0 | 0.9 | 0 | 0.8 | 0 | 0.104 | 0.072 | 0.002 | 0.009 | 11639.2 | 280.226565 | 1.41E-61 | 16 |
| 120 | LQHPT | 10 | fc.LQHPT_rm.10 | 0.94 | 0.98 | 0 | 0 | 0.9 | 0 | 0.8 | 0.1 | 0.107 | 0.065 | 0.002 | 0.009 | 11625.7 | 266.723292 | 1.20E-58 | 18 |
References
- Nixon, K.C. Global and Neotropical Distribution and Diversity of Oak (Genus quercus) and Oak Forests. In Ecology and Conservation of Neotropical Montane Oak Forests; Kappelle, M., Ed.; Ecological Studies; Springer-Verlag: Berlin/Heidelberg, Germany, 2006; Volume 185, pp. 3–13. ISBN 978-3-540-28908-1. [Google Scholar]
- Rolando, M.; Ganugi, P.; Secchi, F.; Said-Pullicino, D.; Bonifacio, E.; Celi, L. Response of Native (Quercus robur L.) and Alien (Quercus rubra L.) Species to Water Stress and Nutrient Input in European Temperate Ecosystems. Physiol. Plant. 2025, 177, e70070. [Google Scholar] [CrossRef] [PubMed]
- Scavotto, N.; Siegert, C.; Alexander, H.D.; Varner, J.M. Bark and Crown Morphology Drive Differences in Rainwater Distribution in an Upland Oak Forest. For. Ecol. Manag. 2024, 553, 121642. [Google Scholar] [CrossRef]
- Stephan, J.; Bercachy, C.; Bechara, J.; Charbel, E.; López-Tirado, J. Local Ecological Niche Modelling to Provide Suitability Maps for 27 Forest Tree Species in Edge Conditions. Iforest—Biogeosciences For. 2020, 13, 230. [Google Scholar] [CrossRef]
- Abrams, M.D. Distribution, Historical Development and Ecophysiological Attributes of Oak Species in the Eastern United States. Ann. For. Sci. 1996, 53, 487–512. [Google Scholar] [CrossRef]
- Manos, P.S.; Hipp, A.L. An Updated Infrageneric Classification of the North American Oaks (Quercus Subgenus Quercus): Review of the Contribution of Phylogenomic Data to Biogeography and Species Diversity. Forests 2021, 12, 786. [Google Scholar] [CrossRef]
- Steele, M.A.; Dalgleish, H.J.; Marino, S.; Bartlow, A.W.; Curtis, R.; Stratford, J.A. Oak (Acorn)–Weevil Interactions across an Extensive Latitudinal Gradient in Eastern North America. Diversity 2021, 13, 303. [Google Scholar] [CrossRef]
- Kremer, A.; Hipp, A.L. Oaks: An Evolutionary Success Story. New Phytol. 2020, 226, 987–1011. [Google Scholar] [CrossRef]
- Sork, V.L.; Davis, F.W.; Westfall, R.; Flint, A.; Ikegami, M.; Wang, H.; Grivet, D. Gene Movement and Genetic Association with Regional Climate Gradients in California Valley Oak (Quercus Lobata Née) in the Face of Climate Change. Mol. Ecol. 2010, 19, 3806–3823. [Google Scholar] [CrossRef]
- Löf, M.; Brunet, J.; Filyushkina, A.; Lindbladh, M.; Skovsgaard, J.P.; Felton, A. Management of Oak Forests: Striking a Balance between Timber Production, Biodiversity and Cultural Services. Int. J. Biodivers. Sci. Ecosyst. Serv. Manag. 2016, 12, 59–73. [Google Scholar] [CrossRef]
- Stavi, I.; Thevs, N.; Welp, M.; Zdruli, P. Provisioning Ecosystem Services Related with Oak (Quercus) Systems: A Review of Challenges and Opportunities. Agroforest Syst. 2022, 96, 293–313. [Google Scholar] [CrossRef]
- del Alamo-Sanza, M.; Nevares, I. Oak Wine Barrel as an Active Vessel: A Critical Review of Past and Current Knowledge. Crit. Rev. Food Sci. Nutr. 2018, 58, 2711–2726. [Google Scholar] [CrossRef] [PubMed]
- Jordão, A.M.; Correia, A.C.; DelCampo, R.; González SanJosé, M.L. Antioxidant Capacity, Scavenger Activity, and Ellagitannins Content from Commercial Oak Pieces Used in Winemaking. Eur. Food Res. Technol. 2012, 235, 817–825. [Google Scholar] [CrossRef]
- Banc, R.; Rusu, M.E.; Filip, L.; Popa, D.-S. Phytochemical Profiling and Biological Activities of Quercus Sp. Galls (Oak Galls): A Systematic Review of Studies Published in the Last 5 Years. Plants 2023, 12, 3873. [Google Scholar] [CrossRef]
- Burlacu, E.; Nisca, A.; Tanase, C. A Comprehensive Review of Phytochemistry and Biological Activities of Quercus Species. Forests 2020, 11, 904. [Google Scholar] [CrossRef]
- Johnson, P.S.; Shifley, S.R.; Rogers, R. The Ecology and Silviculture of Oaks; Cabi: Atlanta, GA, USA, 2009. [Google Scholar]
- Ozdemir, M.B.; Karadag, R. Anatolian Acorn Oak’s Economic Potential in the Application to the Textile and Leather Industries. Text. Leather Rev. 2023, 6, 320–332. [Google Scholar] [CrossRef]
- Plieninger, T. Compatibility of Livestock Grazing with Stand Regeneration in Mediterranean Holm Oak Parklands. J. Nat. Conserv. 2007, 15, 1–9. [Google Scholar] [CrossRef]
- Haykıran, A.S.; Güren, F.Ö. 19. Yüzyılın Sonlarında Aydın Sancağı’nda Ormancılık Ve Orman İdaresi. Adnan Menderes Üniversitesi Sos. Bilim. Enstitüsü Derg. 2023, 10, 103–119. [Google Scholar] [CrossRef]
- İnal, S. Türkiye ve Yunanistan’da Palamut Meşesi ve Ekonomik Önemi. J. Fac. For. Istanb. Univ. 1952, 2, 107–119. [Google Scholar]
- Kremer, A.; Ronce, O.; Robledo-Arnuncio, J.J.; Guillaume, F.; Bohrer, G.; Nathan, R.; Bridle, J.R.; Gomulkiewicz, R.; Klein, E.K.; Ritland, K.; et al. Long-Distance Gene Flow and Adaptation of Forest Trees to Rapid Climate Change. Ecol. Lett. 2012, 15, 378–392. [Google Scholar] [CrossRef]
- Petit, R.J.; Brewer, S.; Bordács, S.; Burg, K.; Cheddadi, R.; Coart, E.; Cottrell, J.; Csaikl, U.M.; van Dam, B.; Deans, J.D.; et al. Identification of Refugia and Post-Glacial Colonisation Routes of European White Oaks Based on Chloroplast DNA and Fossil Pollen Evidence. For. Ecol. Manag. 2002, 156, 49–74. [Google Scholar] [CrossRef]
- Gugger, P.F.; Ikegami, M.; Sork, V.L. Influence of Late Quaternary Climate Change on Present Patterns of Genetic Variation in Valley Oak, Uercus Lobata Née. Mol. Ecol. 2013, 22, 3598–3612. [Google Scholar] [CrossRef] [PubMed]
- Denk, T.; Grimm, G.W.; Manos, P.S.; Deng, M.; Hipp, A.L. An Updated Infrageneric Classification of the Oaks: Review of Previous Taxonomic Schemes and Synthesis of Evolutionary Patterns. In Oaks Physiological Ecology. Exploring the Functional Diversity of Genus quercus L.; Gil-Pelegrín, E., Peguero-Pina, J.J., Sancho-Knapik, D., Eds.; Springer International Publishing: Cham, Switzerland, 2017; pp. 13–38. ISBN 978-3-319-69099-5. [Google Scholar]
- Manos, P.S.; Stanford, A.M. The Historical Biogeography of Fagaceae: Tracking the Tertiary History of Temperate and Subtropical Forests of the Northern Hemisphere. Int. J. Plant Sci. 2001, 162, S77–S93. [Google Scholar] [CrossRef]
- Hewitt, G. The Genetic Legacy of the Quaternary Ice Ages. Nature 2000, 405, 907–913. [Google Scholar] [CrossRef] [PubMed]
- Leroy, S.A.G.; Arpe, K. Glacial Refugia for Summer-Green Trees in Europe and South-West Asia as Proposed by ECHAM3 Time-Slice Atmospheric Model Simulations. J. Biogeogr. 2007, 34, 2115–2128. [Google Scholar] [CrossRef]
- Tzedakis, P.C. Long-Term Tree Populations in Northwest Greece through Multiple Quaternary Climatic Cycles. Nature 1993, 364, 437–440. [Google Scholar] [CrossRef]
- Kremer, A.; Petit, R.J. Gene Diversity in Natural Populations of Oak Species. Ann. For. Sci. 1993, 50, 186s–202s. [Google Scholar] [CrossRef]
- Brewer, S.; Cheddadi, R.; de Beaulieu, J.L.; Reille, M. The Spread of Deciduous Quercus throughout Europe since the Last Glacial Period. For. Ecol. Manag. 2002, 156, 27–48. [Google Scholar] [CrossRef]
- Valencia-Cuevas, L.; Piñero, D.; Mussali-Galante, P.; Valencia-Ávalos, S.; Tovar-Sánchez, E. Effect of a Red Oak Species Gradient on Genetic Structure and Diversity of Quercus Castanea (Fagaceae) in Mexico. Tree Genet. Genomes 2014, 10, 641–652. [Google Scholar] [CrossRef]
- Burke, K.D.; Williams, J.W.; Chandler, M.A.; Haywood, A.M.; Lunt, D.J.; Otto-Bliesner, B.L. Pliocene and Eocene Provide Best Analogs for Near-Future Climates. Proc. Natl. Acad. Sci. USA 2018, 115, 13288–13293. [Google Scholar] [CrossRef]
- Masson-Delmotte, V.P.; Zhai, P.; Pirani, S.L.; Connors, C.; Péan, S.; Berger, N.; Caud, Y.; Chen, L.; Goldfarb, M.I.; Scheel Monteiro, P.M. IPCC, 2021: Summary for Policymakers. In Climate Change 2021: The Physical Science Basis. Contribution of Working Group i to the Sixth Assessment Report of the Intergovernmental Panel on Climate Change; Cambridge University Press: Cambridge, UK; New York, NY, USA, 2021. [Google Scholar]
- Amindin, A.; Pourghasemi, H.R.; Safaeian, R.; Rahmanian, S.; Tiefenbacher, J.P.; Naimi, B. Predicting Current and Future Habitat Suitability of an Endemic Species Using Data-Fusion Approach: Responses to Climate Change. Rangel. Ecol. Manag. 2024, 94, 149–162. [Google Scholar] [CrossRef]
- Puchałka, R.; Paź-Dyderska, S.; Woziwoda, B.; Dyderski, M.K. Climate Change Will Cause Climatic Niche Contraction of Vaccinium myrtillus L. and V. vitis-idaea L. in Europe. Sci. Total Environ. 2023, 892, 164483. [Google Scholar] [CrossRef] [PubMed]
- Kutzbach, J.; Gallimore, R.; Harrison, S.; Behling, P.; Selin, R.; Laarif, F. Climate and Biome Simulations for the Past 21,000 Years. Quat. Sci. Rev. 1998, 17, 473–506. [Google Scholar] [CrossRef]
- Tovar, C.; Carril, A.F.; Gutiérrez, A.G.; Ahrends, A.; Fita, L.; Zaninelli, P.; Flombaum, P.; Abarzúa, A.M.; Alarcón, D.; Aschero, V.; et al. Understanding Climate Change Impacts on Biome and Plant Distributions in the Andes: Challenges and Opportunities. J. Biogeogr. 2022, 49, 1420–1442. [Google Scholar] [CrossRef]
- Vessella, F.; López-Tirado, J.; Simeone, M.C.; Schirone, B.; Hidalgo, P.J. A Tree Species Range in the Face of Climate Change: Cork Oak as a Study Case for the Mediterranean Biome. Eur. J. For. Res. 2017, 136, 555–569. [Google Scholar] [CrossRef]
- Franklin, J.; Serra-Diaz, J.M.; Syphard, A.D.; Regan, H.M. Global Change and Terrestrial Plant Community Dynamics. Proc. Natl. Acad. Sci. USA 2016, 113, 3725–3734. [Google Scholar] [CrossRef]
- Sun, G.-Q.; Li, L.; Li, J.; Liu, C.; Wu, Y.-P.; Gao, S.; Wang, Z.; Feng, G.-L. Impacts of Climate Change on Vegetation Pattern: Mathematical Modeling and Data Analysis. Phys. Life Rev. 2022, 43, 239–270. [Google Scholar] [CrossRef]
- Elith, J.; Leathwick, J.R. Species Distribution Models: Ecological Explanation and Prediction Across Space and Time. Annu. Rev. Ecol. Evol. Syst. 2009, 40, 677–697. [Google Scholar] [CrossRef]
- Guisan, A.; Thuiller, W.; Zimmermann, N.E. Habitat Suitability and Distribution Models: With Applications in R; Cambridge University Press: Cambridge, UK, 2017. [Google Scholar]
- Araújo, M.B.; Guisan, A. Five (or so) Challenges for Species Distribution Modelling. J. Biogeogr. 2006, 33, 1677–1688. [Google Scholar] [CrossRef]
- Peterson, A.T.; Soberón, J.; Pearson, R.G.; Anderson, R.P.; Martínez-Meyer, E.; Nakamura, M.A.; Araújo, M.B. Ecological Niches and Geographic Distributions; Princeton University Press: Princeton, NJ, USA, 2011. [Google Scholar]
- Elith, J.; Kearney, M.; Phillips, S. The Art of Modelling Range-Shifting Species. Methods Ecol. Evol. 2010, 1, 330–342. [Google Scholar] [CrossRef]
- Hijmans, R.J.; Graham, C.H. The Ability of Climate Envelope Models to Predict the Effect of Climate Change on Species Distributions. Glob. Change Biol. 2006, 12, 2272–2281. [Google Scholar] [CrossRef]
- Gillingham, P.K.; Britton, J.R.; Jones, G.; Miller-Rushing, A.; Stafford, R.; Slater, H. Climate Change Adaptation for Biodiversity in Protected Areas: An Overview of Actions. Biol. Conserv. 2024, 289, 110375. [Google Scholar] [CrossRef]
- Hamann, A.; Wang, T. Potential Effects of Climate Change on Ecosystem and Tree Species Distribution in British Columbia. Ecology 2006, 87, 2773–2786. [Google Scholar] [CrossRef]
- Khan, R.W.A.; Shaheen, H.; Qayyum, S.; Awan, S.N.; Shah, T.A.; Alsahli, A.A.; Younous, Y.A.; El-Sheikh, M.A. Predicting Habitat Refugia of the Medicinal Plant Dolomiaea Costus under Two Climate Change Scenarios. Discov. Life 2025, 55, 2. [Google Scholar] [CrossRef]
- Thomas, C.D.; Cameron, A.; Green, R.E.; Bakkenes, M.; Beaumont, L.J.; Collingham, Y.C.; Erasmus, B.F.; De Siqueira, M.F.; Grainger, A.; Hannah, L. Extinction Risk from Climate Change. Nature 2004, 427, 145–148. [Google Scholar] [CrossRef]
- Pearson, R.G.; Dawson, T.P. Predicting the Impacts of Climate Change on the Distribution of Species: Are Bioclimate Envelope Models Useful? Glob. Ecol. Biogeogr. 2003, 12, 361–371. [Google Scholar] [CrossRef]
- Felton, A.; Belyazid, S.; Eggers, J.; Nordström, E.-M.; Öhman, K. Climate Change Adaptation and Mitigation Strategies for Production Forests: Trade-Offs, Synergies, and Uncertainties in Biodiversity and Ecosystem Services Delivery in Northern Europe. Ambio 2024, 53, 1–16. [Google Scholar] [CrossRef]
- Ferrier, S.; Guisan, A. Spatial Modelling of Biodiversity at the Community Level. J. Appl. Ecol. 2006, 43, 393–404. [Google Scholar] [CrossRef]
- López-Tirado, J.; Vessella, F.; Schirone, B.; Hidalgo, P.J. Trends in Evergreen Oak Suitability from Assembled Species Distribution Models: Assessing Climate Change in South-Western Europe. New For. 2018, 49, 471–487. [Google Scholar] [CrossRef]
- Thuiller, W. Climate Change and the Ecologist. Nature 2007, 448, 550–552. [Google Scholar] [CrossRef]
- Thuiller, W.; Albert, C.; Araújo, M.B.; Berry, P.M.; Cabeza, M.; Guisan, A.; Hickler, T.; Midgley, G.F.; Paterson, J.; Schurr, F.M.; et al. Predicting Global Change Impacts on Plant Species’ Distributions: Future Challenges. Perspect. Plant Ecol. Evol. Syst. 2008, 9, 137–152. [Google Scholar] [CrossRef]
- Acácio, V.; Dias, F.S.; Catry, F.X.; Rocha, M.; Moreira, F. Landscape Dynamics in Mediterranean Oak Forests under Global Change: Understanding the Role of Anthropogenic and Environmental Drivers across Forest Types. Glob. Change Biol. 2017, 23, 1199–1217. [Google Scholar] [CrossRef]
- Gorener, V.; Jerome, D. Quercus Ithaburensis 2018. The IUCN Red List of Threatened Species 2018: e.T194178A2303017. Available online: https://dx.doi.org/10.2305/IUCN.UK.2018-1.RLTS.T194178A2303017.en (accessed on 5 September 2024).
- Öztürk, S. Türkiye Meşeleri Teşhis ve Tanı Kılavuzu; TC Orman ve Su İşleri Bakanlığı Orman Genel Müdürlüğü: Ankara, Türkiye, 2013. [Google Scholar]
- Hedge, I.C.; Yaltırık, F. Quercus L. Flora of Turkey and the East Aegean Islands. Vol. 7; Edinburgh University Press: Edinburgh, UK, 1982. [Google Scholar]
- Yılmaz, E.; Çiçek, İ. Detailed Köppen-Geiger Climate Regions of Turkey Türkiye’nin Detaylandırılmış Köppen-Geiger Iklim Bölgeleri. J. Hum. Sci. 2018, 15, 225–242. [Google Scholar] [CrossRef]
- Dufour-Dror, J.-M.; Ertas, A. Bioclimatic Perspectives in the Distribution of Quercus Ithaburensis Decne. Subspecies in Turkey and in the Levant. J. Biogeogr. 2004, 31, 461–474. [Google Scholar] [CrossRef]
- Pantera, A.; Papadopoulos, A.; Papanastasis, V.P. Valonia Oak Agroforestry Systems in Greece: An Overview. Agroforest Syst. 2018, 92, 921–931. [Google Scholar] [CrossRef]
- Siam, A.M.J.; Radoglou, K.M.; Noitsakis, B.; Smiris, P. Physiological and Growth Responses of Three Mediterranean Oak Species to Different Water Availability Regimes. J. Arid. Environ. 2008, 72, 583–592. [Google Scholar] [CrossRef]
- Tekpinar, A.D.; Aktaş, C.; Kansu, Ç.; Duman, H.; Kaya, Z. Phylogeography and Phylogeny of Genus quercus L. (Fagaceae) in Turkey Implied by Variations of trnT(UGU)-L(UAA)-F (GAA) Chloroplast DNA Region. Tree Genet. Genomes 2021, 17, 40. [Google Scholar] [CrossRef]
- Lados, B.B.; Benke, A.; Borovics, A.; Köbölkuti, Z.A.; Molnár, C.É.; Nagy, L.; Tóth, E.G.; Cseke, K. What We Know about Turkey Oak (Quercus cerris L.)—From Evolutionary History to Species Ecology. For. Int. J. For. Res. 2024, 97, 497–511. [Google Scholar] [CrossRef]
- Kaplan, D.; Gutman, M. Phenology of Quercus Ithaburensis with Emphasis on the Effect of Fire. For. Ecol. Manag. 1999, 115, 61–70. [Google Scholar] [CrossRef]
- Menitsky, Y. Oaks of Asia (Translated from Russian); Science Publishes: Enfield, NH, USA, 2005. [Google Scholar]
- Stephan, J.; Chayban, L.; Vessella, F. Abiotic Factors Affecting the Distribution of Oaks in Lebanon. Turk. J. Bot. 2016, 40, 595–609. [Google Scholar] [CrossRef]
- Pantera, A.; Papanastasis, V.P. Competitive Effects of Herbaceous Species on Water Potential and Growth of Quercus Ithaburensis Ssp. Macrolepis Seedlings. Glob. Nest J. 2012, 14, 525–531. [Google Scholar] [CrossRef]
- Tsitsoni, K.T.; Tsakaldimi, M.; Prodofikas, C. Root Growth Potential and Seedling Morphological Attributes of Four Mediterranean Hardwood Species. In Proceedings of the 12th International Mediterranean Ecosystems Conference, Varna, Bulgaria, 11–14 October 2023; MEDECOS XII: Linking Science with Resource Management: Los Angeles, CA, USA, 2011; Volume 220. [Google Scholar]
- Alla, A.Q.; Pasho, E.; Marku, V. Growth Variability and Contrasting Climatic Responses of Two Quercus Macrolepis Stands from Southern Albania. Trees 2017, 31, 1491–1504. [Google Scholar] [CrossRef]
- Kenar, N. Forecasting Impacts of Climate and Land-Use Change on Vallonea Oak (Quercus Ithaburensis Subsp. Macrolepis) Based on the Ensemble Modeling. Plant Biosyst.—Int. J. Deal. All. Asp. Plant Biol. 2025, 159, 1–14. [Google Scholar] [CrossRef]
- Özcan, A.U. Sulakyurt Kalıntı Anadolu Palamut Meşesi (Quercus Ithaburensis Decne Subsp. Macrolepis (Kotschy) Hedge & Yalt.) Ormanı, Tehditler ve Koruma Önerileri. Turk. J. For. 2021, 22, 8–16. [Google Scholar]
- Zohary, M. Geobotanical Foundations of the Middle East. J. Ecol. 1974, 62, 349. [Google Scholar]
- Birden, C. Kırıkkale Civarı Quercus Ithaburensis Decne. Subsp, Macrolepis (Kotschy) Hedge et Yalt. Orman Kalıntısının Florası. Master Thesis, Gazi University, Ankara, Türkiye, 1991. [Google Scholar]
- Dönmez, A. Flora of Karagüney Mountain (Kırıkkale). Turk. J. Bot. 2002, 26, 417–451. [Google Scholar]
- Vural, M.; Yaman, M.; Şahin, B. Büyükhemit Deresi ve Civarının (Delice-Kırıkkale) Vejetasyonu. Ekoloji 2007, 16, 53–62. [Google Scholar]
- Dufour-Dror, J.-M. Influence of Cattle Grazing on the Density of Oak Seedlings and Saplings in a Tabor Oak Forest in Israel. Acta Oecologica 2007, 31, 223–228. [Google Scholar] [CrossRef]
- Çevre, K.; Derneği, O.S.A. İç Anadolu’nun Kalıntı Ormanları; Kırsal Çevre ve Ormancılık Sorunları Araştırma Derneği; Arkadaş Basım Sanayi Ltd. Şti.: Ankara, Türkiye, 2019. [Google Scholar]
- Aldow, A.; Brehm, J.M.; Gaisberger, H.; Maxted, N. In Situ and Ex Situ Conservation Gap Analyses of Crop Wild Relatives from Northeast Africa. Genet. Resour. Crop Evol. 2025. [Google Scholar] [CrossRef]
- Rouichi, S.; Ghanem, M.E.; Amri, M. In-Situ and Ex-Situ Conservation Priorities and Distribution of Lentil Wild Relatives under Climate Change: A Modelling Approach. J. Appl. Ecol. 2024, 62, 414–428. [Google Scholar] [CrossRef]
- Volis, S.; Blecher, M. Quasi in Situ: A Bridge between Ex Situ and in Situ Conservation of Plants. Biodivers. Conserv. 2010, 19, 2441–2454. [Google Scholar] [CrossRef]
- GBIF. GBIF.Org GBIF Occurrence Download 2024. Available online: https://www.gbif.org/occurrence/download/0103270-240321170329656 (accessed on 5 April 2024).
- Yılmaz, H. Quercus L. Türkiye’nin Doğal-Egzotik Ağaç ve Çalıları; Akkemik, Ü., Ed.; Orman Genel Müdürlüğü Yayınları: Ankara, Türkiye, 2014; pp. 673–702. [Google Scholar]
- Fick, S.E.; Hijmans, R.J. WorldClim 2: New 1-km Spatial Resolution Climate Surfaces for Global Land Areas. Int. J. Climatol. 2017, 37, 4302–4315. [Google Scholar] [CrossRef]
- Aiello-Lammens, M.E.; Boria, R.A.; Radosavljevic, A.; Vilela, B.; Anderson, R.P. spThin: An R Package for Spatial Thinning of Species Occurrence Records for Use in Ecological Niche Models. Ecography 2015, 38, 541–545. [Google Scholar] [CrossRef]
- Merow, C.; Smith, M.J.; Silander, J.A., Jr. A Practical Guide to MaxEnt for Modeling Species’ Distributions: What It Does, and Why Inputs and Settings Matter. Ecography 2013, 36, 1058–1069. [Google Scholar] [CrossRef]
- Boria, R.A.; Olson, L.E.; Goodman, S.M.; Anderson, R.P. Spatial Filtering to Reduce Sampling Bias Can Improve the Performance of Ecological Niche Models. Ecol. Model. 2014, 275, 73–77. [Google Scholar] [CrossRef]
- Fourcade, Y.; Engler, J.O.; Rödder, D.; Secondi, J. Mapping Species Distributions with MAXENT Using a Geographically Biased Sample of Presence Data: A Performance Assessment of Methods for Correcting Sampling Bias. PLoS ONE 2014, 9, e97122. [Google Scholar] [CrossRef] [PubMed]
- Sillero, N.; Arenas-Castro, S.; Enriquez-Urzelai, U.; Vale, C.G.; Sousa-Guedes, D.; Martínez-Freiría, F.; Real, R.; Barbosa, A.M. Want to Model a Species Niche? A Step-by-Step Guideline on Correlative Ecological Niche Modelling. Ecol. Model. 2021, 456, 109671. [Google Scholar] [CrossRef]
- Soberón, J.; Peterson, A.T. Interpretation of Models of Fundamental Ecological Niches and Species’ Distributional Areas. Biodivers. Inform. 2005, 2, 1–10. [Google Scholar] [CrossRef]
- Karger, D.N.; Nobis, M.P.; Normand, S.; Graham, C.H.; Zimmermann, N.E. CHELSA-TraCE21k: Downscaled Transient Temperature and Precipitation Data Since the Last Glacial Maximum. EnviDat 2020. Available online: https://www.doi.org/10.16904/envidat.211 (accessed on 5 April 2024).
- Karger, D.N.; Nobis, M.P.; Normand, S.; Graham, C.H.; Zimmermann, N.E. CHELSA-TraCE21k—High-Resolution (1 km) Downscaled Transient Temperature and Precipitation Data since the Last Glacial Maximum. Clim. Past 2023, 19, 439–456. [Google Scholar] [CrossRef]
- Amatulli, G.; Domisch, S.; Tuanmu, M.-N.; Parmentier, B.; Ranipeta, A.; Malczyk, J.; Jetz, W. A Suite of Global, Cross-Scale Topographic Variables for Environmental and Biodiversity Modeling. Sci. Data 2018, 5, 180040. [Google Scholar] [CrossRef]
- Naimi, B. USDM: Uncertainty Analysis for Species Distribution Models. R Package Version 1.1–15. R. Doc. 2015. Available online: https://www.google.com/url?sa=t&source=web&rct=j&opi=89978449&url=https://cran.r-project.org/web/packages/usdm/usdm.pdf&ved=2ahUKEwivn5C5uoaNAxVqqVYBHXNYC2wQFnoECBYQAQ&usg=AOvVaw03AwuXkBUw0hoaGeEAQE6d (accessed on 5 April 2024).
- Mangerud, J.; Andersen, S.T.; Berglund, B.E.; Donner, J.J. Quaternary Stratigraphy of Norden, a Proposal for Terminology and Classification. Boreas 1974, 3, 109–126. [Google Scholar] [CrossRef]
- Phillips, S.J.; Anderson, R.P.; Schapire, R.E. Maximum Entropy Modeling of Species Geographic Distributions. Ecol. Model. 2006, 190, 231–259. [Google Scholar] [CrossRef]
- Phillips, S.J.; Dudík, M. Modeling of Species Distributions with Maxent: New Extensions and a Comprehensive Evaluation. Ecography 2008, 31, 161–175. [Google Scholar] [CrossRef]
- Phillips, S.J.; Anderson, R.P.; Dudík, M.; Schapire, R.E.; Blair, M.E. Opening the Black Box: An Open-source Release of Maxent. Ecography 2017, 40, 887–893. [Google Scholar] [CrossRef]
- Muscarella, R.; Galante, P.J.; Soley-Guardia, M.; Boria, R.A.; Kass, J.M.; Uriarte, M.; Anderson, R.P. ENM Eval: An R Package for Conducting Spatially Independent Evaluations and Estimating Optimal Model Complexity for Maxent Ecological Niche Models. Methods Ecol. Evol. 2014, 5, 1198–1205. [Google Scholar] [CrossRef]
- Kass, J.M.; Muscarella, R.; Galante, P.J.; Bohl, C.L.; Pinilla-Buitrago, G.E.; Boria, R.A.; Soley-Guardia, M.; Anderson, R.P. ENMeval 2.0: Redesigned for Customizable and Reproducible Modeling of Species’ Niches and Distributions. Methods Ecol. Evol. 2021, 12, 1602–1608. [Google Scholar] [CrossRef]
- Hanley, J.A.; McNeil, B.J. The Meaning and Use of the Area under a Receiver Operating Characteristic (ROC) Curve. Radiology 1982, 143, 29–36. [Google Scholar] [CrossRef]
- Warren, D.L.; Seifert, S.N. Ecological Niche Modeling in Maxent: The Importance of Model Complexity and the Performance of Model Selection Criteria. Ecol. Appl. 2011, 21, 335–342. [Google Scholar] [CrossRef]
- Fielding, A.H.; Bell, J.F. A Review of Methods for the Assessment of Prediction Errors in Conservation Presence/Absence Models. Environ. Conserv. 1997, 24, 38–49. [Google Scholar] [CrossRef]
- Burnham, K.P.; Anderson, D.R. Multimodel Inference: Understanding AIC and BIC in Model Selection. Sociol. Methods Res. 2004, 33, 261–304. [Google Scholar] [CrossRef]
- Radosavljevic, A.; Anderson, R.P. Making Better Maxent Models of Species Distributions: Complexity, Overfitting and Evaluation. J. Biogeogr. 2014, 41, 629–643. [Google Scholar] [CrossRef]
- Kass, J.M.; Anderson, R.P.; Espinosa-Lucas, A.; Juárez-Jaimes, V.; Martínez-Salas, E.; Botello, F.; Tavera, G.; Flores-Martínez, J.J.; Sánchez-Cordero, V. Biotic Predictors with Phenological Information Improve Range Estimates for Migrating Monarch Butterflies in Mexico. Ecography 2020, 43, 341–352. [Google Scholar] [CrossRef]
- Raes, N.; ter Steege, H. A Null-Model for Significance Testing of Presence-Only Species Distribution Models. Ecography 2007, 30, 727–736. [Google Scholar] [CrossRef]
- Bohl, C.L.; Kass, J.M.; Anderson, R.P. A New Null Model Approach to Quantify Performance and Significance for Ecological Niche Models of Species Distributions. J. Biogeogr. 2019, 46, 1101–1111. [Google Scholar] [CrossRef]
- Liu, C.; Berry, P.M.; Dawson, T.P.; Pearson, R.G. Selecting Thresholds of Occurrence in the Prediction of Species Distributions. Ecography 2005, 28, 385–393. [Google Scholar] [CrossRef]
- Hijmans, R.J.; Bivand, R.; Forner, K.; Ooms, J.; Pebesma, E.; Sumner, M.D. Package ‘Terra’; Maintainer: Vienna Austria, 2022; Volume 384. [Google Scholar]
- Birks, H.J.B. Contributions of Quaternary Botany to Modern Ecology and Biogeography. Plant Ecol. Divers. 2019, 12, 189–385. [Google Scholar] [CrossRef]
- Walas, Ł.; Sobierajska, K.; Ok, T.; Dönmez, A.A.; Kanoğlu, S.S.; Dagher-Kharrat, M.B.; Douaihy, B.; Romo, A.; Stephan, J.; Jasińska, A.K.; et al. Past, Present, and Future Geographic Range of an Oro-Mediterranean Tertiary Relict: The Juniperus Drupacea Case Study. Reg. Environ. Change 2019, 19, 1507–1520. [Google Scholar] [CrossRef]
- Lionello, P. The Climate of the Mediterranean Region: From the Past to the Future; Elsevier: Amsterdam, The Netherlands, 2012; ISBN 978-0-12-416042-2. [Google Scholar]
- Cheddadi, R.; Khater, C. Climate Change since the Last Glacial Period in Lebanon and the Persistence of Mediterranean Species. Quat. Sci. Rev. 2016, 150, 146–157. [Google Scholar] [CrossRef]
- Dean, J.R.; Jones, M.D.; Leng, M.J.; Noble, S.R.; Metcalfe, S.E.; Sloane, H.J.; Sahy, D.; Eastwood, W.J.; Roberts, C.N. Eastern Mediterranean Hydroclimate over the Late Glacial and Holocene, Reconstructed from the Sediments of Nar Lake, Central Turkey, Using Stable Isotopes and Carbonate Mineralogy. Quat. Sci. Rev. 2015, 124, 162–174. [Google Scholar] [CrossRef]


Disclaimer/Publisher’s Note: The statements, opinions and data contained in all publications are solely those of the individual author(s) and contributor(s) and not of MDPI and/or the editor(s). MDPI and/or the editor(s) disclaim responsibility for any injury to people or property resulting from any ideas, methods, instructions or products referred to in the content. |
© 2025 by the authors. Licensee MDPI, Basel, Switzerland. This article is an open access article distributed under the terms and conditions of the Creative Commons Attribution (CC BY) license (https://creativecommons.org/licenses/by/4.0/).
Share and Cite
Özcan, A.U.; Gülçin, D.; López-Tirado, J.; Ayan, S.; Stephan, J.; Velázquez, J.; Çiçek, İ.; Sezgin, M.; Çiçek, K. Climate-Driven Shifts in the Distribution of Valonia Oak from the Last Glaciation to the Antropocene. Forests 2025, 16, 776. https://doi.org/10.3390/f16050776
Özcan AU, Gülçin D, López-Tirado J, Ayan S, Stephan J, Velázquez J, Çiçek İ, Sezgin M, Çiçek K. Climate-Driven Shifts in the Distribution of Valonia Oak from the Last Glaciation to the Antropocene. Forests. 2025; 16(5):776. https://doi.org/10.3390/f16050776
Chicago/Turabian StyleÖzcan, Ali Uğur, Derya Gülçin, Javier López-Tirado, Sezgin Ayan, Jean Stephan, Javier Velázquez, İhsan Çiçek, Mehmet Sezgin, and Kerim Çiçek. 2025. "Climate-Driven Shifts in the Distribution of Valonia Oak from the Last Glaciation to the Antropocene" Forests 16, no. 5: 776. https://doi.org/10.3390/f16050776
APA StyleÖzcan, A. U., Gülçin, D., López-Tirado, J., Ayan, S., Stephan, J., Velázquez, J., Çiçek, İ., Sezgin, M., & Çiçek, K. (2025). Climate-Driven Shifts in the Distribution of Valonia Oak from the Last Glaciation to the Antropocene. Forests, 16(5), 776. https://doi.org/10.3390/f16050776