Article

Tree-Ring-Based Analysis of Populus euphratica Radial Growth Response to Extreme Drought Across Lower Tarim River Sections, Xinjiang, China

1
College of Geographical and Tourism, Xinjiang Normal University, Urumqi 830054, China
2
Xinjiang Laboratory of Lake Environment and Resources in Arid Zone, Urumqi 830054, China
*
Author to whom correspondence should be addressed.
Forests 2025, 16(8), 1311; https://doi.org/10.3390/f16081311
Submission received: 5 July 2025 / Revised: 2 August 2025 / Accepted: 8 August 2025 / Published: 12 August 2025
(This article belongs to the Section Forest Ecology and Management)

Abstract

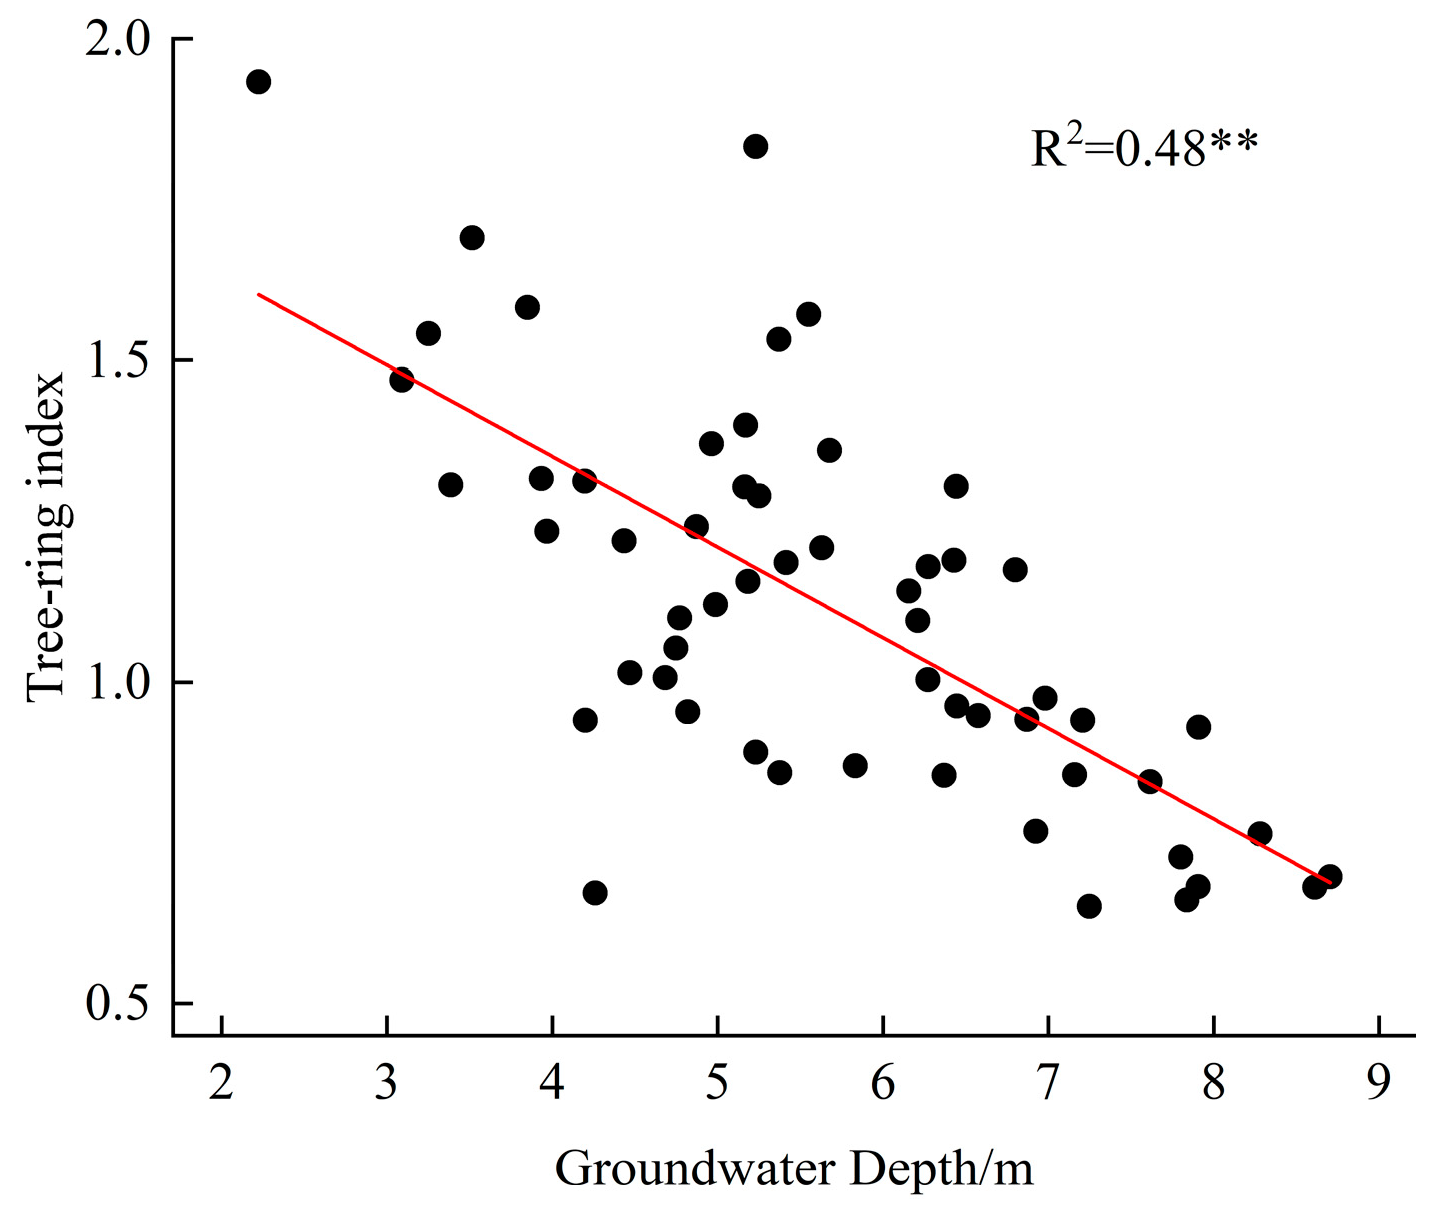
The lower reaches of the Tarim River in Xinjiang, China are home to desert riparian vegetation dominated by Populus euphratica, which play an important role in windbreak and sand fixation, as well as maintaining the ecological balance of arid regions. Based on dendrochronology, this study analyzed the response of Populus euphratica radial growth to hydrothermal factors in the lower Tarim River region, assessed its resistance and resilience to extreme drought events, developed a multivariate regression model for resilience–hydrothermal factor relationships, and revealed the differential response of its ecological resilience to these factors. The results showed that the maximum, minimum, and mean temperatures and saturated water VPD (vapor pressure deficit) during the spring and growing season were the most significant and positively correlated with Populus euphratica growth. The radial growth of Populus euphratica was negatively correlated with maximum and mean summer temperatures. By region, Yingsu (YS) and Kaerdayi (KE) were more sensitive to seasonal climatic factors. The effect of groundwater on the radial growth of Populus euphratica was the strongest factor, with a highly significant negative correlation (p < 0.01), showing that the radial growth of Populus euphratica slowed with increasing depth of groundwater. The VPD, spring drought severity, and growing season groundwater variability all had a significant effect on Populus euphratica resistance, whereas Populus euphratica resilience was mainly significantly associated with growing season drought severity and summer groundwater variability. Radial growth was positively correlated with spring temperatures and the VPD and negatively correlated with summer temperatures (p < 0.01).

1. Introduction

Over the past few decades, extreme climatic events have substantially influenced tree growth patterns [1]. Research on tree resilience to drought and climate extremes has come to the forefront of planning for sustainable forest development. Reduced tree growth rates and increased tree mortality due to drought as a result of global warming have been reported to be on the increase worldwide [2,3]. Under drought conditions, trees do not simply react passively; rather, they gradually develop physiological and ecological resilience to withstand and recover from drought stress [4]. The resilience of forests to new conditions of climate change is mainly determined by their species composition, tree morphology, rooting depth, and leaf gas exchange [5]. Climatic influences on tree growth often exhibit lagged and persistent effects, which complicates the precise quantification of drought impacts on tree physiology and growth dynamics [6]; any further understanding of resilience within the time dimension is limited by a long time series. However, tree-ring technology offers an effective approach to overcoming this limitation, providing a solid theoretical foundation for exploring extreme climatic events and the physiological ecology of trees. When drought occurs, moisture-sensitive trees typically reduce their radial growth and return to pre-drought growth when precipitation subsequently increases [7]. Tree-ring analysis allows us to observe the interannual variation in tree growth in order to calculate tree resilience [8,9]. Some scholars have developed metrics of tree resilience, resistance, and recovery based on annual tree-ring width data from individual trees, aiming to quantitatively assess growth responses following disturbance events [10].
Tree resilience is spatially heterogeneous and interspecific [11,12]. Studies have shown that tree resilience arises from the complex interactions of multiple factors, including spatial heterogeneity of forest habitats, stand age and structure, interspecific competition, and tree species, all of which contribute to variability in resilience [13,14]. Characterizing spatial patterns of resilience is a prerequisite for interpreting and understanding drivers [15]. In the Amazon rainforest, trees in floodplains are less resilient to climate extremes than those in the highlands [16]. In eastern Tibet, China, the individual resistance and resilience of dominant tree species on shady slopes increases significantly with elevation, whereas those on sunny slopes show no significant variation across different altitudes [17]. The interspecificity of trees is also particularly evident in resilience. Some researchers studied the resilience of Qilian cypress and Chinese cypress to drought on the Tibetan Plateau and found that the regional tree resilience showed outstanding spatial heterogeneity; with the change of time, the areas of high resilience gradually expanded and exhibited a strong ability to recover in order to maintain the original state of the forest [18]. From a spatial perspective, ecological resilience in trees is primarily manifested through spatial patterns, where the resistance and recovery capacities of trees or forest ecosystems vary in response to local drought conditions that modulate these changes. Research conducted in the forested areas of north-central Minnesota, USA, demonstrates that climate change has contributed to a decline in tree resilience [19]. Over time, tree resilience in northeastern Spain has exhibited a gradual decline, potentially driven predominantly by factors such as tree size and the intensity of drought events [20]. Tree responses to drought constitute complex ecophysiological processes that lead to varying growth patterns among individual trees, influenced by external factors such as habitat conditions and competition, as well as internal factors including health status and genetic makeup [21].
As an important species for maintaining ecological balance in arid regions, research in Iran and the Heihe region of China has shown that Populus euphratica growth is sensitive to climate change and has experienced varying degrees of decline [22,23]. The desert riparian forests along the lower Tarim River in Xinjiang, China are predominantly composed of Populus euphratica, a species critical for sustaining ecological balance and safeguarding agricultural productivity in the oasis. However, in recent decades, Populus euphratica has undergone extensive decline and mortality, resulting in a significant degradation of its ecological functions [24,25]. Therefore, elucidating the relationship between the radial growth of Populus euphratica and hydrothermal conditions—along with its resistance and resilience under extreme drought events—is essential for guiding the conservation and restoration of degraded Populus euphratica forests. Building on this context, the present study addressed the following scientific questions using tree-ring samples from 87 individuals of Populus euphratica collected at four different sample sites along the lower Tarim River in Xinjiang, China: (1) to analyze the variation in radial growth and extract climatic signals embedded in the tree-ring width chronology; (2) to examine the relationship between radial growth and hydrothermal factors; and (3) to quantify the resistance and resilience of Populus euphratica to historical drought events. Clarifying these aspects can provide a scientific basis for the recovery and management of degraded Populus euphratica forests in the lower Tarim River region.

2. Materials and Methods

2.1. Overview of the Study Area

Situated in the Tarim Basin of Xinjiang, China, the Tarim River extends across the coordinates 41°03′–39°24′ N and 86°37′–88°30′ E (Figure 1). The Tarim River, recognized as China’s largest inland river, spans a length of 1321 km and drains a watershed covering approximately 1.02 million km2 [26]. The lower reaches of the Tarim River, situated between the Daxihaizi Reservoir and Lake Daitama, span an area of 2191 km2. This region serves as a vital “green corridor” that helps prevent the convergence of the Taklamakan and Kuruk Deserts [27]. The study area is located inland and encircled by mountains on three sides, characterized by a typical, but extremely arid, warm–temperate continental climate [28], with dry conditions and frequent aeolian activity. As one of the driest regions in China, the region receives very little annual precipitation (only 17.4–42 mm), which is mainly concentrated in the months of June–October, with high temperatures and annual potential evaporation of up to 2500–3000 mm [29]. The natural vegetation of the study area includes Populus euphratica, Tamarix ramosissima, Lycium ruthenicum, Halimodendron halodendron and Alhagi sparsifolia, Phragmites communis, Apocynum venetum, Karelinia caspica, Glycyrrhiza inflate, and others [30].

2.2. Sample Plot Design and Sampling Methods

Four sample sites of the lower Tarim River region were sampled in May 2023 at the Yingsu (YS), Kaerdayi (KE), Alagan (AL), and Yiganbujima (YG) sample sites. Sample plots were established adjacent to groundwater monitoring wells to better capture the relationship between the radial growth of Populus euphratica and groundwater dynamics. These monitoring wells are located at distances of 50 m, 150 m, 300 m, 500 m, 750 m, and 1050 m from the river and were distributed perpendicular to the river. For sampling purposes, we followed the fundamentals of dendrochronology [31], in which the samples were taken from mature, undisturbed, and healthy Populus euphratica trees with no abnormal growth. Using increment borers and the “cross-section method”, we took one sample core in each of the two directions at 1.0 m and 1.3 m from the base of the trees [32]. A total of 174 tree core samples were collected from 87 trees at four sampling sites, and the sampling information recorded is shown in Table 1.

2.3. Establishment of a Tree-Ring Chronology

After being transported to the laboratory, the cores were dried naturally in a shaded, well-ventilated environment to prevent deformation. They were then mounted in specially designed wooden trays, sanded with progressively finer sandpaper, and polished until the annual rings could be clearly observed under a microscope. The tree-ring widths of the Populus euphratica were then measured year by year using LINTABTM 6 (Rinntech GmbH, Heidelberg, Germany), a tree-ring analyzer with an accuracy of 0.001 mm. For accurate and reliable data, each sample was read twice. COFECHA 6.0 software was used to verify the quality of the tree-ring width readings, and sample cores having a low correlation with the master chronology were excluded [33]. This approach enhanced the precision and reliability of the dating results. Ultimately, 29 sample cores were excluded, and 145 cores were utilized for tree-ring chronology establishment. Finally, the negative exponential function implemented in the ARSTAN program was applied to model and remove the growth trend from the tree-ring width series [34]. Subsequently, the detrended series were standardized using the double-weighted averaging method, producing a standardized chronology of tree-ring widths for the four sample sites.

2.4. Meteorological Information

This study utilized the CRUTS4.05 grid data set within the range of 39°45′–40°25′ N, 87°40′–88°25′ E, with a resolution of 0.5° × 0.5°. Due to data completeness, the meteorological variables selected for this study include the average temperature, maximum temperature, minimum temperature, saturated vapor pressure deficit (VPD), and the Palmer Drought Severity Index (PDSI) for assessing drought severity (Figure 2) from 1958 to 2023. The aforementioned climatic data were sourced from the data-sharing platform of the Royal Netherlands Meteorological Institute (http://climexp.knmi.nl, accessed on 15 October 2023). Groundwater data were supplied by the Tarim River Basin Authority, Xinjiang, China.
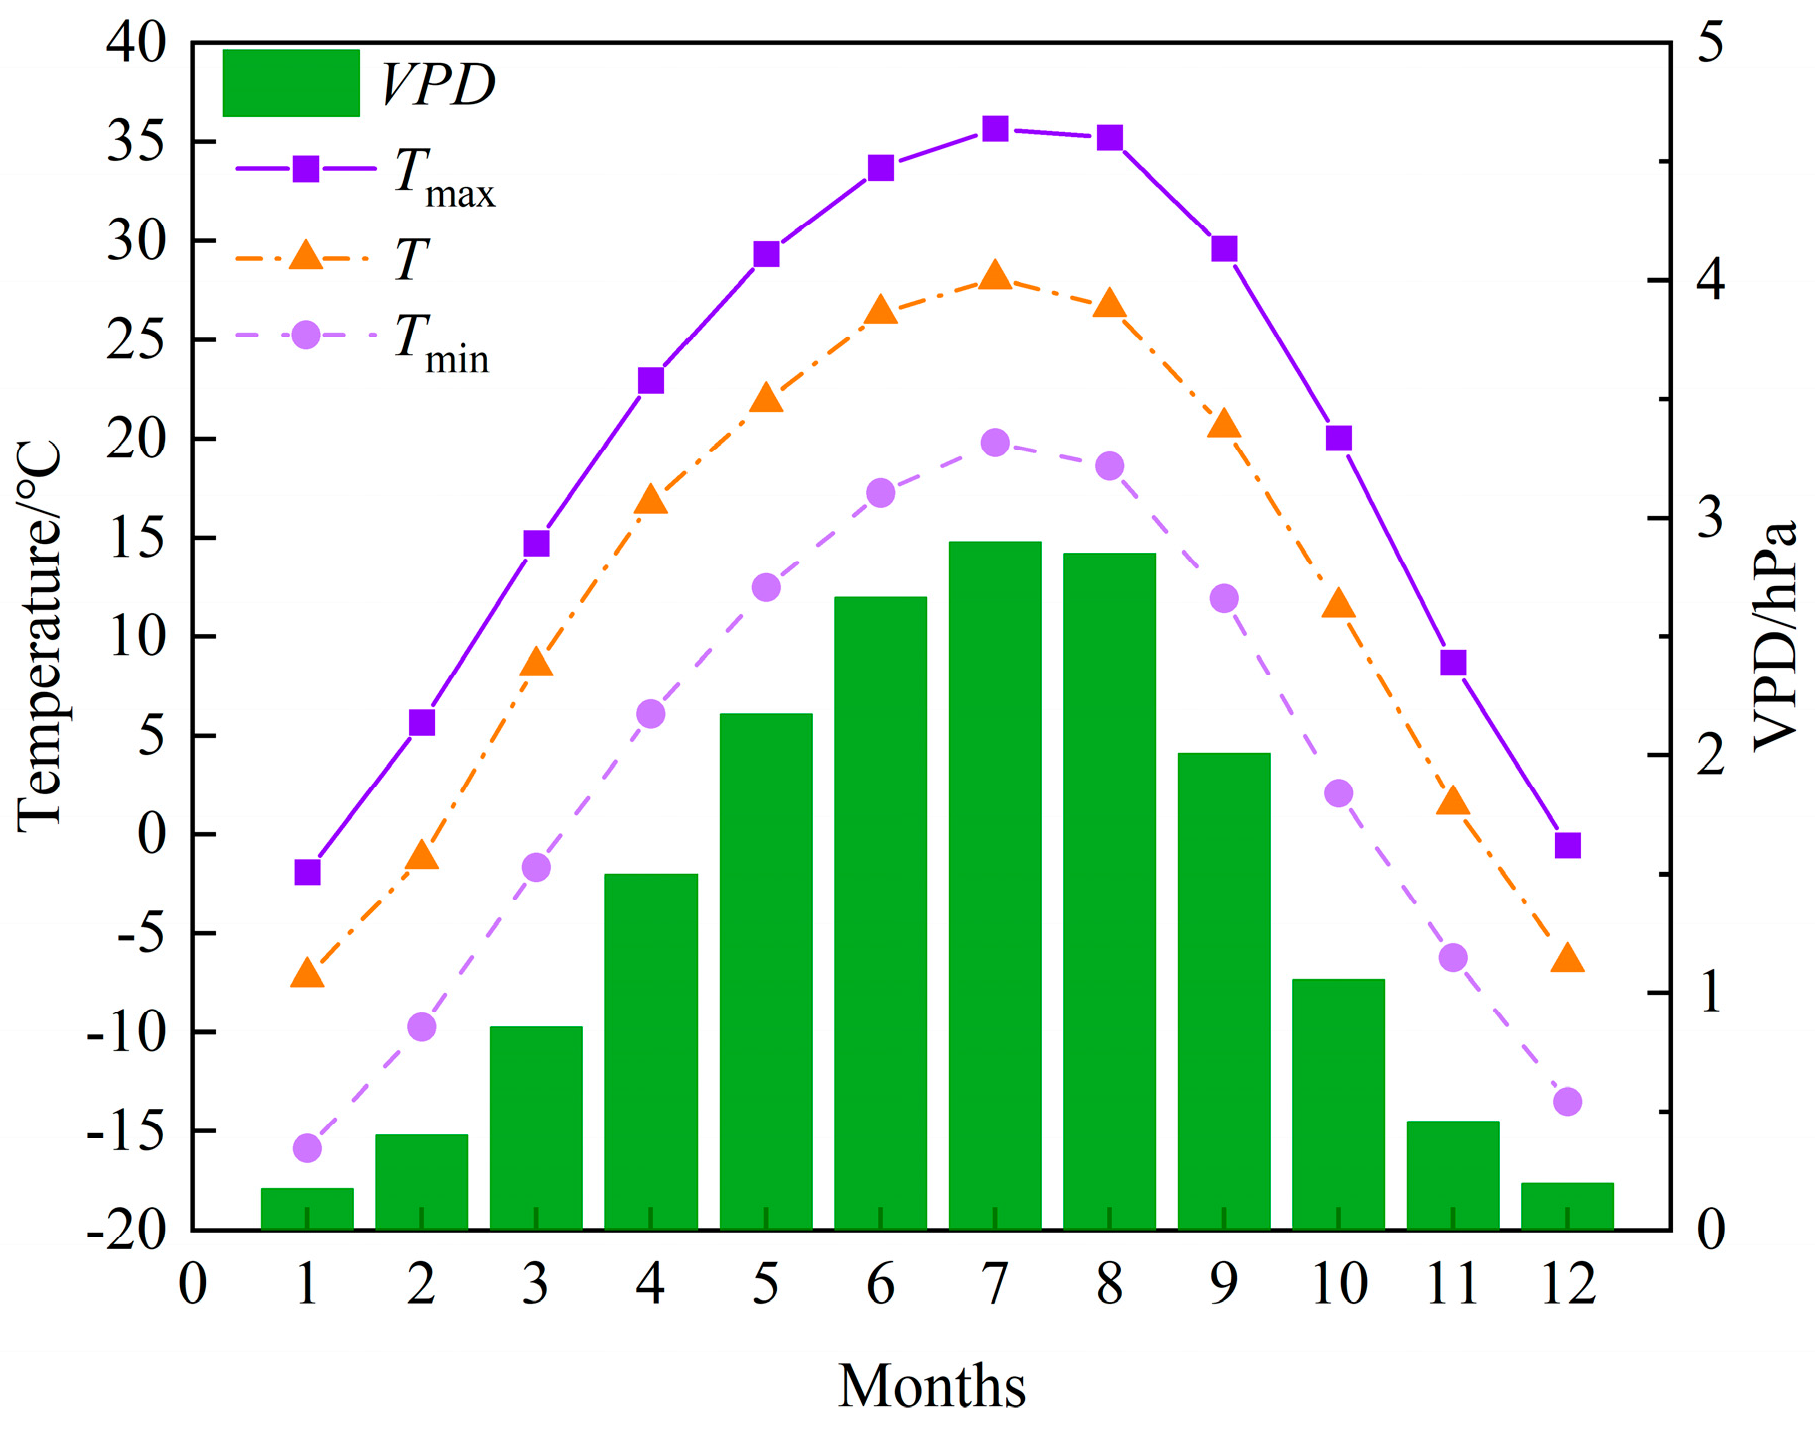
The lower Tarim River experiences high temperatures in summer from June to August, with the average of the highest temperature in July from 1958–2023 being 35.7 °C and the lowest temperature being 19.8 °C, averaging 28.1 °C. Winters are cold and dry, with January being the coldest month, with a maximum temperature of −1.9 °C and a minimum temperature of −15.8 °C. The VPD followed the same trend as the temperature factor, being high in summer and low in winter. The VPD reached 2.9 hPa in the summer, showing continuous drying. As the temperature decreased, the VPD also decreased.
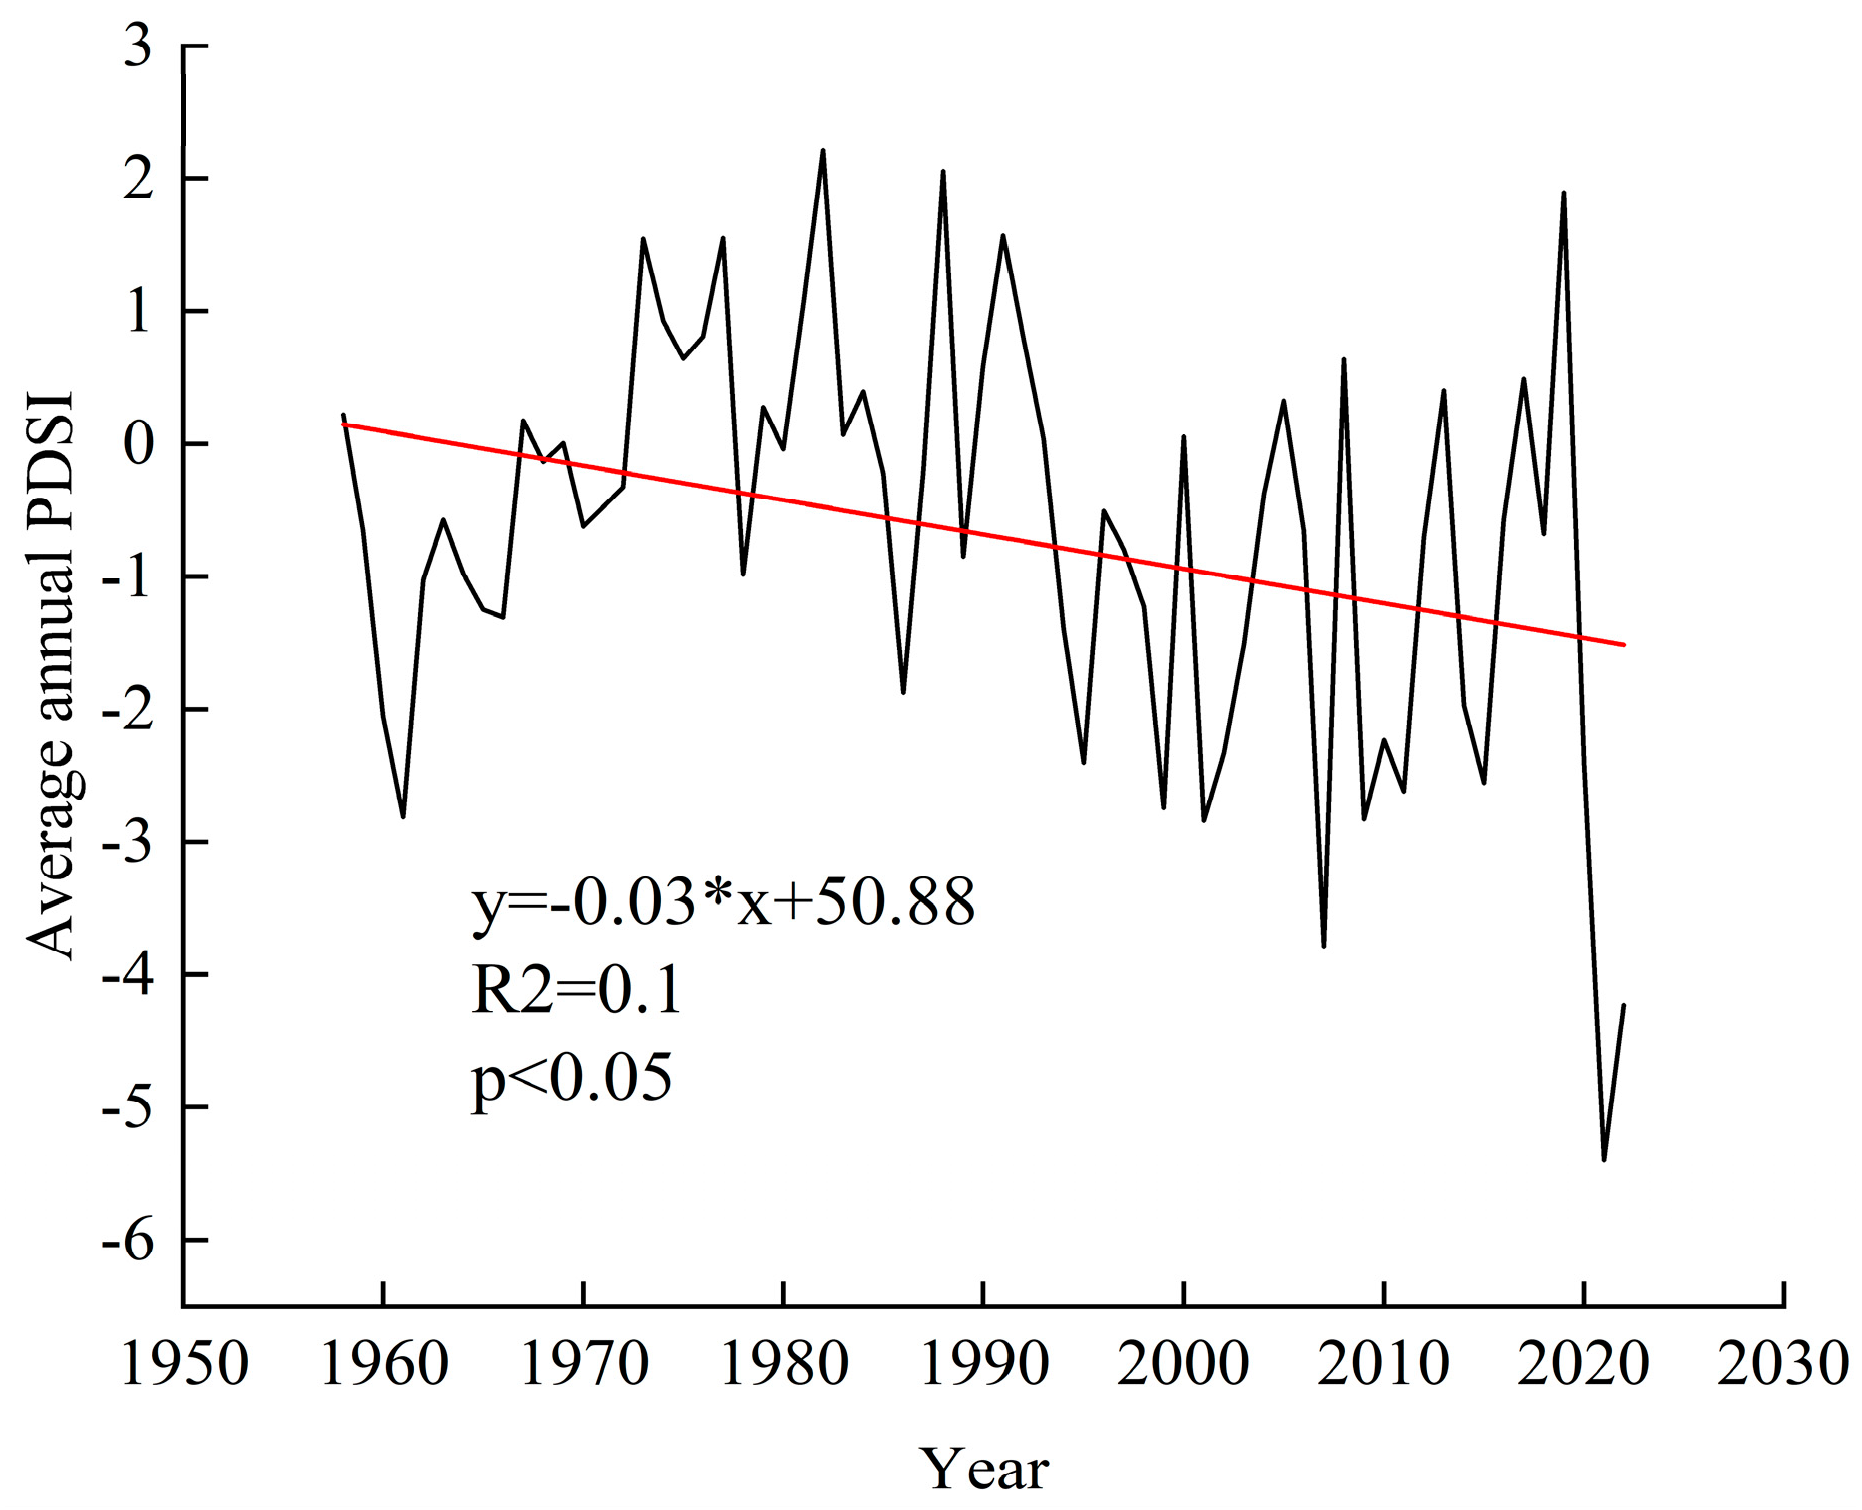
For this study, the PDSI was calculated as the average value spanning the growing seasons of the previous and current years (Figure 3). From 1958–2023, the values of the PDSI show an overall decreasing trend, indicating a gradual decrease in its atmospheric moisture supply and soil moisture. The PDSI value has been between −0.5 and 0.5 from 1970 to 1983, which is normal. After 1992, the PDSI declined more rapidly, reaching a minimum in 2021, between severe droughts.
Seasonal climate variables are defined as follows: pGS denotes the previous year’s growing season (March to November); GS refers to the current year’s growing season (March to November); pSp indicates the previous year’s spring (March to May); pSum represents the previous year’s summer (June to August); pAut corresponds to the previous year’s autumn (September to November); pWin covers the previous year’s winter, spanning December through February of the current year; SPR denotes spring of the current year (March to May); SUM refers to summer (June to August); and AUT represents autumn (September to November).

2.5. Resistance and Resilience Measurements

The resistance and resilience of the trees were calculated according to the formulae proposed by Lloret et al. [10]:
Rt = InGr/PreGb
Rc = PostGr/InGr
where Rt and Rc represent tree resistance and resilience, respectively. InGr denotes the tree-ring index value during the drought year, while PreGr and PostGr refer to the average tree-ring index values over the five years preceding and following the drought event, respectively. The resistance and resilience of each tree during the three drought events can be calculated according to the following criteria: trees with high resistance are those with Rt > 0.75, while trees with high resilience are those with Rc > 1.25.
Precipitation is very scarce in the lower Tarim River region, with perennial drought. The study used the PDSI to determine extreme drought at the regional scale. The average PDSI values for the previous and current year’s growing seasons were combined, taking into account the lag effect of tree growth. According to the drought rating criteria of the index: −0.5 < PDSI ≤ 0.5 indicates normal, −1 < PDSI ≤ −0.5 indicates first drought, −2 < PDSI ≤ −1 indicates mild drought, −3 < PDSI ≤ −2 indicates moderate drought, −4 < PDSI ≤ −3 indicates severe drought, and PDSI ≤ −4 indicates extreme drought. A smaller PDSI value means a drier climate.
Pearson’s correlation analysis was used to analyze the factors affecting the radial growth of Populus euphratica at different stand ages. Multiple linear regression models were constructed to analyze the factors influencing the resilience of Populus euphratica. Data analysis and graphing for the study was done using Excel 2010, SPSS (24.0.0.1) software, Origin 2019b software, and PS software.

3. Results

3.1. Chronological Characteristics

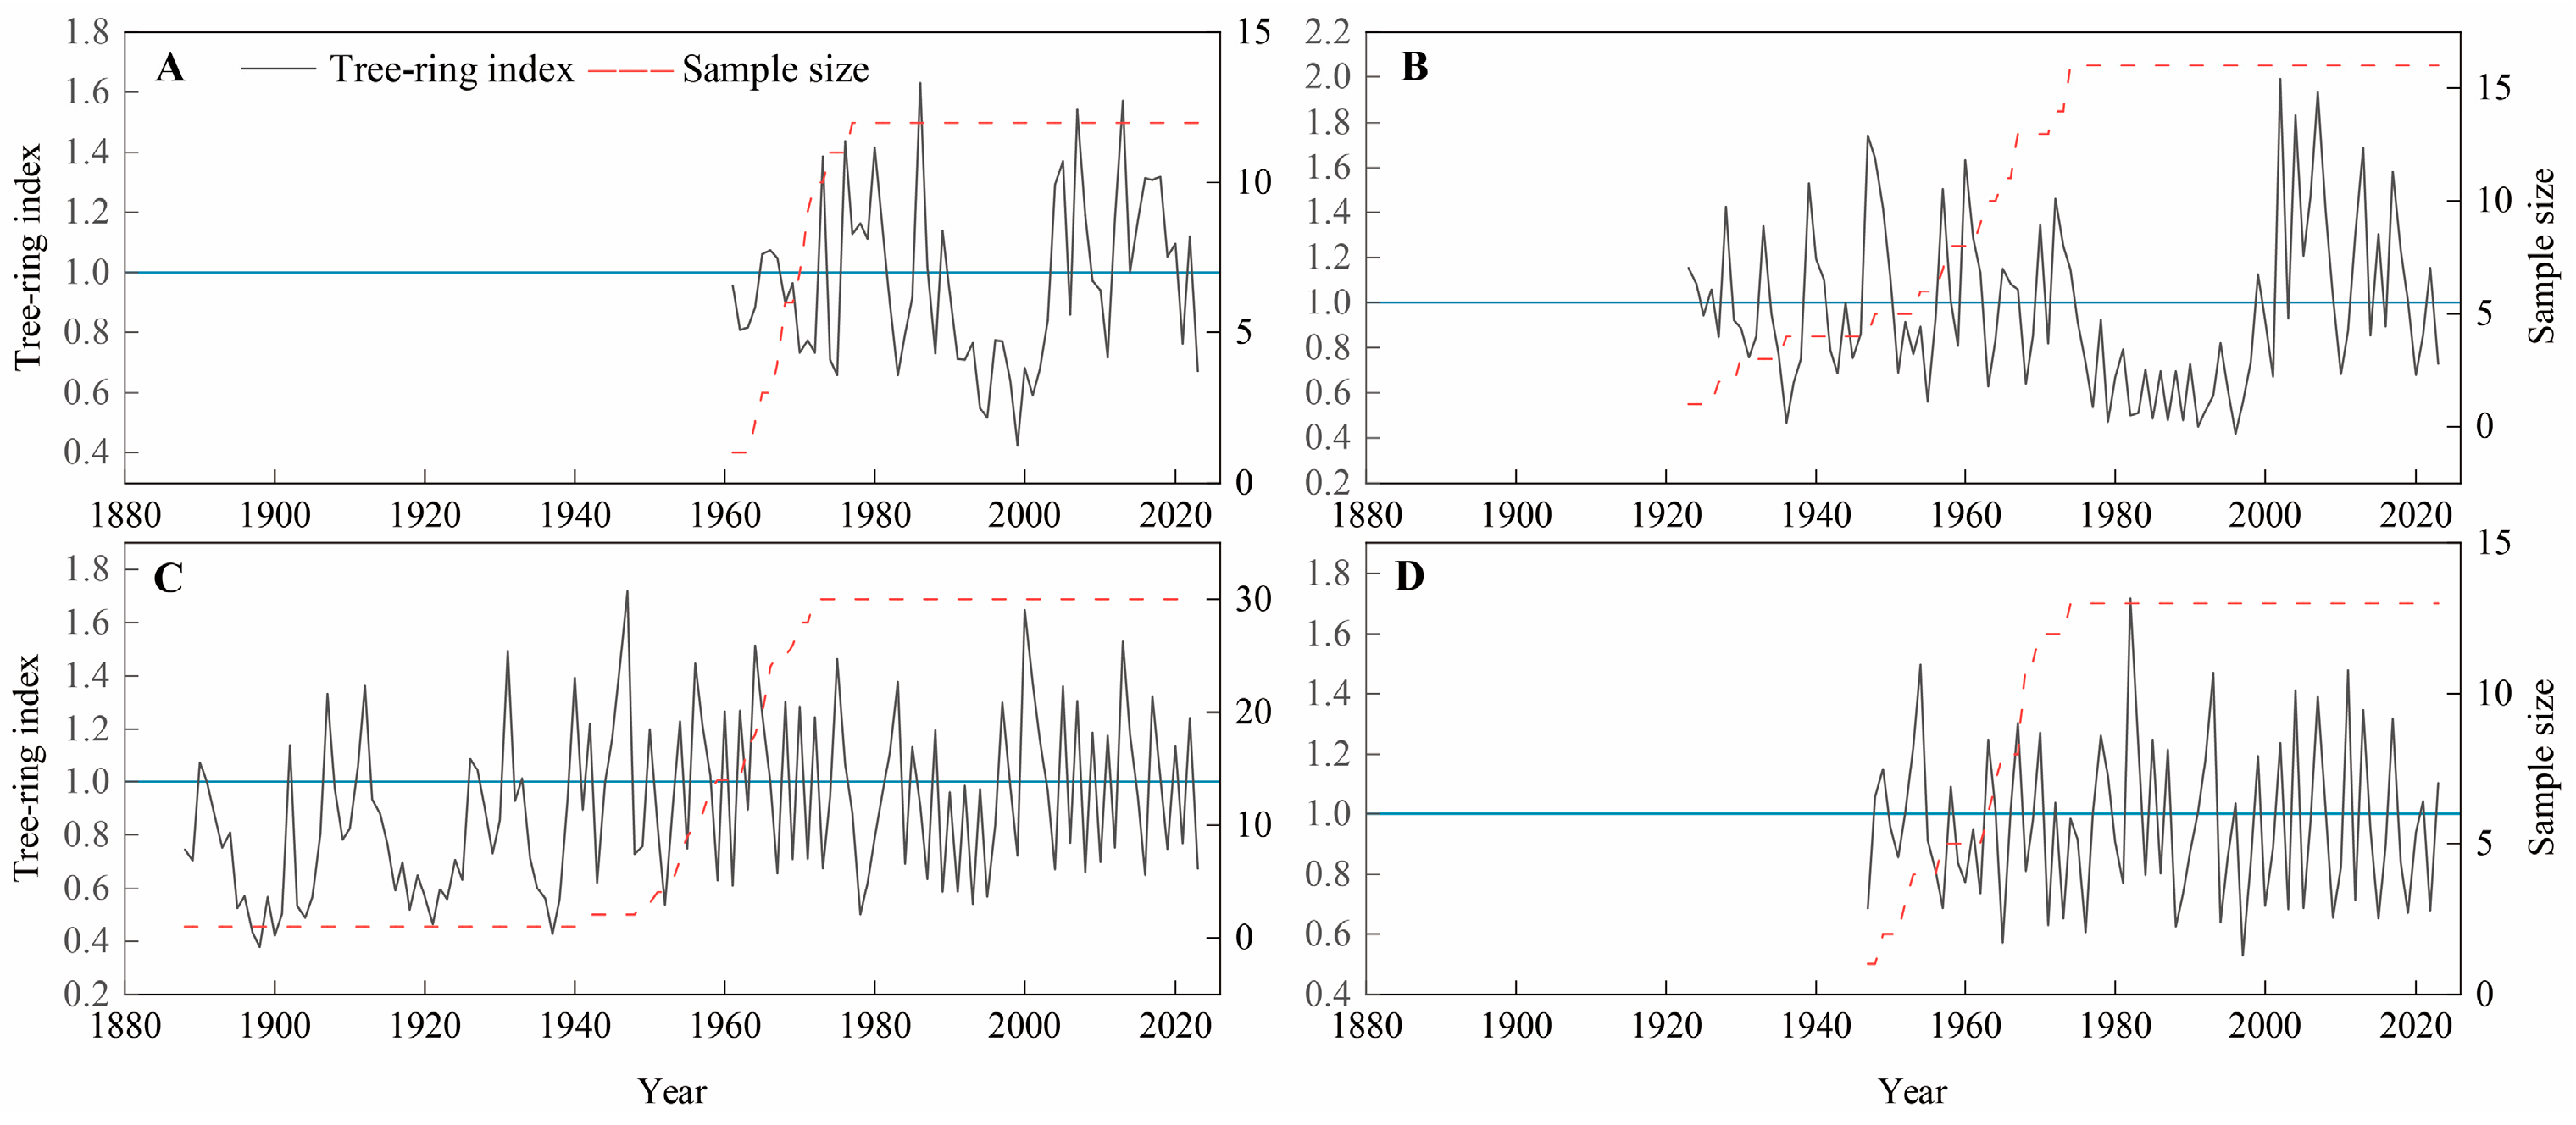
In this study, a standardized chronology was developed for four sampling sites along the lower Tarim River. The quality of this chronology is critical to the accuracy of subsequent analyses. In this study, the quality of the chronology was assessed using several statistical parameters, including standard deviation, mean sensitivity, signal-to-noise ratio (SNR), first-order autocorrelation, cragness coefficient, and the overall representativeness of the sample. Average sensitivity reflects the intensity of interannual variations in tree-ring width and represents the sensitivity of tree growth to interannual climate fluctuations. The correlation coefficients of the samples from the YS, KE, AL, and YG sample sites of the lower Tarim River region were 0.518, 0.578, 0.663, and 0.787, respectively, indicating that the tree-ring annual variation from the different sample sites has good consistency and that the data quality is good. The standard deviations were 0.23, 0.214, 0.206, and 0.262, respectively—all being greater than 0.2. These findings indicate that trees exhibit a pronounced reaction to alterations in climatic conditions. The signal-to-noise ratios of 15.065, 28.415, 42.182, and 21.811, respectively, had all reached a high level, indicating that the climate signals contained are relatively rich. The average sensitivities for the four sites were 0.281, 0.420, 0.477, and 0.419, respectively. Except for the YS section (0.281), all values exceeded 0.3, indicating a significant sensitivity of tree-ring width to climatic variability in the lower Tarim River region. The first-order autocorrelation coefficients were 0.375, 0.397, 0.112, and −0.191, respectively, which shows that the growth of all the trees in the current year was influenced by the growth of the trees in the previous year. The representativeness of all four transect samples was greater than 0.9, indicating that all four transect chronologies are a good representation of the basic characteristics of the variation in Populus euphratica tree-ring widths in the region. Overall, the chronology of Populus euphratica in the lower Tarim River region is of high quality and meets the requirements for dendrochronological studies. Variations in the tree-ring width index of Populus euphratica from the four sampling sites are shown in Figure 4. We can see that the AL section represents the longest time span of the Populus euphratica chronological sequence, with an effective chronological length of 131 years (1893–2023), while the YS section has the shortest effective chronological length of Populus euphratica, with 58 years (1966–2023). Among the four sample sites, the fluctuation of the Populus euphratica whorl width index was relatively smooth in section YG, and the fluctuation of the Populus euphratica whorl width index was the largest in section KE, indicating that the radial growth of Populus euphratica in section KE was more likely to be influenced by climatic factors than in the other sample sites.

3.2. Correlation Between Radial Growth and Hydrothermal Factors

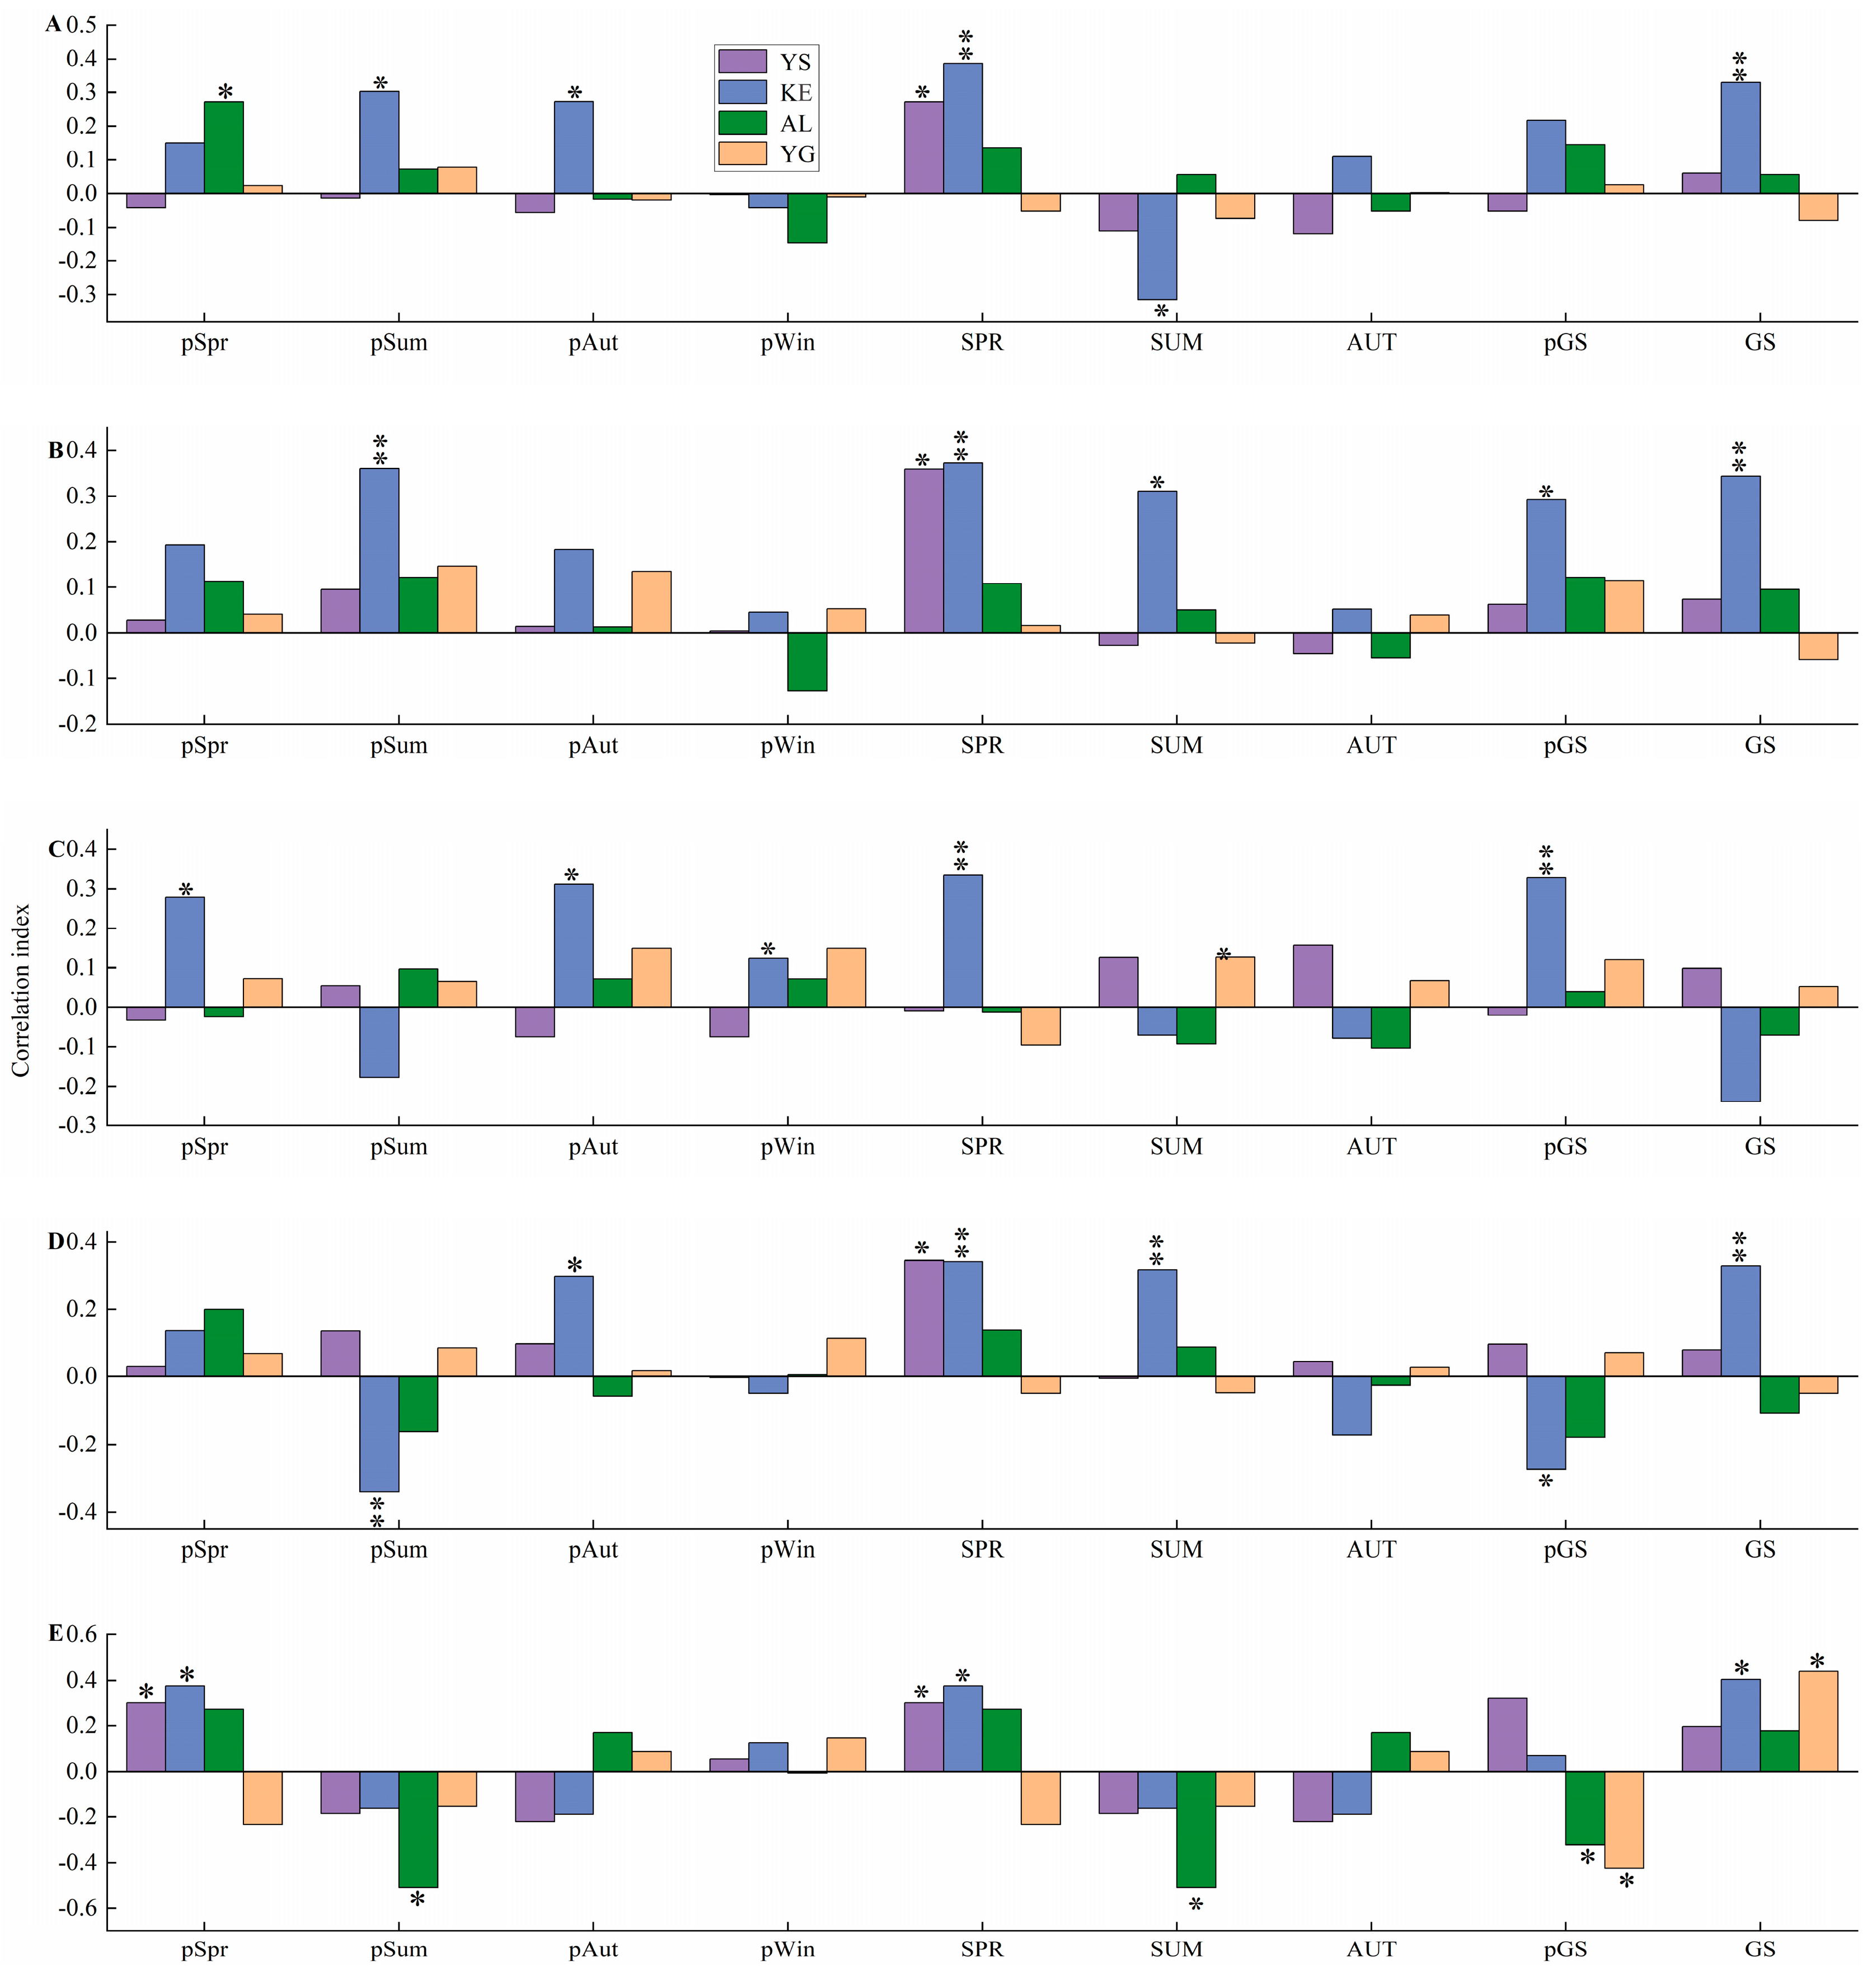
As shown in Figure 5, spring and growing season climatic variables—namely maximum, minimum, and mean temperatures, as well as the VPD—exerted the most significant positive effects on the growth of Populus euphratica. In the YS section, tree growth was significantly correlated (p < 0.05) with spring maximum and minimum temperatures, the mean temperature, and the VPD. In the KE section, correlations were highly significant (p < 0.01) with spring maximum and minimum temperatures, the Palmer Drought Severity Index (PDSI), and the VPD. Notably, Populus euphratica growth in KE exhibited a significant negative correlation with the maximum summer temperature, while that in AL was negatively correlated with the mean summer temperature (p < 0.05). In contrast, at the YS and YG sites, the response to extreme summer heat was generally weaker. In addition, temperature conditions in the previous year—particularly during spring and the growing season—also showed significant influence on the radial growth of Populus euphratica in the following year. Among the four sites, climate factors exerted stronger effects in YS and KE but had relatively limited influence in AL and especially in the most downstream site—YG.
Figure 6 illustrates the relationship between the radial growth of Populus euphratica and groundwater depth in the lower Tarim River region. Overall, all Populus euphratica individuals exhibited growth patterns related to groundwater burial depth: as the groundwater depth increased, radial growth progressively declined.

3.3. Status of and Factors Affecting Populus euphratica Resilience

Analysis of the statistical characteristics of the Populus euphratica chronology revealed that tree growth was influenced by meteorological and environmental conditions from the previous year. Therefore, the average Palmer Drought Severity Index (PDSI) combining the previous year and the current year’s growing season was selected as an indicator. Based on this, three mild drought events (1984, 1994, and 2015) and three moderate drought events (1998, 2001, and 2010) were identified for analysis (Table 2).
The resistance of Populus euphratica at the different sample sites of the lower Tarim River region in the face of drought events is shown in Figure 7A,B. In the face of mild drought events, the resistance of the different sample sites varied greatly, and the resistance of Populus euphratica in section KE was much higher than that of the other three sample sites, and Rt was higher than 1.1 in all three mild drought events, making it a high-resistance Populus euphratica forest and its section a high-resistance area. On a spatial scale, Populus euphratica resistance was lowest in section YG, where it was below 0.75 in all three drought events. In contrast, when faced with a moderate drought event, Populus euphratica resistance in the YS section was more stable, with a decreasing trend but a smaller decrease. In the KE section, however, Populus euphratica resistance declined extremely rapidly, from 1.22 for Populus euphratica resistance in the face of the first drought event to 0.81 in the second and to only 0.47 in the third drought event. From the spatial scale, the resistance of Populus euphratica in the YG section was greater than 0.75 in the face of three moderate drought events, defining it as a high-resistance area.
The resilience of Populus euphratica to drought events at the different sample sites is illustrated in Figure 7C,D. The resilience of YE transects in the face of mild drought events showed a decreasing trend on the time scale, and the resilience index was less than 1.25 in all three drought events. The resilience indices of the YG section and the Arakan section showed an increasing trend after experiencing a drought event. At the spatial scale, the resilience of Populus euphratica in the lower Tarim River region during the three drought events was lower than 1.25, which is a low-resilience area. Whereas the resilience of Populus euphratica in section KE was significantly higher than that of the other three sample sites in the face of moderate drought events, the overall resilience of Populus euphratica in sample sites YS and AL was smaller, and the resilience fluctuated more in the face of three moderate drought events. On a spatial scale, the resilience of Populus euphratica in the KE section was greater than 1.25 in all three drought events, which is a high-resilience area.
In this study, independent variables that had no or minimal effect on the radial growth of trees (p > 0.15) were excluded. Significant factors (p < 0.1) were retained, including the monthly mean temperature, maximum temperature, minimum temperature, vapor pressure deficit (VPD), and the Palmer Drought Severity Index (PDSI) for spring, summer, the growing season, the previous growing season, and the previous year’s spring, as well as groundwater-related variables. The effects of these environmental factors on the resistance and resilience of Populus euphratica were analyzed using multiple linear regression, through which an ecological resilience model for Populus euphratica was developed. The regression model for the resistance of Populus euphratica forests in the lower Tarim River region is as follows:
PRt > 0.75 = 1.887 + 0.052△PDSI − 0.354△UdW + 1.4△SPRVPD − 0.23△SUMVPD (p < 0.01, R2 = 0.37)
where UdW is the depth to groundwater and △ represents environmental factors that are always in flux. The same as below.
The resistance of Populus euphratica in the lower Tarim River region was found to be significantly influenced by the spring VPD and PDSI, the summer VPD, and groundwater fluctuations. These higher PDSI and VPD values, along with shallower groundwater depths during spring, were associated with increased tree resistance, whereas the elevated summer VPD had a negative effect on resistance.
The regression model for the resilience of Populus euphratica forests in the lower Tarim River region was:
PRc > 1.25 = 1.247 − 0.117△PDSI + 0.02△UdW (p < 0.01, R2 = 0.38)
The resilience of Populus euphratica in the lower Tarim River region was primarily and significantly related to the PDSI during the growing season and groundwater fluctuations in summer. Specifically, resilience decreased as the PDSI increased and groundwater levels declined in summer. In contrast, factors such as the VPD and temperature had minimal impact on the resilience of Populus euphratica.

4. Discussion

4.1. Differences in the Response of Populus euphratica Radial Growth to Hydrothermal Factors in Different Sample Sites

Correlation analysis between the radial growth of Populus euphratica and hydrothermal factors at four sample sites along the lower Tarim River revealed that groundwater was the primary factor influencing growth. This was followed by a significant positive correlation with spring temperatures, while summer temperatures showed a negative correlation with radial growth. Because the Populus euphratica begins to enter the growth period in the spring season, the growth of Populus euphratica needs sufficient water conditions to supply the expansion of xylem cells in order to guarantee the tree’s various physiological indicators as well as the accumulation of photosynthesis products [35,36]. If water conditions are not sufficient, the growth of trees will be limited, and similar phenomena have been found in studies of annual tree rings of Celle Populus euphratica [37] in Xinjiang, China, Lijiang spruce in Jade Dragon Snow Mountain, Yunnan, and Yunnan pine [38]. Summer is the dry season in the lower Tarim River region, and June is the active period for the differentiation of the Populus euphratica formation layer [39]. Under strong evaporation and high temperatures, the growth of Populus euphratica is affected by drought stress, which inhibits the activity of the formation layer and leads to a slowdown in the growth rate of Populus euphratica. On the other hand, the region’s summer rainfall is extremely low; high temperatures and low rainfall lead to an increased VPD and increased atmospheric drought and then make the surface soil lose moisture, resulting in increased soil drought stress—the stomata of the tree leaves close, the photosynthetic rate declines, and the accumulation of organic matter decreases, creating the phenomenon of ‘carbon starvation’ [17]. Trees need to open their stomata to absorb carbon dioxide for photosynthesis to produce organic matter and energy, but opening their stomata inevitably causes them to lose large amounts of water. Under dry conditions, trees close their stomata to conserve water, but this limits CO2 absorption, thereby reducing photosynthesis and carbon absorption, further inhibiting growth [40,41,42]. This is the reason why the temperature factor in summer was essentially and significantly negatively correlated with the radial growth of Populus euphratica. From different regions, the growth of Populus euphratica in the YS and KE sample sites was more sensitive to the response of hydrothermal factors compared with the other two sample sites. This may be due to the fact that the YS and KE transects are closer to the Daxihaizi Reservoir and are more abundantly supplied in terms of moisture than the other two transects, which leads to a more intense response to growth stress under drought and extreme temperature conditions.

4.2. Response of Populus euphratica Radial Growth to Extreme Drought Events in Different Sample Sites

We found that the resistance and resilience of Populus euphratica in the face of extreme drought events varied among the different sample sites, with two sample sites, YS and KE, having higher resistance and resilience than the other sample sites. This is because the resistance of trees increases with soil moisture and the vegetation index [43]. The YS and KE sample sites are close to the Daxihaizi Reservoir, with relatively high water replenishment. In addition, the age of the poplars in the YS section along the upper Tarim River was younger than that of Populus euphratica in all the other sample sites, especially in the YG section in the lowermost reaches, as inferred from the chronology. And younger trees tend to be more resilient [44]. This is because they grow faster, have relatively smaller root systems, consume fewer resources, and are therefore able to resume growth more quickly after disturbance. From the findings of the age structure of the stand, the YS and KE sample sites have better Populus euphratica growth and higher Populus euphratica numbers than the other two sample sites, resulting in higher Populus euphratica resistance than the YG and AL sample sites. The YG section in the most downstream part of the Tarim River region is difficult to recover to the original state after facing the disturbance of extreme drought events because its Populus euphratica forest shows a relatively decayed state and weak resilience after extreme drought events, which may be replaced by the nearby scrub when facing extreme events. However, it has been shown that the response of trees to extreme climatic events is not constant, as evidenced by the differential response of different growth stages to climatic extremes [45], which is an aspect that needs to be taken into account in future studies. In addition, it has also been shown that the response of trees to drought is nonlinear [46], which may involve population lag effects. Populus euphratica may exhibit a survival strategy of actively reducing radial growth and thus maintaining hydrodynamic security under extreme drought conditions, whereas growth slowdown during the recovery period may be an adjustment of resource allocation strategies rather than trunk biomass accumulation.

4.3. Water Management Plays an Important Regulatory Role in the Growth of Populus euphratica

The PDSI, VPD, and shallower groundwater burial depths in spring all promoted increased resistance in Populus euphratica in the lower Tarim River region, whereas the increased VPD in summer reduced tree resistance. The Tarim River starts to deliver water in spring every year, which is also the growing season of Populus euphratica and, thus, when the demand for water is relatively high. Because the high temperature in summer tends to accelerate the amount of water loss by soil evaporation and to increase the vapor pressure difference, the plant needs to consume a large amount of carbon in order to sustain its metabolism and to resist the effects of drought. This aggravates the carbon imbalance and inhibits the growth of the plant, resulting in the decline of Populus euphratica’s resistance [47,48]. In contrast, resilience was significantly associated mainly with the PDSI during the growing season and groundwater fluctuations during the summer, i.e., the resilience of Populus euphratica declined with an increasing PDSI during the growing season and a decreasing groundwater level during the summer. Because a mature Populus euphratica tree has an extremely well-developed root system, its conduits are stronger in their ability to transport water than the tubular structure of a young Populus euphratica tree [49], thus allowing the mature tree to transport more water to the canopy area to supply transpiration in atmospheric drought, effectively preventing its own water loss and leading to a lower sensitivity to saturated water vapor pressure. Despite the site-specific nature of this study, the results may reflect broader mechanisms by which plants achieve resilience under climatic stress. For example, one study found that changes in the water table in western North America directly affected tree recovery [50]. The season of water delivery and the amount of water delivered should be taken into account in the formulation of future forest management policies in order to improve the efficiency of water resource utilization and enhance the conservation and restoration of desert riparian forests in arid zones.

5. Conclusions

The analysis of relationships between tree-ring width and hydrothermal conditions at four sites along the lower Tarim River indicates that groundwater dynamics exert the most substantial influence on the radial growth of Populus euphratica. Among climatic variables, spring temperature exhibited a pronounced positive correlation with growth, suggesting that elevated early-season warmth may stimulate cambial activity and enhance wood production. Conversely, increased summer temperatures corresponded with reduced growth, likely due to heightened evaporative stress and restricted water availability during peak drought periods. Although the VPD and air temperature showed limited direct influence on the species’ drought resilience, two key factors—seasonal drought severity, as measured by the Palmer Drought Severity Index (PDSI), and summer groundwater fluctuations—were found to significantly impact recovery following stress events. Specifically, resilience declined under more severe drought conditions and with greater decreases in groundwater availability, underscoring the crucial buffering role of stable subsurface water resources. These findings highlight the ecological dependence of Populus euphratica on groundwater availability, emphasizing its function as a primary driver of both growth performance and post-drought recovery in arid riparian habitats These findings suggest that ecological water delivery schedules should prioritize spring replenishment to enhance Populus euphratica resistance in the most vulnerable downstream sites.

Author Contributions

Conceptualization, M.Y.; data curation, X.X. and Y.L.; fieldwork, W.C. and J.C.; methodology, M.Y. and X.X.; software, M.Y. and X.X.; validation, X.X. and Y.L.; project administration, M.Y.; writing—original draft, X.X.; writing—review and editing, X.X., X.P. and T.W. All authors have read and agreed to the published version of the manuscript.

Funding

This research was funded by the Ecological Monitoring Analysis of Altai Mountain State Forest Management Bureau (2021), grant No. 3010010251, and by the National Natural Science Foundation of China, grant No. 42377449.

Data Availability Statement

The data that support the findings of this study are available from the corresponding author upon reasonable request.

Conflicts of Interest

The authors declare no conflicts of interest.

References

  1. Trumbore, S.; Brando, P.; Hartmann, H. Forest health and global change. Science 2015, 349, 814–818. [Google Scholar] [CrossRef]
  2. Colangelo, M.; Camarero, J.J.; Borghetti, M.; Gazol, A.; Gentilesca, T.; Ripullone, F. Size matters a lot: Drought-affected Italian oaks are smaller and show lower growth prior to tree death. Front. Plant Sci. 2017, 8, 135. [Google Scholar] [CrossRef]
  3. O’Brien, M.J.; Leuzinger, S.; Philipson, C.D.; Tay, J.; Hector, A. Drought survival of tropical tree seedlings enhanced by non-structural carbohydrate levels. Nat. Clim. Change 2014, 4, 710–714. [Google Scholar] [CrossRef]
  4. Ludwig, D.; Walker, B.; Holling, C.S. Sustainability, stability, and resilience. Ecol. Soc. 1997, 1, 7. [Google Scholar] [CrossRef]
  5. Beedlow, P.A.; Lee, E.H.; Tingey, D.T.; Waschmann, R.S.; Burdick, C.A. The importance of seasonal temperature and moisture patterns on growth of Douglas-fir in western Oregon, USA. Agric. For. Meteorol. 2013, 169, 174–185. [Google Scholar] [CrossRef]
  6. Anderegg, W.R.L.; Kane, J.M.; Anderegg, L.D.L. Consequences of widespread tree mortality triggered by drought and temperature stress. Nat. Clim. Change 2012, 3, 30–36. [Google Scholar] [CrossRef]
  7. Cole, L.E.S.; Bhagwat, S.A.; Willis, K.J. Recovery and resilience of tropical forests after disturbance. Nat. Commun. 2014, 5, 3906. [Google Scholar] [CrossRef]
  8. Shen, J.Y.; Li, S.F.; Huang, X.B.; Wang, S.W.; Su, J.R. Ecological Resilience and Growth Degradation of Pinus yunnanensis at Different Altitudes in Jinsha River Basin. Linye Kexue 2020, 56, 1–11. [Google Scholar]
  9. Helman, D.; Osem, Y.; Yakir, D.; Lensky, I.M. Relationships between climate, topography, water use and productivity in two key Mediterranean forest types with different water-use strategies. Agric. For. Meteorol. 2017, 232, 319–330. [Google Scholar] [CrossRef]
  10. Lloret, F.; Keeling, E.G.; Sala, A. Components of tree resilience: Effects of successive low-growth episodes in old ponderosa pine forests. Oikos 2011, 120, 1909–1920. [Google Scholar] [CrossRef]
  11. Li, X.; Piao, S.; Wang, K.; Wang, X.; Wang, T.; Ciais, P.; Chen, A.; Lian, X.; Peng, S.; Peñuelas, J. Temporal trade-off between gymnosperm resistance and resilience increases forest sensitivity to extreme drought. Nat. Ecol. Evol. 2020, 4, 1075–1083. [Google Scholar] [CrossRef]
  12. Sánchez-Salguero, R.; Camarero, J.J.; Rozas, V.; Génova, M.; Olano, J.M.; Arzac, A.; Gazol, A.; Caminero, L.; Tejedor, E.; de Luis, M.; et al. Resist, recover or both? Growth plasticity in response to drought is geographically structured and linked to intraspecific variability in Pinus pinaster. J. Biogeogr. 2018, 45, 1126–1139. [Google Scholar] [CrossRef]
  13. Sun, S.J.; Lei, S.; Jia, H.S.; Li, C.; Zhang, J.; Meng, P. Tree-ring analysis reveals density-dependent vulnerability to drought in planted Mongolian pines. Forests 2020, 11, 98. [Google Scholar] [CrossRef]
  14. Lu, K.; Chen, N.; Zhang, C.; Dong, X.; Zhao, C. Drought enhances the role of competition in mediating the relationship between tree growth and climate in semi-arid areas of Northwest China. Forests 2019, 10, 804. [Google Scholar] [CrossRef]
  15. DeSoto, L.; Cailleret, M.; Sterck, F.; Jansen, S.; Kramer, K.; Robert, E.M.; Aakala, T.; Amoroso, M.M.; Bigler, C.; Camarero, J.J.; et al. Low growth resilience to drought is related to future mortality risk in trees. Nat. Commun. 2020, 11, 545. [Google Scholar] [CrossRef]
  16. Homeier, J.; Kurzatkowski, D.; Leuschner, C. Stand dynamics of the drought-affected floodplain forests of Araguaia River, Brazilian Amazon. For. Ecosyst 2017, 4, 1–10. [Google Scholar] [CrossRef]
  17. Zhong, Y.; Zheng, J.C.; Qiu, H.Y.; Lv, L.X. Differences in response of radial growth to extreme droughts for the mainconstructive tree species on sunny and shady slopes in eastern Tibett. Acta Ecol. Sin. 2024, 44, 1–10. [Google Scholar]
  18. Zhang, Q.B.; Fang, O.Y.; Lv, X.L. Study on tree-ring ecology on the Tibetan Plateau. In Ecological Studies on the Annual Rings of Trees on the Tibetan Plateau, 1st ed.; Li, D., Ed.; Science Publishing House: Beijing, China, 2019; pp. 58–63. [Google Scholar]
  19. Lucash, M.S.; Scheller, R.M.J.; Gustafson, E.; Sturtevant, B.R. Spatial resilience of forested landscapes under climate change and management. Landscape Ecol. 2017, 32, 953–969. [Google Scholar] [CrossRef]
  20. Serra-Maluquer, X.; Mencuccini, M.; Martínez-Vilalta, J. Changes in tree resistance, recovery and resilience across three successive extreme droughts in the northeast Iberian Peninsula. Oecologia 2018, 187, 343–354. [Google Scholar] [CrossRef]
  21. Willis, K.J.; Jeffers, E.S.; Tovar, C. What makes a terrestrial ecosystem resilient? Science 2018, 359, 988–989. [Google Scholar] [CrossRef]
  22. Calagari, M.; Ghasemi, R.A.; Bagheri, R. Growth comparison of Populus euphratica Oliv. provenances in research station of Karadj, Iran. Iran. J. For. Poplar Res. 2010, 18, 69–76. [Google Scholar]
  23. Qisen, L.; Qi, F.; Luxin, Z. Study of the height growth dynamic based on tree-ring data in Populus euphratica from the lower reach of the Heihe River, China. Dendrochronologia 2010, 28, 49–64. [Google Scholar] [CrossRef]
  24. Liu, J.; Chen, Y.; Chen, Y.; Zhang, N.; Li, W.H. Degradation of Populus euphratica community in the lower reaches of the Tarim River, xinjiang, China. J. Environ. Sci. 2005, 17, 740–747. [Google Scholar]
  25. Aishan, T.; Halik, Ü.; Betz, F.; Tiyip, T.; Ding, J.; Nuermaimaiti, Y.; Teyip, T. Stand structure and height-diameter relationship of a degraded Populus euphratica forest in the lower reaches of the Tarim River, Northwest China. J. Arid Land 2015, 7, 544–554. [Google Scholar] [CrossRef]
  26. Misson, L.; Rocheteau, A.; Rambal, S.; Ourcival, J.; Limousin, J.; Rodriguez, R. Functional changes in the control of carbon fluxes after 3 years of increased drought in a Mediterranean evergreen forest? Glob. Change Biol. 2010, 16, 2461–2475. [Google Scholar] [CrossRef]
  27. Xu, H.L.; Chen, Y.N.; Yang, G. Effect of Translating Water on Vegetation at the Lower Reaches of TarimRiver. Acta Ecologiga Sin. 2003, 4, 18–22. [Google Scholar]
  28. WuBuyer, B.; Jiang, T.A.; Halik, M.; Wang, H.J.; Wang, N.; Jiang, W. Carbon storage and allocation characteristics of natural Populus euphratica forestsin the lower Tarim River. J. Forest. Environ. 2023, 43, 363–370. [Google Scholar]
  29. Chen, Y.N.; Wumaierjiang, W.; Aikeremu, A.; Cheng, Y.; Chen, Y.P. Monitoring and analysis of ecological benefits of water conveyancein the lower reaches of Tarim River in recent 20 years. Arid. Zone Geo. 2021, 44, 605–611. [Google Scholar]
  30. Wang, S.D.; Gao, Q.Z.; Pulati, S.; Xu, M.; Mao, W.Y.; Sheng, Y.P. Maintaining and concerning the life health of Tarim River:Connotation and Diagnoses for the Life Health of Tarim River. J. Arid. Land. 2008, 4, 594–603. [Google Scholar]
  31. Stokes, M.A.; Smiley, T.L. An Introduction to Tree-Ring Dating; University of Arizona Press: Tucson, AZ, USA, 1968. [Google Scholar]
  32. Zhang, Y.; Ye, M. Sensitivity Analysis of P, euphratica Radial Growth to Groundwater Changes in the Different Transects of the Lower Reaches of Tarim River. Acta Bot. Boreali-Occident. Sin. 2016, 36, 818–824. [Google Scholar]
  33. Grissino-Mayer, H.D. Evaluating crossdating accuracy: A manual and tutorial for the computer program COFECHA. Tree-Ring Res. 2001, 52, 205–221. [Google Scholar]
  34. Cook, E.R.; Krusic, P.J. Program ARSTAN: A Tree-Ring Standardization Program Based on Detrending and Autoregressive Time Series Modeling, with Interactive Graphics; Lamont-Doherty Earth Observatory, Columbia University: Palisades, NY, USA, 2005. [Google Scholar]
  35. Gruber, A.; Strobl, S.; Veit, B.; Oberhuber, W. Impact of drought on the temporal dynamics of wood formation in Pinus sylvestris. Tree Physiol. 2010, 30, 490–501. [Google Scholar] [CrossRef]
  36. Bi, Y.; Xu, J.; Gebrekirstos, A.; Guo, L.; Zhao, M.; Liang, E.; Yang, X. Assessing drought variability since 1650 AD from tree-rings on the Jade Dragon Snow Mountain, southwest China. Int. J. Climatol. 2015, 35, 4057–4065. [Google Scholar] [CrossRef]
  37. Qi, Y.Y.; Baierdang, K.Y.M.; Li, Z.S.; Zeng, F.J. Radial growth response of Populus euphratica to climate change in the Cele desert oasis ecotone, China. J. Appl. Ecol. 2024, 35, 1187–1195. [Google Scholar]
  38. Yang, W.Q.; Fan, Z.X.; Li, Z.S.; Wen, Q.Z. Radial growth of Pinus yunnanensis at different elevations and their responses toclimatic factors in the Yulong Snow Mountain, Northwest Yunnan, China. Acta Ecol. Sin 2018, 38, 8983–8991. [Google Scholar]
  39. He, Q.Z.; Ye, M.; Pan, X.T.; Zhao, F.F.; Zhang, K.L. Xylem formation of Populus euphratica and its response to water heat factors in the lower reaches of Tarim Riyer, China. J. Appl. Ecol. 2023, 34, 1244–1252. [Google Scholar]
  40. Li, T.; He, X.Y.; Chen, Z.J. Tree-ring growth responses of Mongolian oak (Quercus mongolica) to climate change in southern Northeast: A case study in Qianshan Mountains. J. Appl. Ecol. 2014, 25, 1841–1844. [Google Scholar]
  41. Han, J.S.; Zhao, H.Y.; Zhu, L.D.; Zhang, Y.D.; Wang, X.C. Comparing the responses of radial growth between Quercus mongolica and Phellodendron amurense to climate change in Xiaoxing’an Mountains, China. J. Appl. Ecol. 2019, 30, 2218–2230. [Google Scholar]
  42. Fan, Z.X.; Bräuning, A.; Cao, K.F.; Zhu, S.D. Growth–climate responses of high-elevation conifers in the central Hengduan Mountains, southwestern China. For. Ecol. Manag. 2009, 258, 306–313. [Google Scholar] [CrossRef]
  43. Gazol, A.; Camarero, J.J.; Vicente-Serrano, S.M.; Sánchez-Salguero, R.; Gutiérrez, E.; de Luis, M.; Sangüesa-Barreda, G.; Novak, K.; Rozas, V.; Tíscar, P.A.; et al. Forest resilience to drought varies across biomes. Glob. Chang. Biol. 2018, 24, 2143–2158. [Google Scholar] [CrossRef]
  44. Millar, C.I.; Stephenson, N.L.; Stephens, S.L. Climate change and forests of the future: Managing in the face of uncertainty. Ecol. Appl. 2007, 17, 2145–2151. [Google Scholar] [CrossRef]
  45. Qiu, T.; Sharma, S.; Woodall, C.W.; Clark, J.S. Niche shifts from trees to fecundity to recruitment that determine species response to climate change. Front. Ecol. Evol. 2021, 9, 719141. [Google Scholar] [CrossRef]
  46. Hanbury-Brown, A.R.; Powell, T.L.; Muller-Landau, H.C.; Wright, S.J.; Kueppers, L.M. Simulating environmentally-sensitive tree recruitment in vegetation demographic models. New Phytol. 2022, 235, 78–93. [Google Scholar] [CrossRef] [PubMed]
  47. Song, F.S.; Fang, O.Y. Research on history of Juniperus tibetica growth declinein Three-River-Source National Park. J. Forest. Environ. 2019, 39, 386–392. [Google Scholar]
  48. Adams, H.D.; Germino, M.J.; Breshears, D.D.; Barron-Gafford, G.A.; Guardiola-Claramonte, M.; Zou, C.B.; Huxman, T.E. Nonstructural leaf carbohydrate dynamics of P inus edulis during drought-induced tree mortality reveal role for carbon metabolism in mortality mechanism. New Phytol. 2013, 197, 1142–1151. [Google Scholar] [CrossRef]
  49. Bond, W. The tortoise and the hare: Ecology of angiosperm dominance and gymnosperm persistenc. Biol. J. Linn. Soc. Lond. 1989, 36, 227–249. [Google Scholar] [CrossRef]
  50. Johnston, D.B.; Cooper, D.J.; Hobbs, N.T. Relationships between groundwater use, water table, and recovery of willow on Yellowstone’s northern range. Ecosphere 2011, 2, 1–11. [Google Scholar] [CrossRef]
Figure 1. Overview map of the study area.
Forests 16 01311 g001
Figure 2. Monthly maximum, minimum, and average temperatures (°C) and monthly average VPD (hPa) for the period 1958–2023.
Forests 16 01311 g002
Figure 3. Interannual changes of the PDSI in the study area.
Forests 16 01311 g003
Figure 4. Tree-ring index for Populus euphratica. (A) YS sample site; (B) KE sample site; (C) AL sample site; and (D) YG sample site.
Forests 16 01311 g004
Figure 5. Pearson correlation analysis of radial growth of Populus euphratica at different sampling sites and climatic factors. Correlation of Populus euphratica radial growth with (A) seasonal maximum air temperature, (B) seasonal minimum air temperature, (C) seasonal PDSI, (D) seasonal VPD, and (E) seasonal mean air temperature in different sample sites. ** indicates highly significant difference at p < 0.01; * indicates significant difference at p < 0.05.
Forests 16 01311 g005
Figure 6. Regression analysis of radial growth of Populus euphratica and groundwater depth. ** indicates highly significant differences at the p < 0.01 level.
Forests 16 01311 g006
Figure 7. Resistance and resilience of Populus euphratica to extreme drought events at different sample sites. (A) is the resistance of Populus euphratica in the face of a mild drought event; (B) is the resistance of Populus euphratica in the face of a moderate drought event; (C) is the resilience of Populus euphratica in the face of a mild drought event; and (D) is the resilience of Populus euphratica in the face of a moderate drought event.
Forests 16 01311 g007
Table 1. Sampling information record sheet.
Cross-SectionalLongitudeLatitudeAverage Chest Diameter/cmMonitoring WellNumber of Cores
YS87°56′ E40°25′ N42.41 ± 13.09F1, F2, F1034
KE88°10′ E40°22′ N39.07 ± 8.79G1, G542
AL88°20′ E40°8′ N37.33 ± 12.46H1-H562
YG88°22′ E39°47′ N34.27 ± 4.63I1, I236
Table 2. Drought years and severity of drought.
YearDegree of DroughtPDSI Last YearPDSI for That Year’s Growing Season
1984mild drought−0.72−0.89
1994mild drought−2.23−1.39
1998moderate drought−1.79−2.23
2001moderate drought−3.63−2.84
2010moderate drought−2.22−2.26
2015mild drought−1.23−1.55
Disclaimer/Publisher’s Note: The statements, opinions and data contained in all publications are solely those of the individual author(s) and contributor(s) and not of MDPI and/or the editor(s). MDPI and/or the editor(s) disclaim responsibility for any injury to people or property resulting from any ideas, methods, instructions or products referred to in the content.