Article

Understory Plant Diversity in Cunninghamia lanceolata (Lamb.) Hook. Plantations Under Different Mixed Planting Patterns

1
Co-Innovation Center for Sustainable Forestry in Southern China, Nanjing Forestry University, Nanjing 210037, China
2
Jiangsu Provincial Key Laboratory of Soil Erosion and Ecological Restoration, Nanjing Forestry University, Nanjing 210037, China
*
Author to whom correspondence should be addressed.
Forests 2025, 16(8), 1290; https://doi.org/10.3390/f16081290 (registering DOI)
Submission received: 12 June 2025 / Revised: 4 August 2025 / Accepted: 5 August 2025 / Published: 7 August 2025
(This article belongs to the Section Forest Biodiversity)

Abstract

The composition and structure of understory plants are crucial for forest ecosystem succession and stability. This study examined the impact of various Cunninghamia lanceolata mixed plantation patterns on understory biodiversity, aiming to provide a theoretical foundation for sustainable management. Six patterns were evaluated using sample plots at Guanshan Forest Farm in Jiangxi Province, China. Understory vegetation diversity, biomass, and soil properties—including total nitrogen, available nitrogen, total phosphorus, available phosphorus, total potassium, available potassium, soil organic matter, and pH—were quantitatively analyzed. Significant differences in diversity among the patterns were revealed. The ‘Cunninghamia lanceolata + Phoebe bournei (Hemsl.) Yen C. Yang + Schima superba Gardner & Champ’ mixed plantation exhibited the most pronounced enhancement of understory plant diversity, whereas the ‘C. lanceolata + Liquidambar formosana Hance’ pattern demonstrated the least significant effects among all treatments. Significant correlations were detected between soil nutrients and diversity indices. Mixed patterns enhance diversity through expanded ecological niches and optimized microenvironments, thereby strengthening ecological functions and management efficiency.

1. Introduction

Forest resources underpin human well-being, yet overexploitation has triggered a global transition from natural forests to plantations as primary timber sources. Monoculture plantation expansion and intensive management disrupt fundamental ecosystem processes, including nutrient cycling and productivity. Within these systems, understory vegetation critically mediates biogeochemical cycles and ecosystem dynamics [1,2,3].
Cunninghamia lanceolata plantations cover 10 million hectares, accounting for 27.23% of China’s total planted forest area and 32.57% of the total plantation timber volume. Both metrics rank first among all major plantation tree species in China [4]. While traditionally managed as monocultures, current silviculture increasingly incorporates native broadleaves through mixed-species regimes. This approach aligns with close-to-nature management principles to enhance biodiversity, ecosystem stability, and long-term sustainability [5,6,7,8,9]. Empirical studies confirm that mixed stands improve soil properties (organic matter accumulation, structural heterogeneity), microbial activity, and ecosystem functionality relative to pure stands [10,11,12,13]. For instance, mixed forests in Bai Mountain National Park elevate understory species richness and Shannon diversity [10], while those in Tianmu Mountain exhibit greater spatial heterogeneity in soil nutrients [13]. Critically, understory communities respond strongly to edaphic factors (organic matter, phosphorus, pH, nitrogen) [14,15,16], which mixed plantations modulate, notably enhancing topsoil available nitrogen and net N-mineralization rates [17,18].
Despite these documented benefits, critical knowledge gaps persist regarding mixed plantations’ impacts on C. lanceolata understory ecosystems. Existing research predominantly examines pure C. lanceolata stands, neglecting diverse mixed configurations [19,20,21,22,23]. Although isolated studies address factors like species mixing ratios (peak shrub-layer dominance at 50%–60% C. lanceolata density [24]) or silvicultural interventions (selective logging effects [25]), findings remain fragmented. A fundamental limitation is the unclear mechanistic linkage between mixed planting, abiotic drivers (particularly soil properties), and understory community feedback [26]. Current analyses often focus on isolated variables (biomass, single-nutrient metrics) [19,24,27,28], lacking integrated assessment of biotic–abiotic interactions. Long-term effects also remain poorly constrained despite evidence that heterogeneous mixed-age stands enhance growth resilience [26].
To address these limitations, we systematically evaluated six distinct C. lanceolata–broad-leaved mixed regimes at Guanshan Forest Farm, Jiangxi Province. This study integrated C. lanceolata plantations with native broad-leaved species to compare mixing patterns, focusing on their effects on understory plant diversity. Our objectives were to (1) quantify impacts on understory community composition, species diversity, and biomass, and (2) identify key environmental drivers—particularly soil physicochemical properties—shaping these communities using multivariate analysis. By exploring linkages between mixing patterns, plant composition, and soil properties, this integrated approach elucidates mechanistic relationships between silvicultural regimes and understory responses, providing a foundation for near-natural, sustainable management of C. lanceolata plantations.

2. Materials and Methods

2.1. Study Area

The study was conducted at the Jiangxi Guanshan Forest Farm (115°17′–115°56′ E, 26°38′–27°32′ N), established in 1963 as a demonstration area for close-to-nature forestry practices integrating artificial afforestation with natural succession. The terrain within the Dazhoushan Sub-farm, where sampling occurred, is characterized by hilly and mountainous topography. The region experiences a subtropical monsoon climate with a mean annual temperature of 18.0 °C, a frost-free period of 279 days, and an accumulated temperature ≥ 10 °C of 5600 °C·d. Mean annual precipitation is 1627.3 mm, predominantly concentrated during the rainy season from March to June, with an annual sunshine duration of 1897 h. The predominant zonal soil type is ferralitic red soil, accounting for 76.3% of the forest farm’s area [6]. These favorable natural conditions establish the area as a core production zone for C. lanceolata and Phyllostachys edulis (Carrière) J. Houz. in Jiangxi Province.

2.2. Plot Establishment

Field sampling was carried out in August 2020. Six common mixed plantation patterns of C. lanceolata, sharing comparable soil types, site conditions, and C. lanceolata provenance, were selected within the Dazhoushan Sub-farm: ‘C. lanceolata + L. formosana’ (T1), ‘C. lanceolata + P. bournei’ (T2), ‘C. lanceolata + P. bournei + L. formosana’ (T3), ‘C. lanceolata + P. bournei + S. superba’ (T4), ‘C. lanceolata + P. bournei + Castanopsis fissa (Champ. ex Benth.) Rehder & E. H. Wilson in Sarg.’ (T5), and ‘C. lanceolata + P. bournei + Pinus elliottii Engelm.’ (T6). Three replicate plots, each measuring approximately 100 m × 100 m, were established for each mixed pattern, resulting in a total of 18 study plots. Within each large plot, three standard monitoring quadrats of 20 m × 20 m were systematically positioned, yielding a total of 54 standard quadrats. Stand characteristics for each mixed pattern are detailed in Table 1.

2.3. Survey and Calculation of Understory Vegetation Diversity and Biomass

Within each 20 m × 20 m standard quadrat, understory vegetation assessment employed a nested sub-quadrat design. Five 5 m × 5 m sub-quarats were established: one positioned at the geometric center and one at each of the four corners (Figure 1).
Within each of these 5 m × 5 m sub-quadrats, species composition and abundance within both the shrub and herb layers were meticulously recorded. Layer-specific vegetation coverage was quantified using the vertical projection method with calibrated fiberglass tapes [29]. The aboveground biomass of the shrub and herb layers was determined using the harvest method. All aboveground plant material within each 5 m × 5 m sub-quadrat was completely harvested, transported to the laboratory, and oven-dried at 65 °C until a constant weight was achieved to determine dry biomass. The total aboveground understory biomass per subplot was calculated as the sum of the shrub and herb layer biomasses. Non-clonal plants were enumerated as distinct genetic individuals (genets). For clonal species, spatially discrete ramets emerging at least 10 cm from parental stems were counted as separate individuals to ensure physiological independence. For mat-forming clonal species, percentage cover was estimated within each 1 m × 1 m quadrat using a 25-point grid intercept method; these cover estimates were validated through destructive biomass sampling of three randomly placed 20 cm × 20 cm sub-quadrats per site, which were similarly dried and weighed. The species diversity indexes included important values, Shannon–Wiener diversity index (H), Simpson dominance index (D), Pielou community evenness index (E), and Margalef richness index (S’). The formulae used were as follows:
Plant Importance Value = (Relative Density + Relative Frequency + Relative Coverage)/3
H = i = 1 S P i l n P i
D = 1     i = 1 S P i 2
E = H/lnS
S’ = (S − 1)/lnN
In the formulae, the relative abundance of species i ( P i ) is defined as the ratio of its individual count (Nᵢ) to the total number of individuals (N), while S denotes the total species richness.

2.4. Soil Sample Collection

Soil samples were collected from 0–20 cm, 20–40 cm, and 40–60 cm depth layers, with three replicates per layer, yielding 162 total samples. Immediately after collection, samples were placed into sealed polyethylene bags to preserve moisture and minimize disturbance. In the laboratory, samples were air-dried at a controlled ambient temperature (25 ± 2 °C). Visible extraneous materials such as roots, stones, and gravel were carefully removed. The air-dried soil was then ground and sequentially sieved through 100-mesh (0.15 mm aperture) and 300-mesh (0.05 mm aperture) standard sieves for subsequent chemical analyses.

2.5. Determination of Soil Nutrient Indices

Soil pH was measured potentiometrically in a 1:2.5 (w/v) soil–water suspension using a PHS-3E pH meter (Shanghai Yidian Scientific Instrument Co., Ltd., Shanghai, China). Total nitrogen (TN) content was determined using dry combustion on an Elementar Vario C/N elemental analyzer (Elementar Analysensysteme GmbH, Langenselbold, Germany) [30]. Soil organic matter (SOM) content was calculated by multiplying the measured total organic carbon (TOC) content by the empirical conversion factor of 1.72 [31]. Total phosphorus (TP) was quantified following alkali fusion digestion of the soil samples. Total potassium (TK) concentrations were determined after acid dissolution digestion. Hydrolyzable nitrogen (HN) was assessed using the alkali diffusion method. Available phosphorus (AP) was extracted with 0.5 M sodium bicarbonate (NaHCO3, pH 8.5) and quantified by the molybdenum–antimony anti-spectrophotometric method. Available potassium (AK) was extracted with ammonium acetate and measured using flame photometry [32].

2.6. Data Processing

Data organization and preliminary calculations were performed using Microsoft Excel. Graphical representations of the data were generated using Origin 2022 (OriginLab Corporation, Northampton, MA, USA). Quantitative results are presented as mean values ± standard error (SE). Significant differences between treatment groups (p < 0.05) are indicated by different superscript letters in figures and tables, while the same letters denote non-significant differences. All multivariate statistical analyses were conducted using SPSS Statistics 27.0 (IBM Corporation, Chicago, IL, USA). Prior to statistical modeling, environmental driver variables were standardized using Z-score transformation within the R 4.4.0 statistical environment (R Foundation for Statistical Computing, Vienna, Austria). The relationships between the measured environmental drivers (soil properties, stand characteristics) and the understory vegetation diversity indices were investigated using Generalized linear models (GLMs), implemented in R 4.4.0 using the glm() function from the core stats package. Generalized linear models (GLMs) were formulated as follows:
g ( E [ Y i ] ) = β 0 + j = 1 p β j X i j
where Y i is the understory diversity index for observation i , g ( ) is the link function, E [ Y i ] is the expected value of Y i ; β 0 is the intercept, β j (j = 1, 2,…, p) are the coefficients quantifying the effect of each environmental driver X i j ; and p is the number of drivers.

3. Results

3.1. Understory Species Composition and Importance Values Across Different Mixed Patterns

Across the 54 investigated quadrats, a total of 39 species belonging to 20 genera and 18 families were recorded in the shrub layer of the understory vegetation. In the herb layer, 21 species from 20 genera and 17 families were identified. The number of taxa for different mixed-species patterns is illustrated in Figure 2.
Importance values (IVs) of dominant understory species across mixed C. lanceolata plantations are presented in Table 2. The results demonstrated that Eurya japonica Thunb., Loropetalum chinense (R. Br.) Oliv., and Symphocos paniculata Thunb. were the co-dominant species in the shrub layer across all six mixed planting patterns, while Dicranopteris linearis (Burm.) Underw. and Woodwardia japonica (L. F.) Sm. dominated the herb layer.

3.2. Understory Species Diversity and Biomass Across Different Mixed Patterns

As shown in Figure 3, understory shrub layer diversity indices exhibited distinct hierarchical patterns. Simpson’s dominance ranked T4 > T6 > T2 = T3 > T5 > T1, Shannon–Wiener diversity followed T4 > T5 > T3 > T2 > T6 > T1, Pielou evenness ordered T2 = T6 > T1 > T3 > T4 > T5, and Margalef richness aligned with T4 > T5 > T3 > T2 > T6 > T1. T4 consistently achieved the highest values in Simpson dominance, Shannon–Wiener diversity, and Margalef richness, while T1 registered the lowest across these indices, indicating optimal and poorest growth conditions, respectively. Statistical analysis revealed no significant differences in Simpson dominance among patterns (p > 0.05), but significant Shannon–Wiener diversity differences between T1 and T4 (p < 0.05). Although Pielou evenness showed no overall significance, T1 differed significantly from T4, T5, and T6 (p < 0.05).
In the herb layer, Simpson dominance ordered T4 > T3 > T6 > T1 > T2 > T5, Shannon–Wiener diversity followed T4 > T3 > T6 > T2 > T1 > T5, Pielou evenness ranked T4 > T3 > T1 > T5 > T6 > T2, and Margalef richness showed T4 > T3 > T2 > T6 > T1 > T5. The T4 pattern was most favorable for herb layer development, consistent with shrub layer observations.
Table 3 shows the biomass of the shrub layer and herb layer under different mixed patterns of C. lanceolata plantation in the study area. Except for the T1 pattern, the aboveground biomass of the shrub layer in other mixed patterns was higher than that of the herb layer. The proportion of shrub layer biomass in total biomass was also greater than that of the herb layer, and there were significant differences among the mixed patterns, which were ranked as T4 > T5 > T3 > T2 > T1 > T6. The biomass of the shrub layer was significantly different in each mixed pattern, while there was no significant difference between T3 and T5 patterns in the herb layer. The highest proportion of shrub layer biomass to total biomass was the T3 pattern, reaching 58.18%. The highest proportion of herb layer biomass was T1 pattern, which was 57.29%.
Table 4 shows that the Shannon–Wiener diversity index and Margalef richness index of the shrub layer were positively correlated with the aboveground biomass and total biomass of the shrub layer, and the Margalef index was also positively correlated with the aboveground biomass of the herb layer. The Shannon–Wiener and Margalef indexes of the herb layer were also positively correlated with the aboveground biomass and total biomass of the shrub layer. This indicates that the diversity index H and S are more closely related to the aboveground biomass.

3.3. Understory Plant Diversity and Soil Physicochemical Properties in C. lanceolata Plantations with Different Mixed Patterns

Different mixed planting patterns significantly affect soil nutrient content in C. lanceolata plantations. Significant differences exist in all measured soil nutrients, both between soil layers and among planting patterns within the same layer, with distinct vertical stratification observed.
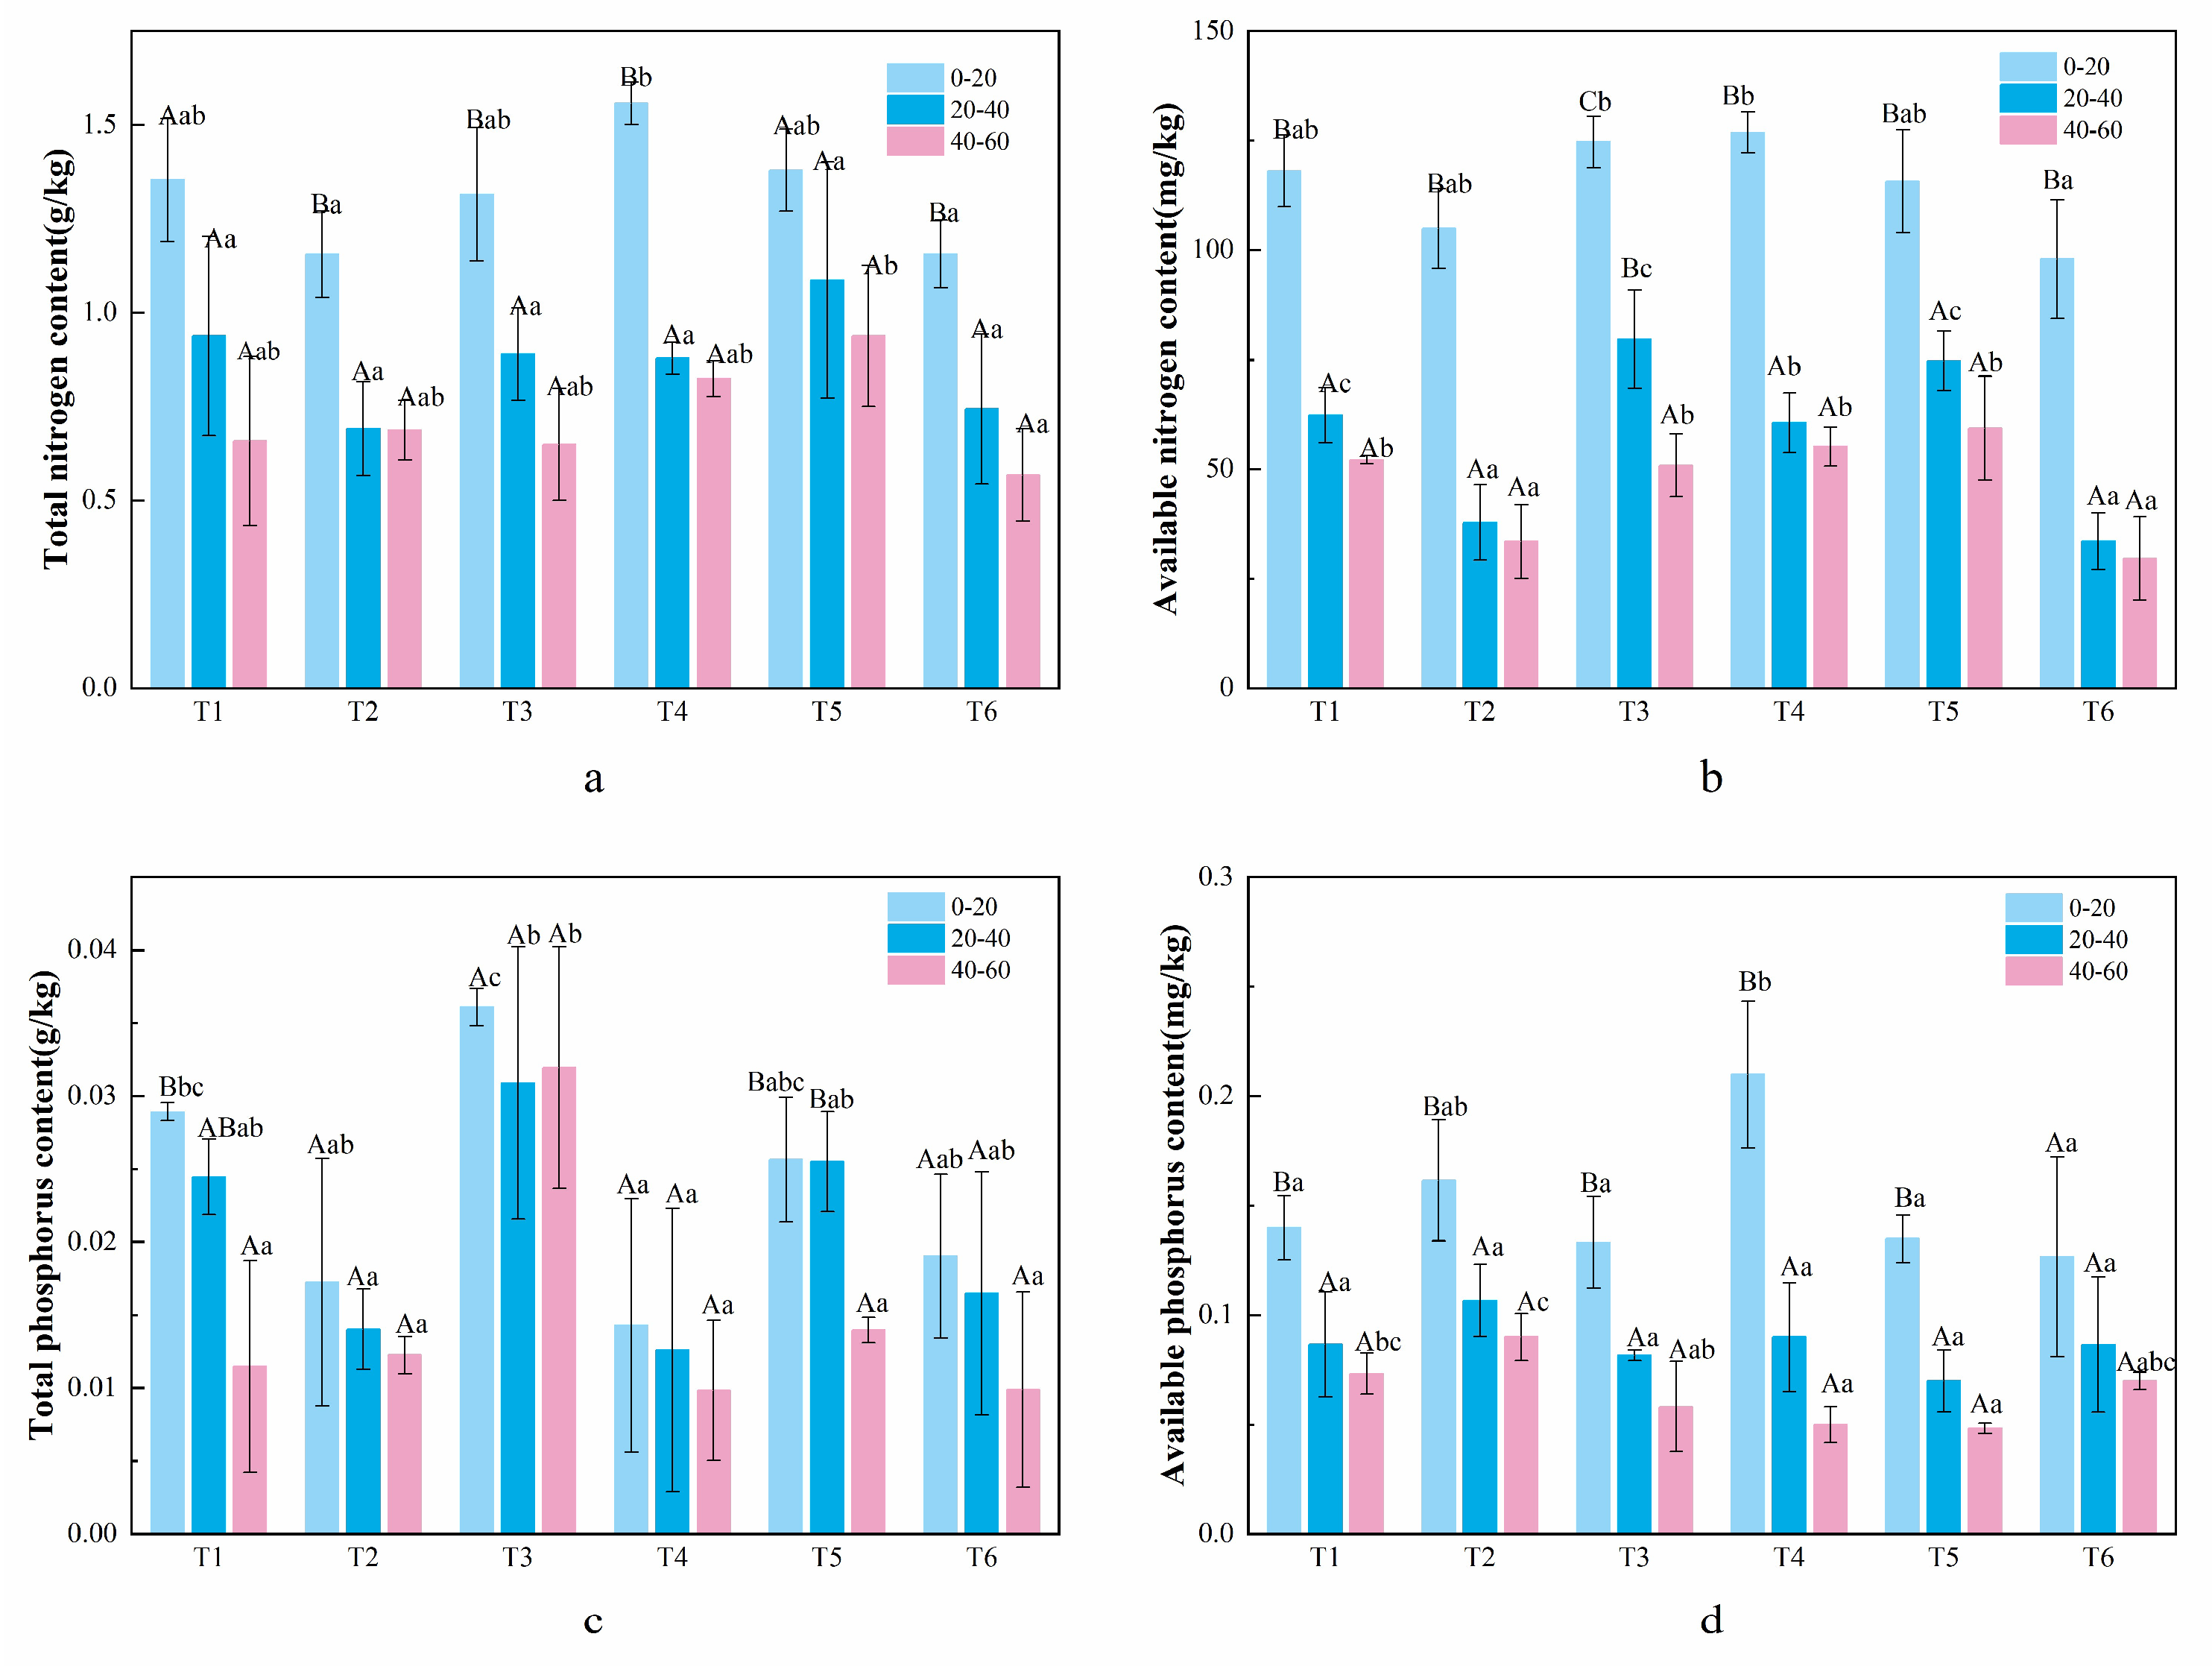
Total nitrogen (TN) and available nitrogen (AN) content decreased with increasing soil depth. Among the patterns, the T4 pattern exhibited the highest TN content in the surface layer (0–20 cm). Significant differences in surface TN were observed among the T2, T4, and T6 patterns, whereas no significant differences were detected between patterns in the subsurface layers (20–40 cm and 40–60 cm). Except for the T3 pattern, AN showed significant heterogeneity across all soil layers. Furthermore, in the surface soil, the T6 pattern differed significantly from the T3 and T4 patterns (Figure 4a,b).
Total phosphorus (TP) and available phosphorus (AP) content also progressively declined with depth. In the surface soil, the TP content of the T1 and T5 patterns was significantly differentiated from that of other patterns. Regarding AP content, the T6 pattern differed significantly from all other patterns in the 0–20 cm layer (Figure 4c,d).
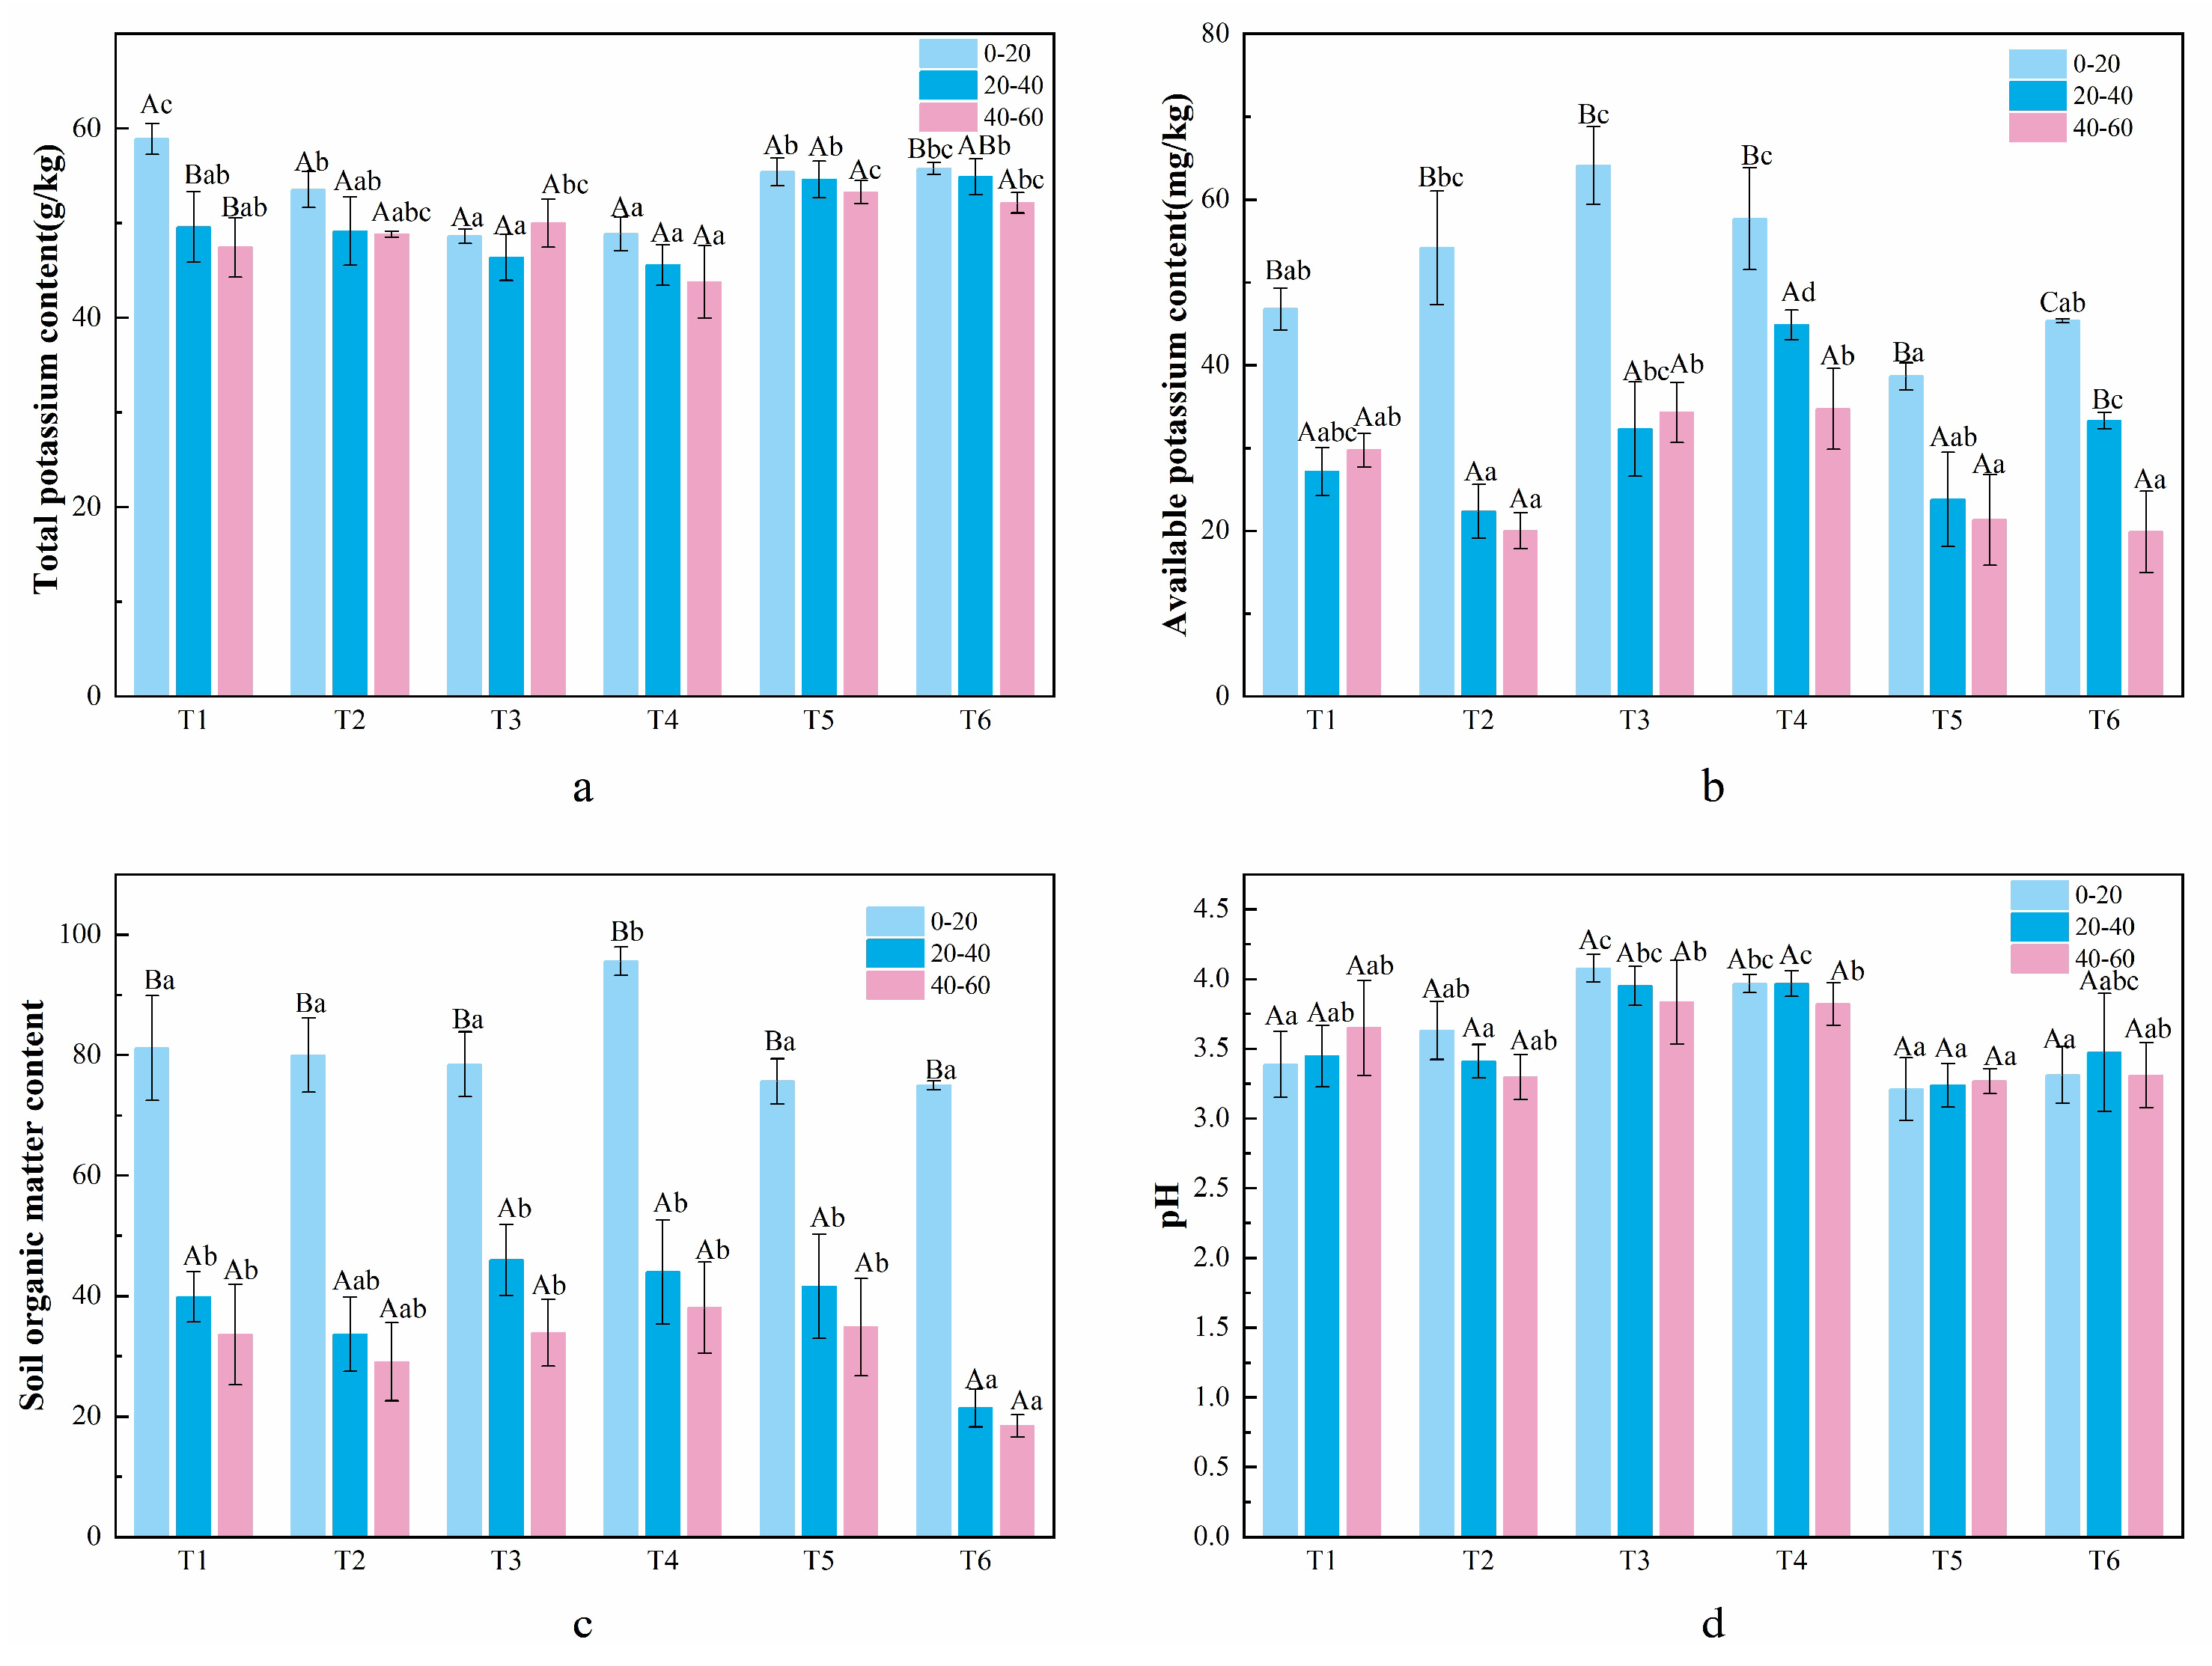
Soil total potassium (TK) and available potassium (AK) content decreased with increasing soil depth across all mixed patterns. Among the patterns, the T3 pattern exhibited the lowest TK content in the 20–40 cm layer, while the lowest AK content occurred simultaneously in both T1 and T3 patterns within the same layer. For TK content, significant differences between the surface layer (0–20 cm) and subsurface layers (20–60 cm) were observed specifically in T1 and T6 patterns, whereas no significant inter-layer differences were detected in other patterns. Within the surface layer, no significant differences existed between T3 and T4 or among T6, T1, T2, and T5. At 20–40 cm depth, T3 and T4 collectively differed significantly from T5 and T6. At 40–60 cm depth, T5 differed significantly from T1, T2, T3, and T4 but maintained comparable levels with T6 (Figure 5a,b).
Regarding AK content, the T6 pattern exhibited significant differences across all three layers. Other patterns showed significant differences exclusively between the surface (0–20 cm) and subsurface layers (20–60 cm). In the surface layer, T3 and T4 differed significantly from all other patterns, while T2 and T5 were mutually distinct. At 20–40 cm depth, T4 differed significantly from all comparative patterns, whereas at 40–60 cm depth, T3 showed no significant difference from T1 but differed significantly from other patterns.
Soil organic matter (SOM) content progressively declined with depth, showing significant differences between surface (0–20 cm) and subsurface layers. In the surface layer, the T4 pattern differed significantly from other patterns. Within subsurface layers (20–60cm), T6 showed no significant difference from T3, while other patterns differed significantly. Soil pH values (3.2–4.0) remained consistently acidic without significant vertical variation (Figure 5c,d).
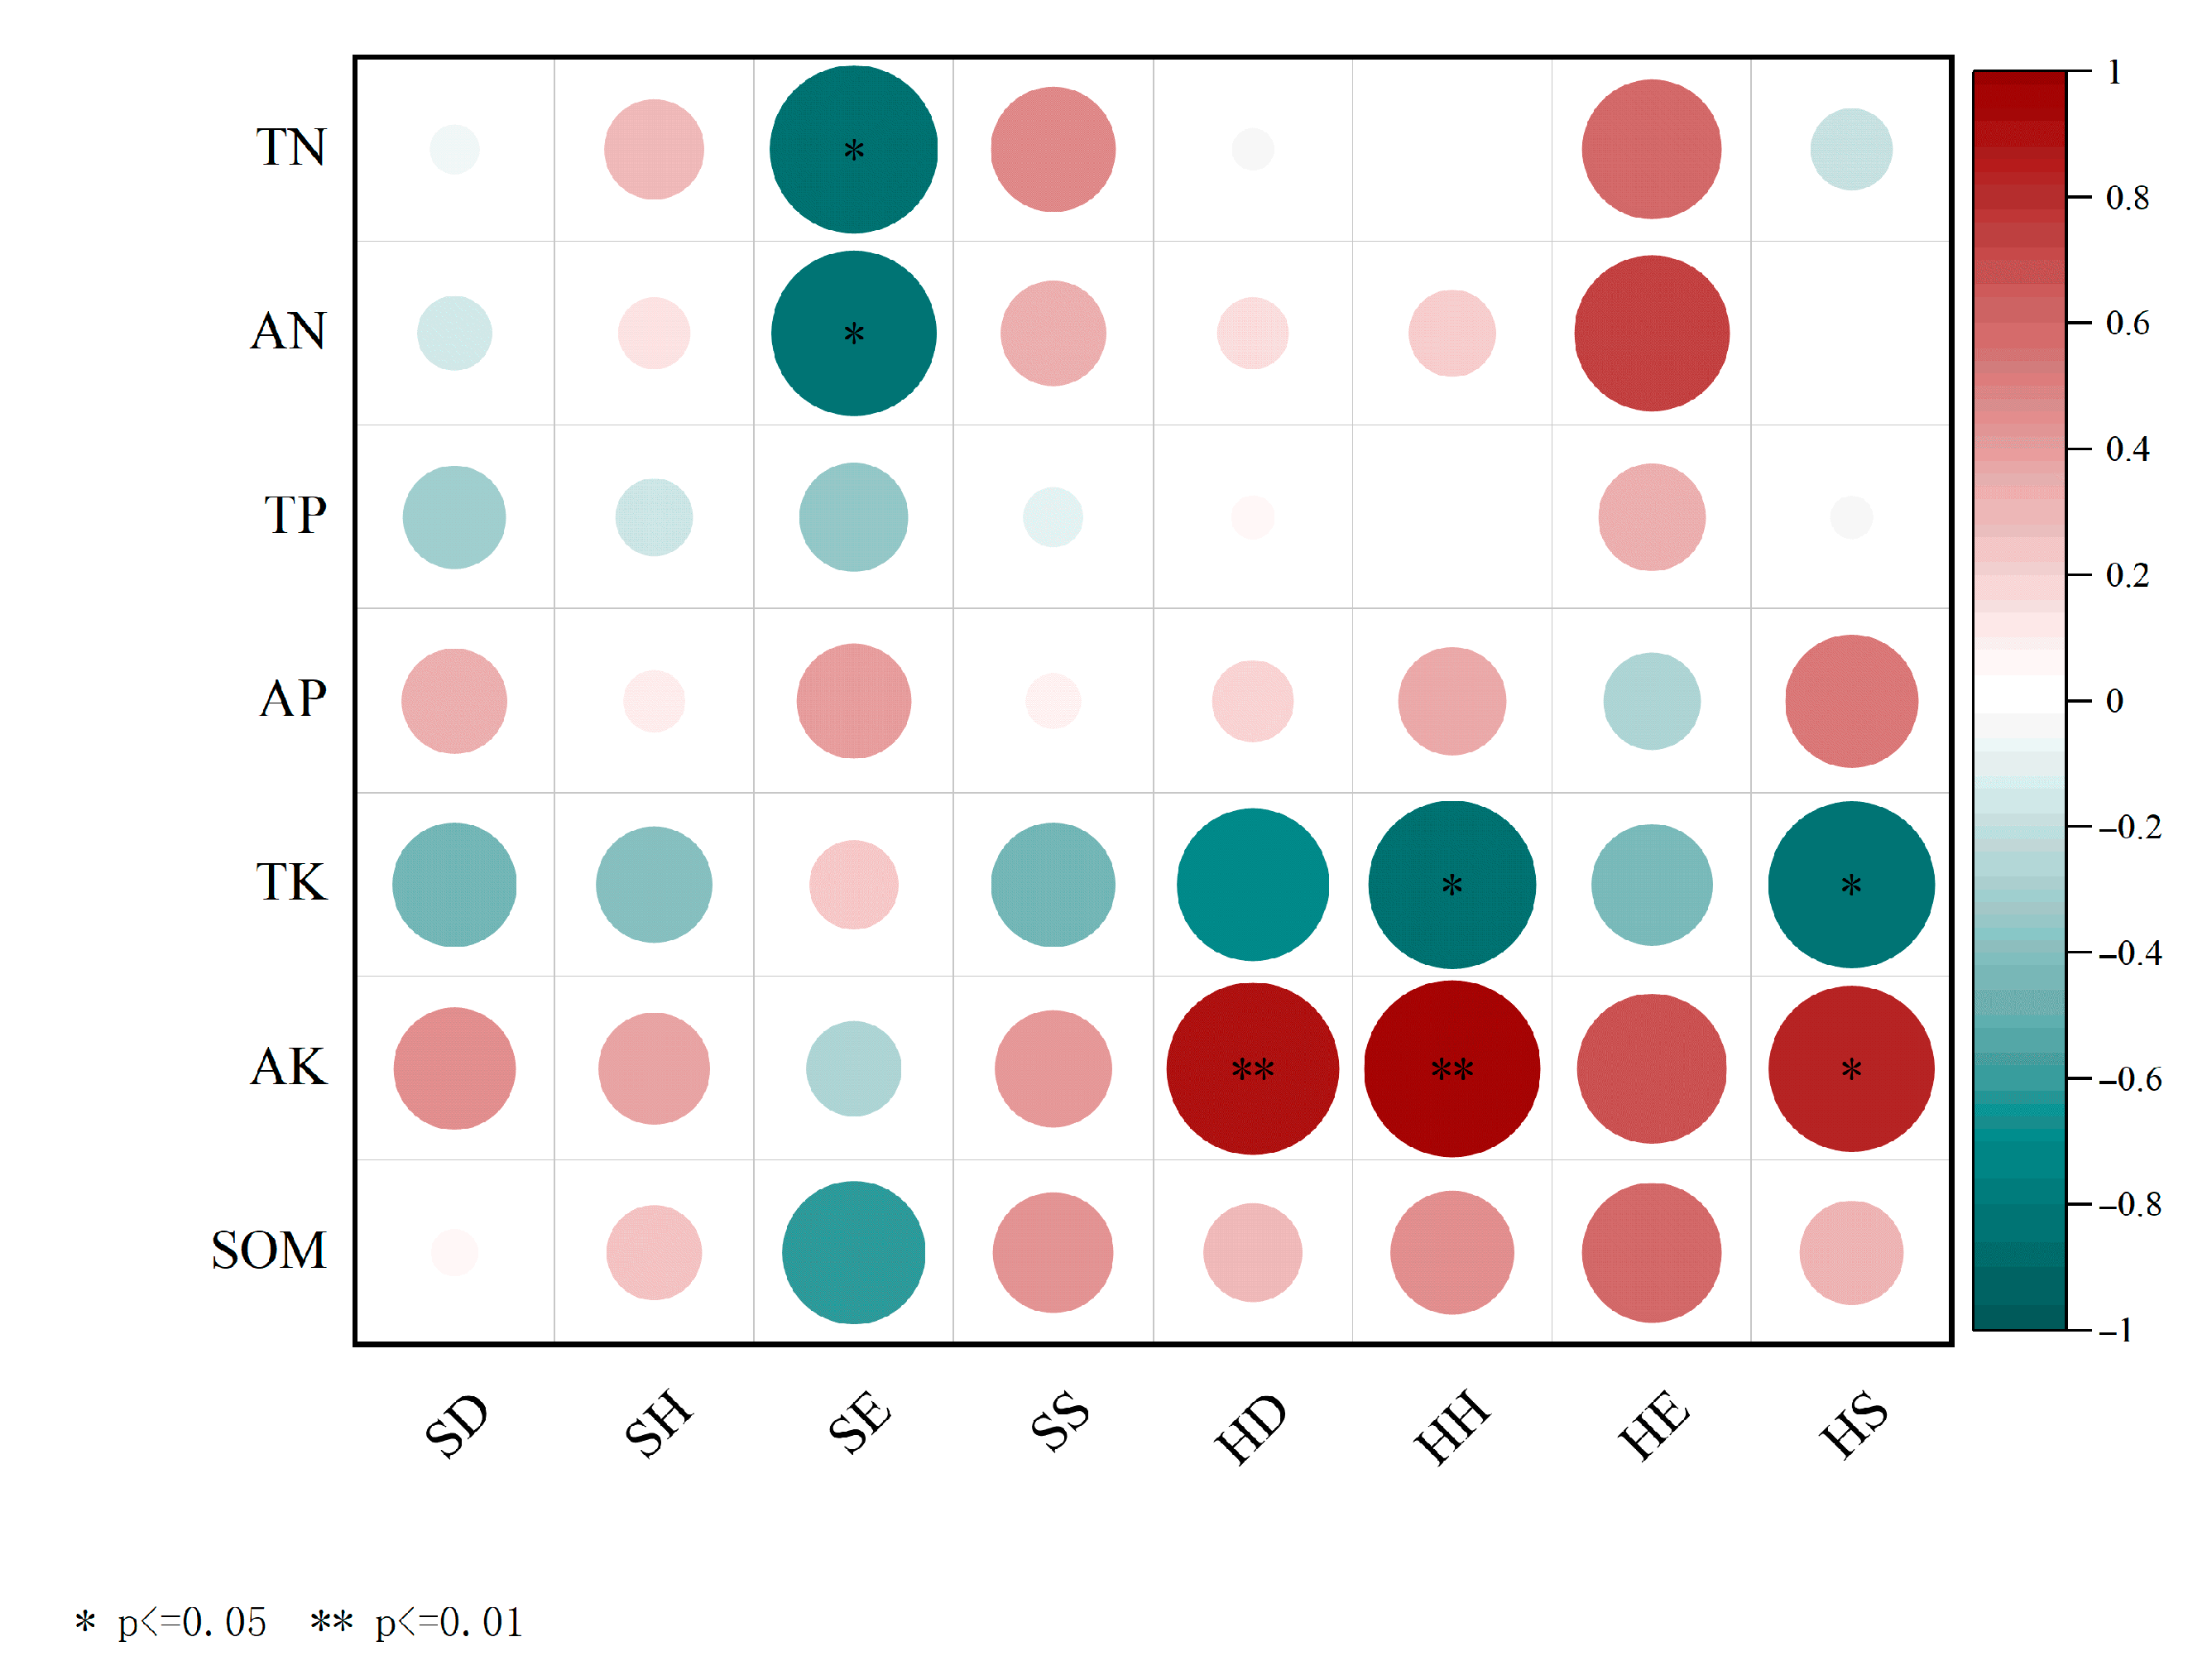
According to the data shown in Figure 6, the results of the correlation analysis between plant diversity indices and soil physicochemical properties in the shrub layer showed that there was a significant negative correlation between the Pielou evenness index and soil total and quick nitrogen in the shrub layer. For the other diversity indices, no significant correlation with soil physical and chemical properties was observed. In the herb layer, Simpson dominance index showed a significant positive correlation with quick-acting potassium, while Shannon–Wiener diversity index and Margalef richness index showed a significant negative correlation with soil total potassium and a significant positive correlation with soil quick-acting potassium.

4. Discussion

4.1. The Impact of Different Mixed Patterns on Understory Plant Diversity

The results of this study showed that different mixed patterns had significant effects on the diversity of understory plants. Among them, the mixed pattern of T4 performed best in multiple diversity indexes, while the mixed pattern of T1 performed poorly. The higher diversity index under the T4 pattern may be related to the complementarity among tree species, which may be derived from the differences in light, water, and nutrient requirements of different tree species, thus promoting the effective utilization of resources [33]. Fang et al. also found that the mixed forest was significantly better than the pure forest in terms of tree height, DBH, and biomass, and the mixed pattern promoted the yield increase effect through interspecific complementarity [34]. In addition, the mixed-forest pattern can improve soil structure and boost the soil organic matter content, thereby increasing the availability of soil nutrients. Studies have demonstrated that, compared to pure C. lanceolata plantations, the soil physicochemical properties and enzyme activities in mixed-species plantations increased by 13.97% and 36.34%, respectively. The mixed-forest pattern enhances soil aeration and water-holding capacity, increases the total amount and availability of soil nutrients, boosts soil organic carbon reserves, and improves soil nutrient cycling in C. lanceolata plantations. The mixed plantation enhanced soil aeration, water retention, total nutrient content and availability, increased soil organic carbon storage, and improved soil nutrient cycling in C. lanceolata plantation. In the mixed pattern, the soil microbial activity was enhanced, which contributed to the circulation of soil nutrients and the decomposition of plant residues, thereby increasing the availability of soil nutrients. In addition, the canopy structure of different tree species may improve the light and water conditions under the forest, providing a more suitable growth environment for understory plants, thereby promoting the increase in plant diversity [35]. Mixed forests have a positive effect on improving soil total phosphorus and its availability, which may increase the demand for nitrogen and thus promote plant diversity. Relevant scholars have studied the combination of tree species with complementary traits and found that the mixture of C. lanceolata and P. bournei can promote the effective utilization of limited resources and promote the growth, development, and production of C. lanceolata and P. bournei [36,37]. In the forest ecosystem, it focuses on two mixed tree species or multiple mixed tree species, such as C. lanceolata mixed with P. bournei and S. superba in this study, and broad-leaved tree species mixed with coniferous tree species, where the interaction between tree species improves the limited resources. A good mixed pattern may promote the coexistence and niche differentiation of C. lanceolata plantation with other species, reduce the competition among species, and thus facilitate the symbiosis of more species.

4.2. Correlation Between Soil Physicochemical Properties and Mixed Patterns

Soil physical and chemical properties are one of the important factors affecting plant diversity. There is a close relationship between the species diversity of understory vegetation and the physical and chemical properties of soil. Plants and soil are environmental factors that influence each other. In the process of growth, plants are not only affected by their own biological characteristics, but also by external environmental conditions (such as light and precipitation) [38]. These factors will lead to changes in the structure of plant communities with changes in the type and quantity of nutrients in the soil, which in turn affect species diversity. Therefore, there is a direct relationship between the physical and chemical properties of soil and the diversity of plant communities. This study found that with the increase in soil depth, the contents of total nitrogen, total phosphorus, total potassium, available nitrogen, available phosphorus, available potassium, and organic matter in soil decreased continuously, and there were significant differences between 0–20 cm and 40–60 cm soil layers, while there was often no significant difference between 20–40 cm and 40–60 cm. And these changes are correlated with the plant diversity index. This suggests that the availability of soil nutrients may have a limiting effect on plant diversity, especially on the soil surface. In addition, soil pH and soil moisture have also been shown to be key environmental factors affecting soil microbial communities, which may indirectly affect plant diversity [39,40].

4.3. The Effect of Mixed Patterns on Soil Nutrient Content

The changes in soil nutrients under different mixed patterns may be related to the nutrient demand of tree species and soil nutrient cycling. The mixture of C. lanceolata and P. bournei promoted the effective utilization of soil nutrients, which was related to the complementarity between tree species. Effective stubble management and litter management will ensure the improvement of the soil biochemical cycle, which can increase the diversity of understory plants. In the mixed forest, the litter quality and decomposition rate of different tree species may be different, which affects the input of soil organic matter and the release of nutrients. The decomposition process of litter is a key link in the soil nutrient cycle. It not only provides the nutrients needed for plant growth, but also affects the physical structure and water retention capacity of the soil. The mixed pattern can improve soil enzyme activity, which is one of the key indicators to measure the degree of soil degradation [41]. The soil enzyme activities of different layers in C. lanceolata mixed forest were significantly higher than those in pure C. lanceolata forest, indicating that the mixed pattern had a positive effect on soil fertility [42]. Under the mixed pattern, the nutrient demand and release patterns of different tree species may be different, which is helpful to improve the utilization efficiency of soil nutrients. For example, the contents of available phosphorus, available potassium, and total potassium in the rhizosphere soil of P. bournei in the mixed forest were increased, which may be related to the richer litter in the mixed forest and the stronger microbial activity in the soil. Research by Dong et al. (2021) [43] demonstrated that mixed forests of Quercus acutissima and Robinia pseudoacacia exhibit significantly enhanced diversity and activity of soil microbial communities, accelerating litter decomposition and nutrient mineralization. Consequently, rhizosphere soils in mixed stands showed markedly higher levels of available phosphorus (AP) and available potassium (AK) compared to monocultures. Elevated AP and AK concentrations were particularly pronounced in the rhizospheres of canopy-layer species (Q. acutissima and R. pseudoacacia), attributable to increased litter inputs and intensified microbial metabolism in mixed ecosystems. Furthermore, nutrient acquisition by understory vegetation (e.g., shrubs and herbs) was substantially augmented, as microbial processing of enriched organic matter released bioavailable AP and AK into the soil matrix [44]. Studies have shown that mixed forests can increase the availability of soil nutrients, especially for key nutrients such as phosphorus and potassium, compared with pure C. lanceolata forests. Under the T4 mixed pattern, the content of available phosphorus (AP) was significantly higher than that of pure forest, and the content of AP decreased significantly with the increase in soil depth. Soil total potassium (TK) content was significantly affected by the mixed pattern under the T4 mixed pattern, indicating that a good mixed pattern may promote soil nutrient cycling by improving soil structure and increasing organic matter content. The T4 mixed pattern had a positive effect on soil nutrients by improving the effectiveness of soil nutrients, microbial diversity, improving soil structure and organic matter content, and promoting soil nutrient cycling.

4.4. The Superiority of the C. lanceolata, P. bournei, and Symplocos Mixed Pattern

Under the same thinning intensity, mixed forests show the greatest light radiation and most balanced spectral composition. This may result from the complementary crown and root structures of different tree species, which enhance light-energy utilization efficiency [43]. Taking the mixed-forest model of C. lanceolata, P. bournei, and S. superba as an example, the upper canopy of C. lanceolata can efficiently use strong light, while the middle and lower canopies of P. bournei and S. superba can utilize scattered and weak light, jointly improving light-energy utilization efficiency. Regarding root systems, C. lanceolata has a deep root system, whereas P. bournei and S. superba have shallow root systems. This layered distribution enables them to absorb nutrients from deep and surface soil layers separately, reducing competition. It also improves soil structure and boosts soil aeration and water retention. Overall, this complementary relationship gives mixed forests a resource-utilization and ecological-function edge over pure forests, significantly enhancing the productivity and stability of forest stands. This complementarity not only improves the overall productivity and biodiversity of the stand, but also brings good ecological and economic benefits. Studies have shown that the mixture of C. lanceolata and S. superba can effectively promote the growth of DBH and volume, so that the total volume of mixed forest is significantly higher than that of pure forest [45]. In addition, mixed precious tree species such as P. bournei in C. lanceolata forest can not only realize the production of precious large-diameter timber, but also take into account the goal of ecological protection. P. bournei is a highly valued tree species with significant economic benefits. Its wood is tough, dense, and glossy, making it an excellent material for high-end buildings and fine furniture, with high market demand and considerable economic returns [46]. The fire prevention efficacy of S. superba firebreaks has been verified through numerous experimental studies [47]. Its fire-blocking mechanism includes the high water content of its leaves, which evaporates when exposed to heat, thereby removing a significant amount of heat and reducing the temperature of the tree, making it less likely to ignite. This is a unique advantage that other models (especially T6) do not possess. Forest fires are a significant risk to forestry, and reducing fire risk is equivalent to safeguarding economic benefits. Moreover, the T4 pattern incorporates top-tier precious timber (P. bournei) and premium hardwood (S. superba), both commanding significantly higher market prices than L. formosana, C. fissa, and P. elliottii. C. lanceolata provides reliable mid-term returns. This tiered structure of high–medium–low value species ensures maximum timber value per unit forest area.
From the perspective of root characteristics, the root vertical depth of P. bournei and S. superba is larger, which can absorb deep nutrients into the soil, while the root system of C. lanceolata is relatively shallow, mainly distributed in the surface soil [48]. This vertical root difference reduces root competition among the three tree species, allowing them to use different levels of soil resources more effectively. At the same time, the root horizontal root width of P. bournei and S. superba is larger, which can absorb nutrients in the horizontal direction widely, while the root horizontal root width of C. lanceolata is relatively small, which is mainly concentrated around the trunk. The difference in horizontal root systems further reduces the root competition among the three tree species. In terms of crown width, P. bournei and S. superba have larger crown widths, which can effectively shade and provide a suitable growth environment for undergrowth plants, while the crown width of C. lanceolata is relatively small, which can provide certain light for undergrowth plants. The difference in crown width enables undergrowth plants to obtain suitable light and shade conditions and promotes the growth of undergrowth plants. In addition, the three tree species form a hierarchical structure of C. lanceolata on the upper and P. bournei and S. superba on the lower at the vertical level. This structure helps to make full use of light resources, improve the utilization rate of light energy, and improve the microenvironment conditions under the forest. It provides a more suitable living environment for understory plants and animals.
In addition to the complementarity of roots and crown width, P. bournei and S. superba, as broad-leaved tree species, their roots can form a symbiotic relationship with nitrogen-fixing bacteria, converting nitrogen in the atmosphere into nitrogen that can be used by plants, thereby improving soil fertility. This biological nitrogen fixation effect effectively compensates for the consumption of soil nutrients in the C. lanceolata pure forest and improves soil fertility. The canopy structure of different tree species in the mixed forest can also make more effective use of light resources [49]. For example, the canopy of C. lanceolata is higher, which can absorb the light of the upper layer, while the canopy of P. bournei and S. superba is lower, which can absorb the light of the lower layer, thus improving the light energy utilization rate of the whole stand [50]. In addition, the existence of a variety of tree species in the mixed forest can reduce the incidence of pests and diseases. Different tree species have different resistance to pests and diseases. When a tree species is attacked by pests and diseases, other tree species can play a role in isolation and blocking, reducing the spread of pests and diseases. At the same time, the structure of the mixed forest is more complex, which can also enhance the disaster resistance of the forest.

5. Conclusions

In this study, the effects of mixed C. lanceolata plantations with different native broad-leaved trees on the diversity of understory plants were systematically studied. The results showed that different native broad-leaved tree mixed patterns had significant effects on the diversity of understory plants in the C. lanceolata plantation. Among them, the mixed pattern of ‘C. lanceolata + P. bournei + S. superba’ (T4) showed the best performance in promoting the diversity of understory plants. Studies have shown that mixed patterns can significantly promote the improvement of species diversity by increasing the number of niches and improving microenvironment conditions [51]. Therefore, in the implementation of forest management activities, it is recommended to give priority to the use of the T4 mixed pattern to enhance the diversity of understory plants, thereby improving the stability and resilience of the ecosystem. Long-term monitoring results showed that the number of plant species in the shrub layer decreased, while the number of plant species in the herb layer increased. This change may be closely related to the natural succession of the forest and the long-term changes in environmental conditions, which further highlights the importance of continuous monitoring and adaptive management in forest ecosystem management.
Furthermore, a substantial correlation was identified between soil nutrient content and plant diversity indices, indicating that the availability of nutrients in the soil exerts a pivotal influence on plant species diversity, particularly in the upper portion of the soil. The dynamics of soil nutrient levels in the context of diverse tree species under mixed cropping patterns may be closely associated with the nutrient demands of the specific tree species and the mechanisms underlying soil nutrient cycling. The implementation of a diverse planting pattern has been demonstrated to enhance the biodiversity of understory plants. This enhancement is achieved by promoting biochemical cycling in the soil and optimizing the efficiency of soil nutrient utilization. These findings provide further evidence in support of the hypothesis that the implementation of diverse planting patterns can enhance biodiversity within the understory layer. This, in turn, may contribute to the enhancement of ecosystem stability and productivity within forest ecosystems.
Among the six common mixed patterns of C. lanceolata plantation in the study area, the ‘C. lanceolata + P. bournei + S. superba’ (T4) pattern is the most favorable for the growth and development of understory plants. Whether it is the shrub layer or herb layer, its growth status is better than other mixed patterns, and the aboveground biomass of this pattern is also the highest. On the contrary, the growth and development of understory plants under the mixed pattern of ‘C. lanceolata + L. formosana’ (T1) was the worst. In addition, there was a great correlation between plant diversity and aboveground biomass in the understory herb layer of each mixed pattern. This shows that optimizing the mixed planting pattern is a key strategy to improve ecological benefits and forest management efficiency.
In summary, this study provides a scientific basis for the optimization of mixed planting patterns in cedar plantation forests and emphasizes the positive role of mixed planting patterns in enhancing understory plant diversity and ecosystem stability. At the same time, it provides a theoretical basis for revealing the factors affecting plantation forest understory plant diversity and for improving the geotechnical conditions of plantation forests to enhance understory plant diversity.

Author Contributions

Conceptualization, M.W. and H.G.; methodology, H.G., M.W. and J.J.; software, M.W. and H.G.; validation, M.W., H.G. and J.J.; formal analysis, M.W.; resources, J.J.; writing—original draft preparation, M.W. and H.G.; writing—review and editing, M.W., H.G. and J.J.; visualization, M.W.; supervision, J.J.; project administration, M.W. and H.G.; funding acquisition, J.J. All authors have read and agreed to the published version of the manuscript.

Funding

This research was funded by the National Key Research and Development Program Project (2023YFF1304404).

Data Availability Statement

Data available on request due to restrictions surrounding, e.g., privacy or ethics. The data presented in this study are available on request from the corresponding author.

Conflicts of Interest

The authors declare no conflicts of interest.

References

  1. Chen, R.S.; Kang, W.X.; Zhou, Y.Q.; Tian, D.L.; Xiang, W.H. Changes in nutrient cycling with age in a Cunninghamia lanceolata plantation forest. J. Plant Ecol. 2018, 42, 173–184. [Google Scholar] [CrossRef]
  2. Zhang, C.S.; Li, K. Research Status and Advances of Nutrient Cycling of Plantation. World For. Res. 2005, 18, 35–39. [Google Scholar] [CrossRef]
  3. Zhang, H.D.; Kang, X.R.; Shao, W.H.; Yang, X.; Zhang, J.F.; Liu, X.Q.; Chen, G.C. Characteristics of herbaceous plant biodiversity in Cunninghamia lanceolate plantations with different community structures. Acta Ecol. Sin. 2021, 41, 2118–2128. [Google Scholar] [CrossRef]
  4. Qu, Y.C.; Jiang, Y.H.; Chen, H.Y.; Zhang, J.G.; Zhang, X.Q. Dynamic change of stand leaf area for Chinese fir plantation. Acta Ecol. Sin. 2024, 44, 5609–5620. [Google Scholar] [CrossRef]
  5. Kang, X.R.; Li, X.G.; Zhang, H.D.; Liu, X.Q.; Chen, G.C. Community stability characteristics of Cunninghamia lanceolata plantations with different mixing measures. Chin. J. Ecol. 2020, 39, 2912–2920. [Google Scholar] [CrossRef]
  6. Chen, H.; Guo, H.T.; Chen, R.; Xue, G.H.; Wang, L.Y.; Jiang, J. Understory Plant Diversity of Cunninghamia lanceolata Plantations and Its Short-Term Environmental Response to Different Thinning Intensities. Acta Ecol. Sin. 2023, 43, 10274–10284. [Google Scholar] [CrossRef]
  7. Peng, Y.; Shi, Z.T.; He, L.; Shen, R.; Xu, R. Temporal and Spatial Changes of Natural Forest Loss in Xishuangbanna and its Landscape Ecologica Response Based on Landsat Data. For. Resour. Manag. 2022, 64, 73–80. [Google Scholar] [CrossRef]
  8. Jiang, J.; Liu, X.Z.; Jia, H.Y.; Ming, A.G.; Chen, B.B.; Lu, Y.C. Effects of Stand Density on Understory Species Diversity and Soil Physicochemical Properties Following Close-to-Nature Transformation of Chinese Fir Plantations. J. Beijing For. Univ. 2019, 41, 170–177. [Google Scholar] [CrossRef]
  9. Yu, X.T. On the Regression of Chinese Fir Plantation—Discussion on the Sustainable Management of Chinese Fir in Terms of the Cause and Effect of Soil Degradation. World For. Res. 1999, 12, 15–19. [Google Scholar] [CrossRef]
  10. Xu, M.; Luo, Z.R.; Yu, M.J.; Ding, B.Y.; Wu, Y.G. Floristic composition and community structure of mid-montane evergreen broad-leaved forest in north slope of Baishanzu Mountain. J. Zhejiang Univ. (Agric. Life Sci.) 2007, 33, 450–457. [Google Scholar]
  11. Gong, H.D.; Zhang, Y.P.; Liu, Y.H.; Yang, G.P.; Lu, Z.Y.; Lu, H.Z. Nterception capability in an evergreen broad-leaved forest of Ailaoshan, Yunnan Province. J. Zhejiang A&F Univ. 2008, 25, 469–474. [Google Scholar] [CrossRef]
  12. Yu, D.J.; Zheng, Y.G.; Sun, C.H.; Zhao, C.; Jin, Y.H.; Zhang, L.J.; Li, J.G.; Liu, L.J. Investigation and Factors Analysis of Dendrolimus superansOutbreaks in Changbai Mountain National Nature Reserve. For. Res. 2022, 35, 103–111. [Google Scholar] [CrossRef]
  13. Xu, J.J.; Chen, X.; Liu, Z.Y.; Pang, C.M.; Yu, S.Y. Relationship between Spatial Heterogeneity of Soil Nutrients and Plant Composition in the Evergreen Broad-leaved Forest of Tianmu Mountain. Zhejiang For. Sci. Technol. 2022, 42, 33–41. [Google Scholar] [CrossRef]
  14. Hu, E.C.; Wang, Z.; Li, Z.H.; Li, Z.F.; Dong, D.W.; Bao, H.; Gao, R.H. Understory Plant Diversity and Its Relationship with Soil Physicochemical Properties in Different Plantations in Mu Us Sandy Land. For. Res. 2024, 37, 174–181. [Google Scholar] [CrossRef]
  15. Wang, M.H.; Cui, F.K.; Wu, Z.P.; Wang, M.H.; Cui, F.K.; Wu, Z.P.; Xu, X.Y.; Ou, S.K.; Chen, J.H.; Ma, S.J.; et al. The Pattern of Understory Plant Diversity and Soil Physicochemical Properties in the Severely Burned Areas of Forests. For. Environ. Sci. 2024, 40, 1–8. [Google Scholar] [CrossRef]
  16. Hu, G.D.; Zhou, J.Q.; Da, J.S.; Lei, L.J.; Zhao, C.X.; Li, C.N.; Zhou, Z.Q.; Liu, J.R. Relationship Between Understory Plant Diversity and Soil Properties of Different Forests in Sandy Land of Jinta. Acta Agrestia Sin. 2023, 31, 1834–1841. [Google Scholar]
  17. Gao, C.; Fu, R.X.; Mu, W.J.; Chen, L.X.; Wu, W.R.; Yu, Y.C. Effects of Mixed Forests of Chinese Fir and Broad-leaved Trees and Understory Planting on Soil Nitrogen Mineralization. For. Res. 2024, 37, 23–32. [Google Scholar] [CrossRef]
  18. Zou, X.C.; Wang, X.M.; Zuo, Y.F.; Zhang, Z.X.; He, K.N. Characteristics of herbaceous diversity and environmental interpretation of Picea crassifolia at different succession stages. Acta Ecol. Sin. 2023, 43, 10285–10294. [Google Scholar] [CrossRef]
  19. Shi, L.; Zhang, R.S. Comprehensive Evaluation of Soil Nutrients after Mixed Transformation of Pinus Sylvestris var. Mngolica Plantation. For. Resour. Manag. 2021, 1, 132–139. [Google Scholar] [CrossRef]
  20. Cao, X.Y.; Li, J.P.; Hu, Y.J. Storage of Soil Microelements of Cunninghamia lanceolata in Fushou Forest Farm. J. Northwest For. Univ. 2016, 31, 55–59. [Google Scholar]
  21. Lu, N.N.; Gao, Z.X.; Zhang, P.; Xu, X.P.; Wang, X.J. Path Analysis between Soil Properties and Undergrowth Vegetation in Pure Chinese Fir Forest. J. Northeast For. Univ. 2015, 43, 73–77. [Google Scholar] [CrossRef]
  22. Zhang, X.; Chen, Y.T.; Yang, Q.J.; He, Z.M.; Cao, G.Q.; Chen, A.L. Differences of Soil Physicochemical Properties and Undergrowth Vegetation Diversity of 100-Year-Old Chinese Fir Plantations in Different Terrain. J. Southwest For. Univ. 2021, 41, 60–70. [Google Scholar] [CrossRef]
  23. Guo, H.T.; Ji, X.F.; Wang, C.; Zou, H.L.; Wang, L.Y.; Jiang, J. Spatial variability and influencing factors of plant diversity in the shrub layers of artificial forests in China. J. Nanjing For. Univ. 2022, 46, 144–152. [Google Scholar] [CrossRef]
  24. Shi, H.N.; Li, W.P.; Li, Z.H.; Wang, Y.G.; Yang, X.Z. Effects of fir and broad-leaved mixed forest with different mixing proportions on the species diversity and soil nutrients under the forest. J. Cent. South Univ. For. Technol. 2022, 42, 34–41. [Google Scholar] [CrossRef]
  25. Lai, A.H.; Wu, Z.L.; Zhou, X.N.; Zhou, C.J.; Wang, K.X. Influence of Selective Intensity on Stand Spatial Structure of Cunninghamia lanceolata-Broadleaved Mixed Plantation. J. Beihua Univ. 2016, 17, 109–115. [Google Scholar] [CrossRef]
  26. Yan, S.; Deng, H.Y.; Hu, D.H.; Wang, R.H.; Wei, R.P.; Zheng, H.Q.; Zou, Y.H.; Chen, X.W. Comprehensive Quality Evaluation of the Pure and Mixed Cunninghamia lanceolata Stands of the Ecological Public-Welfare Forests in Northern Guangdong. For. Resour. Manag. 2022, 5, 69–75. [Google Scholar] [CrossRef]
  27. Kang, Y.; Xin, X.B.; Pei, S.X.; Guo, H.; Fa, L.; Wu, S.; Ma, S.M.; Wu, D. Undergrowth Species Diversity characteristics of Larix principis-rupprechti plantation. J. Northwest For. Univ. 2025, 40, 23–31, 82. [Google Scholar] [CrossRef]
  28. Bai, Y.X.; Liu, R.H.; Su, J.H.; Shen, W.J. Effects of tree species mixing on bulk and rhizosphere soil microbial resource limitation in stands of Pinus massoniana and Castanopsis hystrix. Acta Ecol. Sin. 2024, 44, 10770–10781. [Google Scholar] [CrossRef]
  29. Yang, Q.; Pu, H.M.; Zhao, X.C.; Wang, Z.W.; Cheng, H.; Dong, R.; Chen, Y.L.; Jin, B.C. Comparison of different plant cover investigation methods for three artificial grasslands. Appl. Environ. Biol. 2021, 27, 220–227. [Google Scholar] [CrossRef]
  30. Hou, X.L.; Han, H.; Tigabu, M.; Cai, L.P.; Meng, F.R.; Liu, A.Q.; Ma, X.Q. Changes in soil physico-chemical properties following vegetation restoration mediate bacterial community composition and diversity in Changting, China. Ecol. Eng. 2019, 138, 171–179. [Google Scholar] [CrossRef]
  31. Buysse, J.; Merckx, R. An improved colorimetric method to quantify sugar content of plant tissue. J. Exp. Bot. 1993, 44, 1627–1629. [Google Scholar] [CrossRef]
  32. Lu, R.K. Analytical Methods of Soil Agrochemistry; Chinese Agriculture Science and Technology Press: Beijing, China, 1999. [Google Scholar]
  33. Fan, R.; Xu, H.F.; Li, C.; Zhang, H.; Zhang, H.; Chen, L.; Wang, N.L. Changes in plant diversity and water use efficiency during the recovery process of subtropical forest lands. Geogr. Res. 2024, 43, 776–790. [Google Scholar] [CrossRef]
  34. Feng, Y.H.; Schmid, B.; Loreau, M.; Forrester, D.I.; Fei, S.L.; Zhu, J.X.; Tang, Z.Y.; Zhu, J.L.; Hong, P.B.; Ji, C.J.; et al. Multispecies forest plantations outyield monocultures across a broad range of conditions. Science 2022, 376, 865–868. [Google Scholar] [CrossRef] [PubMed]
  35. Guo, J.; Kneeshaw, D.; Peng, C.; Wu, Y.; Feng, L.; Qu, X.; Wang, W.; Pan, C.; Feng, H. Positive effects of species mixing on biodiversity of understory plant communities and soil health in forest plantations. Proc. Natl. Acad. Sci. USA 2025, 122, e2418090122. [Google Scholar] [CrossRef] [PubMed]
  36. Li, C.H.; Gao, G.N.; Huang, H.M.; Li, J.J.; Xiao, N.; Liao, S.S.; Huang, X.M.; Zhao, L.J.; You, Y.M. Effects of Multi-layer Mixed-age Modification on Soil Phosphorus Components and Transformation in Cunninghamia lanceolata Plantation. Guangxi Sci. 2024, 31, 416–426. [Google Scholar] [CrossRef] [PubMed]
  37. Ling, G.C.; Shen, H.; Fan, R.D.; Zhang, N.J.; Xia, C.C.; Hu, W.M. Growth and Stoichiometry Characteristics of C, N and P in Soil under Mixed Plantation of Different Aged Cunninghamia lanceolata and Phoebe bournei. J. Zhejiang For. Sci. Technol. 2022, 42, 14–20. [Google Scholar] [CrossRef]
  38. Meng, T.T.; Ni, J.; Wang, G.H. Plant Funcitional Traits, Environmental And Ecosystem Functioning. Chin. J. Plant Ecol. 2007, 31, 150–165. [Google Scholar] [CrossRef]
  39. Zhalnina, K.; Dias, R.; de Quadros, P.D.; Dörr de Quadros, P.; Davis-Richardson, A.; Camargo, F.A.O.; Clark, I.M.; McGrath, S.P.; Hirsch, P.R.; Triplett, E.W. Soil pH Determines Microbial Diversity and Composition in the Park Grass Experiment. Microb. Ecol. 2015, 69, 395–406. [Google Scholar] [CrossRef]
  40. Zou, G.H.; Zhao, F.L.; Lan, X.C.; Wu, T.H. Effects of Coconut Shell Biochar on Enzyme Activities and Microbial Community in Tropical Paddy Soil Under Different Water Conditions. Soils 2024, 56, 525–532. [Google Scholar] [CrossRef]
  41. She, T.; Tian, Y. Effects of litter diversity on decomposition process and soil microbial characteristics in forest ecosystems. Ecol. Sci. 2020, 39, 213–223. [Google Scholar] [CrossRef]
  42. Huang, H.M.; Yan, J.L.; Li, J.J.; Xiang, M.Z.; Li, C.H.; Liao, S.S.; Huang, X.M.; You, Y.M. Effects of Introducing Other Tree Species of Different Ages into Pinus massoniana Plantation on Activities and Stoichiometric Ratios of Enzymes Associated with Soil Aggregates. Guangxi Sci. 2024, 31, 427–438. [Google Scholar] [CrossRef]
  43. Dong, X.D.; Gao, P.; Li, T.; Zhang, J.C.; Dong, J.W.; Xu, J.W.; Dun, X.J. Effects of soil microbial community on the litter decomposition in mixed Quercus acutissima Carruth. and Robinia pseudoacacia L. forest. Acta Ecol. Sin. 2021, 41, 2315–2325. [Google Scholar] [CrossRef]
  44. Sun, C.C.; Wang, Z.Q.; Pan, C.; Song, Y.Q.; Yu, Y.C. Effects of Cunninghamia lanceolata and Schima superba Mixed Forest on Soil Nutrients and Enzyme Activities. J. Jiangxi Agric. Univ. 2023, 45, 517–525. [Google Scholar] [CrossRef]
  45. Su, S.; Jin, N.; Wei, X. Effects of thinning on the understory light environment of different stands and the photosynthetic performance and growth of the reforestation species Phoebe bournei. J. For. Res. 2024, 35, 6. [Google Scholar] [CrossRef]
  46. Pan, Y.Y. Preliminary study on the growth amount and soil fertility of Cunninghamia and broad-leaved mixed forest. Green Technol. 2016, 15, 8–10. [Google Scholar] [CrossRef]
  47. Maccherini, S.; Salerni, E.; Mocali, S.; Bianchetto, E.; Landi, S.; De Meo, I.; Di Salvatore, U.; Marchi, M.; Bacaro, G.; Tordoni, E. Silvicultural management does not affect biotic communities in conifer plantations in the short-term: A multi-taxon assessment using a BACI approach. For. Ecol. Manag. 2021, 493, 119257. [Google Scholar] [CrossRef]
  48. Tian, X.R.; Shu, L.F. The Application and Besearch of Fire Break Forest Belts. World For. Res. 2000, 13, 20–26. [Google Scholar] [CrossRef]
  49. Liang, H.; Wang, L.; Wang, Y.; Quan, X.; Li, X.; Xiao, Y.; Yan, X. Root Development in Cunninghamia lanceolata and Schima superba Seedlings Expresses Contrasting Preferences to Nitrogen Forms. Forests 2022, 13, 2085. [Google Scholar] [CrossRef]
  50. Yang, L.; Mao, M.Y.; Guo, J.L.; Yang, H.; Zhang, X.Y.; Li, S.B. Hydraulic architecture and photosynthetic characteristics of Chinese fir at different canopies heights. J. For. Environ. 2024, 44, 468–475. [Google Scholar] [CrossRef]
  51. Jia, X.R.; Su, Z.Y.; Ou, Y.D.; Xie, D.D. Canopy structural parameters and understory light regimes of 3 artificial forest stands in South China. Guangxi Plants 2011, 31, 473–478, 544. [Google Scholar] [CrossRef]
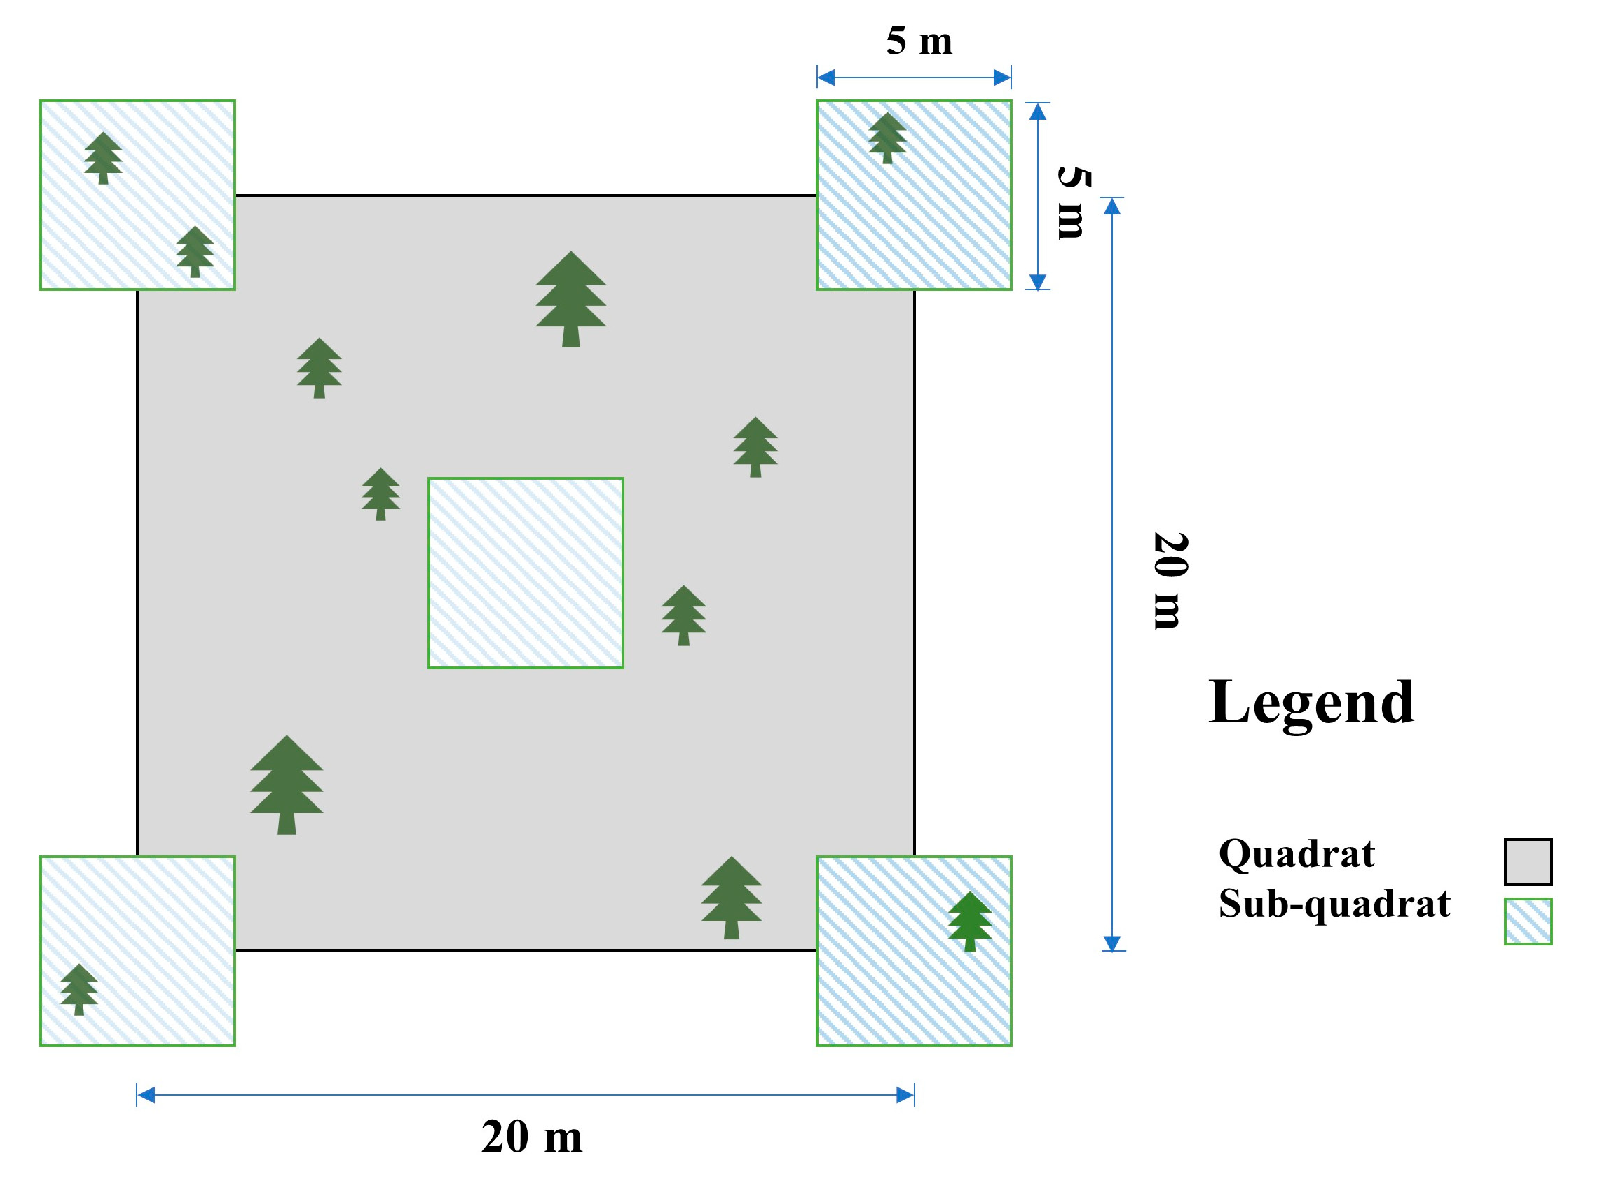
Figure 1. Nested quadrat design 20 m × 20 m main quadrat (solid gray fill) containing five 5 m × 5 m sub-quadrats (hatched blue fill at 45° angle) positioned at the geometric center and four corners.
Forests 16 01290 g001
Figure 2. Taxa numbers in the understory shrub layer (left) and herb layer (right) of C. lanceolata plantations under different mixed patterns.
Forests 16 01290 g002
Figure 3. Diversity indices of undergrowth vegetation in C. lanceolata plantations with different mixed patterns. Different lowercase letters (e.g., ab) indicate statistically significant differences (p < 0.05) between the mixed pattern groups.
Forests 16 01290 g003
Figure 4. Soil nutrient concentrations in C. lanceolata plantations under different mixed patterns: (a) total nitrogen (TN); (b) available nitrogen (AN); (c) total phosphorus (TP); (d) available phosphorus (AP). Different small letters indicate significant differences among different mixed modes (p < 0.05), and different capital letters indicate significant differences among different soil layers (p < 0.05). The same below.
Forests 16 01290 g004
Figure 5. Soil nutrient concentrations in C. lanceolata plantations under different mixed patterns: (a) total potassium (TK); (b) available potassium (AK); (c) soil organic matter; (d) pH.
Forests 16 01290 g005
Figure 6. Correlation between understory species diversity indices and soil chemical properties across different mixed patterns (SD: Simpson dominance index of shrub layer; SH: Shannon–Wiener diversity index of shrub layer; SE: Pielou evenness index of shrub layer; SS: Margalef richness index of shrub layer; HD: Simpson dominance index of herb layer; HH: Shannon–Wiener diversity index of herb layer; HE: Pielou evenness index of herb layer; HS: Margalef richness index of herb layer; TN: total nitrogen; TP: total phosphorus; TK: total potassium; AN: available nitrogen; AP: available phosphorus; AK: available potassium; SOM: organic matter). *: p < 0.05; **: p < 0.01.
Forests 16 01290 g006
Table 1. Site conditions of different mixed patterns.
Mixed Stand TypeSpecies Mixing RatioAverage Diameter at Breast Height (cm)Average Tree Height (m)
T1CL:LF = 1:319.18 ± 2.7514.20 ± 2.55
T2CL:PB = 1:312.54 ± 0.438.77 ± 1.30
T3CL:PB:LF = 1:2:112.47 ± 0.739.66 ± 0.52
T4CL:PB:SS = 1:2:113.11 ± 0.449.13 ± 0.76
T5CL:PB:CF = 1:2:116.79 ± 0.8614.49 ± 2.95
T6CL:PB:PE = 1:2:112.23 ± 1.278.04 ± 1.17
(a) Species abbreviations: CL: C. lanceolata, PB: P. bournei, LF: L. formosana, SS: S. superba, CF: C. fissa, PE: P. elliottii. (b) Shared parameters: age = 24 yr, mixture duration = 10 yr, altitude = 140 m. (c) Initial planting density: 3300 stems ha−1 for all treatments. (d) Values are mean ± SD.
Table 2. Characteristics and importance values (%) of understory plant community under different mixed planting patterns.
LayerNum.Scientific NameFamily NameMixed Pattern
T1T2T3T4T5T6
Shrub Layer1Litsea cubeba (Lour.) Pers.Lauraceae0000010.19
2E. japonicaTheaceae16.9313.9312.145.5211.7414.32
3Rubus corchorifolius L. f.Rosaceae19.054.773.911.858.318.65
4Morinda officinalis HowRubiaceae15.438.75508.5511.61
5L. chinenseHamamelidaceae10.345.7213.7810.918.6910.15
6S. paniculataSymplocaceae9.0711.999.297.877.7611.06
7Raphiolepis indica (L.) Lindl.Rosaceae05.5702.784.3213.18
8Smilax china L.Smilacaceae00008.924.75
9Toxicodendron vernicifluum(Stokes) F. A. Barkley Anacardiaceae9.1511.776.6311.127.164.75
10L. formosanaHamamelidaceae7.4809.85000
11Mussaenda pubescens W. T. AitonRubiaceae26.5200016.040
12Clerodendrum cytrophyllum Turcz.Lamiaceae000010.320
13Dalbergia hupeana HanceFabaceae08.179.973.754.320
14P. bourneiLauraceae015.0215.139.683.610
15Camellia japonica L.Theaceae14.093.057.283.064.320
16Ardisia japonica (Thunb.) BlumePrimulaceae014.067.249.4400
17Ficus pandurate HanceMoraceae00021.6100
Herb Layer1D. dichotomaGleicheniaceae46.9153.929.2432.3363.8240.24
2W. japonicaBlechnaceae34.4127.727.2216.0133.9531.83
3Cornopteris decurrentialata (Hook.) NakaiAthyriaceae0000022.45
4Smilax glabra Roxb.Smilacaceae7.56013.18.1204.55
5Lophatherum gracile Brongn.Poaceae13.257.8516.918.66011.16
6Dryopteris chinensis (Baker) Koidz.Dryopteridaceae17.62007.1027.46
7Melastoma dodecandrum Lour.Melastomataceae000010.7610
8Ficus tikoua Bur.Moraceae00006.680
9Adiantum flabellulatum L.Pteridaceae0014.3721.936.680
10Ophiopogon bodinieri H. Lév.Asparagaceae008.7111.3100
11Miscanthus floridulus (Labill.) Warb.Poaceae010.7615.0211.3100
12S. chinaSmilacaceae09.320000
13Hedyotis auricularia L.Rubiaceae00013.100
The table displays the top five highest values for each planting pattern, with five from the herb layer and five from the shrub layer.
Table 3. Biomass of shrub layer and herb layer under different mixed patterns of C. lanceolata plantation.
Mixed PatternAboveground Biomass/(g·m−2)Proportion of the Total Biomass/%
Shrub LayerHerb LayerTotal BiomassShrub LayerHerb Layer
T176.52 ± 1.63 a102.63 ± 0.82 b179.15 ± 2.12 b42.7157.29
T2141.24 ± 4.92 c122.71 ± 1.70 c263.95 ± 4.13 c53.5146.49
T3198.01 ± 1.71 e142.36 ± 5.82 d340.36 ± 4.35 e58.1841.82
T4240.26 ± 3.27 f183.09 ± 3.38 e423.35 ± 2.13 f56.7543.25
T5165.99 ± 1.66 d142.69 ± 7.58 d308.67 ± 6.23 d53.7746.23
T685.08 ± 2.12 b75.55 ± 1.79 a160.63 ± 1.94 a52.9747.03
Table 4. Correlation between aboveground biomass and plant diversity index of shrub layer and herb layer under different mixed patterns of C. lanceolata plantation.
Biomass Indexes BsBhBt
Plant diversity indexes in shrub layerD0.3370.1730.281
H0.541 *0.3680.485 *
E−0.317−0.336−0.329
S0.656 **0.488 *0.603 **
Plant diversity indexes in herb layerD0.4290.2740.378
H0.593 **0.4660.554 *
E0.3490.310.34
S0.567 *0.4170.519 *
Bs: aboveground biomass of shrub layer; Bh: aboveground biomass of herb layer; Bt: total aboveground biomass; *: p < 0.05; **: p < 0.01.
Disclaimer/Publisher’s Note: The statements, opinions and data contained in all publications are solely those of the individual author(s) and contributor(s) and not of MDPI and/or the editor(s). MDPI and/or the editor(s) disclaim responsibility for any injury to people or property resulting from any ideas, methods, instructions or products referred to in the content.