Abstract
Forest volume is an important information for assessing the economic value and carbon sequestration capacity of forest resources and serves as a key indicator for energy flow and biodiversity. Although remote sensing technology is applied to estimate volume, optical remote sensing data have limitations in capturing forest vertical height information and may suffer from reflectance saturation. While LiDAR data can provide more detailed vertical structural information, they come with high processing costs and limited observation range. Therefore, improving the accuracy of volume estimation through multi-source data fusion has become a crucial challenge and research focus in the field of forest remote sensing. In this study, we integrated Sentinel-2 multispectral data, Resource-3 stereoscopic imagery, UAV-based LiDAR data, and field survey data to quantitatively estimate the forest volume in Saihanwula Nature Reserve, located in Inner Mongolia, China, on the southern part of Daxing’anling Mountains. The study evaluated the performance of multi-source remote sensing features by using recursive feature elimination (RFE) to select the most relevant factors and applied four machine learning models—multiple linear regression (MLR), k-nearest neighbors (kNN), random forest (RF), and gradient boosting regression tree (GBRT)—to develop volume estimation models. The evaluation metrics include the coefficient of determination (R2), root mean square error (RMSE), and relative root mean square error (rRMSE). The results show that (1) forest Canopy Height Model (CHM) data were strongly correlated with forest volume, helping to alleviate the reflectance saturation issues inherent in spectral texture data. The fusion of CHM and spectral data resulted in an improved volume estimation model with R2 = 0.75 and RMSE = 8.16 m3/hm2, highlighting the importance of integrating multi-source canopy height information for more accurate volume estimation. (2) Volume estimation accuracy varied across different tree species. For Betula platyphylla, we obtained R2 = 0.71 and RMSE = 6.96 m3/hm2; for Quercus mongolica, R2 = 0.74 and RMSE = 6.90 m3/hm2; and for Populus davidiana, R2 = 0.51 and RMSE = 9.29 m3/hm2. The total forest volume in the Saihanwula Reserve ranges from 50 to 110 m3/hm2. (3) Among the four machine learning models, GBRT consistently outperformed others in all evaluation metrics, achieving the highest R2 of 0.86, lowest RMSE of 9.69 m3/hm2, and lowest rRMSE of 24.57%, suggesting its potential for forest biomass estimation. In conclusion, accurate estimation of forest volume is critical for evaluating forest management practices and timber resources. While this integrated approach shows promise, its operational application requires further external validation and uncertainty analysis to support policy-relevant decisions. The integration of multi-source remote sensing data provides valuable support for forest resource accounting, economic value assessment, and monitoring dynamic changes in forest ecosystems.
1. Introduction
Forests are the cornerstone of terrestrial ecosystems, playing a vital role in maintaining ecological balance, regulating climate, and improving the overall environment [1,2]. Forest volume (FV) serves as a critical indicator for reflecting the abundance of forest resources and evaluating the quality of forest ecosystems [3,4,5,6]. Consequently, accurately estimating forest volume at a regional scale has been a significant area of focus within forestry research. Global initiatives such as the United Nations Sustainable Development Goals (SDG 13: Climate Action) and the Paris Agreement have highlighted the urgent need for improved forest monitoring systems, particularly in relation to carbon sequestration and climate adaptation. Forest volume estimation, as a precursor to carbon accounting, is thus increasingly recognized not only as a scientific endeavor but also as a policy-relevant tool for evidence-based environmental governance [2,4,7]. Precise management of forest resources and the enhancement of their information management are indispensable for formulating scientifically sound forest carbon sequestration strategies [8,9]. Traditional methods for estimating forest volume mainly rely on field sampling and forest growth equations. However, these approaches are marred by long update cycles, low efficiency, and high costs [10]. Field-based surveys, while precise, are logistically challenging in remote or rugged terrains, making scalable remote sensing solutions particularly valuable in such contexts. Thanks to the remarkable progress in next-generation spaceborne and airborne remote sensing technologies, it is now feasible to obtain timely and accurate spatial information for forest areas, which is of great value for investigating terrestrial ecological balance and carbon storage potential [2,11].
Despite advancements in forest volume estimation, a persistent knowledge gap remains in accurately assessing biomass and volume in structurally complex, multi-species forests located in mountainous terrains. Most existing studies have focused on either lowland homogeneous forests or relied on single-source data, which struggle to capture the combined spectral and structural heterogeneity of diverse ecosystems. Future research must prioritize external validation of such frameworks using independent datasets and rigorous uncertainty quantification to ensure reliability for policy applications. Particularly in dense secondary forests with varied slope aspects, conventional optical methods face saturation, while microwave and LiDAR approaches encounter technical limitations due to terrain effects or acquisition constraints. This lack of integrated modeling strategies, specifically tailored for regions like the Saihanwula Nature Reserve, highlights the need for a synergistic framework that combines complementary remote sensing sources.
Multi-source remote sensing data have been widely adopted in volume estimation models, such as spaceborne and airborne optical data, microwave remote sensing, and LiDAR data. Traditional optical remote sensing for forest volume estimation emerged in the 1970s–1980s, with early studies leveraging multispectral data from Landsat MSS to estimate biomass parameters. It utilizes vegetation reflectance, vegetation indices, image transformation components, and high-resolution texture features to construct volume models, enabling estimations with relatively high temporal and spatial resolutions [12,13,14]. Nevertheless, spectral saturation in high-biomass forests primarily affects near-infrared (NIR) bands, where vegetation reflectance plateaus due to canopy light interception, whereas visible bands remain relatively unaffected. Although previous studies have attempted to mitigate this issue through methods like mitigating saturation effects through sensor radiometric calibration and atmospheric correction improvements [15], and applying data compression algorithms, it remains challenging to distinguish spectral differences among various tree species solely based on vegetation indices and texture features [16]. This limitation is particularly evident in dense secondary forests and heterogeneous canopies, where spectral reflectance tends to saturate beyond a certain volume threshold. As a result, models based solely on optical inputs often fail to capture vertical structural variability, leading to systematic underestimation in high-volume regions. Unlike spectral indices that capture both surface reflectance and canopy subsurface characteristics, Canopy Height Models derived from LiDAR or stereoscopic imagery provide direct structural measurements of vertical forest heterogeneity. This complementary dimension addresses one of the most persistent challenges in volume modeling: the inability of 2D spectral data to accurately represent 3D forest structure, particularly in mature, multi-layered canopies [17,18,19]. Microwave remote sensing, which is immune to weather conditions and possesses penetration capabilities, can offer comprehensive information regarding forest structure and functions by leveraging backscatter coefficients and interferometric data. For instance, spaceborne synthetic aperture radar (SAR) provides coarse-scale forest structural information, primarily reflecting canopy volume and biomass density through radar backscatter mechanisms, serving as an effective predictor for volume estimation [19,20,21]. However, in complex forest environments like mountainous regions, geometric distortions caused by terrain and temporal decorrelation can introduce substantial errors in the estimation process. LiDAR stands out with its unique advantages as it can generate digital surface models (DSM) and precise digital elevation models (DEM) to extract vertical structure information, and using LiDAR-derived Canopy Height Models (CHM) effectively mitigate saturation in high-density forests, though their performance varies with forest structure and density [22,23]. However, LiDAR data alone cannot provide sufficient spectral context for discriminating between species or assessing vegetation health. Therefore, integrating CHM with multispectral and texture features offers a complementary perspective that captures both the horizontal and vertical heterogeneity of forest canopies, enabling a more comprehensive estimation framework [24]. Nevertheless, airborne LiDAR systems have limited coverage areas and come with high costs. Therefore, spaceborne LiDAR, including systems like GEDI and ICESat-2, is often combined with other remote sensing data to improve estimation accuracy [25,26]. However, in practice, even with these combined efforts, achieving a satisfactory volume estimation for various forest situations, especially those with complex characteristics, remains a challenge. In the Saihanwula Nature Reserve (42°22′–42°31′ N, 118°18′–118°30′ E), located in Chifeng City, Inner Mongolia Autonomous Region, China, the terrain there is extremely complex with numerous mountainous areas. Despite the growing interest in forest volume estimation across temperate ecosystems, while regional forest studies exist for northern China, few have focused on complex mountainous ecosystems with heterogeneous topography like the Saihanwula Nature Reserve. The unique topographic variability and species composition of this area pose significant challenges for conventional remote sensing techniques, necessitating a more tailored and integrated approach. Moreover, it features a mixed forest of multiple tree species, where the secondary forests are so dense that it is difficult to accurately segment them. In such a situation, previous research means have shown significant deficiencies. The traditional optical remote sensing struggles to precisely distinguish between different tree species due to the spectral similarity issues in the complex forest environment. Microwave remote sensing is affected by terrain-induced geometric distortions, leading to errors in estimating volume. For LiDAR, the dense secondary forests make it hard for the equipment to access and obtain comprehensive data, limiting its effectiveness. As a result, the accuracy of volume estimation in this area using existing methods is far from satisfactory. While the incorporation of hybrid learning frameworks, including deep learning architectures, holds promise for improving generalizability in forest volume modeling, this study focuses on interpretable machine learning algorithms due to data size constraints and the need for model transparency [27,28]. Future work may explore deep learning approaches to further enhance accuracy, particularly in large-scale or data-rich forest environments.
Given the complexity of the Saihanwula Nature Reserve’s forest conditions, including its mountainous terrain, multi-species mixed forests, and the challenges posed by the dense secondary forests, there is an urgent need for more suitable and accurate volume estimation methods. While the incorporation of hybrid learning frameworks, including deep learning architectures, holds promise for improving generalizability in forest volume modeling, this study focuses on interpretable machine learning algorithms due to data size constraints and the need for model transparency. Future work may explore deep learning approaches to further enhance accuracy, particularly in large-scale or data-rich forest environments. Volume estimation usually involves both parametric and non-parametric empirical models. Parametric models, like linear, logarithmic, or power functions, are incapable of modeling complex nonlinear relationships [29]. Non-parametric models, including neural networks, k-nearest neighbors (kNN), random forest (RF), and support vector machines (SVM), face challenges, including data noise, model overfitting, and the curse of dimensionality. In remote sensing applications, spectral bands often exhibit high inter-correlation, increasing the risk of overfitting when all features are included without dimensionality reduction, which can undermine model accuracy [30]. Machine learning techniques, such as gradient boosting regression trees (GBRT), have shown promise in forest volume estimation. Their ability to handle non-linear relationships makes them suitable for complex ecological data. Future research could explore deep learning frameworks, which have demonstrated superior performance in spatial pattern recognition for similar remote sensing tasks. Despite this progress, there remains a lack of integrative approaches that combine multispectral data, stereoscopic imagery, and LiDAR-derived canopy metrics into a unified predictive framework. Bridging this gap is critical not only for enhancing estimation accuracy, but also for informing broader applications such as carbon stock accounting, biodiversity assessment, and sustainable forest management. In this context, the present study proposes an integrated modeling strategy. Given these challenges, a unified, multi-source approach that integrates structural signals derived from LiDAR-generated Canopy Height Models (CHM) with spectral metrics from Sentinel-2 multispectral imagery. Through advanced machine learning models is needed to improve estimation reliability and generalizability in forest ecosystems with complex physiographic and floristic characteristics [31,32,33].
Volume estimation in the complex, mountainous, and multi-species forests of the Saihanwula Nature Reserve remains challenging, largely due to limitations in data sources and modeling approaches. To address these challenges, this study integrates forest resource plot data with multi-source remote sensing datasets—including Sentinel-2 spectral imagery, Resource-3 stereoscopic data, and airborne LiDAR—for improved volume estimation [34,35]. However, uncertainty quantification for biomass estimation was not conducted herein, and future research is recommended to incorporate this for enhanced forest monitoring reliability. By analyzing the contributions of spectral features, texture features, and canopy height to volume and employing the recursive feature elimination (RFE) with 10-fold cross-validation identified optimal variables, ranking features by Gini impurity reduction from random forest models. We construct and compare four models: fandom forest (RF), k-nearest neighbors (kNN), gradient boosting regression trees (GBRT), and multiple linear regression (MLR) to evaluate their effectiveness for volume estimation in the Saihanwula Nature Reserve. This comparative framework aims to support dynamic forest volume monitoring in protected areas through multi-source data fusion. Accurate volume estimation not only contributes to ecological research but also supports national forest inventory programs, carbon trading mechanisms, and the implementation of REDD+ strategies. This underscores the practical significance of advancing robust and scalable volume estimation methods, particularly for ecologically sensitive and structurally complex forest regions such as Inner Mongolia [33,36].
In summary, this research is not only crucial for improving the accuracy of volume estimation in the specific context of Saihanwula Nature Reserve but also has the potential to offer valuable references for similar forest areas with complex characteristics across the region. Moreover, the proposed methodology can serve as a transferable framework for other forested regions facing similar topographic and structural complexity, contributing to global efforts in ecosystem monitoring and climate resilience.
2. Materials and Methods
2.1. Study Area Overview
Saihanwula Nature Reserve is located in the middle and lower mountainous regions of Southern Daxing’anling Mountains (43°59′–44°27′ N, 118°18′–118°55′ E), covering a total area of 1004.62 km2 (Figure 1). It spans across Suobojiga Town, Han Mountain Forest Farm, and Xingfu Village. The mountains in this region generally extend from northeast to southwest, with an average elevation of around 1000 m. The region has an average annual temperature of 2 °C and average annual precipitation of 400 mm, based on 1991–2020 climatological normals from the China Meteorological Data Service Center. The reserve’s forest vegetation is highly diverse, shaped by topographic variation and microclimatic differences. Vegetation distribution in the reserve is governed by interactions among slope aspect, elevation, soil moisture, and microclimate. Mid-elevation shaded slopes support larch, while sunny, lower-elevation slopes host birch. Higher shaded slopes feature Populus davidiana and Betula platyphylla, whereas sunny slopes harbor Quercus mongolica and Betula dahurica. These patterns, consistent with regional studies linking aspect/elevation to precipitation and growing season length, highlight the reserve’s distinct plant communities and ecological significance. Saihanwula is one of the few comprehensive mountain nature reserves in China, being focused on the protection of forest, grassland, and wetland ecosystems, biodiversity, and key water conservation areas for the source of the Xiliao River. Given its heterogeneous structure and multi-layered canopy configuration, this ecological complexity—characterized by mixed-species forests, varied slope aspects, and dense canopy structures—combined with a well-distributed network of ground inventory plots, positions Saihanwula as an exemplary, data-rich reference site for testing advanced remote sensing-based volume estimation frameworks.
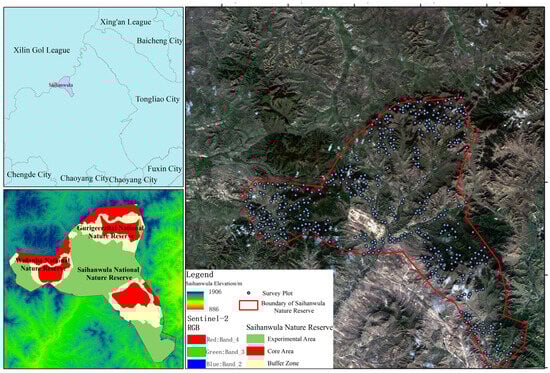
Figure 1.
Location of the study area, DEM map, suvey plots in the area, and boundaries of the protected area.
2.2. Ground Data Acquisition
Systematically collected forest inventory data served as the primary reference for model development and validation in this study. These plot-level measurements were obtained from a region-wide monitoring program designed to capture species composition, structural attributes, and temporal variability in forest conditions. This method offered several advantages, including its extensive coverage, representation of various forest types, diverse survey subjects, standardized acquisition of key forest structural parameters, and strong temporal continuity. Following the principles of systematic sampling, sampling used a 1 km × 1 km ArcGIS fishnet with systematic random start to avoid bias. Edge effects were mitigated by a 500 m buffer and excluding cells <50% within the reserve, validated by spatial autocorrelation tests. In addition, forest stand characteristics were collected, such as the dominant tree species, average tree height, diameter at breast height (DBH), canopy cover, tree species origin, and age group. A total of 415 plots were surveyed, consisting of 187 plots of Betula platyphylla, 83 plots of Populus davidiana, and 145 plots of Quercus mongolica, in 2023 (Figure 1). To ensure a robust performance evaluation, model validation was conducted via spatially stratified 10-fold cross-validation, with stratification by dominant tree species to maintain inter-class balance. All 415 field plots were included in the cross-validation framework; no plots were reserved for independent validation due to sample size limitations. However, prior to modeling, the dataset was first split into training (80%) and testing (20%) subsets. Min-Max normalization was then applied independently to each subset, with scaling parameters derived solely from the training data. Summary statistics of the field-measured forest volumes are presented in Table 1.

Table 1.
Ground information summary (based on 2023 years).
2.3. Remote Sensing Data Acquisition
2.3.1. Acquisition and Processing of Sentinel-2 Data
Sentinel-2 imagery was used to obtain high-resolution multispectral information characterizing vegetation structure, condition, and spatial heterogeneity across the study area. Sentinel-2 data acquired during peak vegetation conditions in September 2022 were selected for optimal volume signal retrieval (Table 2). Two scenes of L1C-level multispectral imagery were downloaded from the European Space Agency’s website (https://dataspace.copernicus.eu/). Using the Sen2cor plugin, radiometric calibration and atmospheric correction were applied [37,38], generating L2A surface reflectance spectral products. Based on previous studies, three 60 m resolution bands (aerosol, water vapor, and shortwave cirrus) were removed. The remaining four 10 m bands and six 20 m bands were resampled and fused into a unified 10 m resolution product using SNAP software tools (version 8.0). The 10 m and 20 m bands were resampled to a common 10 m grid using bilinear interpolation, ensuring spatial consistency. This resampling scheme balances spatial fidelity with spectral accuracy, as recommended for multi-resolution remote sensing data fusion. To address reflectance issues in complex terrain, the 2 m LiDAR DTM was downsampled to 10 m via bilinear interpolation for Sentinel-2 compatibility, maintaining topographic accuracy. Datasets were integrated in UTM 50N, with terrain corrections applied to spectral indices using the cosine method. Terrain correction was performed using the SCS+C model, and spectral variables extracted from the corrected data were used for volume modeling [39,40,41]. The SCS+C correction model, which combines slope and aspect effects with sensor geometry, was selected for its proven effectiveness in correcting topographic-induced illumination variability in mountainous forest environments.
Table 2.
Overview of remote sensing and ground survey datasets.
2.3.2. Canopy Height Acquisition
The ZY-3 (Resource-3) satellite, known for its efficient stereoscopic mapping and high-resolution coverage, is China’s first civil stereoscopic remote sensing satellite. In this study, ground control points and tie points were selected to generate stereoscopic images with a spatial resolution of 2.1 m, which were then used to calculate the digital surface model (DSM) for the Saihanwula forest area. First, the elevation information of the control points was obtained from airborne LiDAR-based DTM data. The LiDAR point clouds were collected using the LiAir220 lightweight LiDAR system, which incorporates a 40-channel Pandar40 laser sensor to acquire accurate 3D point cloud data. Data acquisition took place in September 2022, with a density of 3 points per square meter. Next, the DSM was precisely retrieved from the ZY-3 satellite by calculating the tie points and control points’ DTM. The regional network adjustment was used to construct the topological geometric relationship of matching image points in the 3D stereoscopic image. The point cloud model was reconstructed from the stereoscopic image pair. High-precision, low-noise front, and backward-facing images were used, and the DSM was derived after matching validation based on core-line images (Xie et al. 2019) [27]. Finally, a 12.5 m spatial resolution open-source digital elevation model (DEM) was retrieved from NASA’s Earth Data Portal (https://search.asf.alaska.edu/) (accessed on 20 September 2022). The Canopy Height Model (CHM) was generated by subtracting the digital elevation model (DEM) from the digital surface model (DSM), applying a 3 × 3 (https://search.asf.alaska.edu/) (accessed on 20 September 2022) pixel median filter to reduce noise while preserving canopy structure, creating a continuous surface using inverse distance weighting (IDW) interpolation with a power parameter of 2 and a 3 m search radius to balance spatial influences and resampling the final CHM to a 30 m resolution using bicubic interpolation to ensure compatibility with field plot data and minimize spatial scale mismatch. After filtering and replacing anomalous pixels, the final CHM for the study area was obtained. The final model was resampled to a 30 m spatial resolution. The CHM was resampled to 30 m using bicubic interpolation, a method that preserves height gradient continuity while reducing spatial resolution, serving as a key structural variable in the subsequent volume estimation models. The CHM, which captured vertical complexity at fine spatial scales, was subsequently combined with spectral and textural metrics to enhance the model’s responsiveness to volume variation across forest types. The integration of stereo-derived CHM with spectral indices aimed to mitigate limitations inherent in single-source datasets, especially in structurally complex forest regions. A summary of all remote sensing and ground survey datasets is provided in Table 2.
Together, these multi-source datasets—combining optical, structural, and in situ field observations—provided a robust, multidimensional basis for advanced feature engineering, hybrid model development, and cross-scale validation in volume estimation workflows.
2.4. Feature Extraction and Selection
To enhance model robustness and minimize overfitting risks arising from multicollinearity and high dimensionality, this study extracted a comprehensive set of spectral, textural, and structural predictors, followed by rigorous feature selection to mitigate redundancy and enhance model reliability. Spectral and texture features relevant to forest stock volume inversion were extracted from Sentinel-2 data with a 10 m spatial resolution. The central pixel of each 3 × 3 pixel window overlapping the plot center was extracted, with a 15 m buffer around the plot boundary applied to minimize edge effects. This approach reduces mixed-pixel effects and improves the spatial fidelity of feature-to-plot correspondence. The extracted remote sensing factors are as follows:
- (1)
- Original Single-Band Factors:
Includes blue (B2), green (B3), red (B4), red-edge (B5), near-infrared (NIR) (B6, B7, B8A), and shortwave infrared (SWIR) (B11, B12).
- (2)
- Texture Feature Factors:
Includes mean (ME), variance (Var), homogeneity (Hom), contrast (Con), correlation (Cor), dissimilarity (Dis), angular second moment (ASM), and entropy (Ent), which were extracted using a 7 × 7 window (70 × 70 m) with the gray level co-occurrence matrix method. The analysis considered four primary directions to capture anisotropic canopy patterns, and gray-level quantization was set to 16 levels to balance computational efficiency and textural detail. Each original single-band factor corresponds to eight second-order texture metrics, capturing spatial arrangement and radiometric contrast within canopy patterns—attributes closely linked to forest stand density, structural complexity, and species diversity.
- (3)
- Vegetation Index Factors:
Includes chlorophyll index (CI), red-edge chlorophyll index (CIRE), difference vegetation index (DVI), enhanced vegetation index (EVI), red-edge enhanced vegetation index (EVIRE1, EVIRE2, EVIRE3), narrow near-infrared enhanced vegetation index (EVINNIR), green normalized difference vegetation index (GNDVI), red-edge chlorophyll index (IRECI), soil-adjusted vegetation index (MSAVI), morphological shadow index (MSI), normalized difference vegetation index (NDVI, NDVI705), plant senescence reflectance index (PSRI), renormalized difference vegetation index (RDVI), soil-adjusted vegetation index (SAVI), and vegetation stress index (STVI). These indices capture different aspects of canopy vigor, chlorophyll content, water stress, and senescence, which are highly relevant for volume variation.
- (4)
- Canopy Height Model (CHM):
Includes the maximum value, mean, standard deviation, variance, and various height percentiles (5%, 20%, …, 90%) within the plot area, used as modeling variables. These metrics characterize vertical heterogeneity and canopy complexity, which are well-established predictors of aboveground volume, particularly in heterogeneous, multi-strata, and species-diverse forest ecosystems.
In total, 53 candidate features were extracted, including 10 original spectral bands, over 8 GLCM texture metrics, 20 vegetation indices, and 15 structural descriptors derived from CHM. Given the substantial redundancy among the extracted features from Sentinel-2 and ZY-3, applying all variables directly would degrade model performance and computational efficiency due to the curse of dimensionality. Therefore, feature selection is performed before modeling to improve training accuracy and interpretability. This feature selection process was not merely statistical but strategically designed to align with the requirements of machine learning models, ensuring that only the most informative variables were retained for downstream learning algorithms. Recursive feature elimination (RFE) is an iterative wrapper-based technique that ranks features by their predictive contribution and progressively removes the least informative ones. In this study, a spatially stratified 10-fold cross-validation was used during RFE, with folds created via k-means clustering of plot coordinates to ensure geographic contiguity. This approach minimized spatial autocorrelation and preserved regional variability in forest types and topographic gradients. RFE has proven to be highly effective in machine learning and was employed in this study to optimize remote sensing variables, enhancing model performance and efficiency [41,42]. Additionally, the RFE methodology was introduced by Guyon, Weston, and others in 2002 and operated on a wrapper model and cross-validation principle, iteratively removing features that do not contribute to classification accuracy or hinder model performance until the best feature set is found [43,44]. This process not only simplifies model complexity but also enhances computational scalability for large-scale volume applications. The refined feature subset obtained through RFE was subsequently used as input to train and evaluate multiple machine learning models, enhancing computational efficiency, model interpretability, and generalization capability across structurally diverse forest environments and unseen spatial domains.
2.5. Forest Stock Volume Model Construction and Evaluation
In forestry research, the integration of multi-source remote sensing and machine learning techniques for estimating forest stock volume has proven to be reliable. In this study, four machine learning algorithms were employed, each optimized via Bayesian hyperparameter optimization with 50 iterations and 5-fold cross-validation, including random forest (RF), k-nearest neighbors (KNN), gradient boosting regression trees (GBRT), and multiple linear regression (MLR). Random forest (RF), an ensemble method that constructs multiple decision trees and averages their predictions, was chosen for its high accuracy, adaptability to large datasets, and resistance to overfitting. It is widely used in forestry for variable prediction. K-nearest neighbors (KNN), a non-parametric supervised algorithm, bases its predictions on the similarity of nearby data points. It is prized for its straightforward implementation and reliable accuracy and has seen previous applications in forestry like species classification and timber volume estimation. Gradient boosting regression trees (GBRT), which build an ensemble of weak decision-tree models, were selected due to their capacity to capture complex nonlinear relationships and have been successfully applied in forestry for accurate parameter estimation. Multiple linear regression (MLR), a foundational statistical method for modeling linear relationships between variables, was chosen as a baseline for comparison thanks to its simplicity and interpretability. It has also been widely used in forestry for volume estimation, such as in modeling forest stock volume in secondary forests of the Saihanwula region. These machine learning algorithms were not only selected based on prior forestry applications, but were systematically optimized using cross-validated hyperparameter tuning strategies (Bayesian and grid search), reinforcing their methodological integration into the modeling framework. Before the training process, hyperparameters like the number of estimators (n_estimators), learning rate (learning_rate), subsample size (subsample), maximum depth (max_depth), and minimum samples per leaf (min_samples_leaf) were fine-tuned [23,45]. Ten-fold cross-validation approach was utilized, where one sample from the 415-sample dataset was taken as the validation set and the remaining 414 samples served as the training set. This approach guarantees a thorough evaluation, reduces random bias, and produces stable results. The evaluation metrics adopted in this research cover cross-validation results, the coefficient of determination (R2), root mean square error (RMSE), and relative root mean square error (rRMSE) [46]. All the models were implemented using the scikit-learn library in Python version 3.12. To ensure a robust performance evaluation, model performance was evaluated via the spatially stratified 10-fold cross-validation, with stratification by dominant tree species to maintain inter-class balance. Prior to modeling, to ensure a robust performance evaluation, model performance was evaluated via the spatially stratified 10-fold cross-validation, with stratification by dominant tree species to maintain inter-class balance. Prior to modeling, the dataset was first split into training (80%) and testing (20%) subsets. Min-Max normalization was then applied independently to each subset, with scaling parameters derived solely from the training data. This approach ensures test set statistics do not influence the normalization process. For hyperparameter optimization, a grid search with 5-fold cross-validation was carried out separately for each model. Specifically, the GBRT model was tuned for the number of estimators (n = 100–500), learning rate (0.01–0.1), and maximum tree depth (3–8), while the RF model was optimized for the number of trees, maximum features, and minimum samples per split. Hyperparameters were optimized using Bayesian search with 50 iterations and 10-fold cross-validation. The gradient boosting regression trees (GBRT) achieved optimal performance with n_estimators = 110, learning_rate = 0.05, max_depth = 9, subsample = 0.5, and min_samples_leaf = 0.6. For the random forest (RF) model, n_estimators = 200, max_depth = 11, and min_samples_split = 4 were selected. The k-nearest neighbors (kNN) model used n_neighbors = 7 with distance-weighted predictions. These configurations were chosen to optimize model complexity and generalization across diverse forest types. Ultimately, the performance of all models was quantitatively assessed using the coefficient of determination (R2) and root mean square error (RMSE) on the independent test dataset.
The machine learning workflow, encompassing feature scaling, recursive selection, model tuning, and stratified validation, constitutes a robust pipeline aimed at capturing nonlinear interactions between canopy structure and spectral indicators. This pipeline ensures reliable prediction performance even in ecologically heterogeneous forest settings such as Saihanwula.
where yi represents the measured stock volume, is the estimated stock volume, is the mean of the observed stock volume of the stand, and N is the actual sample size.
3. Results and Analysis
3.1. Variable Selection and Correlation Analysis
A scatter plot of the ground-truth average stand height against the extracted CHM (Figure 2a) showed an R2 of 0.49 and RMSE of 4.10 m3/hm2, indicating a good linear relationship. There was a strong correlation (p = 0.74) between CHM and stand volume (Figure 2b), confirming that ZY-3 height data could improve inversion accuracy without issues like optical saturation or pixel detail loss. As a result, the generated Canopy Height Model (CHM) for the study area would be acceptable (Figure 2c).
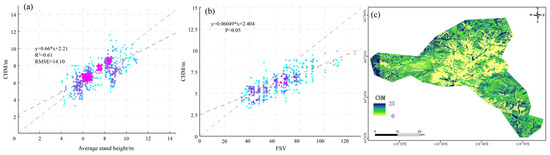
Figure 2.
CHM extraction results, (a) regression of VHM and stand height, (b) regression of CHM and stand volume, and (c) CHM result.
The observed stand height values ranged from 2.5 m to 24.9 m, with a mean of 8.4 m and standard deviation of 3.1 m. In this context, the reported RMSE of 4.10 m corresponds to roughly 17% of the maximum observed height, which is considered acceptable given the structural complexity of the Saihanwula forest. It is worth noting that CHM accuracy can vary under different forest density and topographic conditions, as shown in previous studies [47]. Future research may further investigate spatial heterogeneity in CHM performance to support broader generalization.
In the study, a total of 45 feature variables were initially selected, from which 14 variables were derived, spanning 3 distinct types. These types encompassed CHM overall height (Hm), CHM height 30th percentile (H30), CHM height 90th percentile (H90), soil-adjusted vegetation index (SAVI), difference vegetation index (DVI), enhanced vegetation index (EVI), red-edge enhanced vegetation index (EVIRE3), red-edge chlorophyll index (IRECI), vegetation stress index (STVI), green normalized difference vegetation index (GNDVI), green band mean (Green_Me), green band correlation (Green_Con), blue band correlation (Blue_Con), and red band variance (Red_Var). The generated Canopy Height Model (CHM) for the study area exhibited a range from 2.1 to 24.7 m, accompanied by a mean value of 8.4 m and a standard deviation of 3.1 m. These statistics clearly suggest that the forest canopy structure across Saihanwula varies considerably, and this variation is mirrored in the observed range and dispersion of the extracted CHM values that were then utilized for subsequent modeling. To further delve into the relationship between forest volume and CHM data, along with spectral and texture data, Pearson’s correlation coefficient was adopted to evaluate the sensitivity of different data types to forest volume. As depicted in the radial bar chart (Figure 3), the overall height of CHM (Hm) displayed the highest correlation with forest volume, reaching a value of 0.72. When it came to the spectral features, their correlation with forest volume spanned from –0.63 to 0.69, with the red-edge enhanced vegetation index (EVIRE3) showing the most significant correlation among them. In contrast, the texture features demonstrated relatively lower correlation with forest volume, where the green band mean (Green_Me) had the highest correlation within this group at 0.47. Feature importance was re-evaluated using permutation importance (Table 3), which provides unbiased estimates of each feature’s contribution to model performance. Overall, the findings imply that texture features have a weaker correlation with forest volume in comparison to spectral features, and moreover, CHM data can serve as an effective indicator for estimating forest volume.
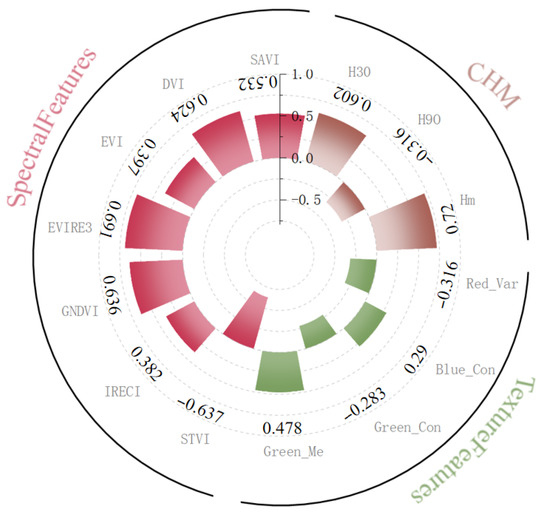
Figure 3.
Pearson correlation coefficients between feature factors and volume.
Table 3.
Comparison of inversion model accuracy.
3.2. Forest Volume Estimation Model Construction and Validation
Using the variable factors selected from Figure 3, four models—RF, KNN, GBRT, and MLR—were developed to estimate forest volume. The accuracy evaluation results of the different models (Table 4) demonstrated that machine learning models substantially outperformed the multiple linear regression (MLR) model, indicating that nonlinear relationships existed between the variable sets. The GBRT model achieved the highest R2 of 0.86, the lowest RMSE of 9.69 m3/hm2, and the lowest rRMSE of 24.57%. To further demonstrate the stability of model performance metrics, 95% confidence intervals (CIs) were calculated via 1000 bootstrap resamples. For the GBRT model, the 95% CIs were R2 = [0.83, 0.89], RMSE = [8.92, 10.46] m3/hm2, and rRMSE = [22.85, 26.29]%. Detailed CI results for all models are presented in Table 3. As a result, the GBRT model was selected for forest volume estimation and mapping analysis. In the construction of the GBRT model, random sampling was employed, with 80% of the sample data used for training and the remaining 20% used for validation. The selected variables were then incorporated into the GBRT model to compute the contribution rates of each driving factor. After training the model, feature interpretation results (Table 4) were used for secondary training, which led to the final selection of the modeling factors listed in Table 4. The GBRT model underwent 10-fold cross-validation, with repeated model building and removal of the least significant features to gradually identify the optimal feature subset. The final optimal model parameters were determined as n_estimators = 110, learning_rate = 0.05, subsample = 0.5, max_depth = 9, and min_samples_leaf = 0.6. The residual distribution of the GBRT model exhibited minimal systematic bias, with a mean residual of −0.78 m3/hm2 and a standard deviation of 7.91 m3/hm2, indicating stable predictive performance across volume gradients. The residuals for the MLR model, by contrast, showed high variance and a consistent underestimation trend in high-volume conditions.
Table 4.
Feature importance.
A visual representation of the model performance metrics and the relative importance of input features is provided in Figure 4. The radar plot (Figure 4a) clearly demonstrates the superior performance of the GBRT model across all evaluation metrics, with a markedly higher R2 and lower RMSE and rRMSE values compared to other models. These results reinforce the quantitative findings in Table 3 and underscore the GBRT model’s ability to effectively capture nonlinear relationships in the data. Meanwhile, the feature importance analysis (Figure 4b) confirms the dominance of spectral indices in driving model performance, particularly the EVIRE3 and DVI indices, which significantly outperformed structural (CHM-based) and texture features in terms of contribution scores. This pattern suggests that, despite the inclusion of canopy height variables, spectral features—especially those derived from red-edge bands—remain critical in explaining volume variability in the study area. Spatial analysis confirmed minimal systematic bias, though edge effects introduced modest overestimation in 7% of boundary pixels. Future work could reduce edge errors through object-based segmentation or higher-resolution CHM data.
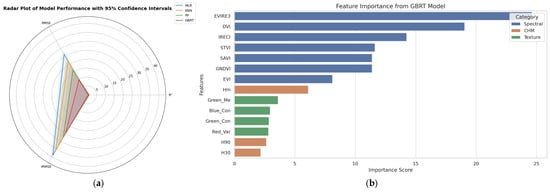
Figure 4.
(a) Comparative radar plot of model performance metrics (R2, RMSE, and rRMSE). (b) Feature importance from GBRT, categorized by input type (spectral, CHM, and texture).
To contextualize the reported accuracy metrics, it is worth noting that an R2 of 0.86 and RMSE of 9.69 m3/hm2 achieved by the GBRT model surpasses previous forest volume studies in similar temperate mountainous ecosystems, which often report R2 values below 0.75 due to structural heterogeneity and sensor limitations. Furthermore, according to national forest inventory benchmarks, an RMSE below 10 m3/hm2 is considered sufficient for sub-regional volume assessments in mixed-species stands. Therefore, the performance of the fusion-based GBRT model not only demonstrates statistical superiority but also holds practical significance for operational use in forest monitoring, resource accounting, and REDD+ reporting frameworks. The reduced accuracy for Populus davidiana reflects its unique crown architecture and spectral properties. Future studies should adopt species-stratified models incorporating 3D canopy metrics (e.g., vertical entropy) and phenological tracking, supplemented by targeted sampling of high-volume stands to capture structural extremes.
3.3. Analysis of Forest Stock Volume Characteristics in Saihanwula
The modeling results using three data sources—Sentinel-2, ZY-3, and multi-source fusion—are shown in Table 5. A visual comparison of inversion accuracy across different modeling approaches is further illustrated. The results indicated that multi-source fusion data held a potential to enhance inversion accuracy. By combining height variables with spectral–texture data, the modeling quality improved, with the coefficient of determination rising from 0.58 for ZY-3 to 0.67 for Sentinel-2 and reaching 0.75 for the fusion data. The reduction in root mean square error further demonstrated the advantages of fusion data, with estimation errors dropping by 4.42% compared to spectral–texture inversions and by 13.36% compared to CHM-based inversions. Additionally, analysis of the forest stock volume raster images revealed that Sentinel-2 inversion results were concentrated in the 50–90 m3/hm2 range, while ZY-3 inversions were more distributed in the 50 m3/hm2 and 70–110 m3/hm2 ranges. The fusion data estimates were closer to the actual values, with a more even distribution in the 50–110 m3/hm2 range. Higher stock volume areas were predominantly found in the southeastern core zone of the Saihanwula Nature Reserve (Figure 5).
Table 5.
GBRT modeling variables and accuracy evaluation.
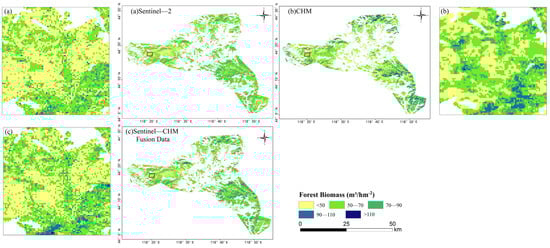
Figure 5.
Spatial distribution of forest volume in Saihanwula with different data sources.
The relatively lower predictive performance for Populus davidiana (R2 = 0.51, RMSE = 9.29 m3/hm2) compared to Betula platyphylla and Quercus mongolica indicates potential species-specific limitations in the modeling process. Several contributing factors may include variations in allometric growth models, phenological differences that affect spectral reflectance, or the irregular canopy structure that complicates CHM extraction. Moreover, the smaller sample size for Populus davidiana may have constrained the model’s learning capacity. Future work should consider species-stratified models or incorporate species-specific structural priors to improve estimation accuracy for underrepresented forest types.
Additionally, the morphological characteristics of Populus davidiana, such as its sparse and irregular crown structure, may reduce the accuracy of canopy height measurements derived from CHM, especially in multi-layered stands. Unlike Quercus mongolica and Betula platyphylla, which tend to form more compact and homogeneous canopies, Populus davidiana often exhibits high intraspecific variability and greater seasonal fluctuation in leaf reflectance. These traits can confound both structural extraction from ZY-3 and spectral differentiation in Sentinel-2, leading to elevated residual errors. Furthermore, its relatively fast growth and lower wood density may result in deviations from the dominant allometric models applied in this study. Together, these factors likely contributed to the observed drop in model performance for this species.
The comparative evaluation presented in Table 5 and Figure 6 further validates the advantage of multi-source data integration in forest volume estimation. While CHM-only (ZY-3) and spectral–texture (Sentinel-2) models showed moderate accuracy, the fusion-based model achieved the highest R2 (0.75) and lowest RMSE (8.16 m3/hm2), outperforming the individual sources by 13.36% and 4.42%, respectively, in rRMSE. These improvements highlight the complementary nature of CHM and spectral–textural information in capturing both structural and physiological variability in forest stands. Model diagnostics confirmed statistical assumptions were met: residuals exhibited no significant heteroscedasticity (p = 0.17), following a normal distribution (p = 0.12), and only 3 out of 415 samples showed high influence. To quantify uncertainty, 95% confidence intervals were derived via resamples. Error propagation analysis revealed that a ±1 m error in CHM translates to a ±3.2% bias in biomass estimates, indicating acceptable sensitivity to input uncertainties. Notably, the spectral-only model (Sentinel-2) improved upon the CHM-based model in R2 but still underperformed relative to the fusion approach, underscoring the value of structural enhancement through canopy height features. These results confirm the synergistic effect of multi-source remote sensing in increasing model robustness and predictive power under heterogeneous forest conditions.
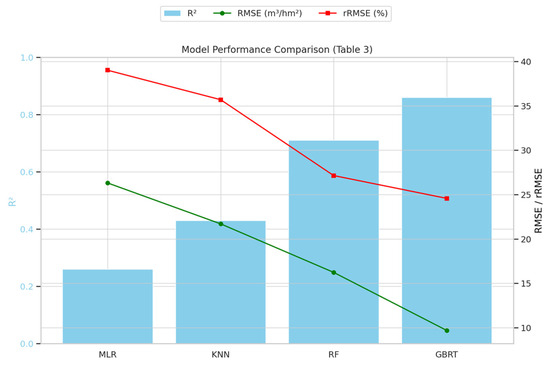
Figure 6.
Model performance comparison of MLR, KNN, RF, and GBRT in forest stock volume estimation using R2, RMSE, and rRMSE metrics.
The forest volume estimation was conducted using three datasets, followed by an analysis of the inversion accuracy for spectral–texture features, CHM, and fused data. The best estimation model was used to create scatter residual plots for different tree species (Figure 5). The ZY-3 data, with its higher spatial resolution and processing advantages, effectively represented the forest’s actual conditions. However, it showed relatively low R2 and high RMSE, indicating lower accuracy in volume estimation. The CHM features extracted from ZY-3 tended to underestimate high values, likely due to sensor limitations and interference from the multilayer canopy structure. The Sentinel-2 data showed varying precision across species, with higher accuracy for Populus tremula but lower for others. Its spatial and spectral resolutions limited its sensitivity to complex forest structures and high-volume areas, resulting in notable inversion errors. The fused data improved volume estimation, with a 17% increase in accuracy over CHM data and an 8% improvement over spectral texture data. Additionally, estimation residuals remained stable without large fluctuations as volume increased. By combining the strengths of two data sources, the fused data achieved better inversion accuracy and reduced the underestimation of high-volume values (Figure 7).
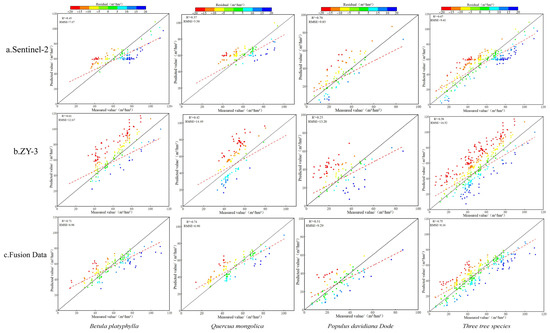
Figure 7.
Scatter plot of estimated and actual values of volume. (a) Sentinel-2 fitting results. (b) ZY-3 fitting results. (c) Fusion data fitting results.
Model accuracy metrics across different data sources and tree species are summarized in Table 6. For each dataset—Sentinel-2, ZY-3, and Fusion—the R2 and RMSE values were reported for Betula platyphylla, Quercus mongolica, and Populus davidiana Dode individually, as well as for all species combined. The reported values provide a comparative assessment of predictive accuracy across data types and species groups using the GBRT algorithm.
Table 6.
Accuracy assessment of forest volume estimation for different tree species across data sources.
4. Discussion
Feature factor selection is crucial for forest volume estimation. Previous studies have mostly relied on satellite spectral data and texture features for model construction [48]. However, the saturation of spectral data severely limits the accuracy of remote sensing-based volume estimation. To explore the potential of multi-source data collaboration in improving estimation performance, this study extracted high-precision Canopy Height Model (CHM) data (RMSE = 4.10) by analyzing the differences between open-source digital elevation models (DEM) and ZY-3 digital surface models (DSM), thus expanding the feature selection range and enriching data dimensions while mitigating the risk of overfitting. Previous research has shown that CHM plays a structurally complementary role in overcoming spectral saturation, particularly when combined with red-edge indices, and holds great potential for improving forest volume estimation accuracy. For instance, Zhang et al. used Landsat 8 OLI and ZY-3 data to estimate Eucalyptus forest volume and confirmed that CHM helps alleviate optical data saturation [49,50]. Similarly, researchers successfully extracted high-precision information from ZY-3 data by differentiating between growing and dormant seasons of Larix forest plantations [51]. These results align with the findings of this study, confirming the strong correlation between CHM and forest volume. Moreover, the scatter plots of the model demonstrated that combining CHM with spectral and texture data largely improved volume estimation accuracy (R2 = 0.75). In this study, the CHM extracted from ZY-3 stereo pairs demonstrated a strong positive correlation with observed AGB, particularly when combined with red-edge and texture indices. However, a closer inspection of residuals revealed that the model tended to underestimate volume in high-density plots. This behavior indicates a potential limitation of the CHM in capturing canopy complexity in multi-strata forests. Given that the RMSE of CHM was approximately 4.10 m, errors may propagate in areas where tree height gradients are subtle, but volume accumulation is substantial—especially in mature stands. Comparable saturation effects have been reported in high-volume forests where structural height no longer scales with volume, typically observed at volumes >180 m3/ha [52]. This aligns with the upper quartile of our study’s volume distribution (110–150 m3/hm2), where wood density variations decouple height and volume relationships in mature stands. Our findings support this interpretation, as the model’s underestimation was more pronounced in the upper quartile of plot AGB. These observations emphasize the need for structural inputs beyond single-layer canopy height in regions with old-growth characteristics. While similar patterns were reported by researchers in subtropical forests, our results highlight that even mid-resolution CHMs such as those derived from ZY-3 can reach saturation thresholds that must be accounted for in operational volume mapping [14,53].
In this study, prior to RFE, multicollinearity was assessed using the variance inflation factor (VIF). This preprocessing step ensured model stability by mitigating collinear effects. RFE was then applied to the refined feature set to select optimal predictors, with spectral indices dominating importance. While CHM features showed modest single-feature importance, their combined contribution and ablation test results confirm their indispensable role in mitigating spectral saturation in high-biomass stands. This aligns with the theory that spectral indices capture physiological signals, while CHM provides structural context—a synergy that multi-source fusion uniquely enables. While CHM-related features demonstrated only moderate ranking in the RFE-derived individual importance scores, their combined effect—especially when fused with red-edge vegetation indices—contributed significantly to the model’s predictive performance. This observation is supported by the ablation results, where the exclusion of CHM features led to a notable reduction in R2 and increase in RMSE. Hence, although CHM may not emerge as the top-ranked single variable, it offers crucial complementary structural information that enhances volume prediction in complex canopy conditions. This nuanced role underscores the importance of interpreting feature contributions in a multidimensional context rather than relying solely on isolated rankings.
This finding aligns with [54], who demonstrated that optimized feature selection techniques, including VIF-Lasso and Boruta, significantly boosted AGB prediction accuracy from multi-source data (R2 = 0.75, RMSE = 16.5 m3/hm2), reinforcing the critical role of variable screening in model robustness. The analysis of feature factor interpretability showed that the red-edge chlorophyll index (IRECI) and the enhanced vegetation index in the red-edge region (EVIRE3) from Sentinel-2 imagery had high explanatory power for volume, indicating that red-edge band vegetation indices could influence estimation accuracy. This is consistent with the characteristic sensitivity of optical imagery’s red-edge bands to vegetation [55]. Additionally, high-resolution optical imagery texture features also contributed positively to forest volume estimation, partially mitigating spectral data saturation [56]. However, in this study, texture features had a relatively low correlation with volume and did not effectively improve model interpretability. This may be due to a mismatch between the sample size and pixel resolution, leading to the influence of mixed pixels on volume estimation accuracy. Moreover, the complex terrain in mountainous areas makes it difficult to capture forest structural information, and there are spectral and textural differences between tree species that affect remote sensing performance. Future research should focus on extracting high-resolution texture information and improving scale matching techniques to enhance forest volume estimation [17,57,58,59,60]. Although several texture metrics were included in the modeling process, their overall contribution to volume prediction remained limited in this study. This finding, supported by the recursive feature elimination analysis, points to low correlation and interpretability of texture features across the full range of volume plots. A probable explanation lies in the resolution mismatch between texture derivation and ground reference scale: Sentinel-2 imagery, from which most texture features were extracted, has a spatial resolution of 10–20 m, whereas field plots were substantially smaller. This mismatch likely led to pixel mixing effects, especially in edge-dominated plots or areas with high species diversity. Moreover, complex topography and sun–canopy geometry in the Saihanwula Reserve may have introduced directional artifacts into texture layers, further reducing their reliability. As texture features are known to be sensitive to directional lighting and shadowing, their effective use in heterogeneous forest landscapes may require image preprocessing steps such as topographic normalization or directional filtering, which were beyond the scope of this study. Future research should explore these enhancements to unlock the full potential of texture-based structure proxies.
From a modeling perspective, the results of this study showed that models constructed using the gradient boosting regression tree (GBRT) algorithm outperformed models built using multiple linear regression (MLR), k-nearest neighbors (KNN), and random forests (RF) in terms of estimation accuracy. The testing set accuracy (R2 = 0.86) aligns with similar multi-source fusion studies (R2 = 0.82–0.89), but this similarity reflects shared methods (optical-LiDAR fusion, ensemble models) and limitations (spectral saturation, CHM errors in rugged terrain). However, when using the GBRT algorithm for volume estimation based on CHM data, there is an underestimation of volume for high-volume areas. This phenomenon may be attributed to two reasons: First, high-volume forests often have multi-layer canopy structures, and ZY-3′s CHM data may struggle to accurately distinguish different canopy layers, particularly in densely distributed trees. The registration errors in such areas may lead to a higher degree of underestimation [61]. Second, the model may not sufficiently account for tree species diversity during volume estimation, and dense vegetation can complicate signal reflection, masking the true forest structure and reducing estimation accuracy [62]. Comparable results have been reported by [63], who reviewed remote sensing-based AGB models and emphasized that ensemble methods consistently outperformed parametric models, particularly when combined with well-curated remote sensing variables. This study did not explicitly stratify models by forest type; the variation in residual patterns across plots suggests that structural heterogeneity and species composition influence estimation performance. In particular, plots dominated by broadleaf species with irregular canopy layering showed more dispersed residuals, even in moderate volume ranges (e.g., 50–100 Mg/ha), compared to relatively uniform coniferous stands. These results, while not conclusive, imply that allometric diversity and inter-species variation in spectral response might limit the ability of a single model to generalize across complex landscapes. Previous studies in boreal and temperate forests [64,65] have identified similar trends, where species-specific models yielded lower error rates. In future work, our model could be further improved by including species indicator variables or developing forest-type-specific versions of GBRT, particularly for regions like Saihanwula, where ecological composition is diverse [60].
Overall, the GBRT model demonstrates good robustness and stability, significantly improving the accuracy of large-scale forest volume estimations. Future research should further explore parameter adjustments and feature engineering in the GBRT model to optimize its performance and better meet practical application needs [66]. The results also demonstrated that the fusion of CHM and spectral–textural features significantly enhanced model performance relative to single-source datasets. Compared to CHM-only (ZY-3) and spectral-only (Sentinel-2) configurations, the fusion dataset yielded the highest R2 (0.75) and lowest RMSE (8.16 m3/hm2), with a reduction in estimation error of up to 13.36%. This improvement reflects the complementary value of structural and spectral information: while canopy height metrics capture forest vertical complexity, spectral indices—especially those from the red-edge region—offer physiological and biochemical insights. Their integration allows the model to better resolve volume variability across different forest stand types and structural gradients, particularly in heterogeneous environments like the Saihanwula Reserve. Similar improvements in model accuracy through the integration of CHM and spectral features were also reported by [67,68], who found that combining ZY-3 stereo data with Sentinel-2 and DEM inputs significantly enhanced AGB estimation in coniferous forests of northern China (R2 = 0.77, RMSE = 13.2 Mg/ha), supporting the effectiveness of data fusion observed in our study. Beyond accuracy metrics, the spatial distribution of predicted forest stock volume further supports the superiority of the fusion model. While Sentinel-2 estimates were mainly clustered in the 50–90 m3/hm2 range and ZY-3 predictions were more variable but skewed, the fusion-based outputs showed a more uniform and realistic spread across the 50–110 m3/hm2 range. This pattern better aligns with expected ground conditions and field plot distributions, especially in the high-volume southeastern zone of the reserve. Such improvements in spatial consistency are essential for practical applications like stand-level forest management, sustainable yield planning, and spatially explicit carbon accounting. An often-overlooked source of error in volume modeling arises from scale mismatches and geolocation discrepancies among multi-source datasets. In this study, CHM was constructed from ZY-3 stereo imagery, spectral features were derived from Sentinel-2, and LiDAR plots provided field-based references. Despite careful co-registration, inherent differences in spatial resolution and temporal acquisition can introduce localized inconsistencies, particularly along terrain transitions or forest–nonforest boundaries [5,50,69,70]. For example, Sentinel-2′s coarser resolution may obscure fine-scale heterogeneity captured by ZY-3, leading to spectral homogenization in mixed-pixel zones. In turn, this can propagate through the model, introducing residual errors unrelated to the predictive features themselves. Additionally, the time lag between data acquisitions may exacerbate differences in vegetation phenology, which affects both spectral indices and CHM measurements. While these effects are partially mitigated through plot buffering and normalization techniques, their influence remains non-negligible, especially in rugged, seasonally dynamic environments like Saihanwula. While demonstrating multi-source fusion’s efficacy for mountain forest volume estimation, operational deployment requires external validation across ecoregions, uncertainty quantification with confidence intervals for forest volume reporting, and multi-decadal temporal analysis using satellite archives to resolve disturbance impacts [71,72,73]. These advances bridge scientific innovation with policy-ready forest management. Incorporating co-temporal, high-resolution datasets or applying cross-sensor fusion techniques may help reduce these cross-scale distortions in future studies [74,75,76]. Beyond model selection, this study underscores the importance of targeted feature engineering. The superior performance of GBRT in this context was driven not only by its ensemble structure, but by the integration of well-curated variables—particularly CHM, IRECI, EVIRE3, and selected texture bands. Nonetheless, residual dispersion in high-volume plots suggests that further tuning of model depth, learning rate, or integration of temporal features may enhance robustness. More broadly, these findings suggest that even with minimal ground data, multi-source remote sensing—if properly harmonized—can deliver volume estimates comparable to those reported in UAV-LiDAR-supported studies [77,78,79,80]. This scalability offers tangible value for regional forest inventory systems and supports emerging needs in carbon monitoring and REDD+ implementation, especially in montane and semi-humid forest zones. These challenges, while technical, have important implications for the transferability and operational use of the model in regional forest monitoring systems [81,82,83].
5. Conclusions
This study on forest volume estimation via multi-source data fusion enhances forest resource understanding and offers practical value for management and policy; integrating CHM with optical data overcomes optical imagery saturation, improving estimation accuracy—crucial for complex terrain and diverse species. However, model accuracy is subject to data scale mismatches and single-temporal data limitations. Future work should include rigorous external validation using independent datasets. The approach supports sustainable logging quotas and conservation strategies. While showcasing multi-source fusion potential, it acknowledges limitations, urging future research to prioritize scale matching, temporal dynamics, and mechanistic modeling for improved biomass estimation.
We extracted 45 features from the multi-source fusion data, which were refined using recursive feature elimination (RFE) to a set of 14 key features for volume estimation. Among these, CHM data emerged as a critical variable, reflecting the forest canopy’s vertical structure and confirming its importance in accurately estimating volume. The multi-source fusion outperformed both Sentinel-2 and ZY-3 datasets, achieving R2 values ranging from 0.51 to 0.75 and reducing RMSE values to between 6.90 and 9.29 m3/hm2. These improvements highlight the synergistic value of integrating canopy height information with spectral data in a machine learning framework, where structural features address limitations of spectral saturation, particularly in areas with challenging terrains. The enhanced accuracy of stand volume estimation provides critical inputs for operational forestry planning, enabling data-driven decisions on thinning intensity and harvest scheduling. This study provides more reliable carbon stock assessments, offering valuable data for carbon trading, forest conservation policies, and greenhouse gas inventory reporting. Moreover, these findings provide not only technical validation but also practical relevance for national forest inventories and international climate commitments. Accurate and scalable volume maps can provide a regional template for the monitoring of REDD+ in temperate forest–steppe regions. It is applicable to the global MRV framework and needs to be further verified in other forest biomes as part of the future research agenda. Thus, the approach demonstrated here contributes toward aligning remote sensing-based volume assessment with global forest carbon accounting standards. Thus, the research supports the forestry sector’s role in climate change mitigation efforts. The gradient boosting regression tree (GBRT) algorithm outperformed other machine learning models, such as k-nearest neighbors (KNN), multiple linear regression (MLR), and random forest (RF), by effectively handling nonlinear relationships and integrating multi-source data. This underscores the potential of machine learning techniques in forest parameter prediction and encourages their broader use in forest monitoring and management systems.
In summary, this study bridges the gap between scientific research and practical forest management by providing methodologies that can be integrated into policy frameworks to promote sustainable forest management and environmental sustainability. Future research should focus on incorporating additional remote sensing technologies, such as LiDAR and SAR, to further refine volume estimation models. Furthermore, applying deep learning techniques like convolutional neural networks (CNNs) could significantly enhance the accuracy of volume predictions, addressing challenges such as underestimating volume in high-density forests and improving overall model performance.
Future improvements should also consider structural refinements of the CHM itself—e.g., by generating seasonal CHMs or using UAV-based height calibration to minimize underestimation in high-volume zones. Incorporating phenological variation into input features could further address temporal mismatches and improve sensitivity in regions with deciduous or mixed-species canopies.
Ultimately, the methodological framework provides a proof of concept for operational monitoring platforms in temperate forest–steppe zones, with cross-regional validation required to confirm broader applicability, high-resolution remote sensing, and scalable model architectures. The volume estimation methodology provides data support for forest resource monitoring under dynamic conditions, with integration into eco-economic modeling identified as a critical step toward adaptive management.
Author Contributions
Conceptualization, P.J.; methodology, W.P. and R.S.; software, P.J. and W.P.; formal analysis, validation, W.P.; investigation, W.P.; resources, P.J., W.P., and R.S.; writing-original draft preparation, P.J.; writing-review and editing, R.G.; visualization, L.P.; supervision, P.Z., R.G., and H.Y.; project administration, P.Z.; funding acquisition, P.J., P.Z., and L.P.; All authors have read and agreed to the published version of the manuscript.
Funding
This work is supported by the National Natural Science Foundation of China (NSFC) (Project No. 32360249); Key Research and Development and Results Transformation Plan (Project number: 2023YFDZ0017); Inner Mongolia Agricultural University Young Teachers Research Ability Promotion Project (Project number: BR230161); Key Research and Development and Results Transformation Plan (Project number: 2022YFDZ0030-01); Inner Mongolia Autonomous Region Science and Technology Key Project (Project number: 2021GG0009); The University Scientific Research Project of Inner Mongolia Autonomous Region (Project number: NJZY22484).
Data Availability Statement
The datasets used and/or analyzed during the current study are available from the corresponding author on reasonable request.
Conflicts of Interest
The authors declare no conflicts of interest.
References
- Wang, Q.; Pang, Y.; Chen, D.; Liang, X.; Lu, J. Lidar biomass index: Anovel solution for tree-level biomass estimation using 3D crowninformation. For. Ecol. Manag. 2021, 499, 119542. [Google Scholar] [CrossRef]
- Tamiminia, H.; Salehi, B.; Mahdianpari, M.; Beier, C.M.; Johnson, L. Evaluaing pixel-based and objeet-based approaches for forest above-groundbiomas estimation using a combination of optical, sar, and an extreme gradient bosting model. ISPRS Ann. Photogramm. Remote Sens. Spat. Inf. Sci. 2022, 3, 485–492. [Google Scholar]
- Meng, X.Y. Dendrology; China Forestry Publishing House: Beijing, China, 2002. [Google Scholar]
- López-Serrano, P.M.; Cárdenas Domínguez, J.L.; Corral-Rivas, J.J.; Jiménez, E.; López-Sánchez, C.A.; Vega-Nieva, D.J. Modeling of Aboveground Biomass with Landsat 8 OLI and Machine Learning in Temperate Forests. Forests 2020, 11, 11. [Google Scholar] [CrossRef]
- Schumacher, J.; Rattay, M.; Kirchhöfer, M.; Adler, P.; Kändler, G. Combination of multi-temporal sentinel-2 images and aerial image based canopy height models for timber volume modelling. Forests 2019, 10, 746. [Google Scholar] [CrossRef]
- Yu, K.; Smith, W.K.; Trugman, A.T.; Condit, R.; Hubbell, S.P.; Sardans, J.; Peng, C.; Zhu, K.; Peñuelas, J.; Cailleret, M. Pervasive Decreases in Living Vegetation Carbon Turnover Time across Forest Climate Zones. Proc. Natl. Acad. Sci. USA 2019, 116, 24662–24667. [Google Scholar] [CrossRef]
- Romanello, M.; Walawender, M.; Hsu, S.C.; Moskeland, A.; Palmeiro-Silva, Y.; Scamman, D.; Ali, Z.; Ameli, N.; Angelova, D.; Ayeb-Karlsson, S.; et al. The 2024 report of the Lancet Countdown on health and climate change: Facing record-breaking threats from delayed action. Lancet 2024, 404, 1847–1896. [Google Scholar] [CrossRef]
- Ye, Z.; Long, J.; Zhang, T.; Lin, B.; Lin, H. L-Band Synthetic Aperture Radar and Its Application for Forest Parameter Estimation, 1972 to 2024: A Review. Plants 2024, 13, 2511. [Google Scholar] [CrossRef]
- Moradi, F.; Darvishsefat, A.A.; Pourrahmati, M.R.; Deljouei, A.; Borz, S.A. Estimating Aboveground biomass in Dense Hyrcanian Forests by the Use of Sentinel-2 Data. Forests 2022, 13, 104. [Google Scholar] [CrossRef]
- Claverie, M.; Ju, J.; Masek, J.G.; Dungan, J.L.; Vermote, E.F.; Roger, J.-C.; Skakun, S.V.; Justice, C. The Harmonized Landsat and Sentinel-2 surface reflectance data set. Remote Sens. Environ. 2018, 219, 145–161. [Google Scholar] [CrossRef]
- Tanase, M.A.; Mihai, M.C.; Miguel, S.; Cantero, A.; Tijerín, J.; Ruiz-Benito, P.; Domingo, D.; García-Martín, A.; Aponte, C.; Lamelas, M.T. Long-Term Annual Estimation of Forest above Ground volume, Canopy Cover, and Height from Airborne and Spaceborne Sensors Synergies in the Iberian Peninsula. Environ. Res. 2024, 259, 119432. [Google Scholar] [CrossRef] [PubMed]
- Zolkos, S.G.; Goetz, S.J.; Dubayah, R. A meta-amalysis of terrestrial abovegrund volume esimation using lidar remote sensing. Remote Sens. Environ. 2013, 128, 289–298. [Google Scholar] [CrossRef]
- Main-Knorn, M.; Cohen, W.B.; Kennedy, R.E.; Grodzki, W.; Pflugmacher, D.; Griffiths, P.; Hostert, P. Monitoring coniferous foret volume change using a Landsat trajectory-based apprach. Remote Sens. Environ. 2013, 139, 277–290. [Google Scholar] [CrossRef]
- Liu, Q.; Zhong, B.; Wu, J. Environmental Remote Sensing Quantitative Inversion and Assimilation; Science Press: Beijing, China, 2011. [Google Scholar]
- Abegg, M.; Kükenbrink, D.; Zell, J.; Schaepman, M.E.; Morsdorf, F. Terrestrial Laser Scanning for Forest Inventories—Tree Diameter Distribution and Scanner Location Impact on Occlusion. Forests 2017, 8, 184. [Google Scholar] [CrossRef]
- Yin, G.; Zhang, Y.; Sun, Y.; Wang, T.; Zeng, Z.; Piao, S. MODIS Based Estimation of Forest Aboveground volume in China. PLoS ONE 2015, 10, e0130143. [Google Scholar] [CrossRef]
- Liu, P.; Ren, C.; Yang, X.; Wang, Z.; Jia, M.; Zhao, C.; Yu, W.; Ren, H. Combining Sentinel-2 and Diverse Environmental Data Largely Improved Aboveground volume Estimation in China’s Boreal Forests. Sci. Rep. 2024, 14, 27528. [Google Scholar]
- Pham, M.H.; Do, T.H.; Pham, V.M.; Bui, Q.T. Mangrove forest classification and aboveground volume estimation using an atom search algorithm and adaptive neuro-fuzzy inference system. PLoS ONE 2020, 15, e0233110. [Google Scholar] [CrossRef] [PubMed]
- Lin, W.; Lu, Y.; Jiang, X.; Li, G.; Li, D.; Lu, D. Bayesian hierarchical estimation of North subtropical forest stock based on multi-source remote sensing data. J. Remote Sens. 2023, 26, 468–479. [Google Scholar]
- Du, C.; Fan, W.; Ma, Y.; Jin, H.I.; Zhen, Z. The Effect of Synergistic Approaches of Features and Ensemble Learning Algorith on Aboveground volume Estimation of Natural Secondary Forests Based on ALS and Landsat 8. Sensors 2021, 21, 5974. [Google Scholar] [CrossRef]
- Pham, T.D.; Yoshino, K.; Le, N.N.; Bui, D.T. Estimating aboveground volume of a mangrove plantation on the Norhem coast of Viemam usingmachine leaming techmiques with an inegraion of AL0S-2 PALSAR-2 and Seninel-2A data. Int. J. Remote Sens. 2018, 39, 7761–7788. [Google Scholar] [CrossRef]
- Zhang, F.; Wu, S.; Qiao, H.; Xu, Z. Estimation of eucalyptus forest stock based on Landsat 8 OLI and Resource 3 stereoscopic data. J. Cent. South For. Univ. Sci. Technol. 2024, 44, 93–101. [Google Scholar]
- Tamiminia, H.; Salehi, B.; Mahdianpari, M.; Beier, C.M.; Klimkowski, D.J.; Volk, T.A. Comparison of Machine and Deep Learning Methods to Estimate Shrub Willow volume from UAS Imagery. Can. J. Remote Sens. 2021, 47, 209–227. [Google Scholar] [CrossRef]
- Yao, Y. Spatial pattern of forest aboveground volume and its environmental influencing factors in Qinling-Daba Mountains, central China. Sci. Rep. 2024, 14, 21411. [Google Scholar]
- Guangyi, M.; Yujun, S.; Saeed, S. Models for Predicting the volume of Cunninghamialanceolata Trees and Stands in Southeastern China. PLoS ONE 2017, 12, e0169747. [Google Scholar] [CrossRef]
- Nguyen, H.C.; Jung, J.; Lee, J.; Choi, S.U.; Hong, S.Y.; Heo, J. Optimal Atmospheric Correction for Above-Ground Forest volume Estimation with the ETM+ Remote Sensor. Sensors 2015, 15, 18865–18886. [Google Scholar] [CrossRef] [PubMed]
- Xie, Z.; Chen, Y.; Lu, D.; Li, G.; Chen, E. Classification of land cover forest,and tree species classes with Ziyuan-3multispectral and stereo data. Remote Sens. 2019, 11, 164. [Google Scholar] [CrossRef]
- Sanquetta, C.R.; Wojciechowski, J.; Dalla Corte, A.P.; Corte, A.P.D.; Behling, A.; Netto, S.P.; Rodrigues, A.L.; Sanquetta, M.N.I. Comparison of data mining and allometric model in estimation of tree volume. BMC Bioinform. 2015, 16, 247. [Google Scholar] [CrossRef] [PubMed][Green Version]
- Chen, Q.; Meng, Z.; Liu, X.; Jin, Q.; Su, R. Decision Variants for the Automatic Determination of Optimal Feature Subset in RF-RFE. Genes 2018, 9, 301. [Google Scholar] [CrossRef]
- Lovell, J.; Jupp, D.; Newnham, G.; Coops, N.; Culvenor, D. Simulation study for finding optimal lidar acquisition parameters for forest height retrieval. For. Ecol. Manag. 2005, 214, 398–412. [Google Scholar] [CrossRef]
- Demol, M.; Calders, K.; Verbeeck, H.; Gielen, B. Forest above-ground volume assessments with terrestrial laser scanning: A ground-truth validation experiment in temperate, managed forests. Ann. Bot. 2021, 128, 805–819. [Google Scholar] [CrossRef]
- Van der Zande, D.; Stuckens, J.; Verstraeten, W.W.; Muys, B.; Coppin, P. Assessment of Light Environment Variability in Broadleaved Forest Canopies Using Terrestrial Laser Scanning. Remote Sens. 2010, 2, 1564–1574. [Google Scholar] [CrossRef]
- Ye, Q. Study on forest type identification and stock estimation by combining GF-6WFV and Sentinel-2. Ph.D. Thesis, Jiangxi Agricultural University, Nanchang, China, 2024. [Google Scholar]
- Miguel, S.; Ruiz-Benito, P.; Rebollo, P.; Viana-Soto, A.; Mihai, M.C.; García-Martín, A.; Tanase, M. Forest disturbance regimes and trends in continental Spain (1985–2023) using dense landsat time series. Environ. Res. 2024, 262, 119802. [Google Scholar] [CrossRef]
- Li, X.; Sale, M.; Nieforth, K.; Craig, J.; Wang, F.; Solit, D.; Feng, K.; Hu, M.; Bies, R.; Zhao, L. PyDarwin Machine Learning Algorithms Application and Comparison in Nonlinear Mixed-Effect Model Selection and Optimization. J. Pharmacokinet. Pharmacodyn. 2024, 51, 785–796. [Google Scholar] [CrossRef]
- Li, G.; Xie, Z.; Jiang, X.; Lu, D.; Chen, E. Integration of ZiYuan-3multispectral and stereo data for modeling above ground volume of larch plantations in north China. Remote Sens. 2019, 11, 2328. [Google Scholar] [CrossRef]
- Santoro, M.; Beer, C.; Cartus, O.; Schmullius, C.; Shvidenko, A.; McCallum, I.; Wegmüller, U.; Wiesmann, A. Retrieval of Growing Stock Volume in Boreal Forest Using Hyper-Temporal Series of Envisat ASAR ScanSAR Backscatter Measurements. Remote Sens. Environ. 2011, 115, 490–507. [Google Scholar] [CrossRef]
- Li, Y.; Li, M.; Li, C.; Liu, Z. Forest aboveground volume estimation using Landsat 8 and Sentinel.1A data with machine learning algorithms. Sci. Rep. 2020, 10, 9952. [Google Scholar]
- Santoro, M.; Cartus, O.; Fransson, J.E.; Wegmüller, U. Complementarity of X-,c-, and L-band SAR backscatter observations to retrieve forest stem volume in boreal forest. Remote Sens. 2019, 11, 1615. [Google Scholar] [CrossRef]
- Liu, Y.; Gong, W.; Xing, Y.; Hu, X.; Gong, J. Estimation of the forest stand mean height and aboveground volume in Northeast China using SAR Sentinel-1B, multispectral Sentinel-2A, and DEM imagery. Lsprs J. Photogramm. Remote Sens. 2019, 151, 277–289. [Google Scholar] [CrossRef]
- Li, M.; Liu, T.; Luo, Y.; Duan, L.; Ma, L.; Wang, Y.; Zhang, J.; Zhou, Y.; Yang, L.; Chen, Z. Fractional vegetation coverage downscaling inversion method based on land remote-sensing satellite (System,Landsat-8) and polarization decomposition of Radalsat-2. Int. J. Remote Sens. 2021, 42, 3255–3276. [Google Scholar] [CrossRef]
- Wang, C.; Du, H.; Xu, X.; Han, N.; Zhou, G.; Sun, S.; Gao, G. Multi-scale crown closure retrieval for moso bamboo forest usincmulti-source remotely sensed imagery based on geometric-optical and Erf-BP neural network models. Int. J. Remote Sens. 2015, 36, 5384–5402. [Google Scholar] [CrossRef]
- Trochta, J.; Král, K.; Janík, D.; Adam, D. Arrangement of terrestrial laser scanner positions for area-wide stem mapping of natural forests. Can. J. For. Res. 2013, 43, 355–363. [Google Scholar] [CrossRef]
- Tian, X.; Yan, M.; van der Tol, C.; Li, Z.; Su, Z.; Chen, E.; Li, X.; Li, L.; Wang, X.; Pan, X. Modeling forest above-ground volume dynamics using multi-source data and incorporated models:a case study over the qilian mountains. Agric. For. Meteorol. 2017, 246, 1–14. [Google Scholar] [CrossRef]
- Sun, S.; Wang, Y.; Song, Z.; Chen, C.; Zhang, Y.; Chen, X.; Chen, W.; Yuan, W.; Wu, X.; Ran, X. Modelling aboveground volume carbon stock of the bohai rim coastal wetlands by integrating remote sensing, terrain, and climate data. Remote Sens. 2021, 13, 4321. [Google Scholar] [CrossRef]
- Antonarakis, A.S. Evaluating forest biometrics obtained from ground lidar in complex riparian forests. Remote Sens. Lett. 2010, 2, 61–70. [Google Scholar] [CrossRef]
- Kükenbrink, D.; Schneider, F.D.; Leiterer, R.; Schaepman, M.E.; Morsdorf, F. Quantification of hidden canopy volume of airborne laser scanning data using a voxel traversal algorithm. Remote Sens. Environ. 2017, 194, 424–436. [Google Scholar] [CrossRef]
- Liang, X.; Hyyppä, J. Automatic Stem Mapping by Merging Several Terrestrial Laser Scans at the Feature and Decision Levels. Sensors 2013, 13, 1614–1634. [Google Scholar] [CrossRef]
- Thies, M.; Pfeifer, N.; Winterhalder, D.; Gorte, B.G.H. Three-dimensional reconstruction of stems for assessment of taper, sweep and lean based on laser scanning of standing trees. Scand. J. For. Res. 2004, 19, 571–581. [Google Scholar] [CrossRef]
- Zhang, R.; Huang, J.; Liu, Y.; Wang, X.; Li, Y.; Zeng, Y.; Liu, P.; Wang, X.; Zhang, Z.; Zhang, J.; et al. Unveiling Scale-Dependent Elevational Patterns and Drivers of Tree β Diversity on a Subtropical Mountain Using Sentinel-2 Remote Sensing Data. Forest 2025, 16, 917. [Google Scholar] [CrossRef]
- Ruiz, L.A.; Hermosilla, T.; Mauro, F.; Godino, M. Analysis of the Influence of Plot Size and LiDAR Density on Forest Structure Attribute Estimates. Forests 2014, 5, 936–951. [Google Scholar] [CrossRef]
- Woodgate, W.; Armston, J.D.; Disney, M.; Jones, S.D.; Suarez, L.; Hill, M.J.; Wilkes, P.; Soto-Berelov, M. Quantifying the impact of woody material on leaf area index estimation from hemispherical photography using 3D canopy simulations. Agric. For. Meteorol. 2016, 226–227, 1–12. [Google Scholar] [CrossRef]
- Newnham, G.J.; Armston, J.D.; Calders, K.; Disney, M.I.; Lovell, J.L.; Schaaf, C.B.; Strahler, A.H.; Danson, F.M. Erratum to: Terrestrial Laser Scanning for Plot-Scale Forest Measurement. Curr. For. Rep. 2016, 2, 214. [Google Scholar] [CrossRef]
- Moeinaddini, M.; Zhang, S.Y.; Auty, D. Nonlinear modeling of tree stem profiles using deep learning algorithms: A comparison with classical taper equations. Eur. J. For. Res. 2023, 142, 311–327. [Google Scholar]
- Dassot, M.; Constant, T.; Fournier, M. The use of terrestrial LiDAR technology in forest science: Application fields, benefits and challenges. Ann. For. Sci. 2011, 68, 959–974. [Google Scholar] [CrossRef]
- Jucker, T.; Caspersen, J.; Chave, J.; Antin, C.; Barbier, N.; Bongers, F.; Dalponte, M.; van Ewijk, K.Y.; Forrester, D.I.; Haeni, M. Allometric Equations for Integrating Remote Sensing Imagery into Forest Monitoring Programmes. Glob. Change Biol. 2017, 23, 177–190. [Google Scholar] [CrossRef]
- Raumonen, P.; Kaasalainen, M.; Åkerblom, M.; Kaasalainen, S.; Kaartinen, H.; Vastaranta, M.; Holopainen, M.; Disney, M.; Lewis, P. Fast Automatic Precision Tree Models from Terrestrial Laser Scanner Data. Remote Sens. 2013, 5, 491–520. [Google Scholar] [CrossRef]
- Li, W.; Guo, Q.; Jakubowski, M.K.; Kelly, M. A New Method for Segmenting Individual Trees from the Lidar Point Cloud. Photogramm. Eng. Remote Sens. 2012, 78, 75–84. [Google Scholar] [CrossRef]
- Liu, C.; Huang, H.; Zhang, Z.; Fan, W.; Wu, D. Canopy Height Integration for Precise Forest Aboveground volume Estimation in Natural Secondary Forests of Northeast China Using Gaofen-7 Stereo Satellite Data. Remote Sens. 2024, 17, 47. [Google Scholar] [CrossRef]
- Pfeifer, N.; Stadler, P.; Briese, C. Derivation of Digital Terrain Models in the SCOP++ Environment. In Proceedings of the OEEPE Workshop on Airborne Laser scanning and Interferometric SAR for Detailed Digital Terrain Models, Stockholm, Sweden, 1–3 March 2001; p. 3612. [Google Scholar]
- Tomppo, E.; Gschwantner, T.; Lawrence, M.; McRoberts, R.E.; Gabler, K.; Schadauer, K.; Vidal, C.; Lanz, A.; Ståhl, G.; Cienciala, E. National forest inventories. Pathw. Common Report. Eur. Sci. Found. 2010, 1, 541–553. [Google Scholar]
- Kašpar, V.; Zapletal, M.; Samec, P.; Komárek, J.; Bílek, J.; Juráň, S. Unmanned aerial systems for modelling air pollution removal by urban greenery. Urban For. Urban Green. 2022, 78, 127757. [Google Scholar] [CrossRef]
- Lu, D.; Chen, Q.; Wang, G.; Liu, L.; Li, G.; Moran, E. A Survey of Remote Sensing-Based Aboveground volume Estimation Methods in Forest Ecosystems. Int. J. Digit. Earth 2016, 9, 63–105. [Google Scholar] [CrossRef]
- Ojea, E.; Martin-Ortega, J.; Chiabai, A. Defining and classifying ecosystem services for economic valuation: The case of forest water services. Environ. Sci. Policy 2012, 19, 1–15. [Google Scholar] [CrossRef]
- Liang, X.; Hyyppä, J.; Kaartinen, H.; Lehtomäki, M.; Pyörälä, J.; Pfeifer, N.; Holopainen, M.; Brolly, G.; Francesco, P.; Hackenberg, J.; et al. International Benchmarking of Terrestrial Laser Scanning Approaches for Forest Inventories. ISPRS J. Photogramm. Remote Sens. 2018, 144, 137–179. [Google Scholar] [CrossRef]
- Papa, D.d.A.; de Almeida, D.R.A.; Silva, C.A.; Figueiredo, E.O.; Stark, S.C.; Valbuena, R.; Rodriguez, L.C.E.; Oliveira, M.V.N.D. Evaluating tropical forest classification and field sampling stratification from lidar to reduce effort and enable landscape monitoring. For. Ecol. Manag. 2020, 457, 117634. [Google Scholar] [CrossRef]
- Niu, X.; Jiang, N.; Hou, K.; Yin, Y. Estimating Forest Stock Volume Based on Airborne Lidar Data. Int. Arch. Photogramm. Remote Sens. Spat. Inf. Sci.—ISPRS Arch. 2024, 48, 535–540. [Google Scholar] [CrossRef]
- Hackenberg, J.; Morhart, C.; Sheppard, J.; Spiecker, H.; Disney, M. Highly Accurate Tree Models Derived from Terrestrial Laser Scan Data: A Method Description. Forests 2014, 5, 1069–1105. [Google Scholar] [CrossRef]
- López-Amoedo, A.; Lorenzo, H.; Acuña-Alonso, C.; Álvarez, X. Employing Aerial LiDAR Data for Forest Clustering and Timber Volume Estimation: A Case Study with Pinus radiata in Northwest Spain. Forests 2025, 16, 1140. [Google Scholar] [CrossRef]
- Ahmed, O.S.; Franklin, S.E.; Wulder, M.A. Integration of LiDAR and Landsat Data to Estimate Forest Canopy Cover in Coastal British Columbia. Photogramm. Eng. Remote Sens. 2014, 80, 953–961. [Google Scholar] [CrossRef]
- Brolly, M.; Woodhouse, I.H.; Niklas, K.J.; Hammond, S.T. Correction: A Macroecological Analysis of SERA Derived Forest Heights and Implications for Forest Volume Remote Sensing. PLoS ONE 2012, 7, e33927. [Google Scholar] [CrossRef]
- Wang, E.; Huang, T.; Liu, Z.; Bao, L.; Guo, B.; Yu, Z.; Feng, Z.; Luo, H.; Ou, G. Improving Forest Above-Ground volume Estimation Accuracy Using Multi-Source Remote Sensing and Optimized Least Absolute Shrinkage and Selection Operator Variable Selection Method. Remote Sens. 2024, 16, 4497. [Google Scholar] [CrossRef]
- Sun, G.; Ranson, K.J.; Guo, Z.; Zhang, Z.; Montesano, P.; Kimes, D. Forest biomass mapping from lidar and radar synergies. Remote Sens. Environ. 2011, 115, 2906–2916. [Google Scholar] [CrossRef]
- Pang, W.L.; Gao, R.H.; Pang, L.D.; Ji, P.H.; Yang, Y.H. Evolution and Spatial Pattern Optimization of Net Primary Productivity of Vegetation in Greater Khingan Range, Inner Mongolia Based on Bayesian Network [J/OL] Environmental Science. pp. 1–16. Available online: https://www.chndoi.org/Resolution/Handler?doi=10.13227/j.hjkx.202411253 (accessed on 15 April 2025).
- Gómez-García, E.; Alonso Ponce, R.; Pérez-Rodríguez, F.; Molina Terrén, C. A preliminary system of equations for predicting merchantable whole-tree volume for the decurrent non-native Quercus rubra L. Grown in Navarra (Northern Spain). Forests 2024, 15, 1698. [Google Scholar] [CrossRef]
- Pingel, T.J.; Clarke, K.C.; McBride, W.A. An Improved Simple Morphological Filter for the Terrain Classification of Airborne LIDAR Data. ISPRS J. Photogramm. Remote Sens. 2013, 77, 21–30. [Google Scholar] [CrossRef]
- Lee, S.H.; Ko, C.U.; Shin, J.H.; Kang, J.T. Estimation of Stem Taper for Quercus acutissima Using Machine Learning Techniques. J. Agirc Life Sci. 2020, 54, 29–37. [Google Scholar] [CrossRef]
- Kükenbrink, D.; Marty, M.; Rehush, N.; Abegg, M.; Ginzler, C. Evaluating the potential of handheld mobile laser scanning for an operational inclusion in a national forest inventory-A Swiss case study. Remote Sens. Environ. 2025, 321, 114685. [Google Scholar] [CrossRef]
- Ko, C.; Kang, J.; Lim, C.; Kim, D.; Lee, M. Application of Machine Learning Models in the Estimation of Quercus mongolica Stem Profiles. Forests 2025, 16, 1138. [Google Scholar] [CrossRef]
- Bienert, A.; Hess, C.; Maas, H.-G.; von Oheimb, G. A voxel-based technique to estimate the volume of trees from terrestrial laser scanner data. ISPRS International Archives of the Photogrammetry. Remote Sens. Spat. Inf. Sci. 2014, XL-5, 101–106. [Google Scholar]
- Felipe-Lucia, M.R.; Soliveres, S.; Penone, C.; Manning, P.; van der Plas, F.; Boch, S.; Prati, D.; Ammer, C.; Schall, P.; Gossner, M.M. Multiple forest attributes underpin the supply of multiple ecosystem services. Nat. Commun. 2018, 9, 4839. [Google Scholar] [CrossRef]
- Ma, K.; Yi, J.; Sun, H.; Chen, S.; Li, C.; Gong, M. A Partitioned Cloth Simulation Filtering Method for Extracting Tree Height of Plantation Forests Using UAV-LiDAR Data in Subtropical Regions of China. Forests 2025, 16, 1179. [Google Scholar] [CrossRef]
- Wang, Y.; Zhang, X.; Guo, Z. Estimation of Tree Height and Aboveground volume of Coniferous Forests in North China Using Stereo ZY-3, Multispectral Sentinel-2, and DEM Data. Ecol. Indic. 2021, 126, 107645. [Google Scholar] [CrossRef]
Disclaimer/Publisher’s Note: The statements, opinions and data contained in all publications are solely those of the individual author(s) and contributor(s) and not of MDPI and/or the editor(s). MDPI and/or the editor(s) disclaim responsibility for any injury to people or property resulting from any ideas, methods, instructions or products referred to in the content. |
© 2025 by the authors. Licensee MDPI, Basel, Switzerland. This article is an open access article distributed under the terms and conditions of the Creative Commons Attribution (CC BY) license (https://creativecommons.org/licenses/by/4.0/).