Article

Ecological Restoration Reshapes Ecosystem Service Interactions: A 30-Year Study from China’s Southern Red-Soil Critical Zone

1
State Key Laboratory of Regional and Urban Ecology, Research Center for Eco-Environmental Sciences, Chinese Academy of Sciences, Beijing 100085, China
2
Jiangxi Academy of Water Science and Engineering, Nanchang 330029, China
3
Jiangxi Provincial Technology Innovation Center for Ecological Water Engineering in Poyang Lake Basin, Nanchang 330029, China
4
Jiangxi Provincial Key Laboratory of Soil Erosion and Prevention, Nanchang 330029, China
5
Yantai Land Reserve and Utilization Center, Yantai 264003, China
6
School of Land Science and Technology, China University of Geosciences, Beijing 100083, China
7
Policy Research Center for Environment and Economy, Ministry of Ecology and Environment of the People’s Republic of China, Beijing 100029, China
*
Authors to whom correspondence should be addressed.
Forests 2025, 16(8), 1263; https://doi.org/10.3390/f16081263 (registering DOI)
Submission received: 21 June 2025 / Revised: 18 July 2025 / Accepted: 25 July 2025 / Published: 2 August 2025

Abstract

Situated in the southern hilly-mountain belt of China’s “Three Zones and Four Belts Strategy”, Gannan region is a critical ecological shelter belt for the Ganjiang River. Decades of intensive mineral extraction and irrational agricultural development have rendered it into an ecologically fragile area. Consequently, multiple restoration initiatives have been implemented in the region over recent decades. However, it remains unclear how relationships among ecosystem services have evolved under these interventions and how future ecosystem management should be optimized based on these changes. Thus, in this study, we simulated and assessed the spatiotemporal dynamics of five key ESs in Gannan region from 1990 to 2020. Through integrated correlation, clustering, and redundancy analyses, we quantified ES interactions, tracked the evolution of ecosystem service bundles (ESBs), and identified their socio-ecological drivers. Despite a 31% decline in water yield, ecological restoration initiatives drove substantial improvements in key regulating services: carbon storage increased by 6.9 × 10¹² gC while soil conservation rose by 4.8 × 10⁸ t. Concurrently, regional habitat quality surged by 45% in mean scores, and food production increased by 2.1 × 10⁵ t. Critically, synergistic relationships between habitat quality, soil retention, and carbon storage were progressively strengthened, whereas trade-offs between food production and habitat quality intensified. Further analysis revealed that four distinct ESBs—the Agricultural Production Bundle (APB), Urban Development Bundle (UDB), Eco-Agriculture Transition Bundle (ETB), and Ecological Protection Bundle (EPB)—were shaped by slope, forest cover ratio, population density, and GDP. Notably, 38% of the ETB transformed into the EPB, with frequent spatial interactions observed between the APB and UDB. These findings underscore that future ecological restoration and conservation efforts should implement coordinated, multi-service management mechanisms.

1. Introduction

Ecosystem services (ESs) are the conditions that ecological characteristics, functions, and processes directly or indirectly provide to human survival and development. ESs can be categorized into provisioning services, regulating services, supporting services, and cultural services [1,2]. Not only do these services provide direct resources such as food, energy, and medicinal materials, but they also play an irreplaceable role in regulating climate, flood control and water storage, soil and water conservation, air purification, and environmental beautification, thereby affecting human well-being [3]. At the same time, humans are transforming the earth’s ecosystems to meet the needs of social development [4]. According to the United Nations assessment, about 60% of global ecosystem services are in a state of degradation or have already been degraded [2,5]. Activities such as urban construction and agricultural reclamation alter the structure and function of the ecosystem, which in turn affects the ability of the ecosystem to provide services [6]. Consequently, examining the spatio-temporal variation in ecosystem services and their driving factors is important for the adaptive management and sustainable and high-quality development of regional ecosystems.
Researchers have extensively explored the spatio-temporal changes in ESs and have used the results to make future predictions [7,8,9]. Nevertheless, the formation and supply of ESs involve complex interactions among ecological processes, spatial heterogeneity, and diverse human demands, resulting in widespread nonlinear relationships between different ESs [10]. The core manifestation of these interactions lies in the synergistic and trade-off effects among ESs: multiple services may exhibit synergistic effects characterized by simultaneous enhancement, or trade-offs where the provision of one service decreases as the use of another increases [11,12]. This complexity implies that targeted management strategies designed to enhance specific ES may inadvertently diminish the benefits of other services through unintended trade-offs [13]. Nevertheless, substantial research focusing on the interaction between ecological management and total ES supply provides empirical evidence that optimized management techniques can reduce ES trade-offs and even transform them into synergies [14,15]. Consequently, gaining a deeper understanding of how ES interactions dynamically evolve in response to management interventions is crucial for identifying the most effective solutions to mitigate undesirable trade-offs, enhance synergies, and ultimately maximize the expected management value [12,16]. Simultaneously, given the pronounced spatial heterogeneity in ES distribution, achieving multi-service management often relies on identifying spatially aggregated “ES bundles” at the landscape scale [17]. This approach not only reveals inherent patterns of spatial association among multiple ESs and maintains the structural-functional integrity of landscape ecosystems but also provides critical scientific support for formulating spatially targeted and adaptive management policies [18,19]. It enables the simultaneous management of multiple ESs within complex socio-ecological systems while minimizing unintended side effects [20].
Current research exhibits significant limitations in assessing the long-term dynamic characteristics of interactions among ESs. Most analyses rely on static assessment methods at single time points, neglecting the evolutionary nature of synergistic or trade-off relationships between services over time [21,22]. This limitation is particularly pronounced when evaluating the long-term effects of large-scale ecological restoration projects. Although the global implementation of ecological restoration projects has significantly enhanced certain ES indicators, it may also profoundly alter the original patterns of service interactions [23,24]. These restoration-induced changes refer to shifts in the relationships (e.g., synergies, trade-offs) between different ecosystem services that arise as an intended or unintended outcome of the restoration activities. For example, the Grain-for-Green policy aims to increase forest coverage by altering land use. While this measure can effectively reduce soil erosion and enhance carbon sequestration, it intensifies trade-offs between provisioning services and regulating services [25]. More notably, long-term studies in areas such as the Loess Plateau reveal that following afforestation, synergistic effects among services may exhibit a weakening trend [26]. This highlights the complex and profound influence of artificial vegetation restoration on the dynamic equilibrium of services, urgently requiring scientific adaptive management. However, the severe inadequacy in the long-term monitoring of ES dynamics greatly hampers the scientific clarification of how restoration projects reshape service relationships over time, thereby constraining the development of evidence-based adaptive management strategies.
The Gannan region, located within the southern hilly-mountain belt of China’s “Three Zones and Four Belts” ecological security framework, serves as a critical ecological shelter belt in the Ganjiang River Basin. However, the Gannan region is also one of the areas in China with the most serious soil erosion. Since the 1980s, a series of soil and water conservation projects have been implemented in this region, including the National Soil and Water Conservation Priority Projects, the Agricultural Development Soil and Water Conservation Programs, and the Comprehensive Sloping Farmland Erosion Control Initiatives. In the initial phase from the start of reform and opening up until 2000, the primary strategy relied on engineering interception. This involved constructing earthen check dams and sediment-trapping dams to control sediment transport, alongside piloting the use of contour bamboo-joint ditches in small watersheds to reduce runoff scouring. Targeting the red soil collapsing erosion, a systematic management model of “upper interception, lower blockage, and internal/external greening” was developed. Concurrently, the Grain for Green Program was initiated, converting steep sloping farmland (>25°) into artificial economic forests of navel oranges and oil-tea camellia [27]. Post-2000, the management strategy shifted towards ecosystem service restoration. This phase progressively implemented measures centered on enclosure for natural recovery supplemented by planting native tree species, emphasizing enclosure, tending, replanting, restoration, and the development of water-conservation vegetation. Further leveraging the integrated framework of “Mountain-River-Forest-Farmland-Lake-Grassland” systematic management, efforts advanced the construction of small eco-clean watersheds [28,29]. The ecological output of low-efficiency sloping farmland was optimized through understory agroforestry models.
The implementation of these sequential ecological restoration projects has not only significantly mitigated soil erosion in the Gannan region but also profoundly reshaped the provision and interrelationships of other ecosystem services. Thus, the present study comprehensively evaluated the interrelationships among multiple ESs and identified socio-ecological drivers of ecosystem changes in the Ganzhou region from a historical dynamic perspective, aiming to inform sustainable ecosystem management. In particular, the main objectives of this study were to (1) identify the spatial and temporal heterogeneity of multiple ESs in the Gannan region from 1990 to 2020; (2) examine the trade-off synergy of ESs and the spatial and temporal distribution of ESBs in the survey area, and (3) determine the main driving factors of ESB spatio-temporal heterogeneity.

2. Materials and Methods
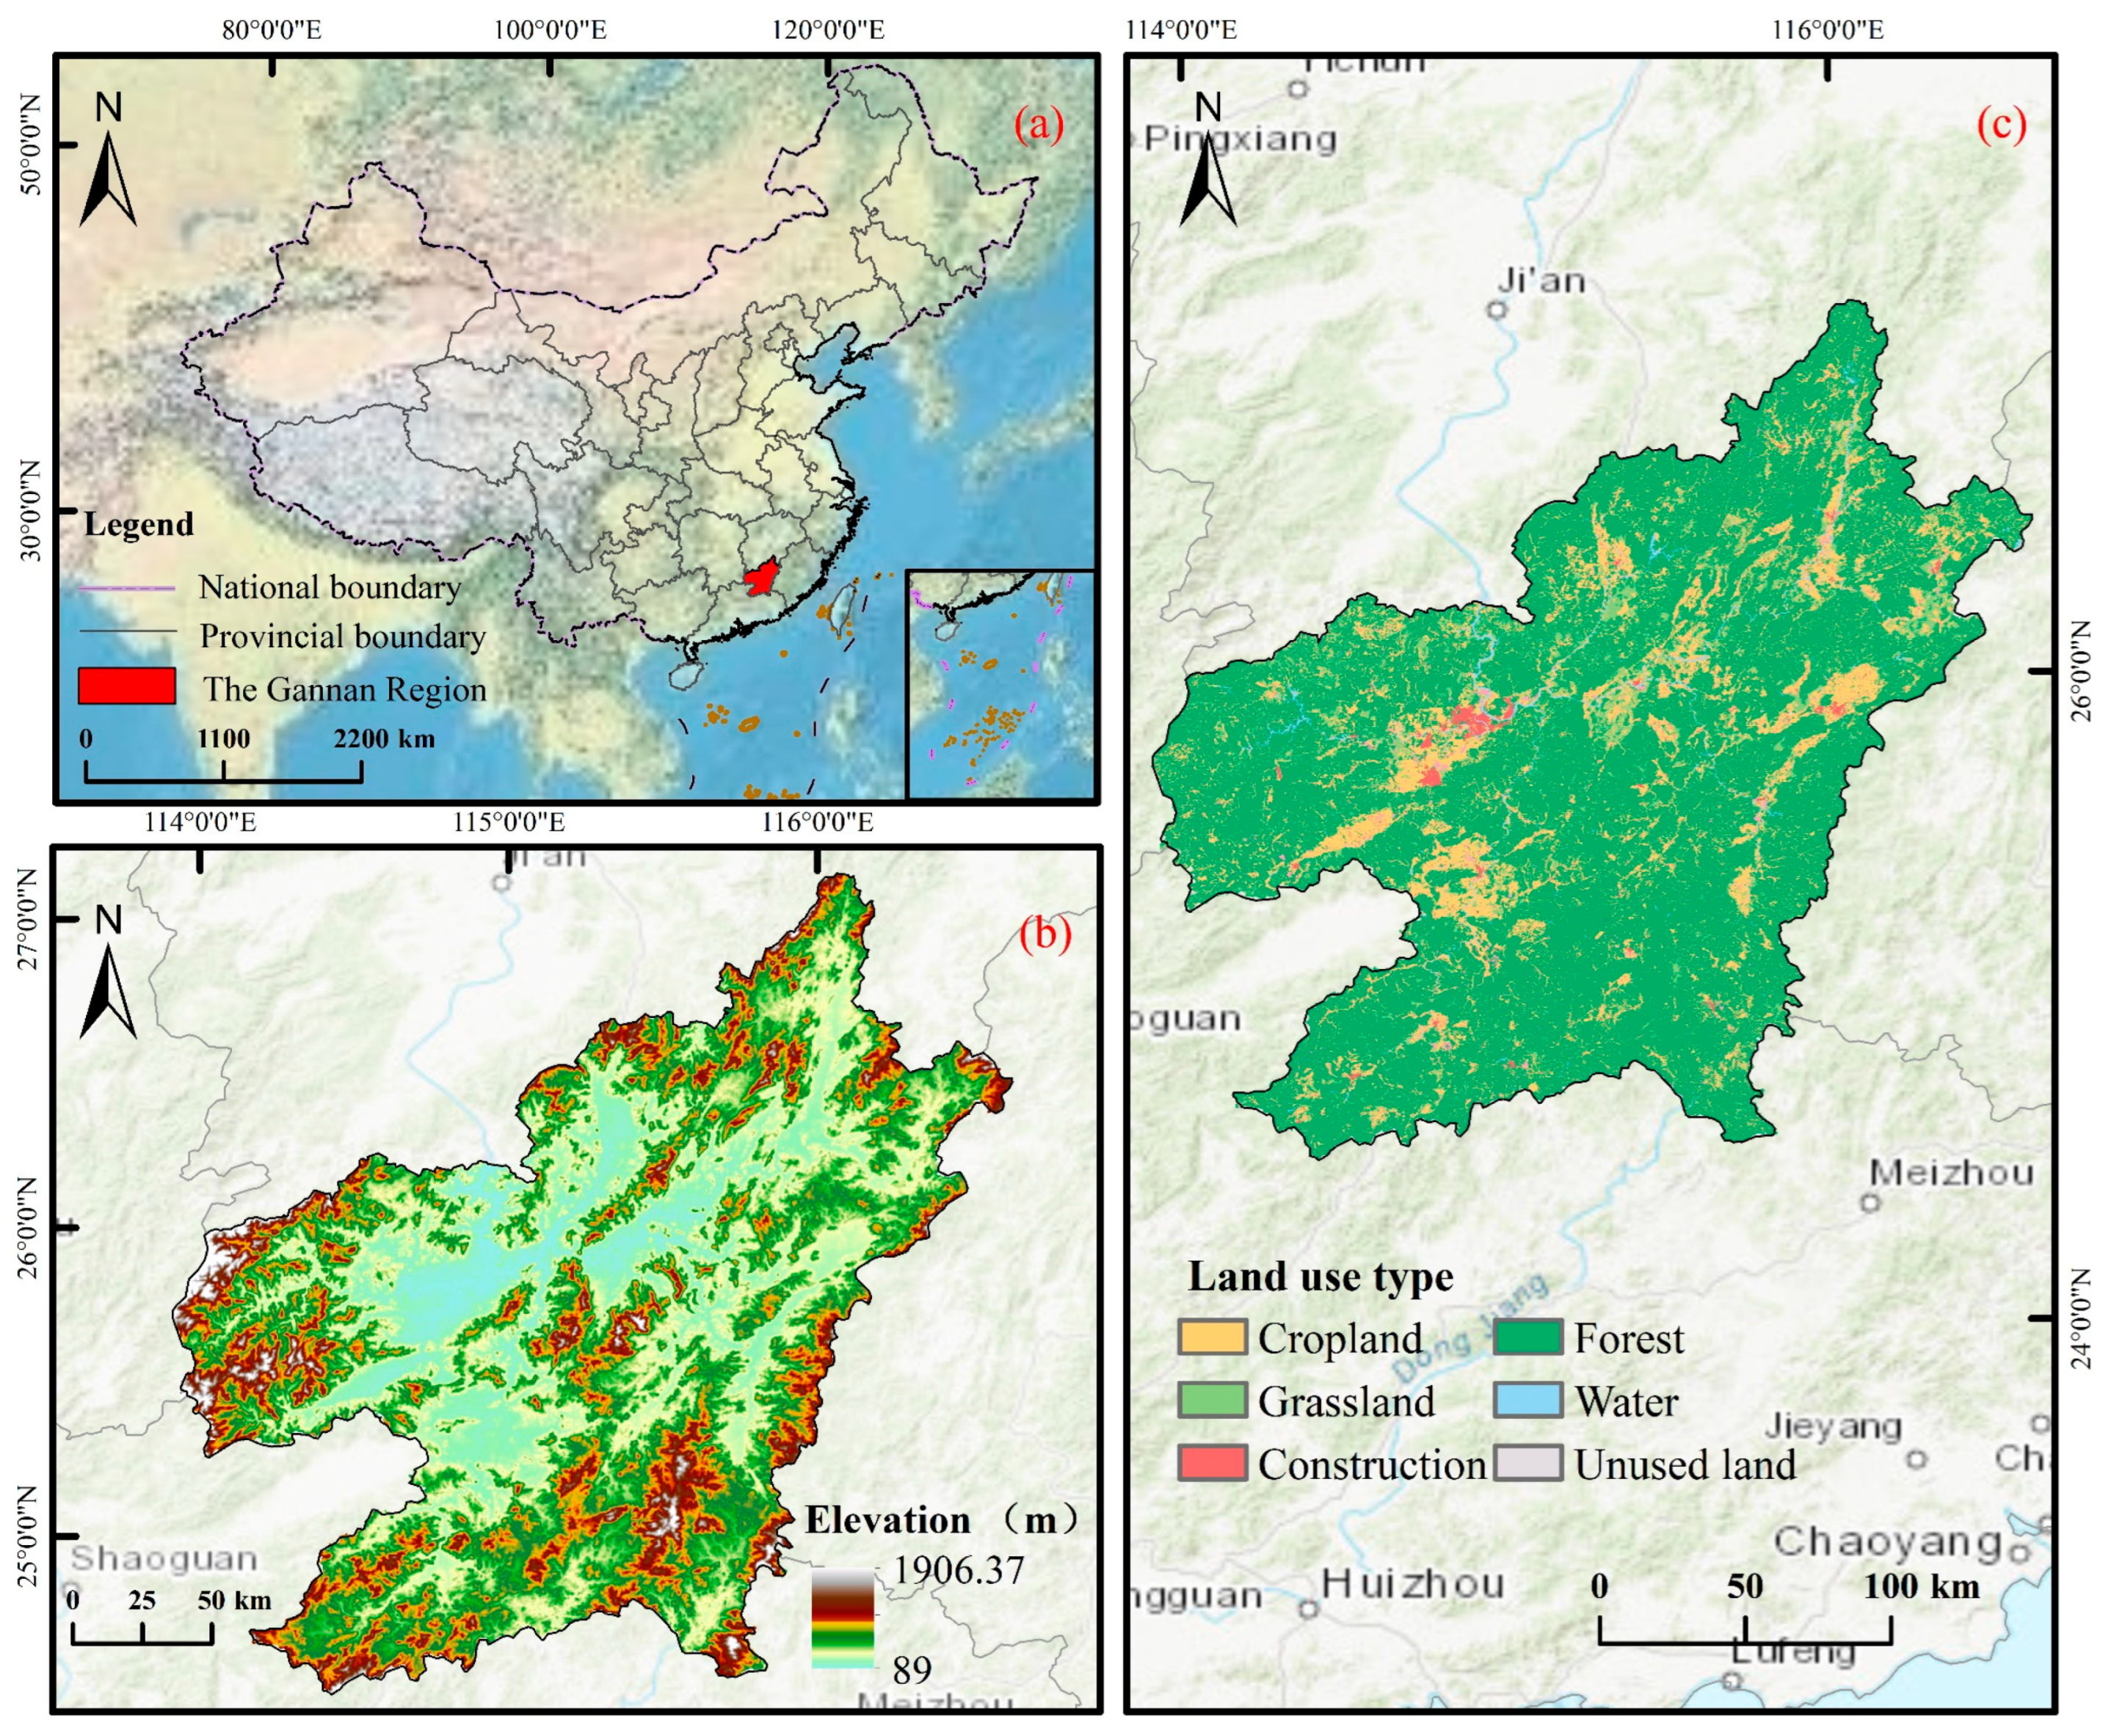
2.1. Study Area

Located in southern Jiangxi Province, China, the Gannan region spans latitude 24°29′ N to 27°09′ N and 113°54′ E to 116°38′ E longitude, encompassing a total area of 39,400 km2 (Figure 1). The topography ranges from 89 to 1906 m above sea level, with a gradual decrease in altitude from the periphery towards the central region. Red soils are predominantly distributed throughout the area, characterized by high viscosity, strong acidity, and poor erosion resistance, rendering them susceptible to slope erosion. The region has a typical subtropical monsoon climate with distinct seasonal variation featuring abundant precipitation concentrated during spring and summer, an annual average rainfall of 1,586.9 mm, extended frost-free periods, and a mean annual temperature of 19.3 °C [30].
Over the past few decades, a series of soil and water conservation projects have been implemented in the region due to significant severe soil erosion. Since 1983, when Xingguo County in Gannan was included in the “National Key Soil and Water Conservation Projects in Eight Regions”, comprehensive soil and water loss management has been implemented in Gannan, focusing on small watersheds as the basic units. Commencing in 2003, key soil and water conservation projects were extended to cover all 18 counties, cities, and districts in Gannan, essentially mitigating regional soil erosion issues [31].

2.2. Data Source

The data used in this study encompassed land use, meteorological, vegetation, and socio-economic factors. The meteorological data included precipitation, evapotranspiration, and temperature values obtained from the National Earth System Science Data Center, as well as surface radiation data from the National Tibetan Plateau Data Center. Climate data use multi-year averages (e.g., 1985–1990 averages in 1990) to minimize the impact of extreme climate events. Road data from the Resource and Environmental Science Data Center were also acquired to assess modified habitat quality. Socio-economic factors, including GDP, population density (POP), and slope, were sourced from the Resource and Environmental Science Data Center as raster datasets. Furthermore, statistical yearbooks and other administrative data were used. The source data were uniformly processed in ArcGIS 10.8 and R Studio 4.4.0 according to the specific modelling requirements. Detailed information on the datasets is provided in Table 1. The results were spatially mapped in ArcGIS 10.8, resampled to a 30 m resolution, and projected onto the WGS_1984_UTM_Zone_50N coordinate system.

2.3. Methods

2.3.1. Quantitative Assessment of Key ESs

Selection of Ecosystem Services
Based on the Millennium Ecosystem Assessment (2005) and the Common International Classification of Ecosystem Services framework version v. 5.1 [32], this study selected five key ecosystem services (ES) for evaluation: water yield (WY), carbon sequestration (CS), soil conservation (SC), modified habitat quality (MQ), and food production (FP). The selection criteria prioritized their critical importance to ecological security and socio-economic well-being in the Gannan region, aiming to represent fundamental ecological functions and address pressing stakeholder concerns. Specifically: WY (regulating service) characterizes water regulation and freshwater supply functions, essential for sustaining agriculture, livelihoods, and aquatic ecosystems; CS (regulating service) embodies climate regulation through carbon sequestration, directly aligning with national and local dual-carbon policy goals; SC (regulating service) reflects the core function of controlling soil erosion, serving as a critical basis for addressing the region’s high susceptibility to erosion driven by complex topography with steep slopes, inherently susceptible acidic red soils, and exacerbated by slope cultivation practices; MQ (supporting service) indicates biodiversity maintenance and ecosystem stability, forming the basis for studying ES synergies; and FP (provisioning service) quantifies agricultural output capacity to resolve land-use conflicts arising from scarce arable land. Collectively, these services represent core ecological processes, vital resource provisioning, and responses to regional governance priorities. Following a comprehensive consideration of regional applicability and data availability, we quantified these ESs at a 30 m spatial resolution for 1990, 2000, 2010, and 2020.
Water Yield
The InVEST model was used to assess water yield services. Based on annual precipitation data and annual potential evapotranspiration data, the Budyko hydrothermal coupling equilibrium hypothesis was used to calculate the annual water yield Y(x) for each grid unit x in the study area [33]. The formula is as follows:
Y x = 1 A E T x P x × P ( x )
A E T x P x = 1 + ω x R x 1 + ω x R x + 1 R x
where Y(x), AET(x), and P(x) represent the annual average water yield (mm), annual actual evapotranspiration (mm), and annual precipitation (mm) in grid x, respectively. Rx is the Budyko aridity index (dimensionless) for grid point x, and ωx (dimensionless) is an empirical parameter used to describe climatic and soil characteristics.
Carbon Sequestration
This study used an improved CASA model proposed by Zhu et al. [34] to calculate net primary productivity (NPP) as a substitute for carbon sequestration. The model uses remote sensing data such as solar radiation and NDVI as input data, in combination with environmental variables (such as temperature, humidity, and soil) and vegetation physiological parameters, to compute NPP as the product of absorbed photosynthetically active radiation and light use efficiency. The specific expression is:
N P P   x , t = A P A R   x , t × ε   ( x , t )
where NPP (x, t) represents the total accumulated organic matter of vegetation at location x in month t [g C/(m2·month)]. APAR (x, t) denotes the absorbed photosynthetically active radiation at pixel x in month t [MJ/(m2·month)]; ε (x, t) represents the actual light use efficiency of the vegetation at pixel x in month t.
A P A R   x , t = S O L x , t × F P A R ( x , t ) × 0.5
where SOL (x, t) represents the total solar radiation at pixel x in month t [MJ/(m2·month)]; FPAR (x, t) denotes the fraction of photosynthetically active radiation absorbed by vegetation at pixel x in month t; 0.5 represents the ratio of photosynthetically active radiation to total solar radiation.
Soil Conservation
Soil retention was estimated using the Sediment Delivery Ratio (SDR) module of the InVEST model. Based on the Revised Universal Soil Loss Equation (RUSLE), this module calculates soil retention by subtracting the actual erosion from the potential erosion at the grid cell level [35]. The calculation formula is as follows:
S D R = R K L S U L S E
R K L S = R i × K i × L S i
U L S E = R i × K i × L S i × C i × P i
where SDR represents the soil retention amount; RKLS denotes the potential soil erosion amount; ULSE represents the actual soil erosion amount, the amount of soil erosion considering the surface vegetation cover and conservation measures; Ri is the rainfall erosion factor calculated by the empirical formula provided by Zhang et al. [36]; Ki is the soil erodibility factor; LSi is the slope length and steepness factor; Ci is the vegetation cover and crop management factor, and Pi is the soil conservation practice factor.
Modified Habitat Quality
The InVEST-HQ method is suitable for static assessment, meaning that it can be used to conduct HQ assessment without considering the dynamic characteristics of ecosystems. In the context of widespread ecological restoration, using NDVI to replace habitat suitability allocation can better describe the changes in habitat quality under the influence of vegetation restoration [37]. Therefore, this study used the semi-saturation function of the InVEST-HQ model combined with degradation maps and NDVI to calculate the modified habitat quality (MQ) based on the improved method. The formula is as follows:
M Q x j = N D V I j × 1 D x j Z D x j Z + k Z
where Dxj represents the degree of habitat degradation; k is the half-saturation constant, typically set to half of the maximum value of Dxj. The scaling parameter Z = 2.5. The sensitivity factor and threat factor used to calculate the degree of habitat degradation were referenced from the existing literature.
Food Production
Based on the linear relationship between the Normalized Difference Vegetation Index (NDVI) and the yield of major grain crops, this study estimated food production (FP) at the pixel scale [38] using Equation (9):
F P i = N D V I i N D V I s u m × F P c o u n t y
where FPi represents the FP (t/ha) of grid i; NDVI and NDVIsum denote the NDVI of cultivated land grids and the total NDVI at the county level, respectively; and FPcounty represents the yield of major grain crops in each county.

2.3.2. Statistical Analysis

Identification of Interactions Among ESs
To examine pairwise relationships among ecosystem services, Spearman correlation analysis was conducted using the “corrplot” package in R to calculate and visualize correlations between ESs across all study years [10].
R x y = n = 1 n X i j X ¯ Y i j Y ¯ n = 1 n X i j X ¯ 2 n = 1 n Y i j Y ¯ 2
where Rxy represents the correlation coefficient, which ranges from −1 to 1. A positive correlation coefficient (Rxy > 0) indicates a synergistic relationship between two ESs, while a negative correlation coefficient (Rxy < 0) reflects a trade-off relationship. Xij and Yij denote the data values of different types of ESs.
Delineation of ES Bundles
This study applied the K-means algorithm to identify spatial heterogeneity in ecosystem service bundles and reveal regional patterns characterized by similar ES values [39]. The methodology included the following steps: (1) constructing a 1 km × 1 km grid to extract standardized ES indicator data; (2) performing a principal component analysis (PCA) in R to eliminate multicollinearity among indicators and retaining principal components with a cumulative variance contribution rate of 80% for dimensionality reduction; (3) determining the optimal number of bs using the elbow method by identifying the inflection point in the reduction of the within-bundle sum of squares; and (4) iteratively applying the K-means algorithm to the principal component score matrix to generate spatially heterogeneous ecosystem service bundles. This approach balances data redundancy and ecological interpretability through dimensionality reduction.
Analysis of Socioeconomic-Ecological Driving Factors
This study selected six variables as potential socio-ecological drivers—topography (slope and topographic wetness index), climate (annual precipitation and mean annual temperature), and socio-economic conditions (POP, GDP, and forest land ratio). To quantify the influence of these drivers on ESs and ESBs, redundancy analysis (RDA) was performed using the “vegan” package in R. Before the analysis, variance inflation factors (VIF) were calculated to assess multicollinearity among the candidate drivers.

3. Results

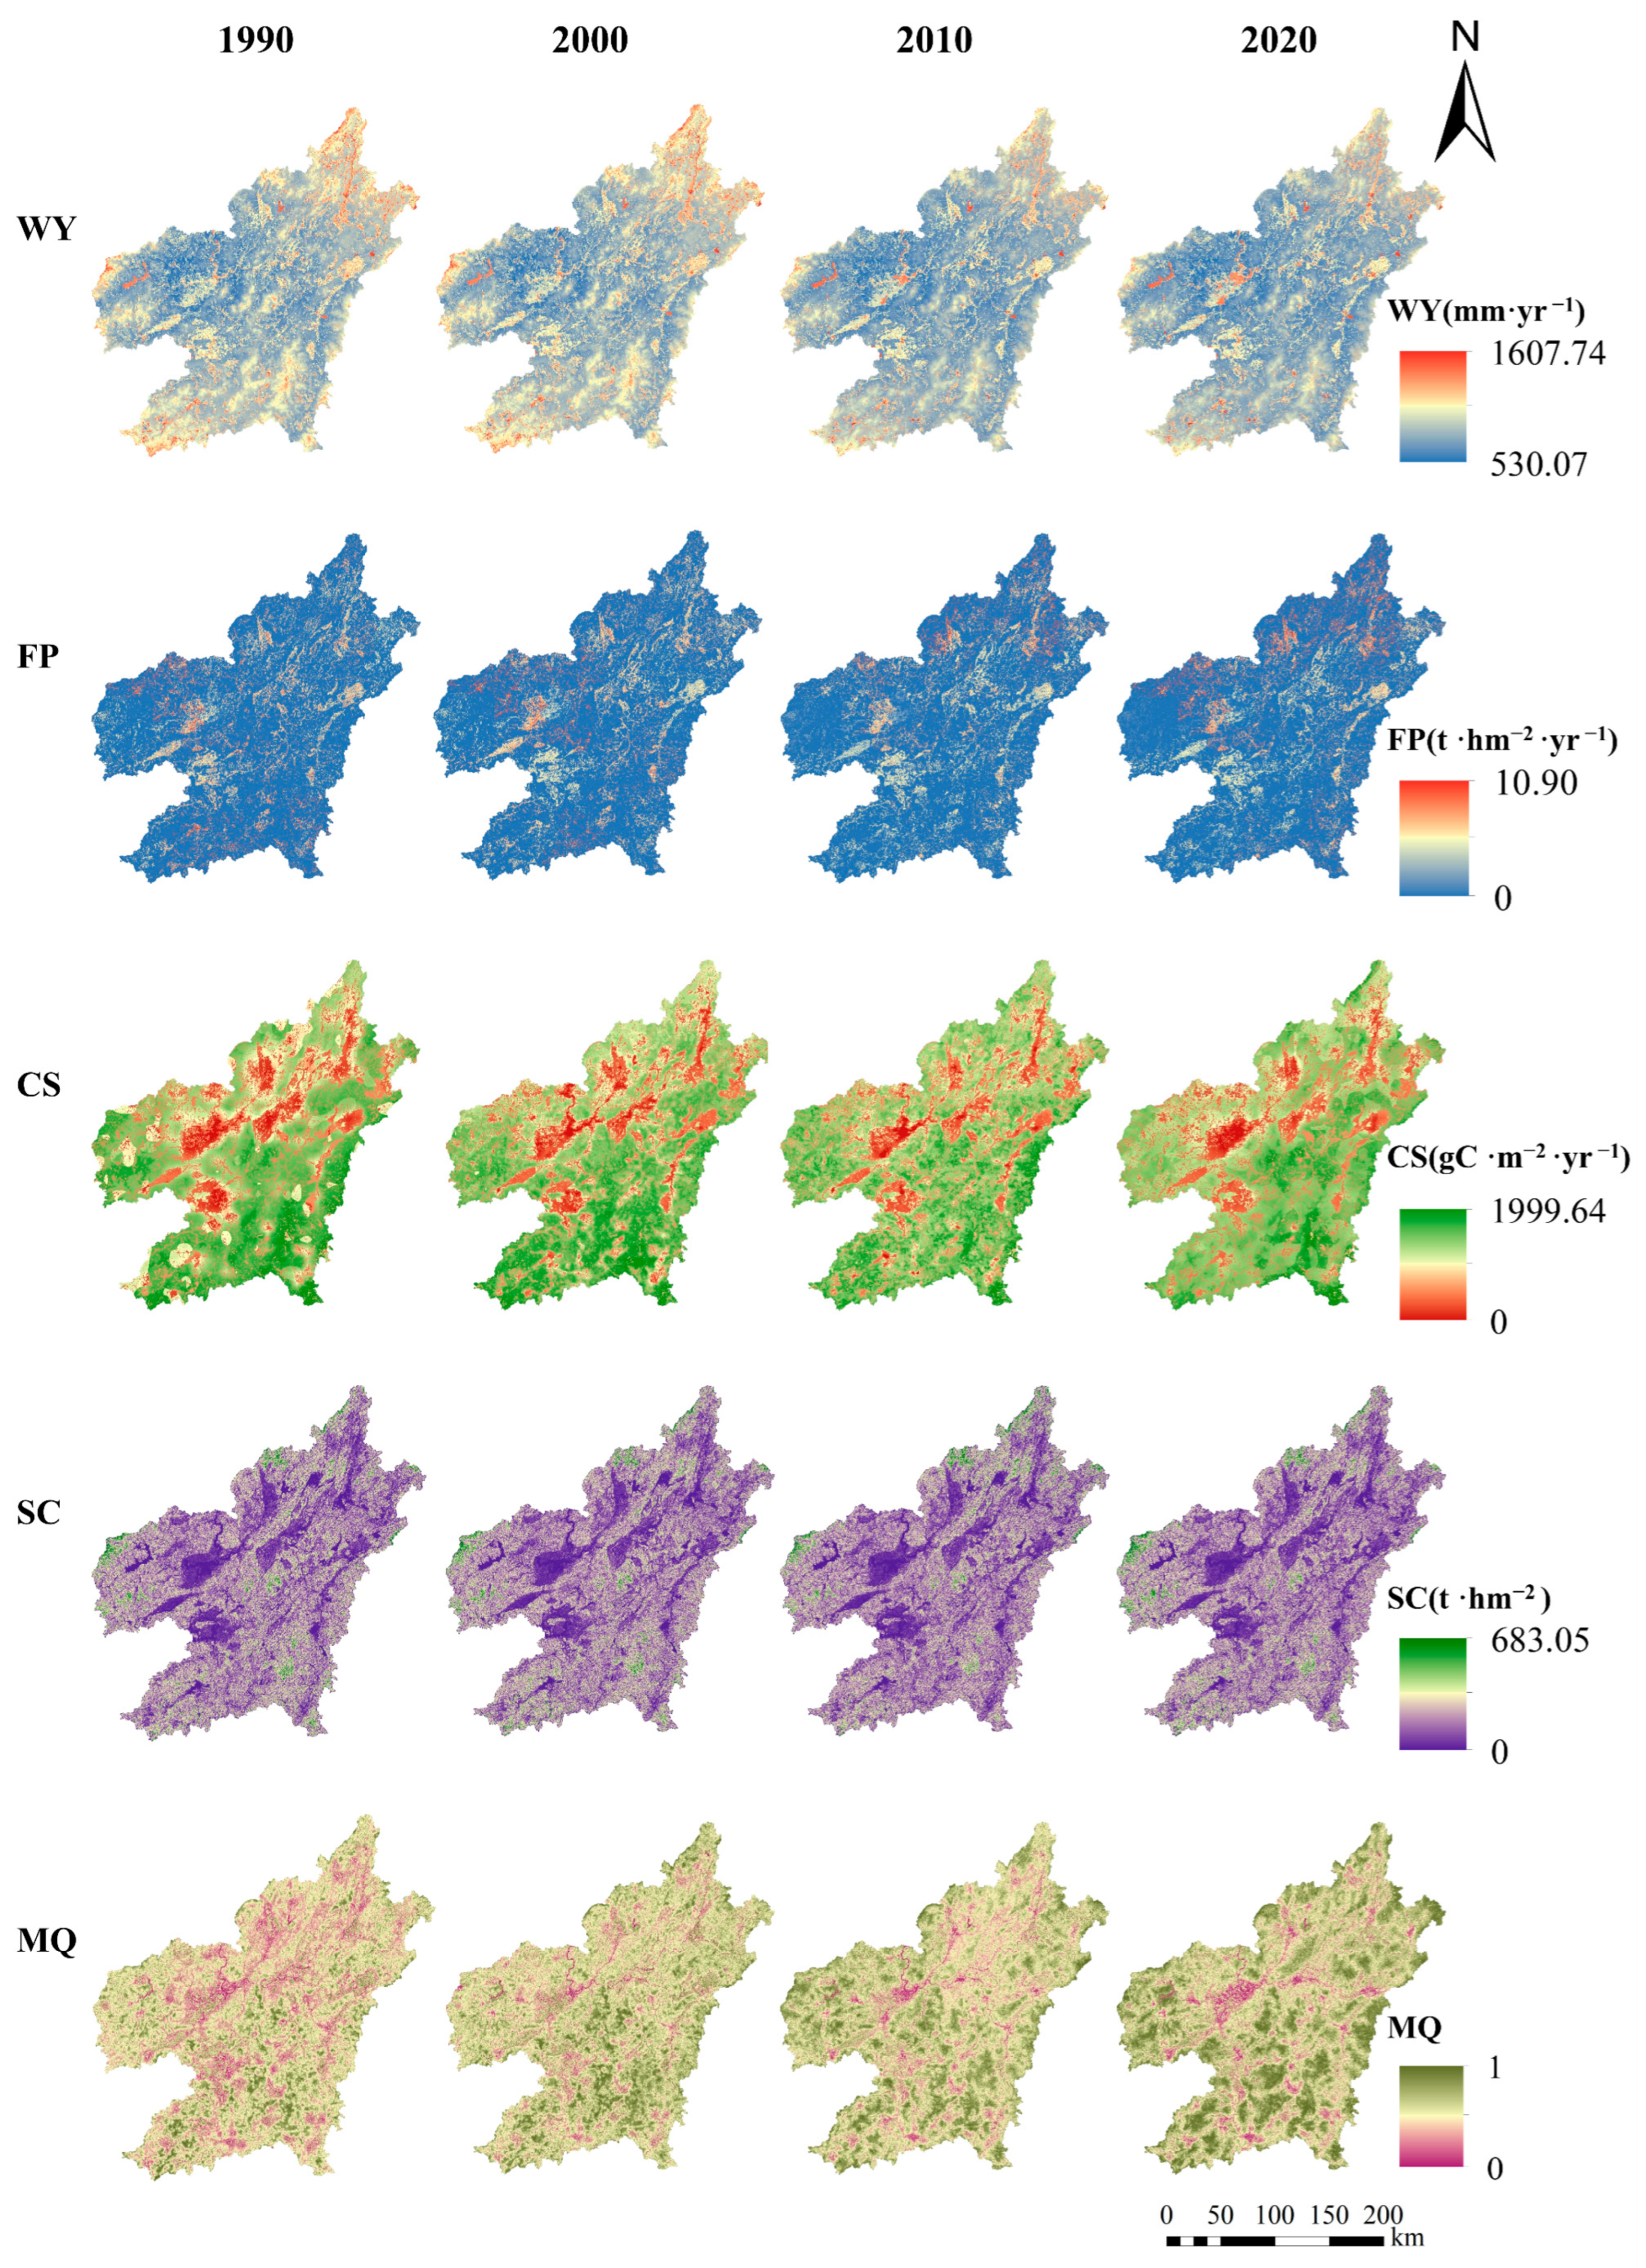
3.1. Spatio-Temporal Dynamics of the Key ESs

The five ecosystem services considered in the study region presented spatial heterogeneity, while their distributions were relatively stable during the 30 years (Figure 2). By 2020, these high-value zones had experienced a marked reduction, accompanied by a significant decline in the regional average WY, decreasing from 834.5 mm in 1990 to 638.4 mm (Table 2). Unlike WY, the high-value regions of FP expanded with time. In the northern part of the study area, the high-value region was more concentrated in 2020 compared to 1990, and the total FP increased from 2.37 million tons in 1990 to 2.58 million tons in 2020. There were strong similarities in the spatial distributions of SC, CS, and MQ. The areas with high values were significantly affected by the forest land distribution, whereas the low-value areas occurred in urban and surrounding areas. As the forest land ratio increased, the high-value areas of these three services also increased, especially for habitat quality and carbon sequestration. The mean score of MQ significantly increased from 0.37 in 1990 to 0.54 in 2020. Concurrently, total CS increased by 6.9 × 10¹² gC, while total SC rose by 4.8 × 10⁸ t.

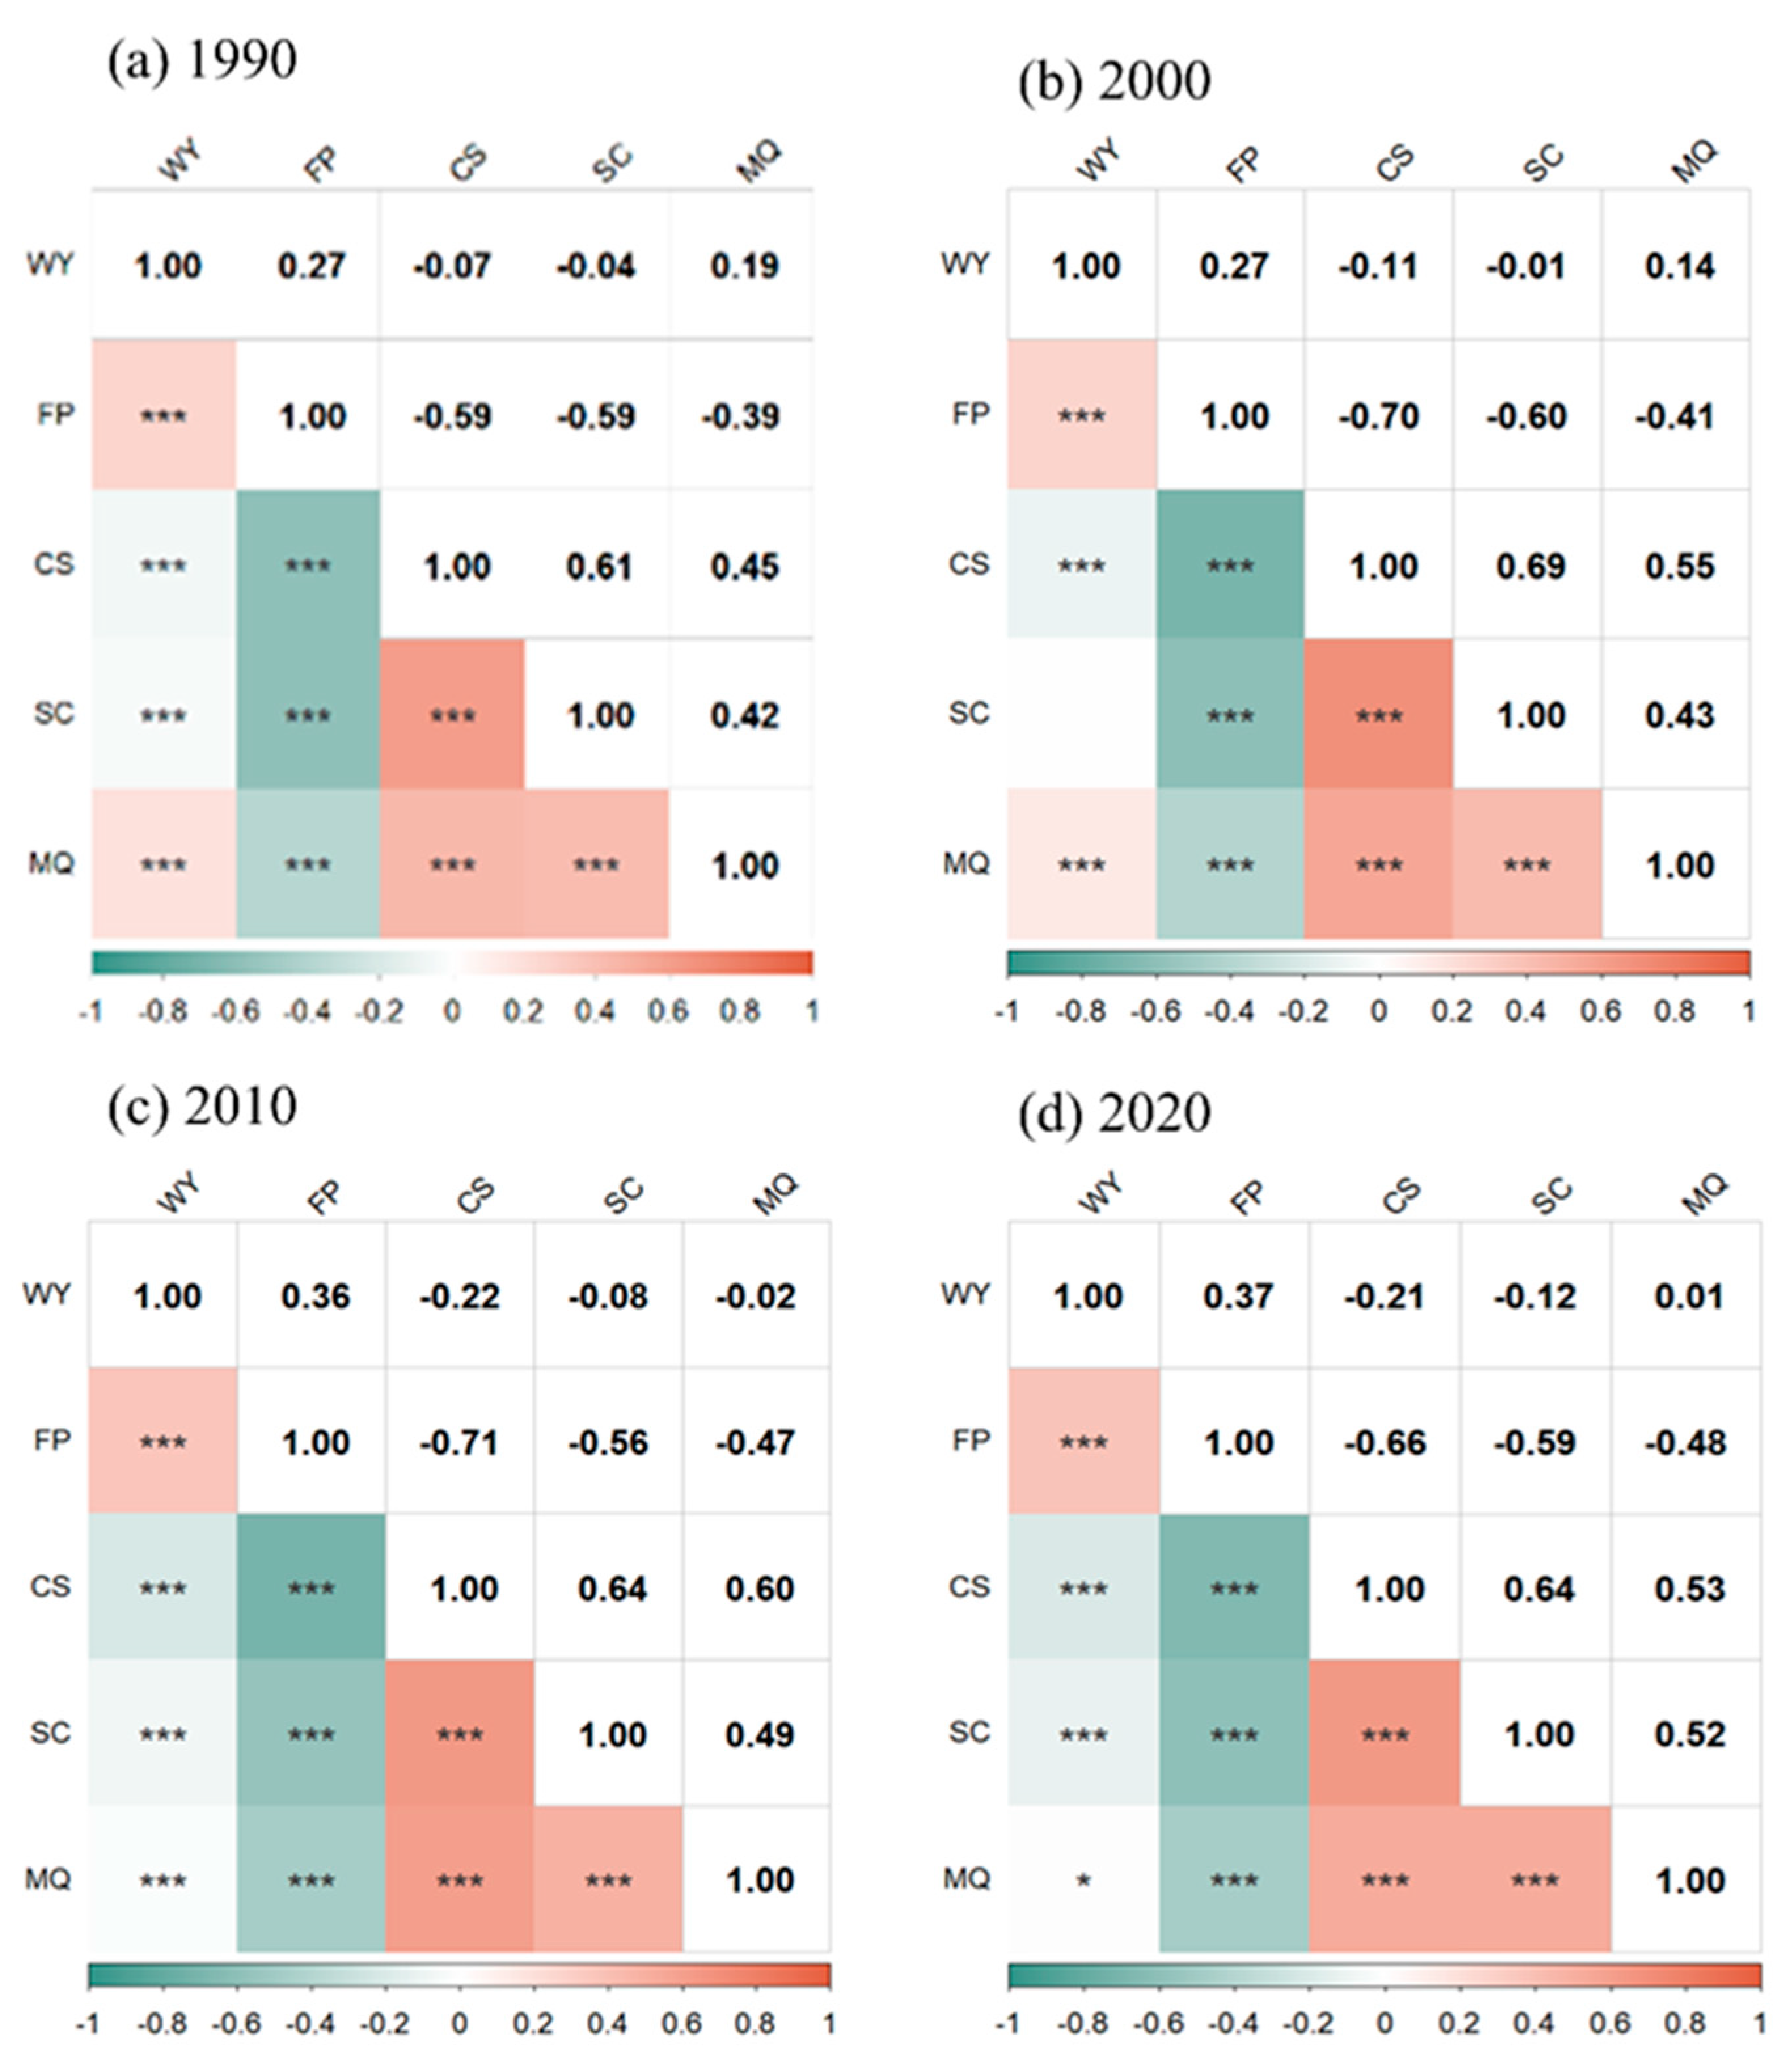
3.2. Trade-Offs and Synergies Among ESs

In this paper, the Spearman correlation coefficient was used to explore the trade-offs and synergies between the pairwise ESs (Figure 3). The relationships among ecosystem services exhibited complex variations throughout the research period (Figure 3). The correlations between regulating services (CS, SC, WY) and support services (MQ) were predominantly positive, with several negative correlations also observed. Specifically, except for WY, the remaining regulating services (CS, SC) and support services (MQ) demonstrated positive and highly significant correlations (R > 0.5, p < 0.001), and a progressive strengthening of this positive correlation was observed. Highly significant negative correlations (p < 0.001) characterized WY-SC/CS interactions across the study period, with the distinct exception of the non-significant association (p > 0.05) between WY and SC specifically observed in 2000. The relationships associated with MQ and WY changed significantly in 2020 compared with 2000. From 2000 to 2010, the relationship between WY and MQ shifted from highly synergistic to trade-off, whereas by 2020, the previously highly negative correlation (p < 0.001) had evolved into a weak synergistic relationship (R = 0.01, p < 0.05). Compared to the highly negative correlations observed with other regulating services (SC, CS), a positive correlation with WY was indicated by FP (R > 0.27, p < 0.001). The relationship between FP and MQ exhibited a highly significant trade-off that increased with time (R < −0.39, p < 0.001).

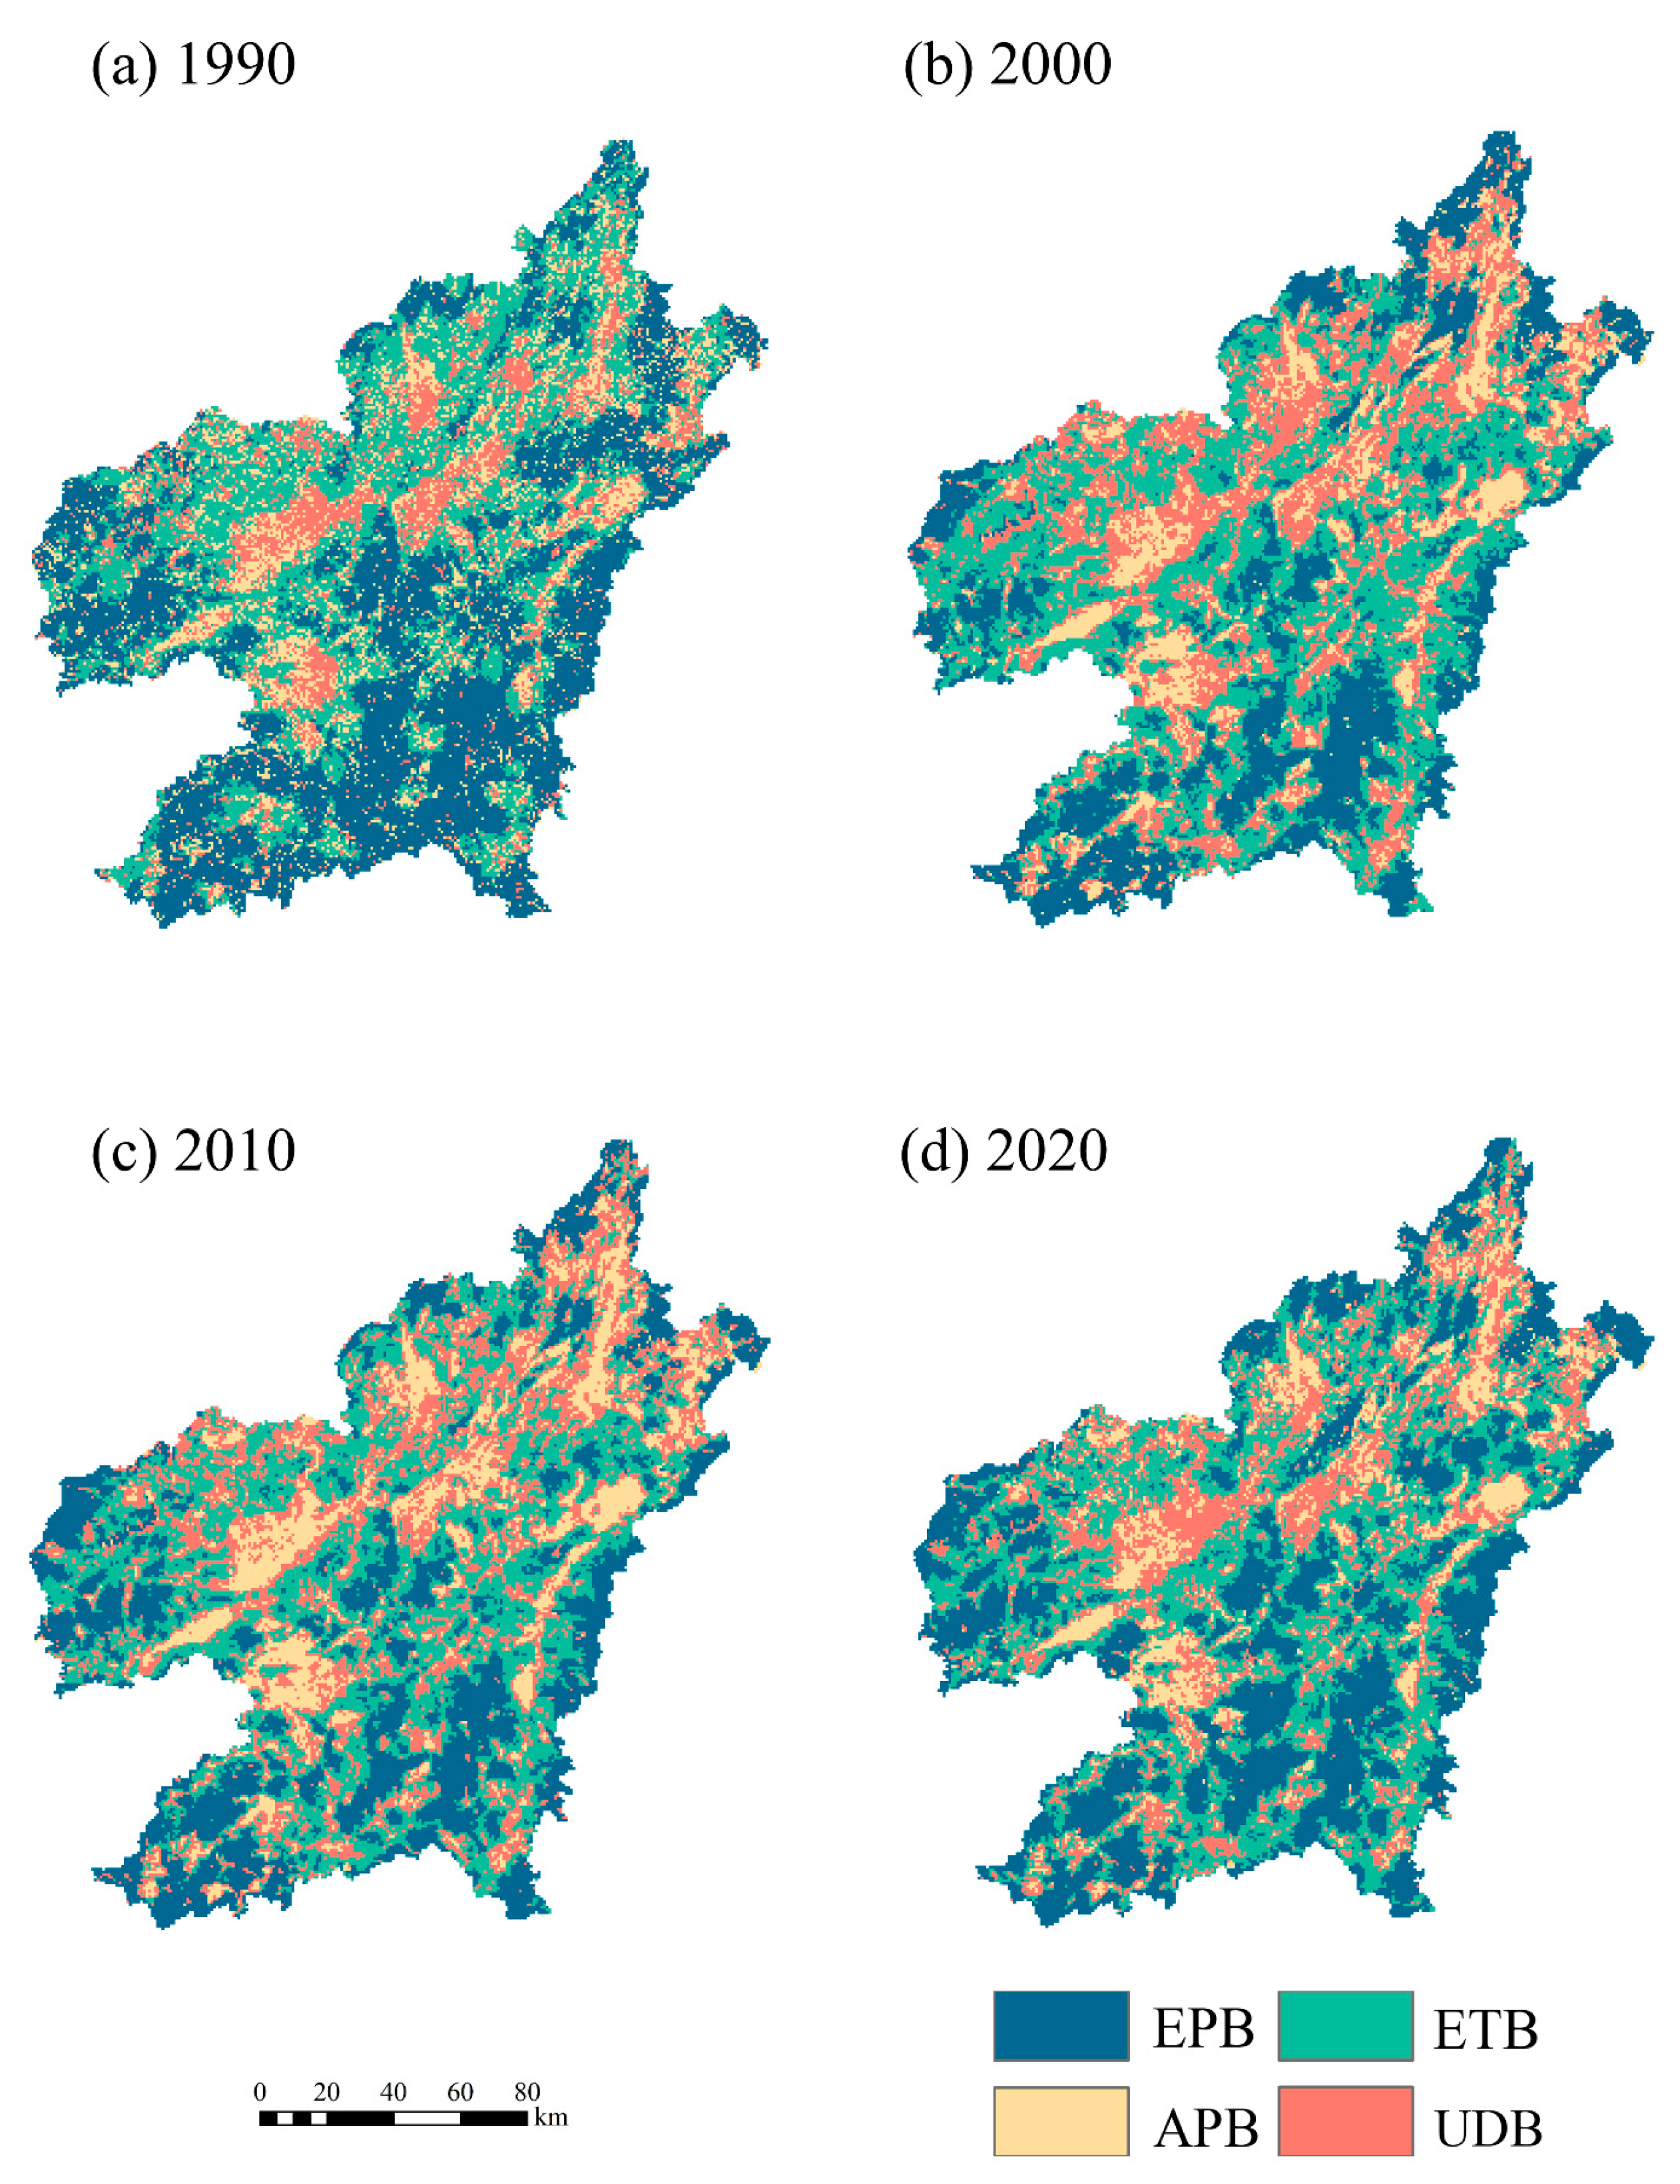
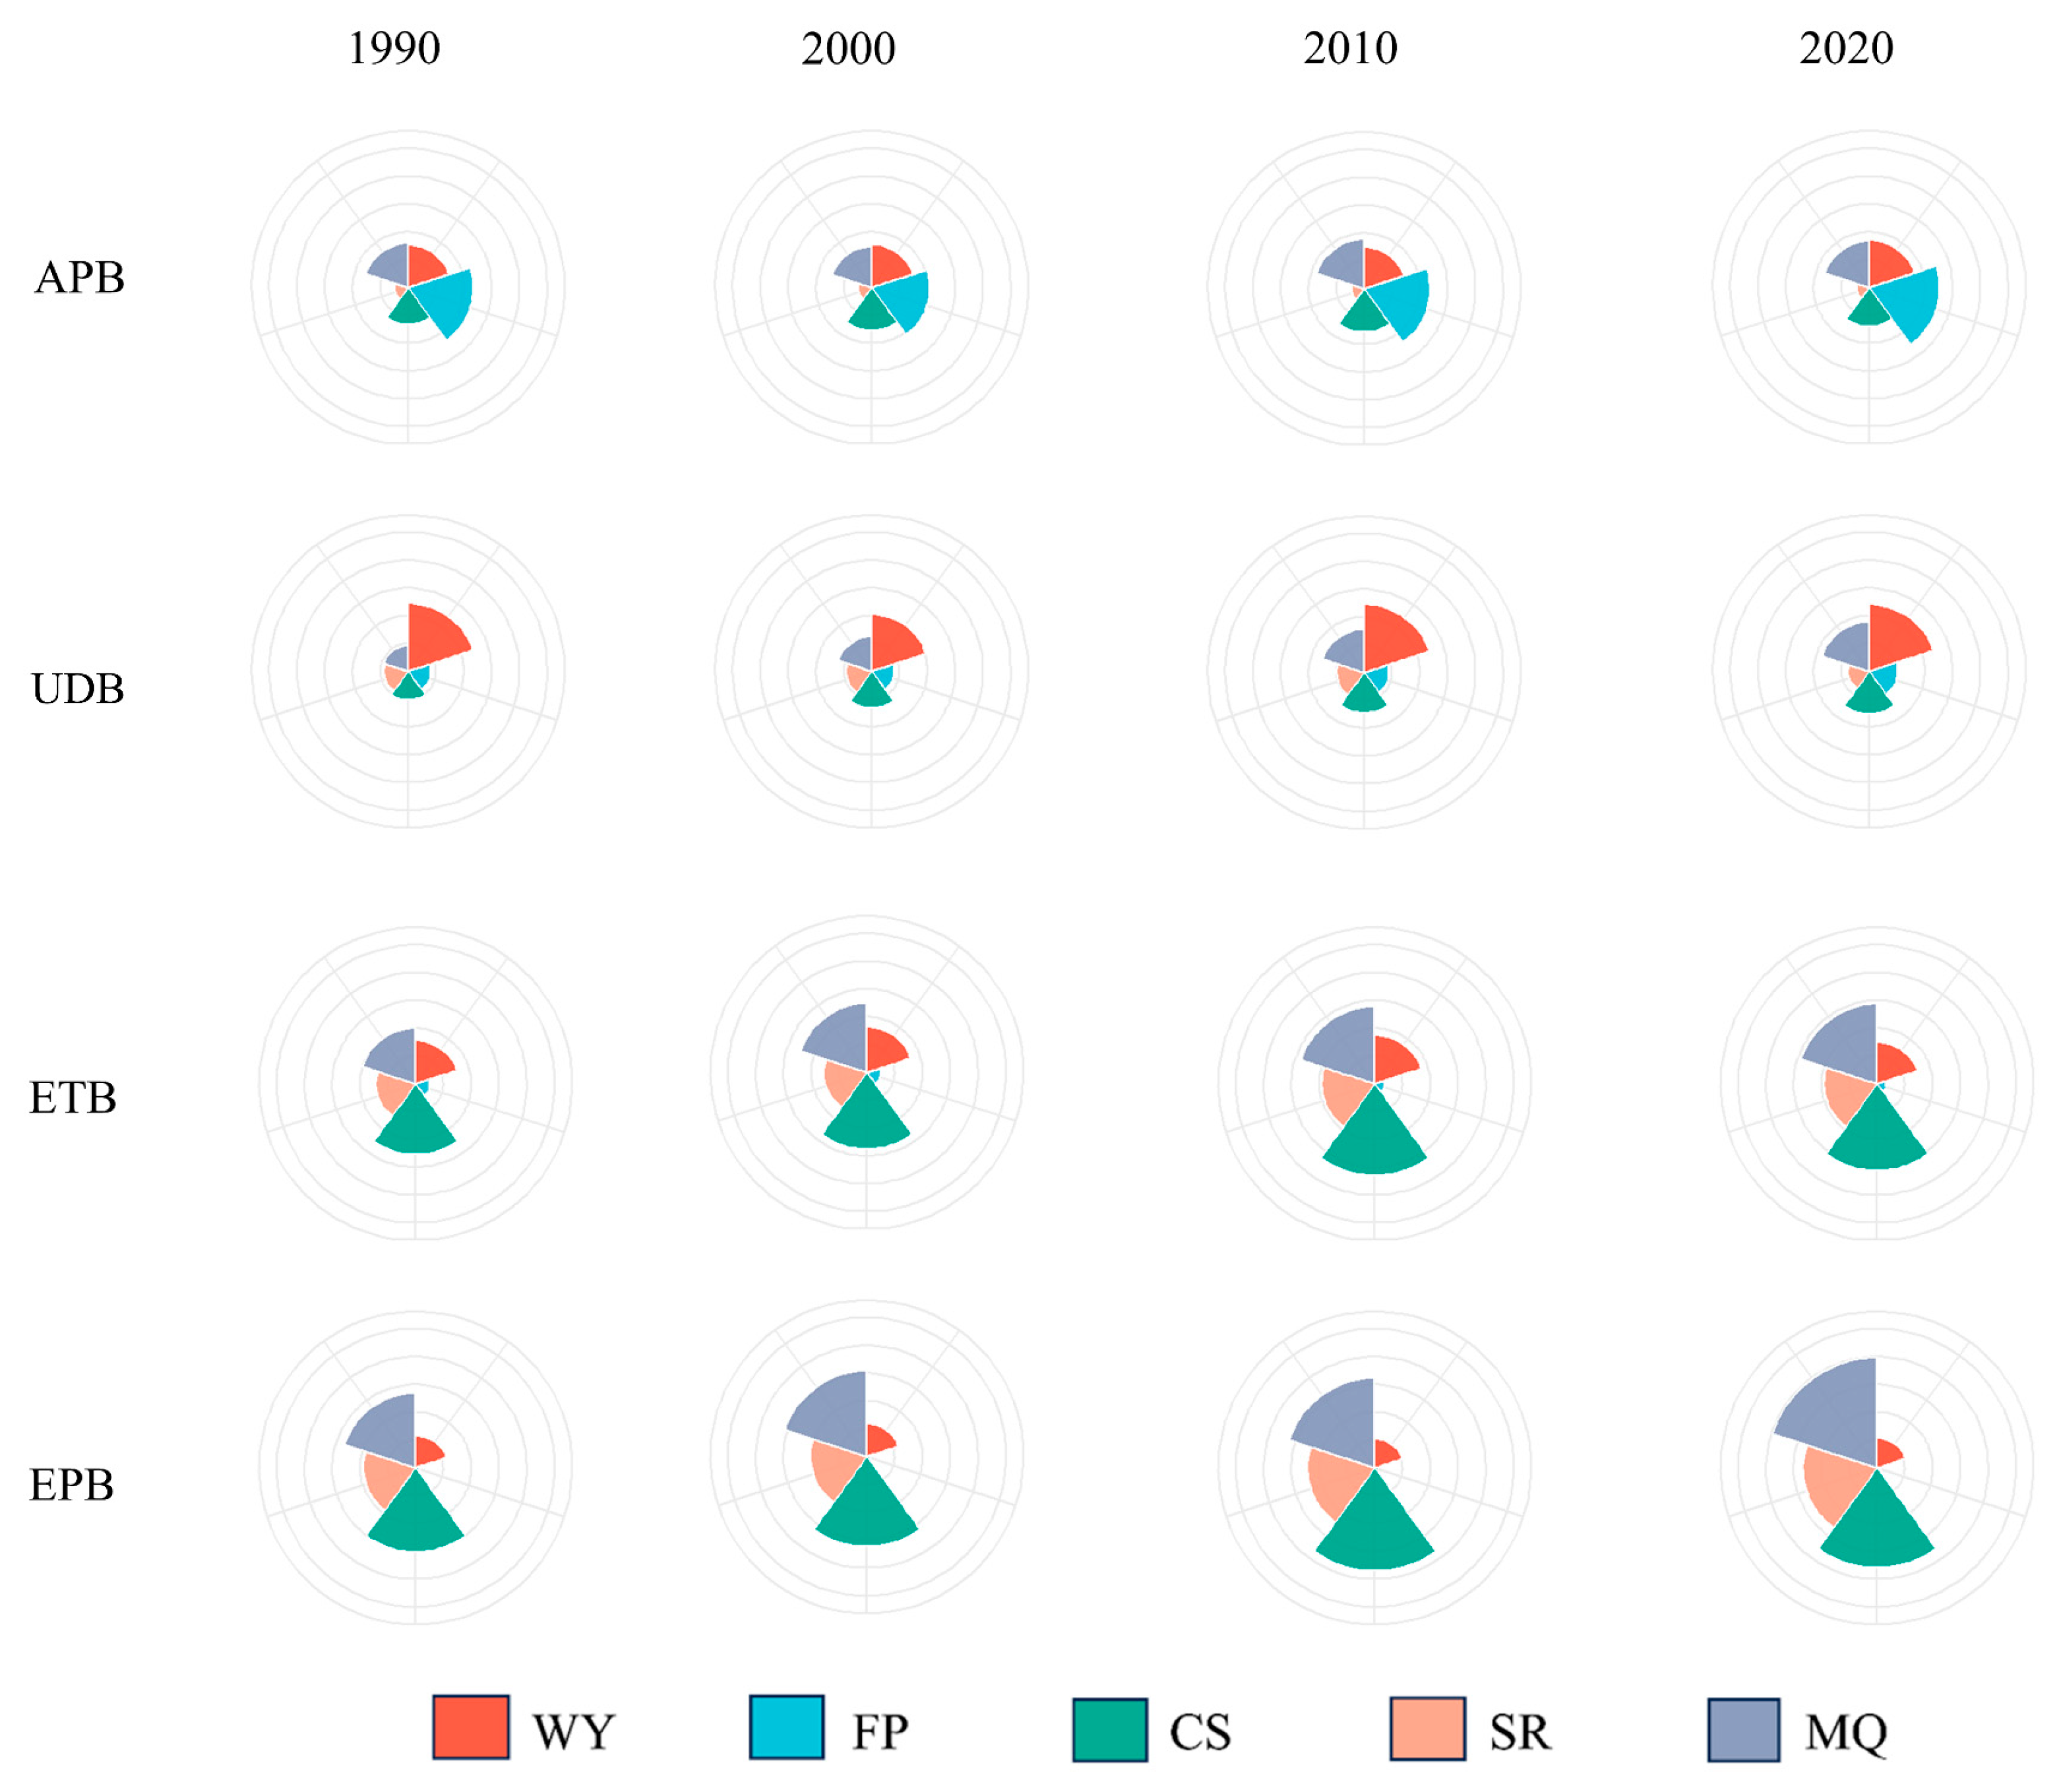
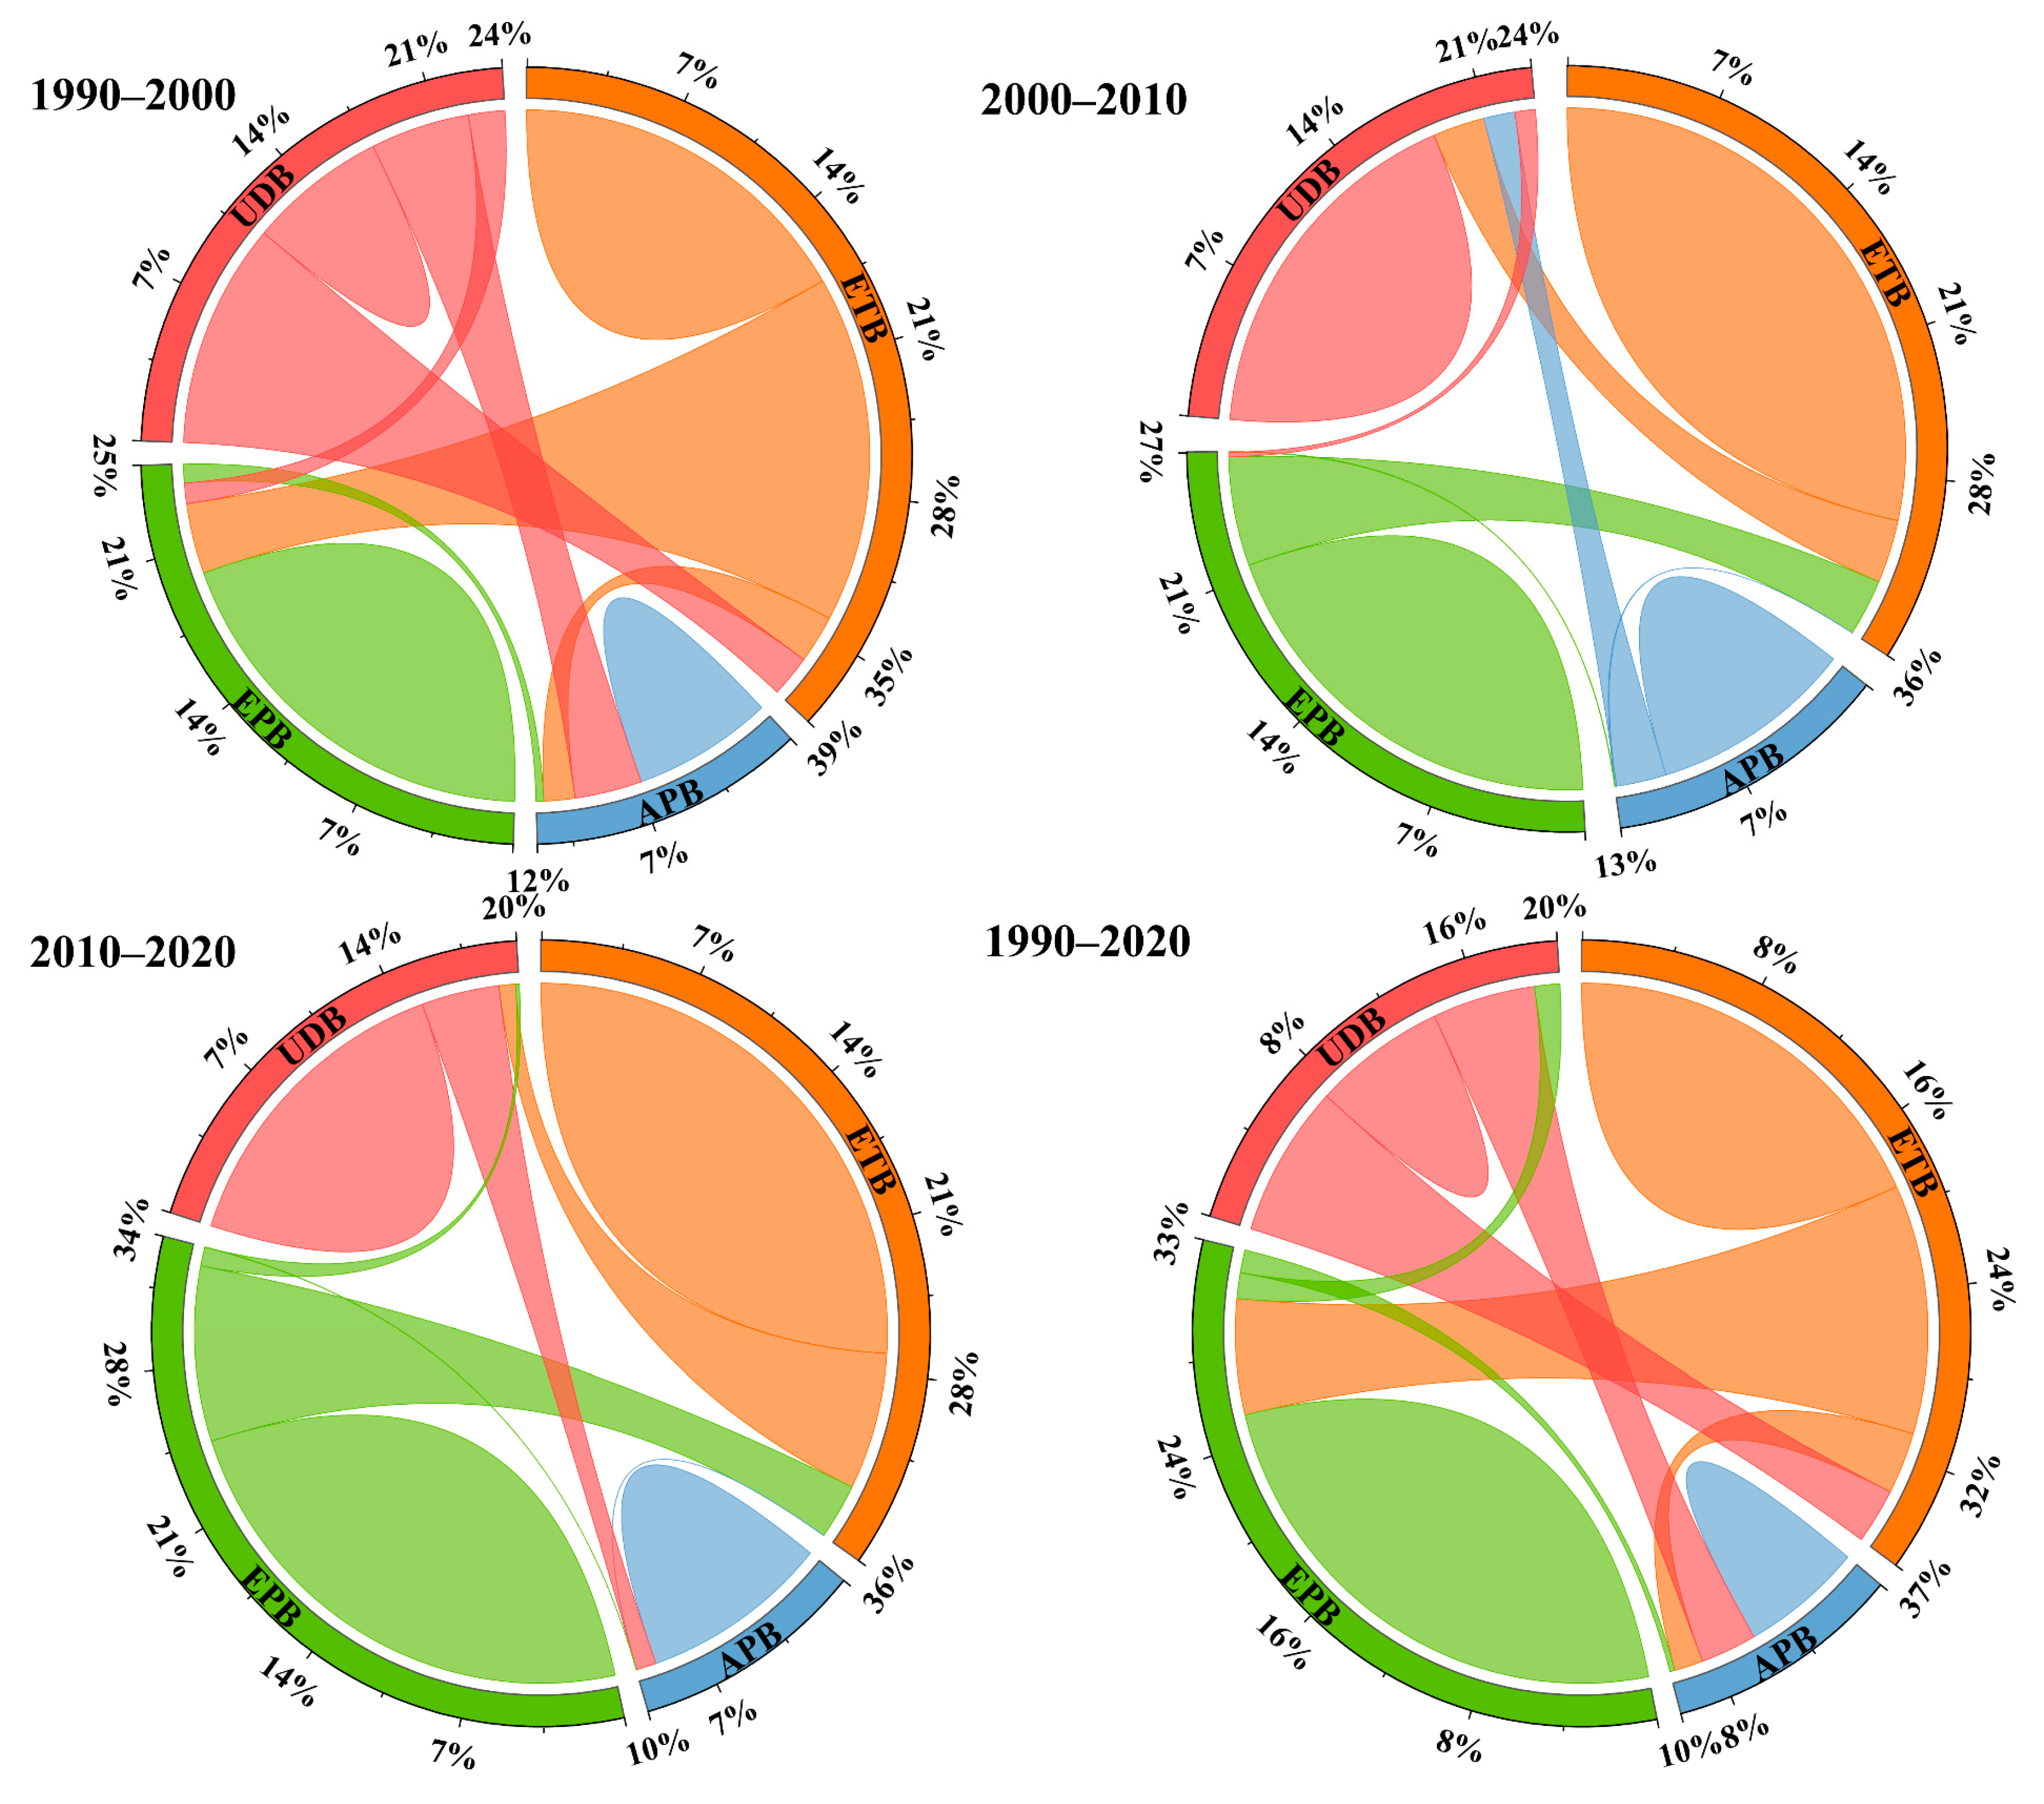
3.3. Spatial Distribution and Characteristics of ES Bundles

This study employed principal component analysis (PCA) and the K-means algorithm to determine the optimal cluster number as four, thereby identifying the spatial distribution of four ESBs: the agricultural production bundle (APB), urban development bundle (UDB), eco-agricultural transition bundle (ETB), and ecological protection bundle (EPB). All ecosystem service values were normalized to a 0–1 range before calculating the mean values of individual services within each ESB to quantify internal characteristics of the bundles. Figure 4 and Figure 5, respectively, present the spatiotemporal dynamics and internal composition features of ESBs during the 1990–2020 period. Ecosystem service bundles varied in spatio-temporal dynamics and functional structure. The spatial patterns of the four ESBs remained relatively stable during 1990–2000, exhibiting a radial distribution from the middle to the surroundings (Figure 4). Specifically, EPB occupied most areas and was predominantly distributed in the outermost area of the study region, and this bundle was characterized by the highest delivery of regulating services (SC, CS) and supporting services (MQ) and had the most prominent ecological function (Figure 5). APB was mostly distributed in the middle and northern areas dominated by plains. In this type of bundle, except for FP, which had the highest values, other ESs had the lowest values in the study area. ETB existed in a transition zone between urban and mountainous areas, and the ESs in this type of bundle showed moderate levels except for FP. UDB was composed of urban concentrated areas that had similar values for various ecosystem services, while regulation and support services (SC, CS, MQ) were lower than those in the ETB and EPB.
As shown in Figure 6, this study quantified the areal transition ratios among ESB types during the 1990–2020 period through spatial overlay analysis, based on area proportions of each bundle at four temporal nodes. In terms of temporal variation, significant changes were observed in the area proportion of ESBs during 1990–2000 (Figure 6). One area of change was the transformation from ETB and APB to UDB, resulting in a near doubling of the UDB area from 13% to 24%. Similarly, 16% of EPB turned to ETB. Consequently, the area proportion of the ETB increased from 33% to 38% through compensation from the EPB, while the area ratio of the EPB decreased from 38% to 25%. From 2000 to 2020, the main changes focused on the mutual transformation between EPB and ETB, mainly the transformation from ETB to EPB, and the area proportion of EPB gradually increased from 25% to 33%. But, the proportion of ETB area in this period did not decrease significantly under the compensation of UDB and APB, only from 38% to 36%, while the proportion of UDB final area decreased to 20%. Overall, the EPB was the dominant bundle in the study area, followed by the ETB. The area of ETB declined, yet overall, it sustained an upward trend. Conversely, UDB followed the opposite pattern.

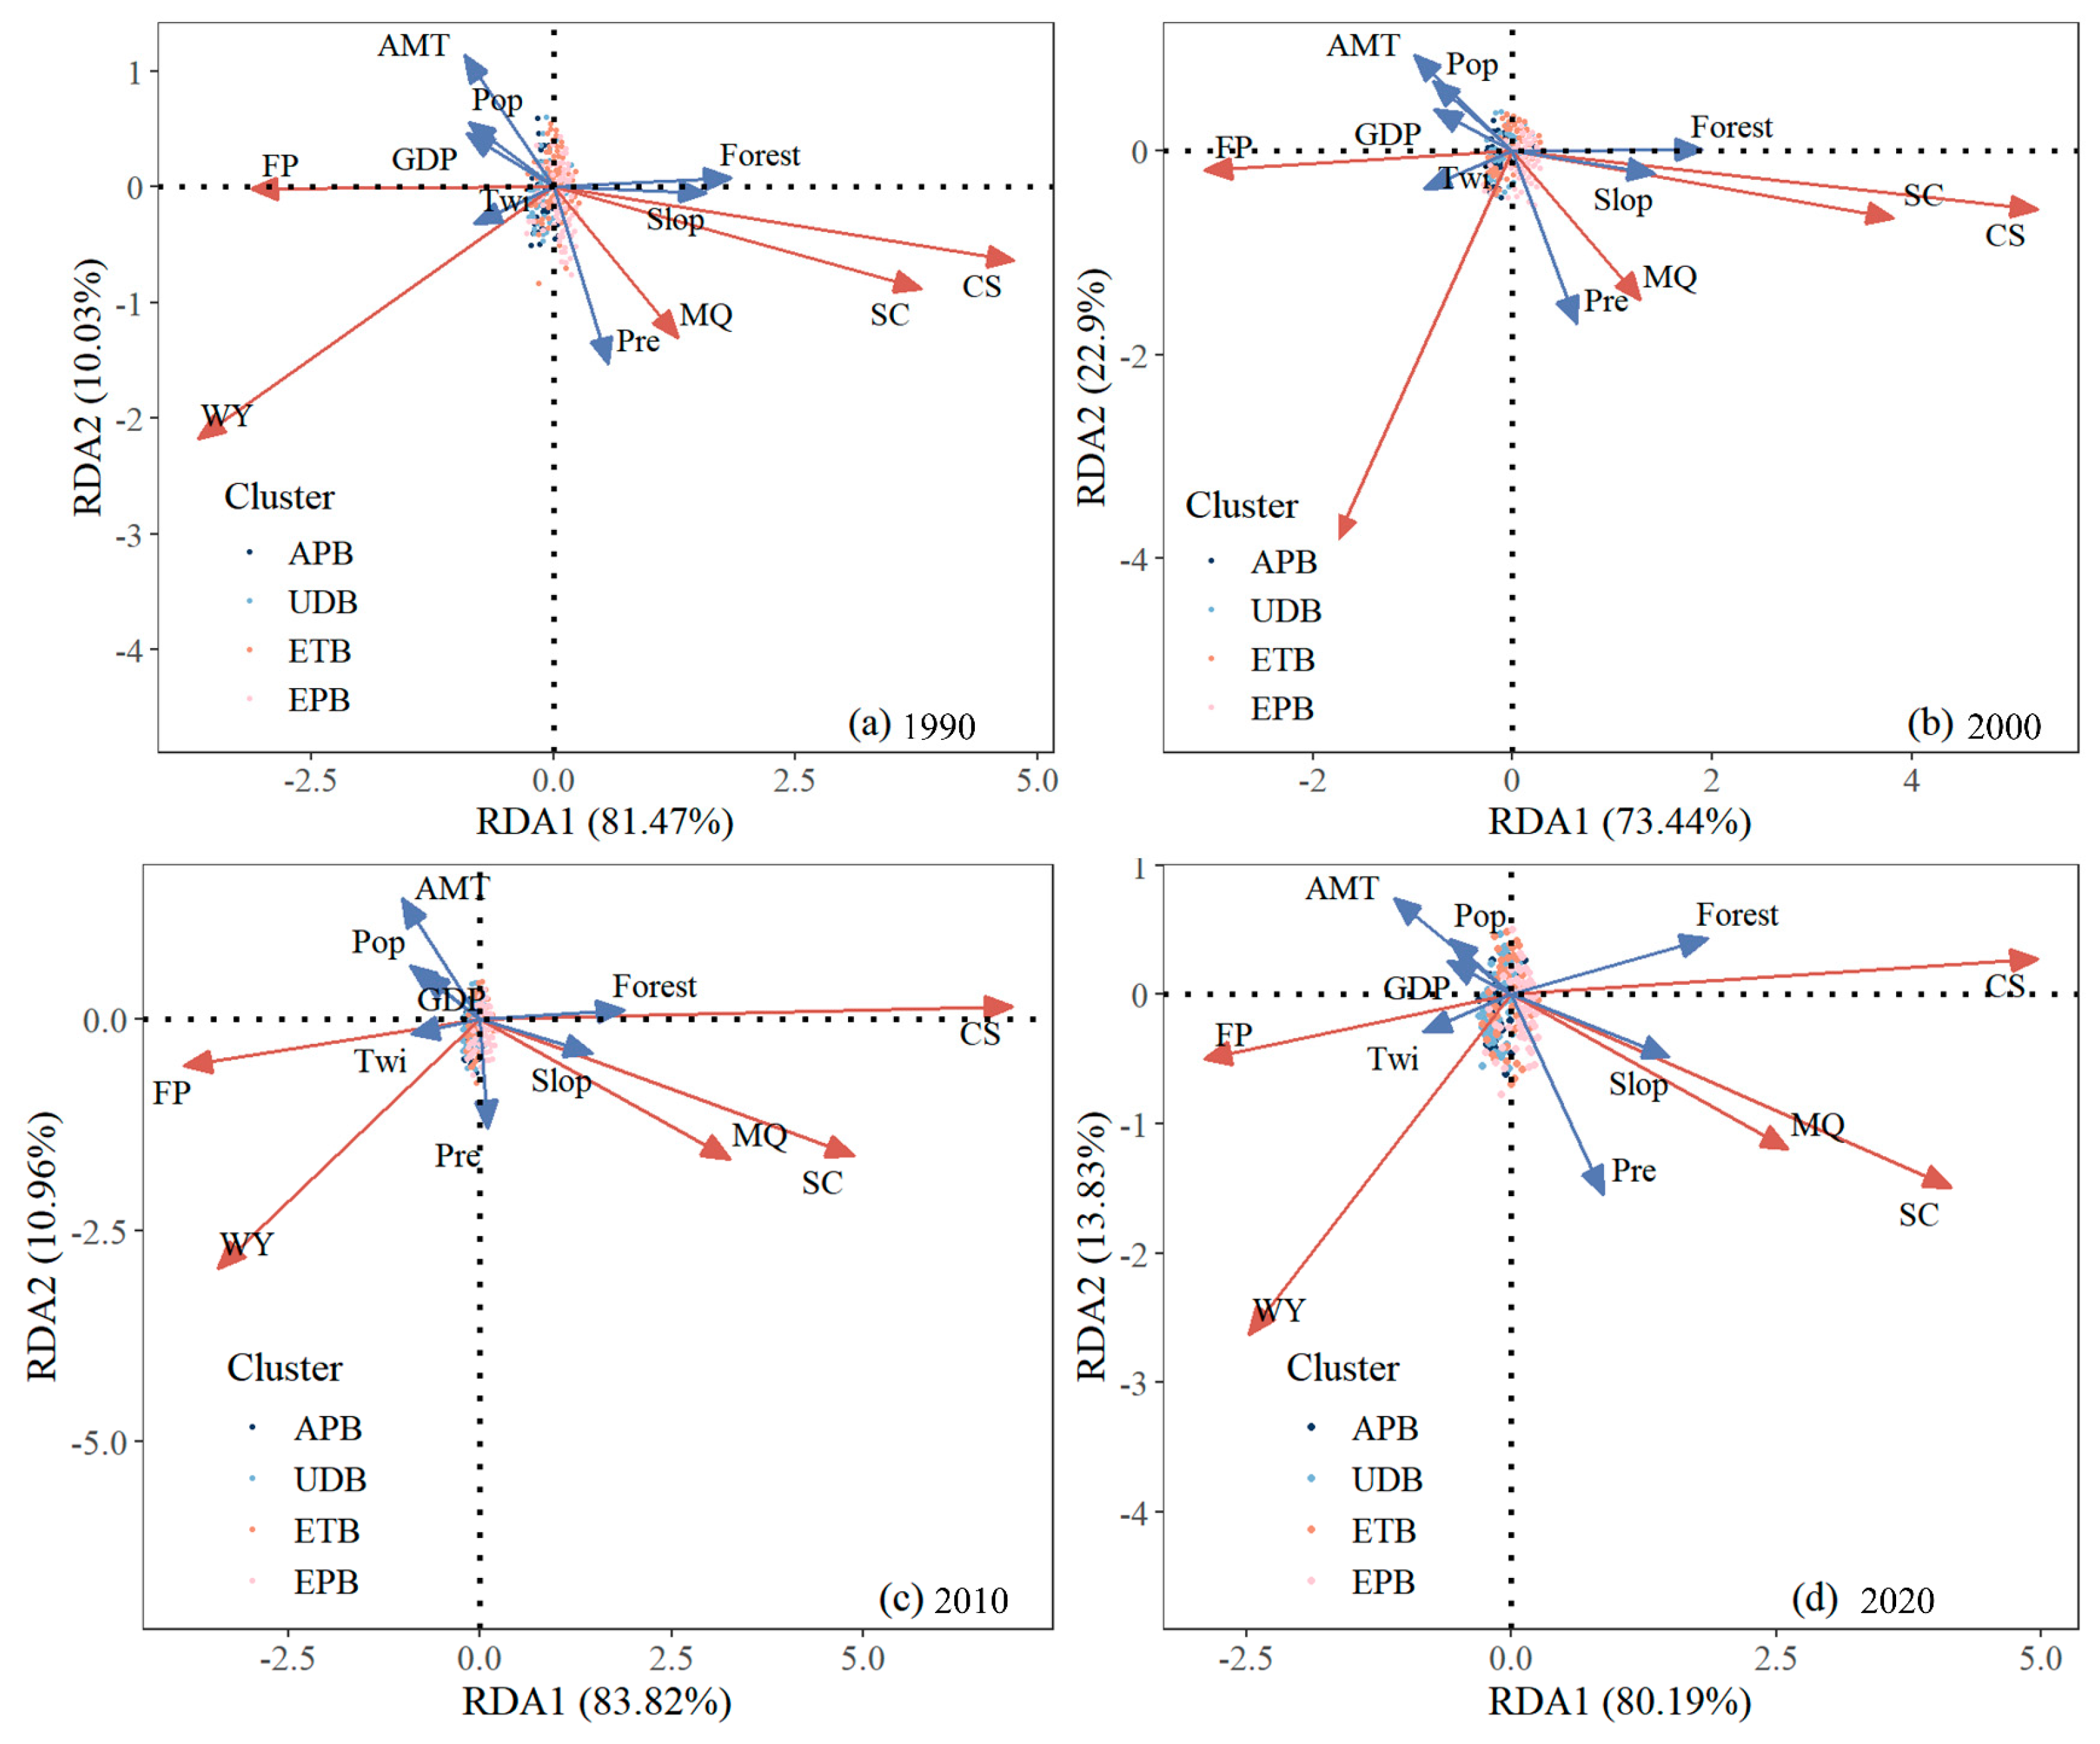
3.4. Socioecological Drivers of ESs and ES Bundles

A redundancy analysis (RDA) identified apparent correlations between eight socio-economic factors and ecosystem services, as well as ecosystem services bundles. The cumulative percentages of variance of the first two axes exceeded 80% throughout the period from 1990 to 2020 (Figure 7). The impacts of driving factors on ecosystem services varied over time, and the primary influencing factors were also diverse. Forest land ratio and slope consistently exhibited positive effects on SC, CS, and MQ. The enhancing impacts on SC and CS strengthened significantly over time, with forest cover ratio demonstrating the most pronounced temporal amplification. POP and GDP had a positive effect on FP and WY, but their effects were gradually weakened. For ESBs, in the RDA analysis results, most of the sample points in the EPB were distributed in the same direction as SC, CS, and MQ; that is, the EPB had higher SC, CS, and MQ service values. Some samples in the ETB were in the same direction as SC, CS, and MQ, and the proportion of forest land and slope in this direction had a positive impact on these samples. At the same time, it was found that the number of samples in the same direction as SC, CS, and MQ in ETB gradually increased with time. This revealed that the forest land ratio and slope were positive factors for the transition from ETB to EPB. However, under the negative impact of POP and GDP, EPB was easily converted into ETB and UDB, which reflects human pressure. This also means that POP and GDP were the main influencing factors of UDB expansion. Climate factors displayed complex, non-linear relationships with ecosystem services due to meteorological uncertainty, and they lacked discernible temporal patterns. In contrast, the slope gradient and the topographic wetness index maintained stable influences on both ecosystem services and their bundles. In particular, the slope gradient sustained persistent positive correlations with CS and consistent negative correlations with WY and FP, with magnitudes showing minimal temporal variation.

4. Discussion

4.1. Effects of Ecological Restoration on Variations of ESs and Their Interactions

Our analysis reveals a dualistic impact of ecological restoration on ESs: while it markedly enhanced regulating services and supporting services (carbon storage, soil conservation, and habitat quality), regulating services such as water yield experienced significant trade-offs. During the study period, particularly following the post-2000 implementation of China’s Natural Forest Protection Program, Upper-Middle Yangtze Soil and Water Conservation Project, and the Grain-for-Green Program, forest coverage in mountainous regions significantly increased. Building upon the foundational measures of “enclosure, replanting, and management” for existing vegetation as well as low-efficiency forest improvement, these projects implemented vegetation restoration using a contour bamboo-joint trench system integrated with tree–shrub–grass mixed planting [40]. Economic fruit plantations were transformed through combined biological and engineering approaches, including tea-oil camellia with hedgerows and navel orange cultivation featuring levelled terraces with grass-planted embankments [41]. Consequently, forest coverage rose from 74.4% in 2000 to 76.2%, enhancing understory microhabitats and significantly improving soil quality [42]. Existing research indicates that the expansion of forest area substantially enhances carbon sequestration and carbon storage capacity [43]. Forest expansion and growth reduce surface runoff while increasing evapotranspiration [14], thereby mitigating rainfall-induced soil erosion. Furthermore, increased root biomass density in forests alters soil physicochemical properties, consolidates soil structure, and improves erosion resistance [44]. Nevertheless, regional WY averages showed a significant decrease over the study period. This trend aligns with the results from Tian et al. [45] and Su et al. [46], where vegetation recovery and afforestation programs increased forest cover, thereby elevating evapotranspiration and modulating regional water yield. Therefore, the forest land ratio constitutes the dominant regulator of these ESs (Figure 7), with ecological restoration initiatives serving as the primary driver behind ES enhancement in Gannan. As for the distribution pattern of these ESs, the topographic isolation of these high-altitude regions limits anthropogenic disturbance, thereby supporting elevated biodiversity [47]. Correspondingly, the spatial patterns of SC, CS, and MQ exhibited a “high-periphery, low-core” configuration (Figure 2), aligning with findings by Liao et al. [48] and Zhou et al. [49] in this region. In contrast, WY showed a relatively high correlation with POP and GDP; that is, high WY values were concentrated in urbanized flatlands of the central study area, where sparse and homogeneous vegetation with poor surface permeability led to elevated runoff [50].
The research on the relationships between ESs verified the typical interaction mode: a significant negative correlation between FP and MQ, along with stable synergistic interactions among CS, SC, and MQ. These findings are consistent with previous studies [21,51,52]. Generally, soil conservation measures facilitate vegetation restoration, with increased vegetation coverage enhancing soil quality through improved interception of surface runoff and elevated rates of soil water infiltration [53,54]. These processes collectively reduce water yield and soil erosion. Consequently, synergistic interactions emerge among CS, SC, and MQ, forming a mutually reinforcing mechanism that amplifies ecosystem service co-benefits [55]. Importantly, our analysis reveals that ecological restoration projects drive a significant enhancement in the synergistic interactions among carbon storage (CS), soil conservation (SC), and habitat quality (MQ). This intensification effect essentially constitutes a positive feedback loop in ecosystem service provision—engineering measures reduce surface runoff, suppress soil erosion, and reshape the local ecological environment, thereby creating fundamental conditions for biodiversity enrichment and subsequently elevating habitat quality. Crucially, this improved habitat quality further reinforces carbon storage and soil conservation functions, ultimately establishing a self-reinforcing synergistic enhancement mechanism [47]. In this study, the trade-offs between FP and SC, CS, and MQ intensified over time, fundamentally reflecting conflicts between food production and environmental conservation. While farmland on slopes exacerbates soil erosion in mountainous areas, representing a trade-off between provisioning services and supporting or regulating services, ecological restoration initiatives like the Grain-for-Green Program have induced land-use conflicts, further exacerbating these trade-offs [56]. There was significant temporal heterogeneity in the interaction between WY and MQ. While similar complex associations were reported by Liu et al. [57], this study improved the representation of ecological processes by incorporating NDVI-based land use changes into the habitat quality assessment and enhancing spatial precision through grid cell-based analysis. Consequently, the WY-MQ relationship exhibited stronger nonlinearity, which also indicated that ecological restoration projects have complex and uncertain impacts on ES interconnections due to multifaceted driving factors [58]. Thus, the complex influence of restoration initiatives on ESs and their interactions must be rigorously accounted for in spatial planning frameworks to reconcile trade-offs and amplify synergies.

4.2. Spatio-Temporal Characteristics of Ecosystem Service Bundles and Implications for Eco-System Management

Identifying functionally heterogeneous service bundles can provide spatial decision-making support for formulating regional ecological sustainability strategies. The EPB was mainly distributed in high-altitude areas characterized by high forest coverage and low human disturbance, particularly within the mountain ranges surrounding the study area (Figure 4). This spatial distribution pattern aligns with the “forest bundles” identified in previous studies [19,20,51], thereby validating the rationality of the bundles identified in this research. Studies generally identified population density, GDP, and vegetation index to be the primary drivers in such clustered regions [59]. Although GDP and POP factors in this study also promoted the shift of EPB to ETB, the effects generated by long-term ecological restoration projects have offset these negative impacts. Since 2000, large-scale soil and water conservation projects have been implemented across nine counties and 77 small watersheds in the region [42,57]. Structures such as check dams, ponding dams, and gully head stabilization structures have effectively intercepted sediment loss. Additionally, planted trees have enhanced the interception of rainfall through canopy coverage, surface retention, and root systems, thereby increasing infiltration rates and the soil water-holding capacity [21,55]. As a result, despite rapid economic development, both the spatial extent of these bundles and the average values of regulating and supporting services have significantly improved (Figure 5). For the management of EPB, semi-arid regions such as the Loess Plateau and Inner Mongolia emphasize the need to balance vegetation planting with regional water availability due to limited water resources, meaning there should be clearly defined thresholds in vegetation restoration [23]. However, in this study area, characterized by perennially high rainfall and acidic red soils prone to hydraulic erosion-induced soil degradation, further stabilizing the ecological effects brought by the ecological restoration project should be the focus of future management strategies [42]. Ecological redline control zones should be demarcated within this bundle, strictly prohibiting construction activities and productive disturbances to establish a nature reserve system. Concurrently, the stability of forest ecosystems must be enhanced through the implementation of multi-aged, stratified mixed forests and the optimization of vertical community stratification, thereby preventing the disruption of ecological service functions that could compromise the restoration achievements accumulated over recent decades [51]. In addition, it is necessary to rationally allocate engineering, biological, and chemical measures in orchards to improve the extensive management mode and solve the soil erosion problems caused by single species, poor biodiversity, and soil compaction in orchards [60].
Similar to previous studies, the service bundles identified within the Gannan region also include APB and UDB [61,62]. These two bundles share common characteristics of landscape homogenization and exhibit less diversified ES functions. Within UDB, densely concentrated built-up environments are structurally predisposed to fragmenting the natural landscapes into disconnected patches, severely compromising the integrity of biodiversity. This spatial configuration fundamentally constrains the development of regulating and supporting ecosystem service capacities in such areas. As a main grain production area, APB is situated in flat river valley plains where topographic gradients do not constitute a primary constraint on ecosystem service functions. Nevertheless, extensive land-use practices and anthropogenic disturbances could impair habitat quality and reduce soil conservation within these bundles. The two bundle types exhibited divergent responses to urban development pressures. As demonstrated by Turner et al. [63] and Zhao et al. [14], the UDB under economic expansion shows spatial encroachment on APB, fundamentally manifesting land-use conflicts. Consequently, it is imperative to strictly demarcate development boundaries within the UDB, coordinate urban–rural spatial configurations, and rigorously implement the cultivated land requisition–compensation balance policy to prevent disorderly urban expansion from encroaching on agricultural production [64]. Additionally, pursuing intensive land utilization strategies within these delineated boundaries is essential [61]. In APB, implementing appropriate agricultural management practices while maintaining the cultivated land area is crucial, and the aim of this is to mitigate the negative impacts, such as water and soil contamination, associated with farming activities [19,65]. Concurrently, these measures should actively contribute to the development of small eco-clean watersheds through integrated land–water management approaches [66,67].
In contrast to the general patterns observed in ecosystem service bundle identification, this study area has developed the ETB, predominantly distributed across hilly terrain [19,61]. While the forest coverage rate in these hilly areas was notably higher than that of UDB and APB in the central basin, their relatively low elevation makes them vulnerable to human activities. At the same time, the steep slopes of farmland in the region have exacerbated soil erosion and caused problems such as habitat patch fragmentation, which has affected the provision of regulation and support services. Nevertheless, this study suggests that this bundle has potential for ecological restoration in the future. After 2002, the Gannan region was integrated into the national Grain-for-Green Program and soil and water conservation project. The project significantly increased the forest coverage after 2010, prompting 38% of the ETB to undergo positive ecological succession and transform into an EPB, indicating that large-scale restoration has significantly improved the ecological quality of this region. Considering the region’s proximity to urban areas, the bundle needs to manage the impact of sloping farmland on soil erosion to approach the EPB with more prominent regulation and support services. Following China’s Grain-for-Green Program guidelines, agricultural lands with gradients of 15–25° within this zone can be prioritized for conversion to forests or grasslands [46]. Furthermore, implementing an ecological conservation compensation strategy can incentivize residents’ voluntary stewardship of ecological resources, thereby enhancing the efficacy of landscape-scale sustainability transitions [68].

5. Conclusions

This study investigated the historical dynamics of ESs and ESBs in Gannan region at the grid scale while analyzing the impacts of socioeconomic and natural factors. The results revealed significant spatio-temporal heterogeneity in ecosystem services over the past three decades. MQ, SC, and CS displayed a “high-periphery, low-core” configuration and demonstrated marked increases. FP demonstrated concentrated high-value zones in central and basin areas, accompanied by a slight increase in production output, while WY showed a pronounced decline, particularly in mountainous peripheral regions where low-value areas dominate. Regional ecological restoration projects significantly enhanced synergistic relationships among ESs, particularly between MQ, CS, and SC. Conversely, trade-off relationships between FP and both supporting services (MQ) and regulating services (SC, CS) remained relatively stable. Four ESBs were identified at the grid scale, and their transitions are mainly driven by urban expansion and ecological restoration, while climatic uncertainty introduced complexity to ESs and ESBs dynamics. Under such complex driving forces, ETB has undergone a significant shift towards EPB, with frequent transitions occurring between UDB and APB. For future ecosystem zoning management, this study proposes prioritizing both ETB and EPB as key protected areas. Within EPB, construction activities and productive disturbances should be strictly prohibited to stabilize ecological restoration outcomes. In ETB, slope farmland management must be implemented to mitigate soil erosion impacts, coupled with eco-compensation strategies to further motivate residents’ autonomous conservation initiatives. Additionally, strict enforcement of urban growth boundary controls is essential to prevent encroachment on agricultural spaces, thereby ensuring the coordinated and sustainable development of ecosystems. Our findings demonstrate that relationships among ecosystem services have become more intricate under large-scale restoration. We emphasize that conducting historical analyses of ES interrelationships and service bundle distributions is essential for regions implementing large-scale ecological restoration to ensure ecosystem sustainability.

Author Contributions

Conceptualization, G.Z. and C.W.; methodology, C.W. and G.Z.; software, J.Z.; validation, G.Z., C.W. and J.Z.; investigation, G.Z.; resources, C.W., Y.L. and C.T.; data curation, G.Z.; writing—original draft preparation, G.Z.; writing—review and editing, C.W., Y.L. and L.Y.; visualization, C.W., L.Y. and J.Z.; project administration, C.T.; funding acquisition, C.T. All authors have read and agreed to the published version of the manuscript.

Funding

This study was funded by the Jiangxi “Science + Water Conservancy” Joint Program Project (2022KSG01010).

Data Availability Statement

Data are contained within the article.

Conflicts of Interest

The authors declare no conflicts of interest.

References

  1. Daily, G.C. Nature’s Services: Societal Dependence on Natural Ecosystems (1997). In The Future of Nature; Libby, R., Sverker, S., Paul, W., Eds.; Yale University Press: New Haven, CT, USA, 2013; pp. 454–464. [Google Scholar] [CrossRef]
  2. Millennium Ecosystem Assessment. Ecosystems and Human Well-Being; Island Press: Washington, DC, USA, 2005. [Google Scholar]
  3. Costanza, R.; d’Arge, R.; de Groot, R.; Farber, S.; Grasso, M.; Hannon, B.; Limburg, K.; Naeem, S.; O’Neill, R.V.; Paruelo, J.; et al. The Value of the World’s Ecosystem Services and Natural Capital. Nature 1997, 387, 253–260. [Google Scholar] [CrossRef]
  4. Mooney, H.; Larigauderie, A.; Cesario, M.; Elmquist, T.; Hoegh-Guldberg, O.; Lavorel, S.; Mace, G.M.; Palmer, M.; Scholes, R.; Yahara, T. Biodiversity, Climate Change, and Ecosystem Services. Curr. Opin. Environ. Sustain. 2009, 1, 46–54. [Google Scholar] [CrossRef]
  5. Ouyang, Z.; Zheng, H.; Xiao, Y.; Polasky, S.; Liu, J.; Xu, W.; Wang, Q.; Zhang, L.; Xiao, Y.; Rao, E.M.; et al. Improvements in Ecosystem Services from Investments in Natural Capital. Science 2016, 352, 1455–1459. [Google Scholar] [CrossRef]
  6. Foley, J.A.; DeFries, R.; Asner, G.P.; Barford, C.; Bonan, G.; Carpenter, S.R.; Chapin, F.S.; Coe, M.T.; Daily, G.C.; Gibbs, H.K.; et al. Global Consequences of Land Use. Science 2005, 309, 570–574. [Google Scholar] [CrossRef] [PubMed]
  7. Beaumont, N.J.; Aanesen, M.; Austen, M.C.; Börger, T.; Clark, J.R.; Cole, M.; Hooper, T.; Lindeque, P.K.; Pasco, C.; Wyles, K.J. Global Ecological, Social and Economic Impacts of Marine Plastic. Mar. Pollut. Bull. 2019, 142, 189–195. [Google Scholar] [CrossRef]
  8. Liu, Y.; Hou, X.; Li, X.; Song, B.; Wang, C. Assessing and Predicting Changes in Ecosystem Service Values Based on Land Use/Cover Change in the Bohai Rim Coastal Zone. Ecol. Indic. 2020, 111, 106004. [Google Scholar] [CrossRef]
  9. Zoderer, B.M.; Tasser, E.; Carver, S.; Tappeiner, U. Stakeholder Perspectives on Ecosystem Service Supply and Ecosystem Service Demand Bundles. Ecosyst. Serv. 2019, 37, 100938. [Google Scholar] [CrossRef]
  10. Bennett, E.M.; Peterson, G.D.; Gordon, L.J. Understanding Relationships among Multiple Ecosystem Services. Ecol. Lett. 2009, 12, 1394–1404. [Google Scholar] [CrossRef]
  11. Rodríguez, J.P.; Beard, T.D.; Bennett, E.M.; Cumming, G.S.; Cork, S.J.; Agard, J.; Dobson, A.P.; Peterson, G.D. Trade-Offs across Space, Time, and Ecosystem Services. Ecol. Soc. 2006, 11, 28. [Google Scholar] [CrossRef]
  12. Wu, J.X.; Zhao, Y.; Yu, C.Q.; Luo, L.M.; Pan, Y. Land Management Influences Trade-Offs and the Total Supply of Ecosystem Services in Alpine Grassland in Tibet, China. J. Environ. Manag. 2017, 193, 70–78. [Google Scholar] [CrossRef]
  13. Qiu, J.; Carpenter, S.R.; Booth, E.G.; Motew, M.; Zipper, S.C.; Kucharik, C.J.; Loheide Ii, S.P.; Turner, M.G. Understanding Relationships among Ecosystem Services across Spatial Scales and over Time. Environ. Res. Lett. 2018, 13, 054020. [Google Scholar] [CrossRef]
  14. Li, C.; Zhao, J.; Yang, W. Investigating Ecosystem Service Trade-Offs/Synergies and Their Influencing Factors: A Case Study in the Yangtze River Delta Region of China. Land 2021, 11, 106. [Google Scholar] [CrossRef]
  15. Sun, Y.J.; Li, J.; Liu, X.F.; Ren, Z.Y.; Zhou, Z.X.; Duan, Y.F. Spatially Explicit Analysis of Trade-Offs and Synergies among Multiple Ecosystem Services in Shaanxi Valley Basins. Forests 2020, 11, 209. [Google Scholar] [CrossRef]
  16. White, C.; Halpern, B.S.; Kappel, C.V. Ecosystem Service Tradeoff Analysis Reveals the Value of Marine Spatial Planning for Multiple Ocean Uses. Proc. Natl. Acad. Sci. USA 2012, 109, 4696–4701. [Google Scholar] [CrossRef] [PubMed]
  17. Raudsepp-Hearne, C.; Peterson, G.D.; Bennett, E.M. Ecosystem Service Bundles for Analyzing Tradeoffs in Diverse Landscapes. Proc. Natl. Acad. Sci. USA 2010, 107, 5242–5247. [Google Scholar] [CrossRef] [PubMed]
  18. Gao, M.; Li, C.; Zhao, H. Spatiotemporal Pattern of Supply-Demand of Ecosystem Services and Influencing Factors in Jiangsu Province. Res. Soil Water Conserv. 2023, 30, 315–324. [Google Scholar] [CrossRef]
  19. Kong, L.; Zheng, H.; Xiao, Y.; Ouyang, Z.; Li, C.; Zhang, J.; Huang, B. Mapping Ecosystem Service Bundles to Detect Distinct Types of Multifunctionality within the Diverse Landscape of the Yangtze River Basin, China. Sustainability 2018, 10, 857. [Google Scholar] [CrossRef]
  20. Spake, R.; Lasseur, R.; Crouzat, E.; Bullock, J.M.; Lavorel, S.; Parks, K.E.; Schaafsma, M.; Bennett, E.M.; Maes, J.; Mulligan, M.; et al. Unpacking Ecosystem Service Bundles: Towards Predictive Mapping of Synergies and Trade-Offs between Ecosystem Services. Glob. Environ. Change 2017, 47, 37–50. [Google Scholar] [CrossRef]
  21. Dou, H.; Li, X.; Li, S.; Dang, D.; Li, X.; Lyu, X.; Li, M.; Liu, S. Mapping Ecosystem Services Bundles for Analyzing Spatial trade-Offs in Inner Mongolia, China. J. Clean. Prod. 2020, 256, 120444. [Google Scholar] [CrossRef]
  22. Shao, Y.; Liu, Y.; Li, Y.; Yuan, X. Regional Ecosystem Services Relationships and Their Potential Driving Factors in the Yellow River Basin, China. J. Geogr. Sci. 2023, 33, 863–884. [Google Scholar] [CrossRef]
  23. Jia, X.; Shao, M.; Zhu, Y.; Luo, Y. Soil Moisture Decline Due to Afforestation across the Loess Plateau, China. J. Hydrol. 2017, 546, 113–122. [Google Scholar] [CrossRef]
  24. Lv, Y.; Zhang, L.; Li, P.; He, H.; Ren, X.; Zhang, M. Ecological Restoration Projects Enhanced Terrestrial Carbon Sequestration in the Karst Region of Southwest China. Front. Ecol. Evol. 2023, 11, 1179608. [Google Scholar] [CrossRef]
  25. Wang, J.; Peng, J.; Zhao, M.; Liu, Y.; Chen, Y. Significant Trade-Off for the Impact of Grain-for-Green Programme on Ecosystem Services in North-Western Yunnan, China. ScTEn 2017, 574, 57–64. [Google Scholar] [CrossRef] [PubMed]
  26. Lyu, F.; Tang, J.; Olhnuud, A.; Hao, F.; Gong, C. The Impact of Large-Scale Ecological Restoration Projects on Trade-Offs/Synergies and Clusters of Ecosystem Services. J. Environ. Manag. 2024, 365, 121591. [Google Scholar] [CrossRef] [PubMed]
  27. Mo, M.; Xie, S.; Nie, X.; Hu, S. Research on Patterns of Soil and Water Loss Comprehensive Harness in Red Soil Region of Southern China—A Case Study in Jiangxi Province. Bull. Soil Water Conserv. 2019, 39, 207–213. [Google Scholar] [CrossRef]
  28. Li, Q.; Nie, X.; Xie, S.; Hu, Q.; Mo, M. Suitability Evaluation of Comprehensive Control Model of Soil and Water Loss in Southern Jiangxi Province Based on the Balance of Ecological and Production Functions. Res. Soil Water Conserv. 2022, 29, 54–61,74. [Google Scholar] [CrossRef]
  29. Li, Z.W.; Ning, K.; Chen, J.; Liu, C.; Wang, D.Y.; Nie, X.D.; Hu, X.Q.; Wang, L.X.; Wang, T.W. Soil and Water Conservation Effects Driven by the Implementation of Ecological Restoration Projects: Evidence from the Red Soil Hilly Region of China in the Last Three Decades. J. Clean. Prod. 2020, 260, 121109. [Google Scholar] [CrossRef]
  30. Xu, N.; Guo, L.; Xue, D.; Sun, S. Land Use Structure and the Dynamic Evolution of Ecosystem Service Value in Gannan Region, China. Acta Ecol. Sin. 2019, 39, 1969–1978. [Google Scholar] [CrossRef]
  31. Minghao, M.O.; Jie, Y.; Fang, S.; Yuejun, S.; Bangwen, W. Benefits Evaluation of Ecological Project in Southern Jiangxi Province During Past 30 Years. Bull. Soil Water Conserv. 2011, 31, 172–176. [Google Scholar]
  32. Haines-Young, R.; Potschin-Young, M.B. Revision of the Common International Classification for Ecosystem Services (Cices V5.1): A Policy Brief. One Ecosyst. 2018, 3, e27108. [Google Scholar] [CrossRef]
  33. Budyko, M.I. The Heat Balance of the Earth’s Surface. Sov. Geogr. 2014, 2, 3–13. [Google Scholar] [CrossRef]
  34. Zhu, W.Q.; Pan, Y.Z.; Zhang, J.S. Estimation of Net Primary Productivity of Chinese Terrestrial Vegetation Based on Remote Sensing. Acta Phytoecol. Sin. 2007, 31, 413–424. [Google Scholar] [CrossRef]
  35. Renard, K.G. Predicting Soil Erosion by Water: A Guide to Conservation Planning with the Revised Universal Soil Loss Equation (RUSLE); US Department of Agriculture, Agricultural Research Service: Washington, DC, USA, 1997. [CrossRef]
  36. Zhang, W.; Xie, Y.; Liu, B. Rainfall Erosivity Estimation Using Daily Rainfall Amounts. Sci. Geogr. Sin. 2002, 22, 705–711. [Google Scholar] [CrossRef]
  37. Ma, R.; Lü, Y.; Fu, B.; Lü, D.; Wu, X.; Sun, S.; Zhang, Y. A Modified Habitat Quality Model to Incorporate the Effects of Ecological Restoration. Environ. Res. Lett. 2022, 17, 104029. [Google Scholar] [CrossRef]
  38. Li, B.; Chen, N.; Wang, Y.; Wang, W. Spatio-Temporal Quantification of the Trade-Offs and Synergies among Ecosystem Services Based on Grid-Cells: A Case Study of Guanzhong Basin, Nw China. Ecol. Indic. 2018, 94, 246–253. [Google Scholar] [CrossRef]
  39. Saidi, N.; Spray, C. Ecosystem Services Bundles: Challenges and Opportunities for Implementation and Further Research. Environ. Res. Lett. 2018, 13, 113001. [Google Scholar] [CrossRef]
  40. Song, Y.; Liao, K.; Yang, J.; Zuo, J.; Xiao, L. Temporal and Spatial Variation of Vegetation Cover and Its Water and Soil Conservation Driving in Tangbei River Watershed. J. Water Resour. Water Eng. 2017, 28, 24–31. [Google Scholar]
  41. Hu, H.; Mo, M.; Nie, X.F. Control Effects of Plants Measures and Engineering Measures of Soil and Water Conservation of South Jiangxi Province. Soil Water Conserv. China 2019, 40, 28–30+69. [Google Scholar] [CrossRef]
  42. Luo, C.; Du, S.; Zheng, B.; Xie, Z.; Wu, Z.; Zhu, J. Temporal and Spatial Change Characteristics of Soil Conservation Function in Sourthern Jiangxi Province. Bull. Soil Water Conserv. 2022, 42, 57–65. [Google Scholar] [CrossRef]
  43. Qiu, S.; Fang, M.; Yu, Q.; Niu, T.; Liu, H.; Wang, F.; Xu, C.; Ai, M.; Zhang, J. Study of Spatial temporal Changes in Chinese Forest Eco-Space and Optimization Strategies for Enhancing Carbon Sequestration Capacity through Ecological Spatial Network Theory. ScTEn 2023, 859, 160035. [Google Scholar] [CrossRef]
  44. Zhang, B.-j.; Zhang, G.-h.; Yang, H.-y.; Zhu, P.-z. Temporal Variation in Soil Erosion Resistance of Steep Slopes Restored with Different Vegetation Communities on the Chinese Loess Plateau. Catena 2019, 182, 104170. [Google Scholar] [CrossRef]
  45. Tian, F.; Lü, Y.H.; Fu, B.J.; Yang, Y.H.; Qiu, G.; Zang, C.; Zhang, L. Effects of Ecological Engineering on Water Balance under Two Different Vegetation Scenarios in the Qilian Mountain, Northwestern China. J. Hydrol. Reg. Stud. 2016, 5, 324–335. [Google Scholar] [CrossRef]
  46. Su, C.; Fu, B. Evolution of Ecosystem Services in the Chinese Loess Plateau under Climatic and Land Use Changes. Glob. Planet. Chang. 2013, 101, 119–128. [Google Scholar] [CrossRef]
  47. Wang, Y.; Dai, E. Spatial-Temporal Changes in Ecosystem Services and the Trade-Off Relationship in Mountain Regions: A Case Study of Hengduan Mountain Region in Southwest China. J. Clean. Prod. 2020, 264, 121573. [Google Scholar] [CrossRef]
  48. Liao, Q.; Li, T.; Wang, Q.; Liu, D. Exploring the Ecosystem Services Bundles and Influencing Drivers at Different Scales in Southern Jiangxi, China. Ecol. Indic. 2023, 148, 110089. [Google Scholar] [CrossRef]
  49. Zhou, J.; Cai, M.; Guo, F.; Huang, Z.; Zhai, J. Spatiotemporal Characteristics of Soil Conservation and Protection Vacancies at Ganzhou City of Jiangxi Province. Bull. Soil Water Conserv. 2023, 43, 413–420. [Google Scholar] [CrossRef]
  50. Han, P.; Yang, G.; Wang, Z.; Liu, Y.; Chen, X.; Zhang, W.; Zhang, Z.; Wen, Z.; Shi, H.; Lin, Z.; et al. Driving Factors and Trade-Offs/Synergies Analysis of the Spatiotemporal Changes of Multiple Ecosystem Services in the Han River Basin, China. Remote Sens. 2024, 16, 2115. [Google Scholar] [CrossRef]
  51. Gou, M.; Li, L.; Ouyang, S.; Wang, N.; La, L.; Liu, C.; Xiao, W. Identifying and Analyzing Ecosystem Service Bundles and Their Socioecological Drivers in the Three Gorges Reservoir Area. J. Clean. Prod. 2021, 307, 127208. [Google Scholar] [CrossRef]
  52. Qiao, X.; Gu, Y.; Zou, C.; Xu, D.; Wang, L.; Ye, X.; Yang, Y.; Huang, X. Temporal Variation and Spatial Scale Dependency of the Trade-Offs and Synergies among Multiple Ecosystem Services in the Taihu Lake Basin of China. ScTEn 2019, 651, 218–229. [Google Scholar] [CrossRef] [PubMed]
  53. Tian, Y.C.; Wang, S.J.; Bai, X.Y.; Luo, G.J.; Xu, Y. Trade-Offs among Ecosystem Services in a Typical Karst Watershed, Sw China. ScTEn 2016, 566, 1297–1308. [Google Scholar] [CrossRef] [PubMed]
  54. Wang, A.; Wang, J.; Luan, B.; Zhang, M.; Wang, X.; Yu, P. Quantifying the Impact of Land Use Changes on Surface Runoff in the Loess Plateau Area of Northwest China by Swat. J. Environ. Manag. 2025, 377, 124641. [Google Scholar] [CrossRef]
  55. Jiang, C.; Zhang, H.; Zhang, Z. Spatially Explicit Assessment of Ecosystem Services in China’s Loess Plateau: Patterns, Interactions, Drivers, and Implications. Glob. Planet. Chang. 2018, 161, 41–52. [Google Scholar] [CrossRef]
  56. Liu, D.; Chen, Y.; Cai, W.; Dong, W.; Xiao, J.; Chen, J.; Zhang, H.; Xia, J.; Yuan, W. The Contribution of China’s Grain to Green Program to Carbon Sequestration. Landsc. Ecol. 2014, 29, 1675–1688. [Google Scholar] [CrossRef]
  57. Liu, L.; Zhang, H.; Gao, Y.; Zhu, W.; Liu, X.; Xu, Q. Hotspot Identification and Interaction Analyses of the Provisioning of Multiple Ecosystem Services: Case Study of Shaanxi Province, China. Ecol. Indic. 2019, 107, 105566. [Google Scholar] [CrossRef]
  58. Luo, Y.; Lü, Y.; Fu, B.; Zhang, Q.; Li, T.; Hu, W.; Comber, A. Half Century Change of Interactions among Ecosystem Services Driven by Ecological Restoration: Quantification and Policy Implications at a Watershed Scale in the Chinese Loess Plateau. ScTEn 2019, 651, 2546–2557. [Google Scholar] [CrossRef] [PubMed]
  59. Shen, J.; Li, S.; Liu, L.; Liang, Z.; Wang, Y.; Wang, H.; Wu, S. Uncovering the Relationships between Ecosystem Services and Social-Ecological Drivers at Different Spatial Scales in the Beijing-Tianjin-Hebei Region. J. Clean. Prod. 2021, 290, 125193. [Google Scholar] [CrossRef]
  60. Sun, Y.; Ye, C.; Wang, X.; Huang, Q.; Xia, Y.; Cheng, Y.; Zhong, Y. Investigation and Analysis on the Present Situation of Soil Erosion in Gannan Navel Orange Orchard. Res. Soil Water Conserv. 2014, 21, 67–71. [Google Scholar] [CrossRef]
  61. Huang, S.; Wang, Y.; Liu, R.; Jiang, Y.; Qie, L.; Pu, L. Identification of Land Use Function Bundles and Their Spatio-temporal Trade-Offs/Synergies: A Case Study in Jiangsu Coast, China. Land 2022, 11, 286. [Google Scholar] [CrossRef]
  62. Lorilla, R.S.; Poirazidis, K.; Kalogirou, S.; Detsis, V.; Martinis, A. Assessment of the Spatial Dynamics and Interactions among Multiple Ecosystem Services to Promote Effective Policy Making across Mediterranean Island Landscapes. Sustainability 2018, 10, 3285. [Google Scholar] [CrossRef]
  63. Turner, K.G.; Odgaard, M.V.; Bøcher, P.K.; Dalgaard, T.; Svenning, J.-C. Bundling Ecosystem Services in Denmark: Trade-Offs and Synergies in a Cultural Landscape. Landsc. Urban Plan. 2014, 125, 89–104. [Google Scholar] [CrossRef]
  64. Song, W.; Deng, X. Land-Use/Land-Cover Change and Ecosystem Service Provision in China. ScTEn 2017, 576, 705–719. [Google Scholar] [CrossRef] [PubMed]
  65. Wang, H.; Qin, L.; Huang, L.; Zhang, L. Ecological Agriculture in China: Principles and Applications. In Advances in Agronomy; Sparks, D.L., Ed.; Academic Press: Cambridge, MA, USA, 2007; Volume 94, pp. 181–208. [Google Scholar] [CrossRef]
  66. Fučík, P.; Hejduk, T.; Peterková, J. Quantifying Water Pollution Sources in a Small Tile-Drained Agricultural Watershed. CLEAN Soil Air Water 2015, 43, 698–709. [Google Scholar] [CrossRef]
  67. Sun, Y.; Hao, R.; Qiao, J.; Xue, H. Function Zoning and Spatial Management of Small Watersheds Based on Ecosystem Disservice Bundles. J. Clean. Prod. 2020, 255, 120285. [Google Scholar] [CrossRef]
  68. Huang, A.; Xu, Y.; Sun, P.; Zhou, G.; Liu, C.; Lu, L.; Xiang, Y.; Wang, H. Land Use/Land Cover Changes and Its Impact on Ecosystem Services in Ecologically Fragile Zone: A Case Study of Zhangjiakou City, Hebei Province, China. Ecol. Indic. 2019, 104, 604–614. [Google Scholar] [CrossRef]
Figure 1. Geographical location (a), elevation (b), and land use type (c) of the Gannan region in 2020.
Forests 16 01263 g001
Figure 2. Spatio-temporal variation in the five ESs from 1990 to 2020. WY: water yield; CS: carbon sequestration; SC: soil conservation; FP: food production; MQ: modified habitat quality.
Forests 16 01263 g002
Figure 3. Trade-offs and synergies among ecosystem services from 1990 to 2020. The red and green colors represent positive correlations (i.e., synergies) and negative correlations (i.e., trade-offs), respectively, and the varying color depths indicate the strength of correlation. The upper right part of each panel shows the correlation coefficient value. The lower left part of each panel shows the correlation strength (the darker the color, the stronger the correlation). The asterisks (*) denote the significance level of the correlation: *** for p < 0.001, high significance; ** for p < 0.01, significance; * for p < 0.05, statistical difference.
Forests 16 01263 g003
Figure 4. Spatial distribution of ecosystem service bundles in the Gannan region over time. ETB: eco-agricultural transition bundle; APB: agricultural production bundle; UDB: urban development bundle; EPB: ecological protection bundle.
Forests 16 01263 g004
Figure 5. Flower diagrams specifying the average value (0–1) of each ecosystem service in each bundle.
Forests 16 01263 g005
Figure 6. Chord diagram of ecosystem service bundles transfer. The numerical values along the circumference represent the area proportion (%) of each bundle. The connecting lines between bundles indicate mutual conversion relationships. The color of each line corresponds to the color of the cluster receiving the predominant inflow, denoting the net flow direction of the area.
Forests 16 01263 g006
Figure 7. Biplots of the first two axes in a redundancy analysis illustrate the relationship between ecosystem services (orange arrows) and socioecological drivers (blue arrows) for each time step. Four points in each plot represent ecosystem service bundles. Twi: topographic wetness index; Slop: slope; Pop: population density; GDP: gross domestic product; Pre: annual precipitation; AMT: mean annual temperature; Forest: forest land ratio.
Forests 16 01263 g007
Table 1. The datasets used in this study.
DatasetTypeData SourceSpatial Resolution
Land use typeRasterResource and Environmental Science Data Center, Chinese Academy of Sciences (https://www.resdc.cn/)
(accessed on 21 June 2025)
30 m
NDVIRasterResource and Environmental Science Data Center, Chinese Academy of Sciences (https://www.resdc.cn/)
(accessed on 21 June 2025)
1 km
GDPRasterResource and Environmental Science Data Center, Chinese Academy of Sciences (https://www.resdc.cn/)
(accessed on 21 June 2025)
1 km
PrecipitationRasterNational Earth System Science Data Center, China (https://data.cma.cn/)
(accessed on 21 June 2025)
1 km
TemperatureRasterNational Earth System Science Data Center, China (https://data.cma.cn/)
(accessed on 21 June 2025)
1 km
EvapotranspirationRasterNational Earth System Science Data Center, China (https://data.cma.cn/)
(accessed on 21 June 2025)
1 km
Extraterrestrial Solar
Radiation
RasterNational Tibetan Plateau Data Center (https://data.tpdc.ac.cn)
(accessed on 21 June 2025)
0.5 degree
Grain productionExcelNational Bureau of Statistics (https://data.stats.gov.cn/)
(accessed on 26 July 2025)
\
Soil propertiesRasterHarmonized World Soil Database (HWSD_China_Subset_v1.1)1 km
Table 2. The average values or total values of ecosystem services in the Gannan from 1990 to 2020.
Indicators of Ecosystem Services1990200020102020
Water yield
(mm)
834.52803.64670.65638.43
Food production
(t)
2.37 × 1062.38 × 1062.40 × 1062.58 × 106
Carbon sequestration
(g C/m2)
1154.911299.531324.791330.12
Soil conservation
(t)
2.44 × 1092.54 × 1092.87 × 1092.92 × 109
Modified habitat quality0.370.450.440.54
Disclaimer/Publisher’s Note: The statements, opinions and data contained in all publications are solely those of the individual author(s) and contributor(s) and not of MDPI and/or the editor(s). MDPI and/or the editor(s) disclaim responsibility for any injury to people or property resulting from any ideas, methods, instructions or products referred to in the content.

