Article

Dendrometer-Based Analysis of Intra-Annual Growth and Water Status in Two Pine Species in a Mediterranean Forest Stand Under a Semi-Arid Climate

by
Mehmet S. Özçelik
Department of Forest Engineering, Faculty of Forestry, Isparta University of Applied Sciences, Isparta 32260, Türkiye
Forests 2025, 16(8), 1229; https://doi.org/10.3390/f16081229
Submission received: 1 July 2025 / Revised: 23 July 2025 / Accepted: 24 July 2025 / Published: 26 July 2025
(This article belongs to the Section Forest Ecophysiology and Biology)

Abstract

Stem radius growth (GRO), tree water deficit (TWD), and maximum daily shrinkage (MDS) were monitored throughout 2023 in a semi-arid Mediterranean forest stand in Burdur, Türkiye, where Pinus nigra subsp. pallasiana (Lamb.) Holmboe and Pinus brutia Ten. naturally co-occur. These indicators, derived from electronic band dendrometers, were analyzed in relation to key climatic variables. Results indicated that P. brutia had a longer growth period, while P. nigra exhibited a higher average daily increment under the environmental conditions of 2023 at the study site. Annual stem growth was nearly equal for both species. Based on dendrometer observations, P. brutia exhibited lower normalized TWD and higher normalized MDS values under varying vapor pressure deficit (VPD) and soil water potential (SWP) conditions. A linear mixed-effects model further confirmed that P. brutia consistently maintained lower TWD than P. nigra across a wide climatic range, suggesting a comparatively lower degree of drought-induced water stress. GRO was most influenced by air temperature and VPD, and negatively by SWP. TWD was strongly affected by both VPD and SWP, while MDS was primarily linked to minimum air temperature and VPD. Moreover, MDS in P. brutia appeared more sensitive to climate variability compared to P. nigra. Although drought limited stem growth in both species during the study year, the lower TWD and higher MDS observed in P. brutia may indicate distinct physiological strategies for coping with drought. These findings offer preliminary insights into interspecific differences in water regulation under the particular climatic conditions observed during the study year in this semi-arid Mediterranean ecosystem.

1. Introduction

Ongoing climate change is leading to increased temperatures and unpredictable fluctuations in precipitation that have a detrimental influence on the vitality and resilience of forests around the world, thereby threatening the vital services these ecosystems provide [1]. The Mediterranean Basin is among the regions expected to be most affected by ongoing climate change, warming faster than the global average [2,3]. In fact, a 1.4 °C increase in mean annual air temperature has already been recorded in the region over the past century, compared to a global average of about 1.1 °C [4]. This accelerated warming contributes to more frequent and intense droughts, increased evaporative demand, declining water availability, and greater vulnerability of forests and other ecosystems, especially in semi-arid areas.
Drought is the main factor limiting tree growth and affecting tree water balance in the Mediterranean region [5]. Reports have indicated that drought events are already forcing forest trees of Türkiye to their physical limits and have resulted in mass mortality in the eastern Mediterranean [6]. Thus, gaining insight into the species-specific dynamics between the growth and water balance of native forest tree species and climatic factors, especially in the Mediterranean region, is crucial for enhancing the formulation of management plans and ensuring the effective management of these forests moving forward.
Türkiye is home to five natural pine species, with Pinus brutia Ten. and Pinus nigra Arn. subsp. pallasiana (Lamb.) Holmboe being the most widespread and ecologically important, covering approximately 45% of the country’s forests [7]. Pinus brutia is a drought- tolerant but frost-sensitive and fast-growing species, considered as a typical eastern Mediterranean element of plant communities growing in Greece, Cyprus, Lebanon, Syria, Iraq, Iran and Türkiye [8,9]. It is distributed in the Mediterranean at altitudes of 0–1500 m, the Marmara (0–900 m) and the Black Sea Regions (0–600 m) in Türkiye, where the Mediterranean climate is dominant [10]. It establishes populations in regions where the average annual temperature is between 12 °C and 20 °C and average annual precipitation is between 400–2000 mm. However, optimum growth of P. brutia occurs in regions where average annual precipitation is 900–1000 mm or greater [8]. The species grows in colluvial, marl and flysch beds with intercalated sandy, silty and calcareous layers as well as cracked limestone bedrocks [11].
Pinus brutia reaches heights up to 35 m, with trunk diameters occasionally exceeding 1.5 m, especially in favorable lowland Mediterranean sites [9]. The bark is reddish-brown, exfoliating in irregular plates and becoming deeply fissured with age, and is moderately thick [9,12]. The needles are light green to dark green and soft and flexible, and typically measure between 10–18 cm in length, and stomata cover the whole surface of the leaves [9]. The species develops a broadly conical crown, which becomes more irregular and open as trees mature. The cones are ovoid-conical, 5–12 cm long, often serotinous and persistent for several years on the branches, thus enabling successful post-fire regeneration and colonization of disturbed habitats [8,9]. The root system of P. brutia is generally superficial and asymmetrical, especially under compacted or shallow soils [13]. This allows rapid exploitation of surface moisture following short and irregular rainfall events, although deeper and more vertically extensive roots can develop on fractured calcareous bedrock or colluvial soils with good infiltration [8,13]. These morphological features reflect the species’ adaptation to Mediterranean environments characterized by summer drought, frequent fires, and heterogeneous soil depth and texture.
Pinus nigra is not only a drought-tolerant, but also a cold- and heat-tolerant coniferous species widely distributed in Mediterranean Basin from Spain and Morocco to Türkiye [14]. This species occurs primarily from sea level along the Black Sea Coast, extending to elevations of 1400 m on the sea-facing slopes of the highly mountainous Northern Anatolia. Additionally, it can be found at altitudes of up to 2000 m on drier southern slopes in the Aegean and Marmara Regions, and between 1000 and 1800 m in the Mediterranean region [15]. Pinus nigra is capable of forming populations in areas where the average annual temperature ranges from 6 °C to 12 °C [16]. It naturally thrives in Central Anatolia, particularly in regions with an average annual precipitation of 400–500 mm. In contrast, it flourishes in locations where the annual precipitation exceeds 1000 mm in the Black Sea Region [15]. However, unlike P. brutia, P. nigra can also grow in mountainous areas where the minimum temperature drops to −30 °C [12]. It can grow on different bedrock types, including serpentine, but limestone is one of the bedrock types where it typically grows well [17].
Pinus nigra is a medium- to tall-sized conifer reaching heights of 20–30 m, with a straight, cylindrical trunk that can attain diameters of 80–100 cm under favorable conditions [15]. The bark is thick, gray to blackish, and deeply fissured, offering protection against fire and extreme temperatures [14,18]. The needles are in pairs and typically measure between 8–15 cm in length and 1–2 mm in diameter, and are finely serrated [14]. The crown is compact and conical, with dense foliage that enhances resistance to cold and drought. Cones are ovate, 4–8 cm long, and non-serotinous, maturing over two years and releasing seeds under normal weathering conditions [14]. Root development tends to be deep and symmetrical on soils with developed horizons, promoting access to subsurface moisture during droughts, although its root system may be restricted on shallow or compacted sites [15,19].
A useful method for monitoring the growth and water-balance responses of forest trees to changing environmental conditions with a high temporal resolution is using automated band dendrometers. The raw stem radius change (SRC) data obtained from electronic dendrometers can be detrended using the “zero growth concept” developed by Zweifel et al. [20], which enables the separation of two key physiological components: (a) tree water deficit (TWD) which reflects the reversible shrinkage of living stem tissues, primarily the inner bark (including phloem) and, to a lesser extent, the outer sapwood, caused by transpiration-induced water loss that cannot be fully replenished under conditions of limited soil water availability; (b) radial growth (GRO), representing irreversible stem expansion driven by the formation of new xylem and phloem cells through cambial activity, contributing to sapwood and bark development. In this concept, TWD represents the reversible shrinkage due to water loss. GRO refers to the irreversible, cumulative growth. The raw SRC data obtained from dendrometers is therefore the sum of GRO and TWD. TWD equals zero when tissues are fully hydrated, and GRO is only recorded during periods with no shrinkage.
TWD serves as a reliable proxy for drought-induced water stress in trees, reflecting reversible shrinkage and swelling processes driven by fluctuations in stem water content [20]. Similarly, maximum daily shrinkage (MDS), which measures the difference between maximum trunk diameter early in the morning and minimum trunk diameter in the afternoon, is frequently used to assess daily tree water status [21]. While MDS quantifies maximum stem shrinkage within a single day, TWD captures accumulated water deficits over prolonged drought periods [20,22]. Since plant water status is primarily governed by soil water availability and evaporative demand, higher accumulated TWD indicates a greater deviation from maximum stem tissue water capacity. In contrast, higher MDS reflects the ability of a tree to respond to evaporative demand by maximizing contraction and plasticity, facilitated by hydrated stem tissues [23].
Several geographically extensive studies in Türkiye have been undertaken to investigate the seasonal growth of P. nigra through the analysis of annual ring data, as well as its relationship with climatic variables, as previously reported by Köse et al. [24]. Additionally, research has been conducted to evaluate drought resistance of both P. nigra and P. brutia focusing on physiological parameters such as photosynthetic pigment levels, total soluble sugars and mid-day water potential [25,26]. Despite these studies, there remains a lack of research focusing on the diurnal changes in stem radius and tree water status, particularly in comparing P. nigra and P. brutia in Mediterranean Türkiye, and in exploring the relationship between these factors and climatic variables.
The purpose of this research was to examine potential variances in water relations (TWD and MDS) and radial stem growth (GRO) between P. brutia and P. nigra within a naturally occurring mixed stand under semi-arid conditions in the Southern Mediterranean region of Türkiye. The main focus of the research is to determine whether one of these two species is better suited to withstand a potential increase in the frequency and duration of dry periods in the study area.
It is hypothesized that species exhibiting a longer growth period may demonstrate a relative growth advantage under the specific environmental conditions of the study site. Furthermore, species capable of maintaining lower tree water deficit (TWD) levels during dry spells are expected to exhibit greater drought tolerance. Moreover, species that exhibit higher maximum daily shrinkage (MDS) during dry periods, reflecting sustained transpiration and carbon assimilation, may possess an enhanced capacity for drought adaptation.

2. Material and Methods

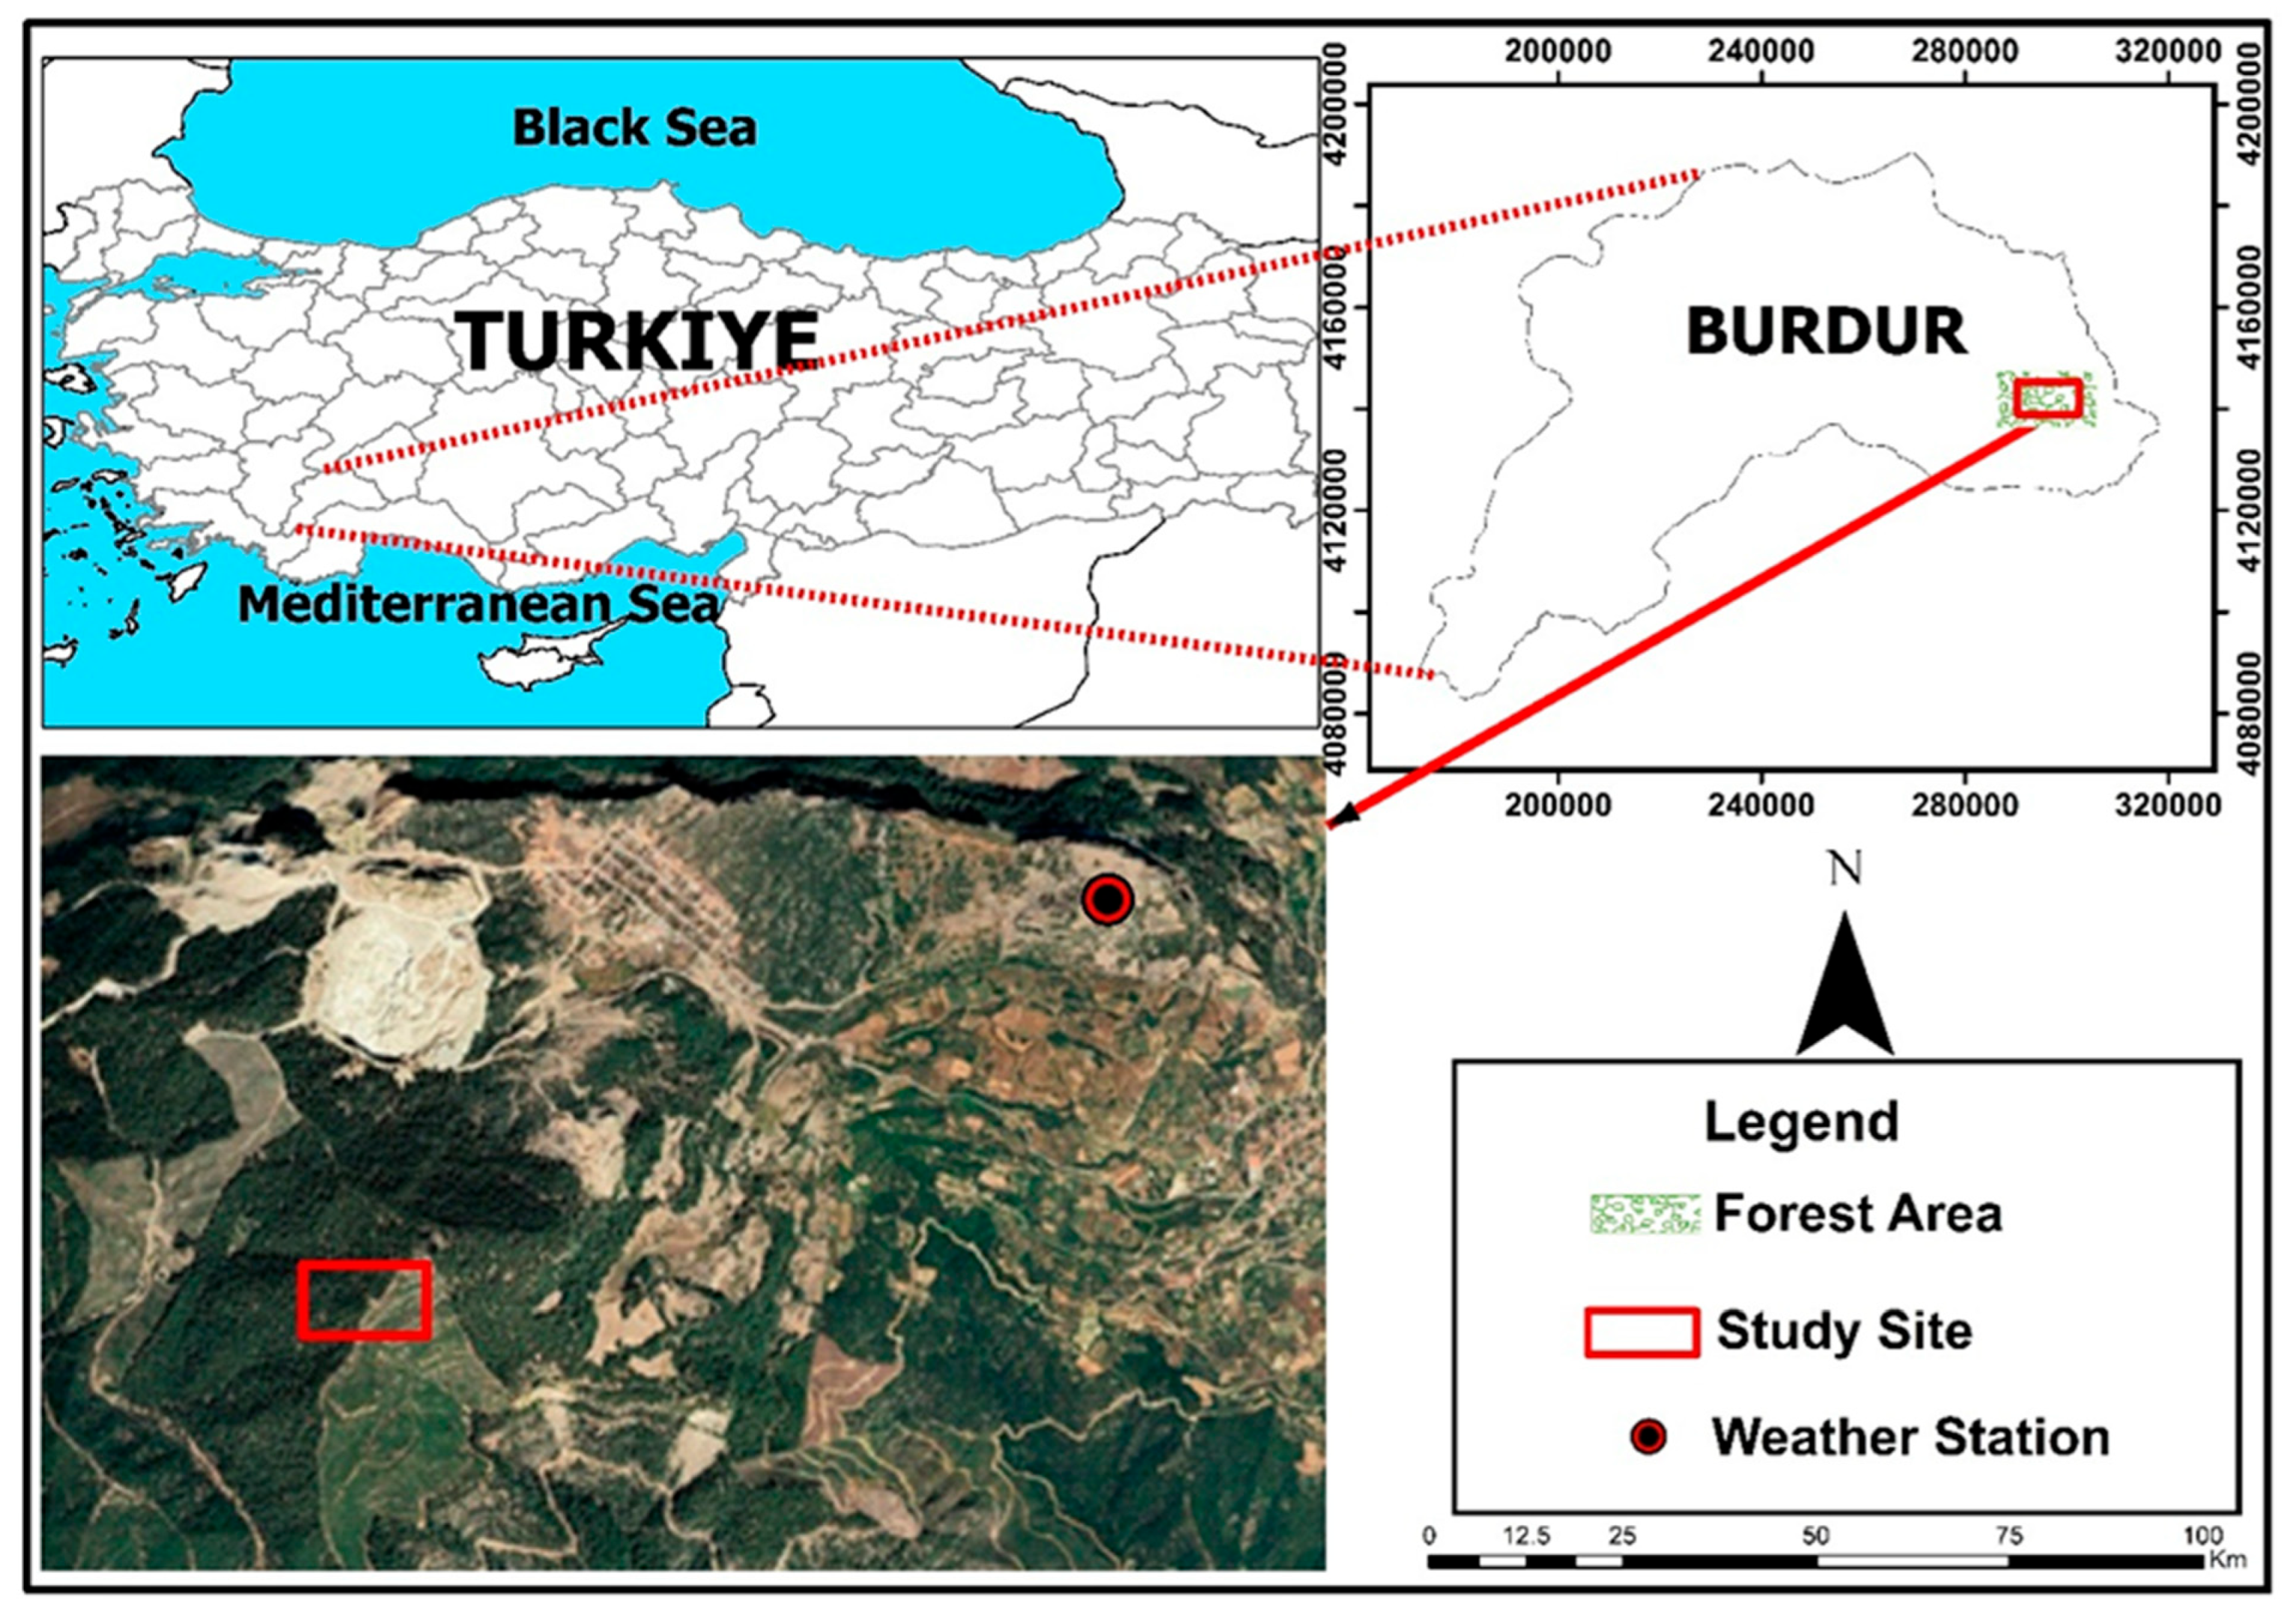
2.1. Location of the Study Site and Stand Characteristics

The study site is located in the Bucak/Burdur forest district in the southwestern Mediterranean region of Türkiye (37°28′52″ N, 30°39′49″ E; 1308 m a.s.l, Figure 1). The forest stand is a naturally regenerated, even-aged mixed stand that has been managed under the state forest regime. According to the most recent forest management plan (2020) for the study area, the stand contains approximately 259 trees ha−1, comprising 171 Pinus brutia and 88 Pinus nigra individuals. This corresponds to 66% P. brutia and 34% P. nigra in terms of tree numbers per hectare. In terms of basal area, the total is 28.61 m2 ha−1, of which P. brutia accounts for 73.3% and P. nigra for 26.7%. The total standing timber volume of the forest is 251,944 m3 ha−1, comprising 184,464 m3 of P. brutia and 67,480 m3 of P. nigra. The average slope in the study area is 20°, and it has a southwestern aspect.
The regional climate is classified as typical Mediterranean, with dry summers and mild, rainy winters, and it has semi-arid characteristics (C1) in the Thornthwaite climate classification index. According to the nearest meteorology station (in Burdur, 37°43′19.2″ N 30°17′38.3″ E, 950 m a.s.l) that provides 31 years (1993–2023) of climate data, the mean annual precipitation is 431 mm, and the mean annual temperature is 13.6 °C, in the area. July is the warmest month, with a mean temperature of 25.4 °C, and January is the coldest month, with a mean temperature of 2.6 °C. The mean annual air humidity is 56%. As only 10% of the annual precipitation (43 mm, average of 31 years between 1993–2023) falls between July and October, the summer months are extremely dry. The parent material in the area is Jurassic–Cretaceous neritic limestones and the dominant soil type of the research area is the red-brown Mediterranean soil, classified within the zonal group [27].
To observe seasonal stem radius change (SRC), a total of five Pinus nigra and four Pinus brutia individuals were selected from 800 m2 of area within a closed-canopy section of the forest stand. The sample trees were distributed across this area at approximate distances of 15–25 m from one another in both horizontal and vertical directions. All individuals were located in the interior of the stand, on a uniform slope, with no obvious gap openings, edge effects, or exposure-related differences. The selection process followed a two-step approach: first, candidate trees were screened based on consistent criteria, including healthy crowns, intact canopy structure, smooth trunks, similar DBH class, and absence of visible disease or damage. Then, from among these eligible trees, individuals were randomly selected to represent the local stand structure. This procedure aimed to minimize the influence of microsite variability and ensure ecological comparability among individuals. Despite the careful selection process, natural individual level varitation among individuals still existed. One Pinus brutia individual (Pb4) and one Pinus nigra individual (Pn3), for instance, exhibited greater stem radius increment during the late growing season. To minimize the potential influence of such deviations and to increase replication strength, SRC data obtained from individual trees were averaged at the species level (Figure 2). This approach allows for a clearer comparison of general species-level responses to climatic variation, while still acknowledging that some degree of inter-individual variability may be masked by this aggregation.
The age of the trees was determined at breast height (1.3 m) by extracting tree cores using an increment borer (Haglöf, Långsele, Sweden). Pinus nigra trees had an average diameter at breast height (DBH) of 46.2 ± 3.6 cm, an average height of 15.9 ± 1.1 m, and an average age of 87 ± 3.5 years. On the other hand, P. brutia trees had an average DBH of 52.5 ± 1.7 cm, an average height of 17 ± 1.4 m, and an average age of 78.5 ± 8.6 years. The characteristics of the sampled trees are summarized in Table 1.

2.2. Meteorological Observations

Data on air temperature (Tair, °C), air relative humidity (RH, %), precipitation (Pp, mm) and global radiation (GR, W m−2) were simultaneously collected by Minikin RTHi and Minikin ERi automated meteorological observation devices (EMS Brno, Brno, Czechia). These devices were positioned at a height of 2 m in an open area located approximately 3 km away from the study site (Figure 1). The data were gathered at 5 min intervals and later transformed into hourly and daily averages. Air vapor pressure deficit (VPD) was calculated based on air temperature and air relative humidity using the standard formula:
V P D = 0.611 × e x p 17.502 × T 240.97 + T × ( 1 R H 100 )
where VPD is air vapor pressure deficit (kPa), T is air temperature (°C) and RH is the air relative humidity (%).
Soil water potential (SWP, Ψ, bar) was measured at three depths (10, 25 and 50 cm) at two locations within the forest canopy at hourly intervals using three calibrated gypsum blocks per point (Delmhorst Inc., Montville, NJ, USA) and a Microlog SP3 data logger (EMS Brno, Brno, Czechia). The sensors used in this study had a working range of 0 to −15 bar, encompassing field capacity (−0.33 bar) and the permanent wilting point (−15 bar). Since these sensors cannot detect values lower than −15 bar, any measurements below this threshold were recorded as −15 and included in the analysis accordingly. The mean daily SWP was calculated by averaging readings from the six gypsum blocks.

2.3. Extraction of Stem Radial Increment and Tree Water Status from Dendrometer Data

SRC were monitored at 10 min intervals between 1 January and 15 November 2023, using automatic band dendrometers (DR 26C, EMS Brno, Czechia; accuracy < 1 µm) mounted at a height of 3 m around the tree stems in a horizontal position, i.e., perpendicular to the stem axis. The sensor installation is illustrated in Figure S1. Although the monitoring campaign was initiated in 2022, data loss occurred during the early part of the growing season, limiting the usability of that year’s records, and dendrometer records from June to December 2022 indicated stem shrinkage only, with no detectable radial increment (Figure S2). Consequently, this study focused on the complete 2023 dataset, which captured measurable growth in all trees and better represented the typical climate conditions of the study area based on long-term records.
Data were stored in the built-in datalogger of each dendrometer. Before installation, the outermost rhytidome layers were gently removed without damaging living tissue to minimize the influence of bark swelling and shrinking on measurements. The recorded 10 min intervals were converted to 1 h averages for further analysis.
Dendrometer data were examined for measurement artifacts exceeding 0.5 mm in stem circumference change within 30 min [28] using the Mini32 software (version 10.2.17.0) supplied by the manufacturer (EMS Brno, Brno, Czechia). Dendrometer-measured SRC reflects both irreversible stem increment due to cambial activity and cell expansion, as well as temporary changes in stem size caused by tree water deficit-induced shrinking and swelling. Therefore, raw dendrometer data were detrended to obtain three key parameters: (i) growth-induced stem expansion (GRO, mm) and its rate (GROrate, µm h−1), (ii) stem shrinkage due to tree water deficit (TWD, µm h−1) and (iii) maximum daily shrinkage (MDS, µm d−1). These parameters were derived based on the “zero growth concept,” [20] which defines TWD as the difference between the latest maximum stem radius and the present stem radius, while radial growth is recorded only when the current measurement exceeds the previous maximum. MDS is determined as the difference between the highest and lowest stem radius recorded within a day. TWD and growth parameters (GRO and GROrate) were extracted from raw dendrometer data using the “dendRoAnalyst” package in R version 4.3.1. [29], while MDS values were computed using Microsoft Excel version 2506 by calculating the difference between the highest and lowest daily dendrometer readings.
Since the magnitude of the absolute TWD and MDS values varies depending on factors such as tree diameter, bark thickness and bark elasticity, the TWD and MDS data were rescaled using a minimum–maximum normalization (Equation (2)) to make daily stem variations comparable among trees. As a result of this process, the TWD and MDS values ranged from 0 to 1.
X n o r m = X X m i n X m a x X m i n
where X denotes the variables (TWD or MDS), while Xnorm signifies the normalized variables. The terms Xmin and Xmax correspond to the minimum and maximum values of the variable observed throughout the measurement period, respectively.

2.4. Seasonal Growth Pattern Assessment

Among various sigmoidal models, the Gompertz equation is widely used for characterizing growth patterns due to its flexibility and asymmetrical form [30,31], making it well-suited for this study. A four-parameter Gompertz equation (Equation (3)) was utilized to ascertain the onset and cessation dates of radial growth for the P. nigra and P. brutia species, and to model the cumulative growth that occurred during this timeframe. Daily mean dendrometer values were utilized to characterize the entire seasonal growth pattern from April to October.
Y(t) = Y0 + A × exp [−exp (β − k × t)]
In Equation (3), Y represents the daily diameter measurements, A denotes the upper asymptote of the growth curve, β indicates the parameter for x-axis placement, k refers to the rate of change parameter, and t represents time measured in days. Therefore, the difference (A − Y0) reflects total seasonal growth, while the difference (Yt − Yt−1) illustrates daily growth. The Mini32 software (EMS Brno, Brno, Czechia) was used to model increment using the Gompertz equation. In the model selection process, parameters including standard error, degrees of freedom, and the correlation index (R) were considered among iterations. The onset and cessation of tree growth were defined as the 5th and 95th percentiles, respectively.

2.5. Statistical Analyses and Modeling

All further statistical analyses and modeling were conducted in R version 4.2.2. Spearman non-parametric correlation coefficients were calculated between climate factors i.e., Pp, Tair, RH, air VPD, GR, SWP, GRO, TWD and MDS to evaluate how environmental factors influence stem dynamics during the study period using the R version 4.3.1 package “correlation” [32]. The data were initially tested for normality by the Kolmogorov–Smirnov test (p < 0.05).
The long-term water status of plants is mainly influenced by evaporation demand and the availability of soil water [16]. Therefore, a linear mixed-effects model (LMM) was fitted to analyze the impact of a variety of SWP and VPD conditions on TWD by using the lmerTest R package [33] according to the equation:
Y = α + β1·SWP+β2·VPD + β3·Species + β4·(SWP × VPD) + β5·(SWP ×
Species) + β6·(VPD × Species) + β7·(SWP × VPD × Species) + a + ε
In the Equation (4) Y represents the dependent variable (Tree Water Deficit, TWD), while SWP (soil water potential), VPD (vapor pressure deficit), and species (P. nigra or P. brutia) are included as fixed effects. The model accounts for the main effects of these variables (β1–β3), as well as their two-way (β4–β6) and three-way (β7) interactions. The symbol α denotes the intercept, β1 through β7 are the fixed-effect coefficients, a represents the random effect associated with individual trees (n = 9), and ε is the residual error term. Model accuracy was determined by examining the coefficient of determination (both conditional and marginal R2), root mean square error (RMSE) and the Akaike information criterion (AIC).
Differences among spring and summer normalized TWD and normalized MDS values were compared with a Kruskal–Wallis test using the “dplyr” package in R 4.3.1. [34]. Further, post hoc analyses with Dunn’s test were conducted to determine the differences among the spring and summer TWD and MDS values (separately) of each species and each period (p < 0.01).

3. Results

3.1. Environmental Conditions During the Study Period

During the period between 1 January and 31 December 2023, the meteorological measurements taken in the study area showed that the air temperature varied between a minimum of −7.2 °C in February and a maximum of 33.4 °C in August (Figure 3f and Table 2). The average air temperature recorded was 13.3 °C. Total annual precipitation in the area was 481 mm; 267 mm (55%) of the total annual precipitation fell during the vegetation period (April to November). The period from July to October in the study area represents the driest season of the year, when 8.2 mm of rainfall was recorded (Figure 3d). The average RH and VPD in the study area were 63% and 0.79 kPa, respectively (Figure 3b,c and Table S2). The recorded values of meteorological variables in 2023 closely aligned with the long-term averages (Table 2). Accordingly, the climate conditions during the study year can be considered representative of typical regional climate conditions.
The average soil water potential value measured during the study period was −5.2 bar, within the plant available water limits (Table 2). The observation of soil water potential throughout the year revealed that there was an ample supply of water in the soil until July. Subsequently, between July and August, there was a significant decline in soil water potential. From August until the end of November, the soil water potential stabilized at −15 bar (Figure 3e).

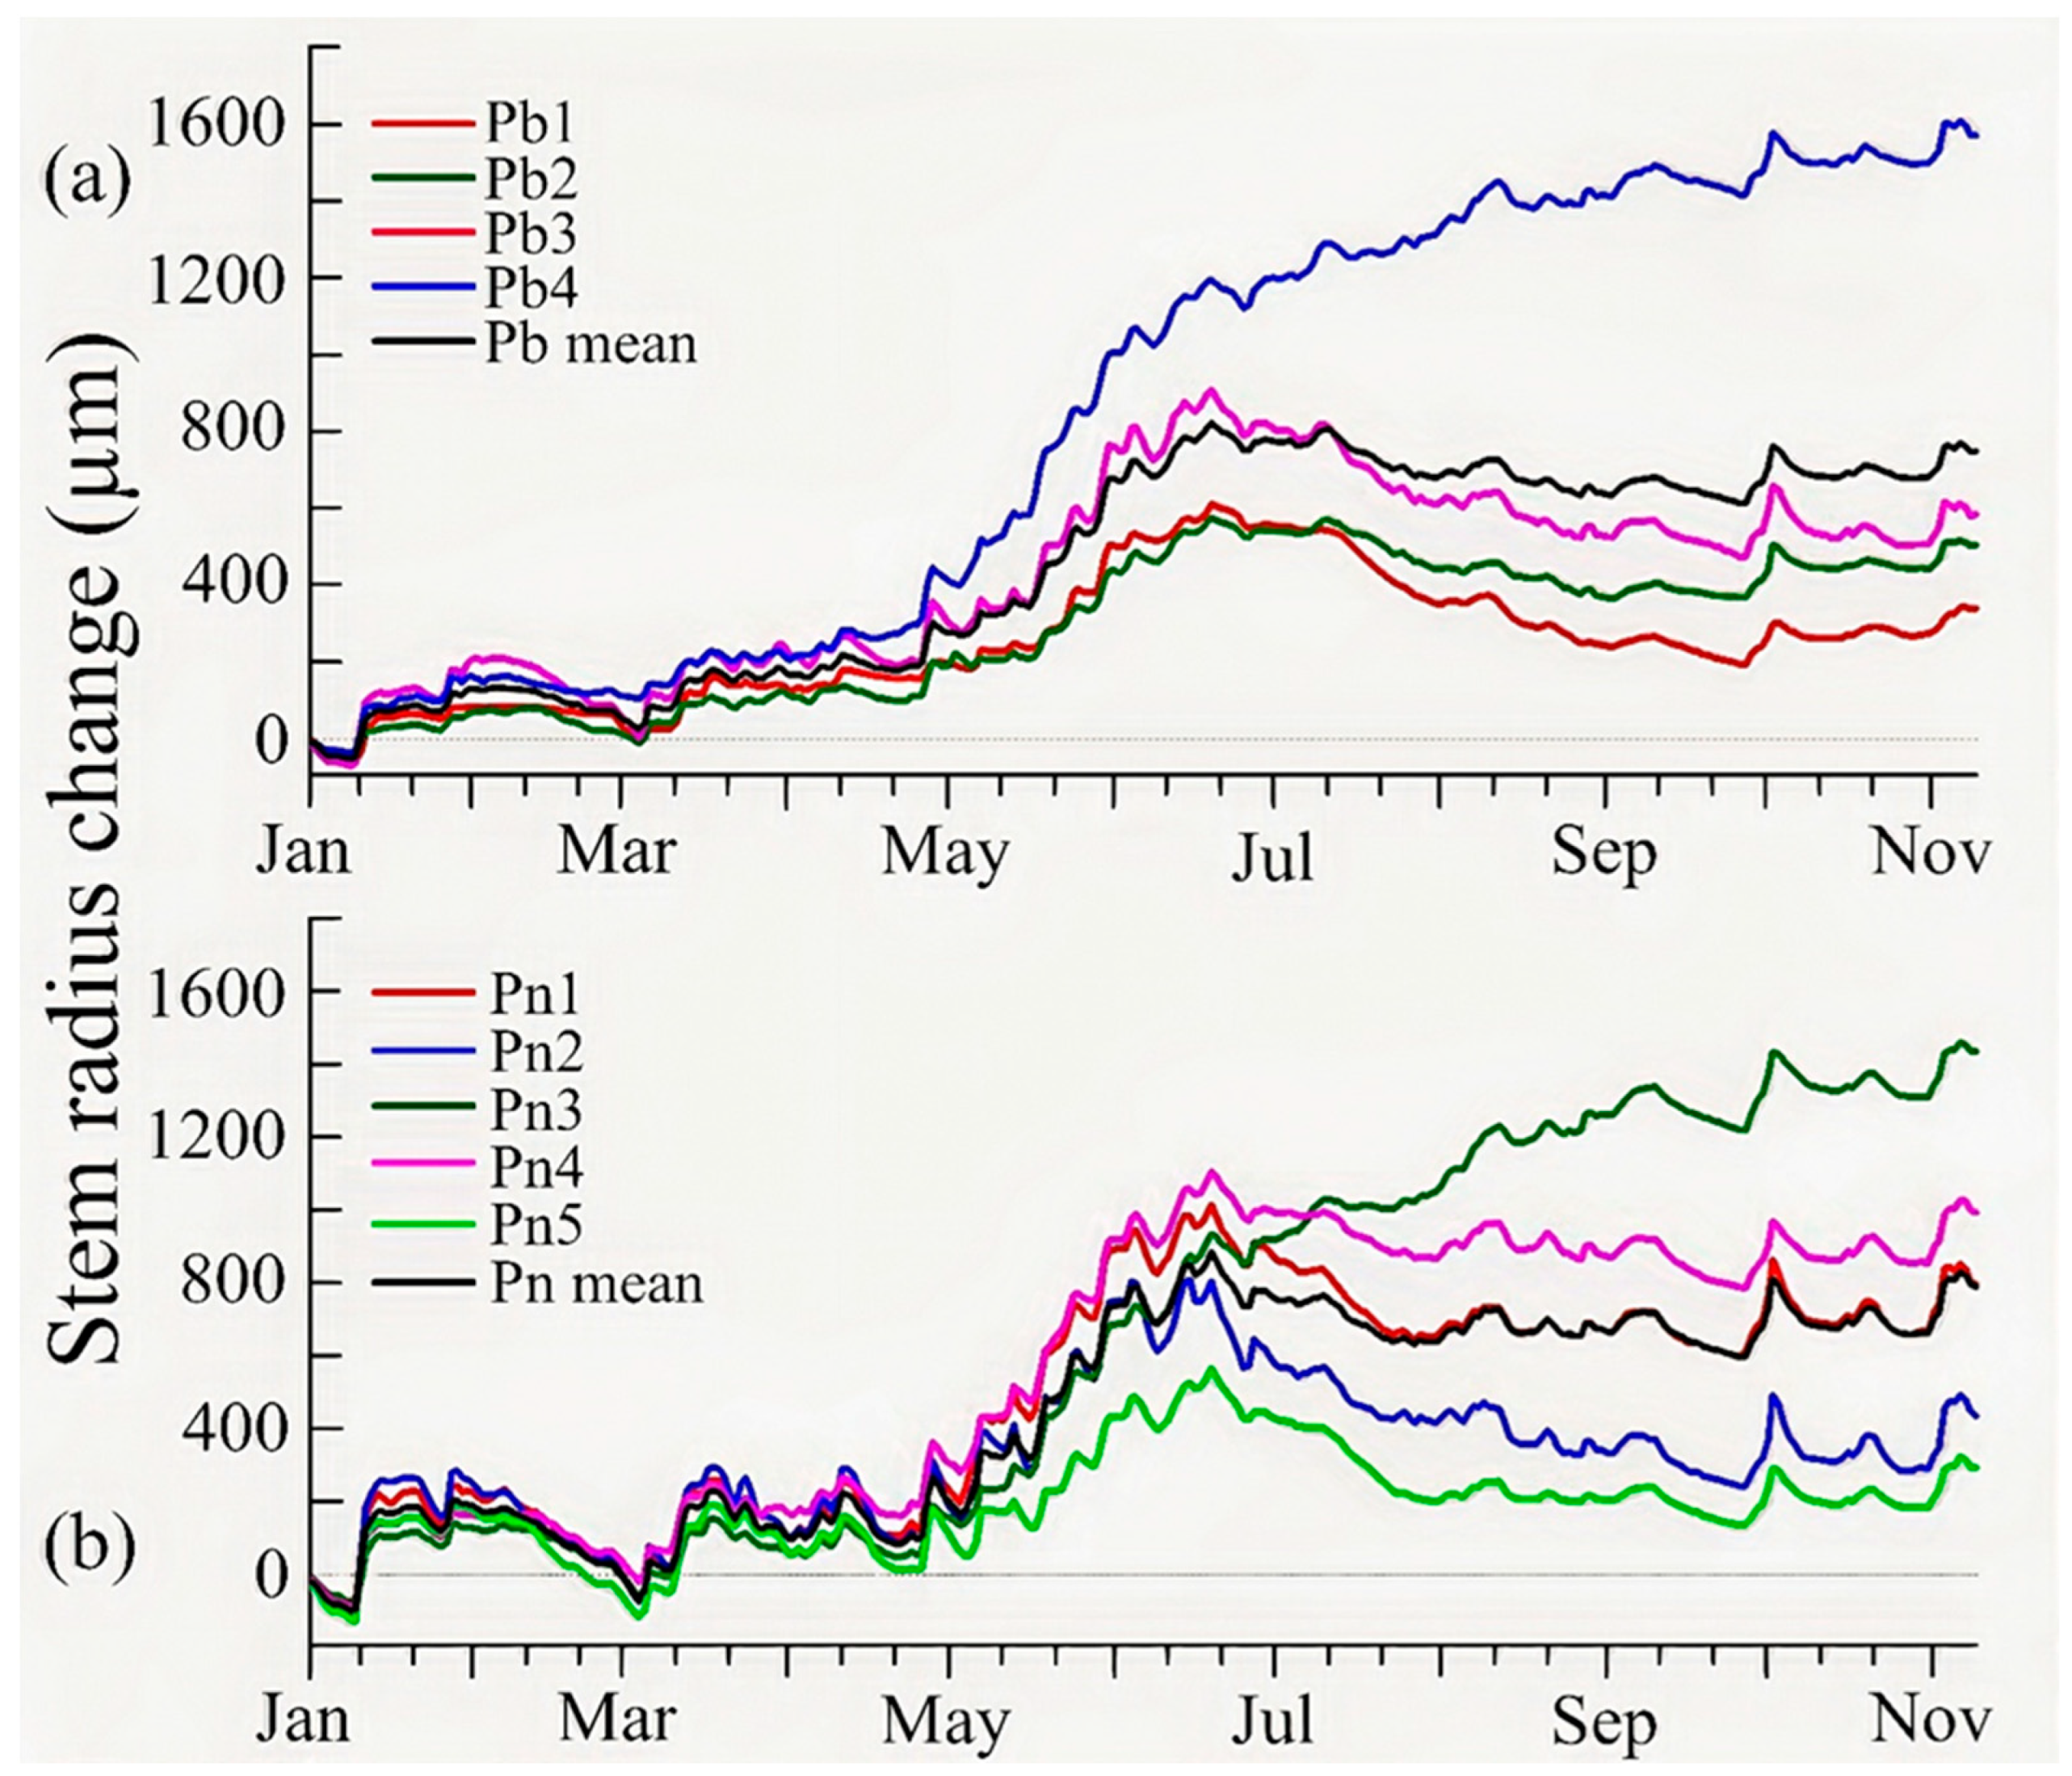
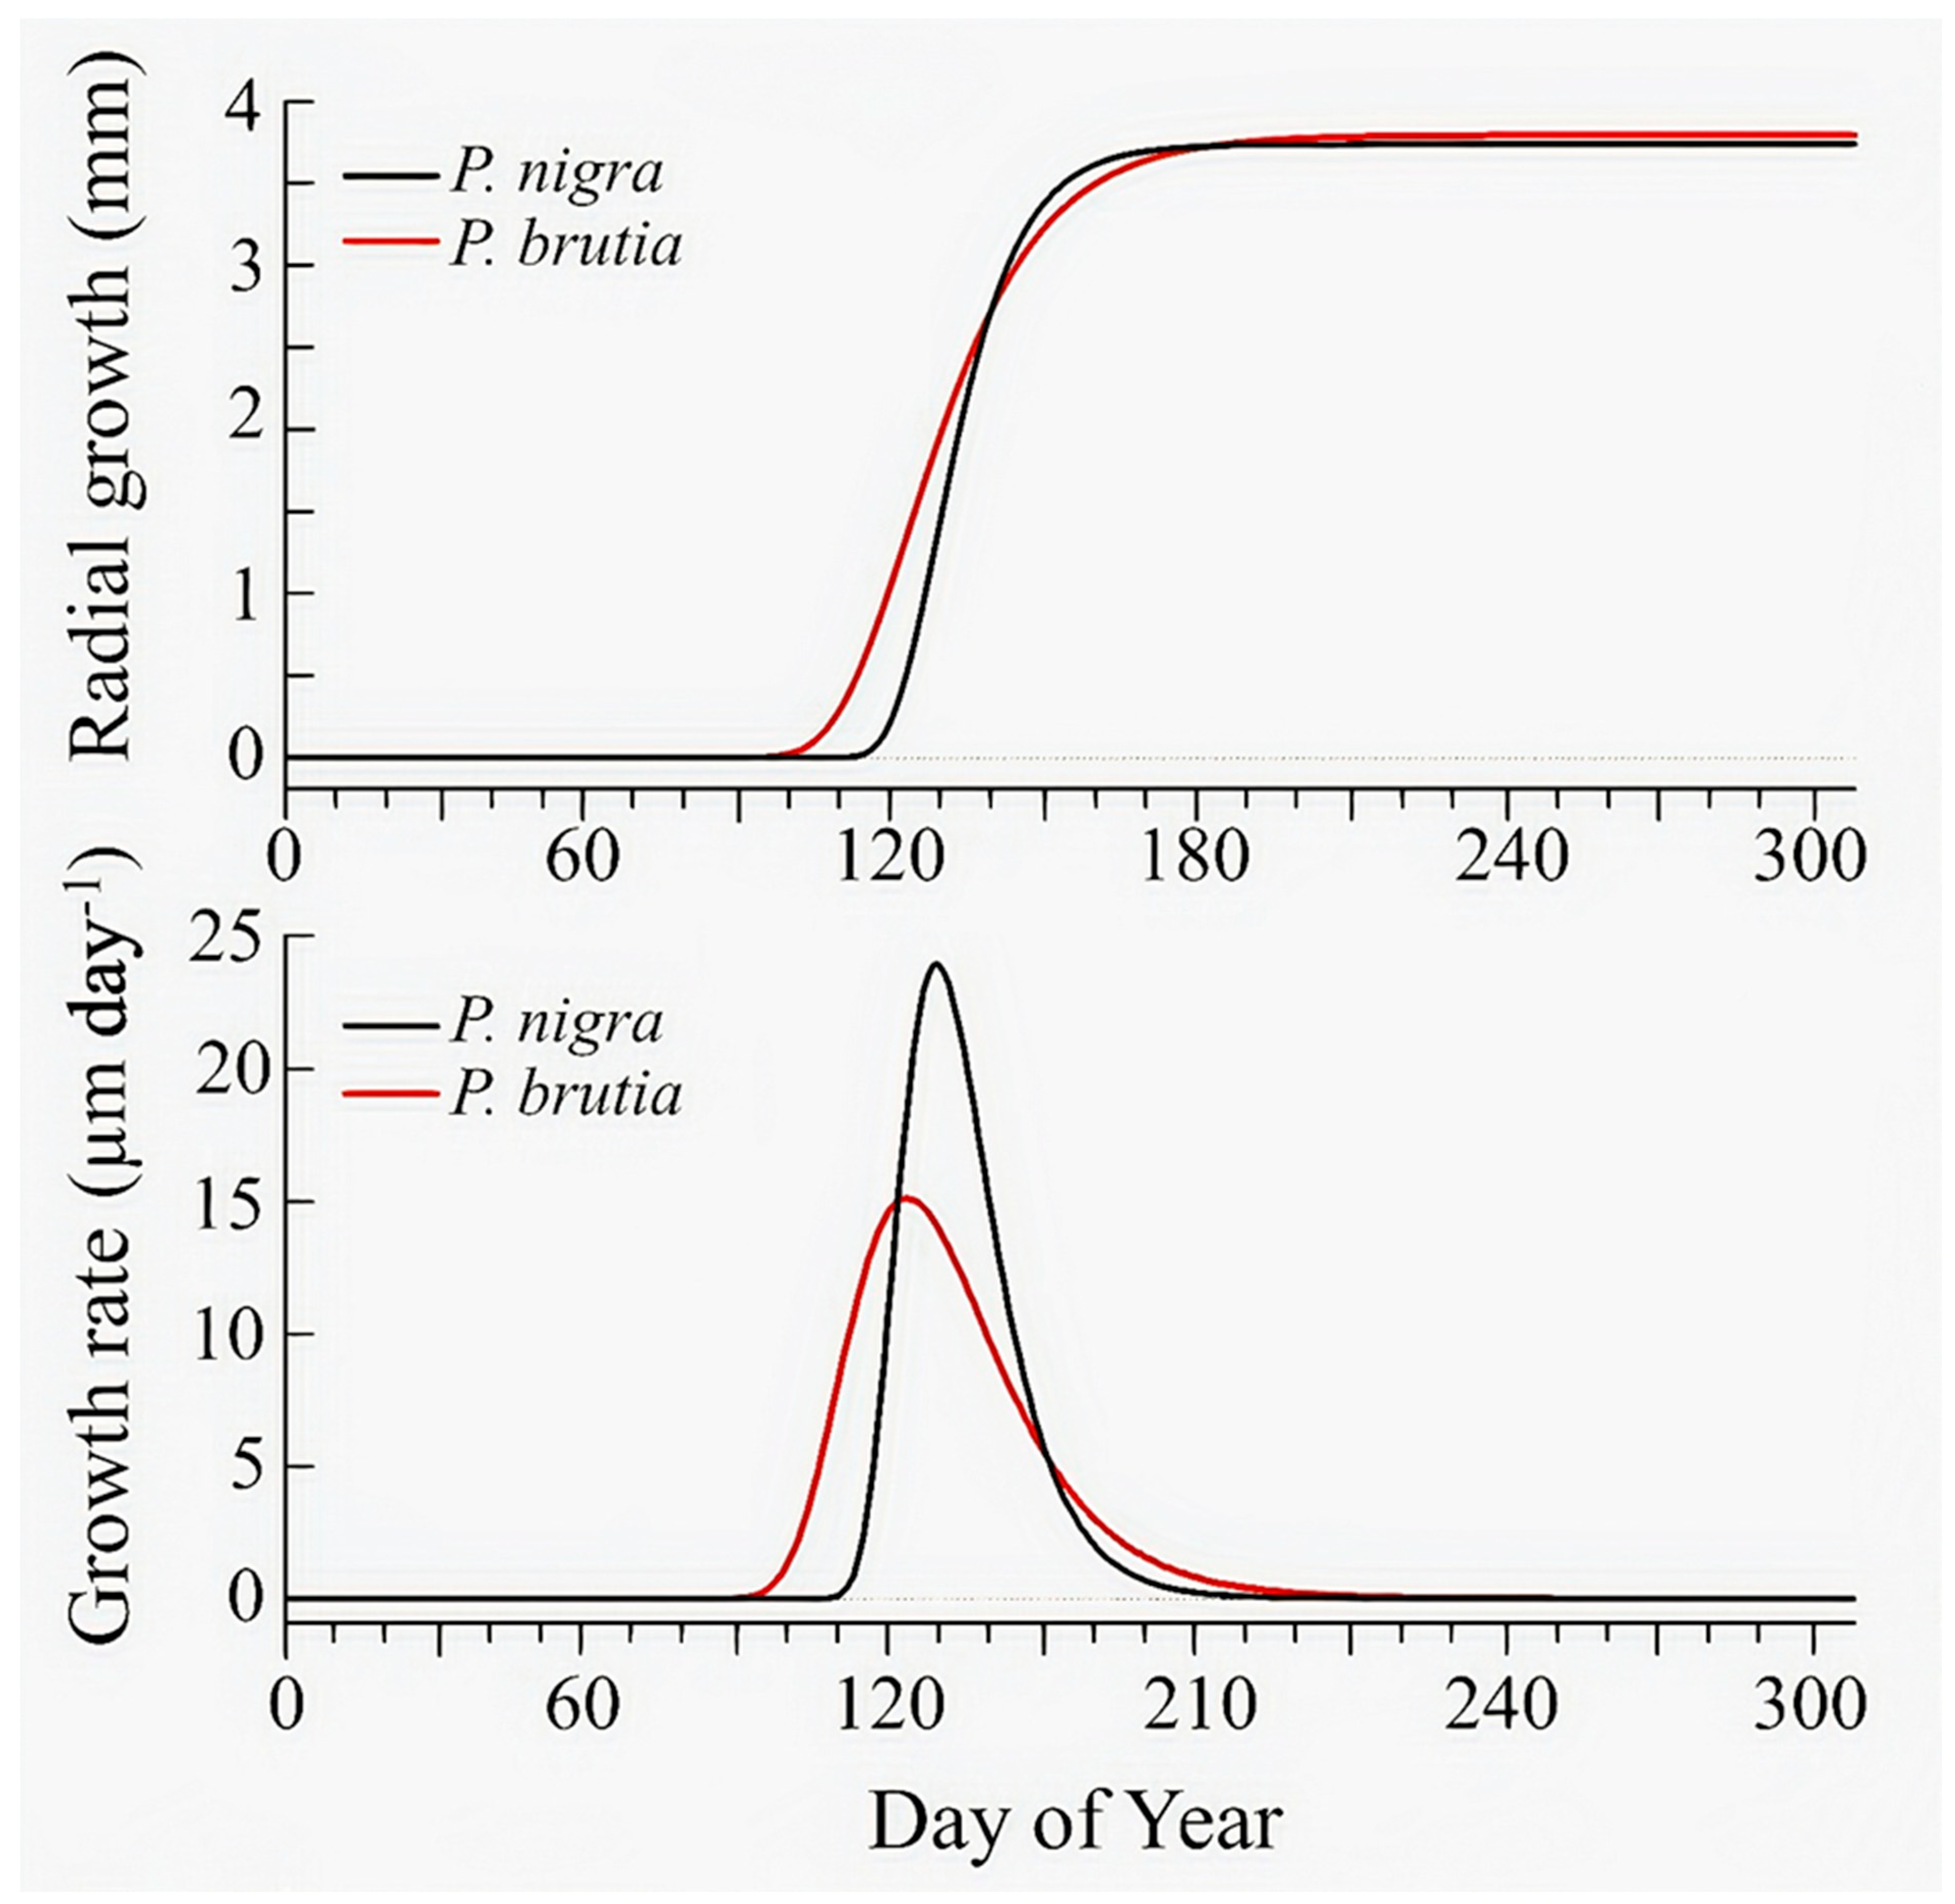
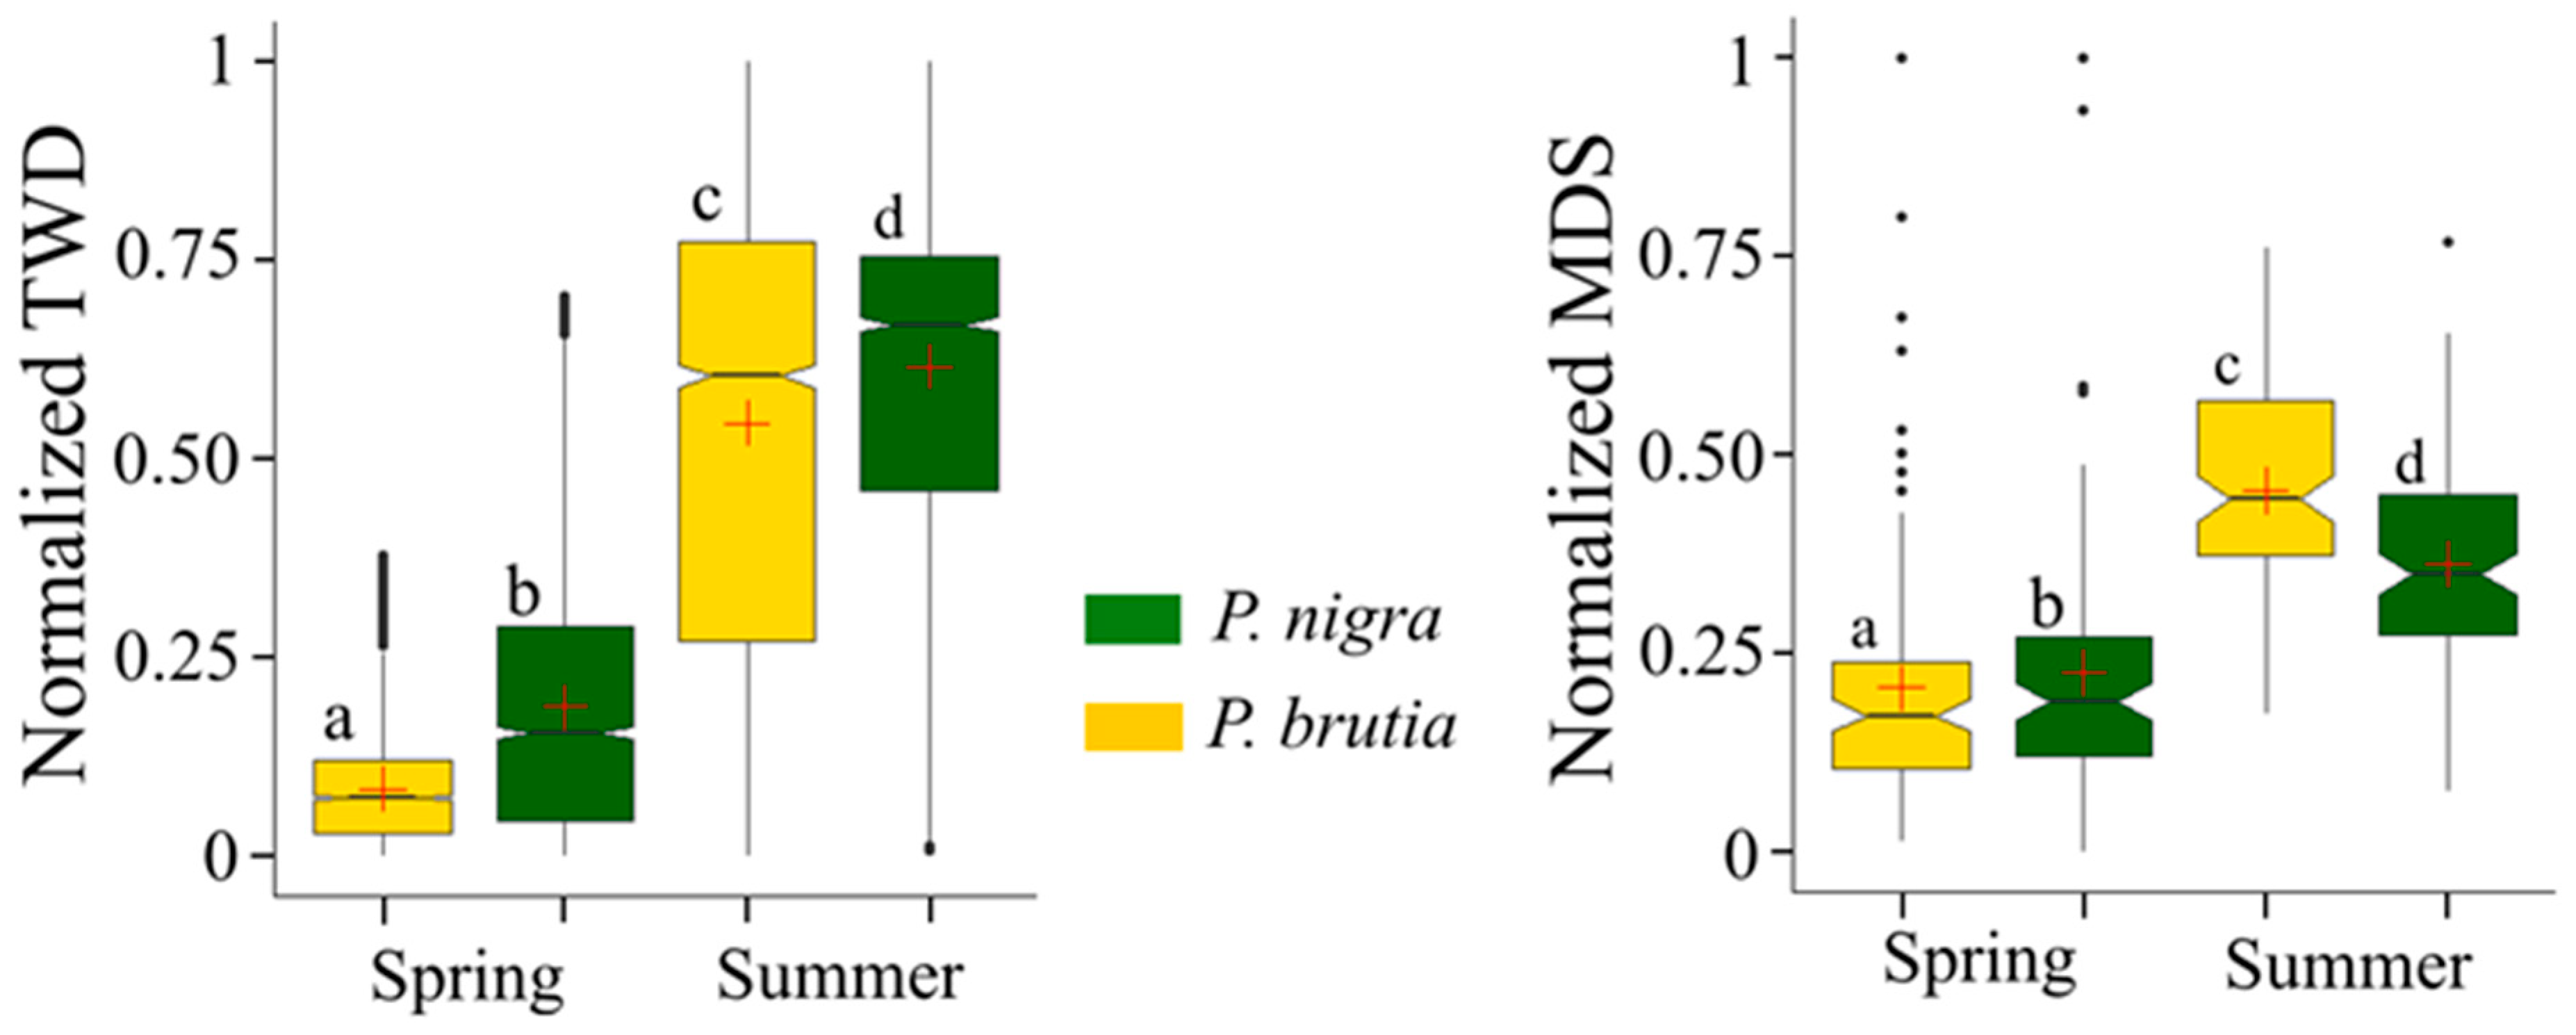
3.2. Stem Growth and Tree Water Status Dynamics

The Gompertz curves explained from 79% to 99% of the daily stem radial change in P. brutia, and from 70% to 99% in P. nigra during 2023 (Figure S3 and Table S1). The initiation of stem radial growth in P. brutia occurred between 21 March and 25 April (DOY 80–115), while the termination of this growth occurred between 31 May and 4 August (DOY 151–216). In contrast, onset of stem growth in P. nigra was between 2 April and 30 April (DOY 92 to 120), with growth cessation occurring between 25 May and 2 September (DOY 145–245) (Figure S3 and Table S1). On average, P. brutia began growing on DOY 107 and continued for 60 days, ending on DOY 167. In contrast, the average growth of P. nigra began on day 120 (onset) and continued for 36 days, ending on DOY 156 (Figure 4 and Table S1). Both P. nigra and P. brutia exhibited comparable cumulative radial growth during the April–November 2023 period. (Figure 4).
For P. nigra, the cumulative stem diameter growth ranged from 1.2 mm to 8.0 mm, averaging 3.73 mm. Similarly, the cumulative stem increment of P. brutia ranged from 1.9 mm to 8.2 mm, yielding an average measurement of 3.79 mm over the same period (Figure S3 and Table S1). However, due to the difference in growth periods, the average daily GROrate in P. brutia was 10.0 µm day−1, compared with 16.5 µm day−1 for P. nigra (Table S2).
The maximum daily GROrate varied between 6.2 µm day−1 and 16.41 µm day−1 in P. brutia, whereas it ranged between 4.7 µm day−1 to 25.50 µm day−1 in P. nigra (Figure S3). The highest average daily GROrate recorded was 23.9 µm for P. nigra and 15.1 µm for P. brutia (Figure 4). Although growth onset varied, both species reached peak growth before July, which corresponds to the beginning of the dry season in the region (Figure 4).
An analysis of the normalized MDS values for P. brutia and P. nigra indicates that both species exhibit similar MDS values in spring. However, during summer, the difference becomes more pronounced, with P. brutia showing higher MDS values. The Kruskal–Wallis test revealed significant differences between the mean ranks of at least one pair of MDS values across species and seasons (H(2) = 167.14, p < 0.01). Post hoc Dunn’s test confirmed that MDS values differed significantly between species and seasons (p < 0.01) (Figure 5).
An examination of the normalized TWD values reveals that both species reach their highest TWD levels during summer. Additionally, the average TWD values of P. nigra were higher than those of P. brutia in both spring and summer. The Kruskal–Wallis analysis of variance, followed by Dunn’s post hoc test, suggested a significant difference in TWD values between the two species during both seasons (p < 0.01) (Figure 5).
The linear mixed-effects model (LMM) results were consistent with the findings described above. TWD was significantly influenced by the interaction between VPD and SWP (Table S2). The linear mixed effects model (LMM) indicated that normalized TWD values for P. nigra were generally higher than those of P. brutia across all levels of available soil moisture, particularly under elevated atmospheric evaporative demand (Figure 6). However, under the most extreme conditions, particularly when soil moisture approached the wilting point (SWP = −15 bar), both species exhibited similarly high TWD values, minimizing the observed interspecific differences (Figure 6).
Mean values of absolute TWD and MDS parameters are shown in Table S3 for each tree and species during the study period.

3.3. Impact of Environmental Factors on Stem Radius Changes

Analysis of the relationship between the irreversible growth (GRO) of the studied tree species and climatic variables revealed that the daily maximum air temperature had the strongest positive correlation with GRO for both species, while soil water potential had the most significant negative correlation. Furthermore, the correlation coefficients for the two species were similar (Table 3).
The MDS values of both P. brutia and P. nigra were strongly related to air temperature among all factors (Tmean, Tmax and Tmin) (Table 3). The second-most influential factor on MDS, after temperature, was VPD, with an impact on MDS values of both species. An inconsistency was observed regarding the influence of precipitation on the MDS values for both species, as precipitation significantly affected the MDS of P. brutia (p < 0.001), whereas it did not exert a strong influence on the MDS of P. nigra. The MDS values of P. brutia were more affected by meteorological variables than those of P. nigra.
The most influential factor on the TWD was SWP followed by VPD, in both species. According to the correlation analysis, climatic factors played a more substantial role in determining the TWD values of P. brutia and P. nigra compared to MDS and GRO.

4. Discussion

4.1. Species-Specific Growth Patterns

Although the growth period of Pinus brutia was 24 days longer than that of P. nigra at the study site during 2023, the total increment was comparable between the two species (Figure 4, Table S1). While the average daily growth rate (GROrate) in P. brutia was 10.0 µm day−1, it was nearly 65% higher in P. nigra, reaching 16.5 µm day−1, allowing P. nigra to achieve a similar annual increment within a shorter timeframe (Table S1). Additionally, the maximum daily GROrate averaged 23.9 µm for P. nigra and 15.1 µm for P. brutia (Figure 4). Notably, one P. brutia (Pb4) and one P. nigra individual (Pn3) exhibited considerably higher increment from July onward compared to the other trees. While this may reflect individual-level physiological variation, such effects were minimized through the use of species-level averages in subsequent analyses.
Few comparative studies have evaluated the annual growth rates of P. brutia and P. nigra under similar environmental conditions. Mazza et al. [35] reported greater increments in P. brutia than P. nigra based on tree-ring analysis in central Italy. Similarly, Çatal et al. [36] found that P. brutia reached 50 and 100 cm in height at 5 and 11 years, while P. nigra required 9 and 13 years, respectively. Due to its fast-growing and light-demanding nature, P. brutia is generally considered to grow more rapidly than P. nigra under favorable conditions [8,9,11]. However, under the specific site conditions of this study, despite a longer growth period, P. brutia did not exhibit a markedly higher annual increment compared to P. nigra.
A possible explanation for these results is the interaction between species characteristics and site conditions. P. brutia is typically distributed from sea level to 600 m, with its range extending up to 1200–1400 m in Southern Türkiye [37]. However, optimal growth occurs below 800 m [38]. The study site, located at 1308 m, is near the species’ upper elevation limit, potentially restricting its growth. In contrast, P. nigra naturally occurs from 1000–1200 m to 1800 m in the Mediterranean region, positioning the study site closer to its lower elevation threshold. Güner et al. [39] found that P. nigra exhibits optimal growth at elevations between 1200 and 1600 m in Türkiye. Consequently, the elevation of the study area may limit the growth potential of P. brutia, while likely falling within the suitable elevational range for P. nigra, based on its known ecological preferences.
Another factor potentially influencing growth differences is tree age and lifespan. P. brutia is a fast-growing species with a typical lifespan of 150–300 years [8], but in managed forests in Türkiye, its rotation age is around 65 years [40]. In contrast, P. nigra can live for over 400 years, with some individuals reaching 1000 years [11]. This difference impacts their optimal growth phases, as P. brutia reaches peak increment between 20 and 65 years [41], while P. nigra exhibits the most rapid annual diameter growth between 50 and 100 years [42]. Consequently, the rotation age for P. nigra is longer, typically 80–100 years. In this study, the sampled P. nigra individuals averaged 87 ± 3.5 years, an age generally considered to coincide with relatively active diameter growth in this species, while P. brutia averaged 78.5 ± 8.6 years, an age when growth rates typically begin to decline (Table 1). Notably, two younger P. brutia trees (Pb3 and Pb4, 70 years old) exhibited significantly higher increments than older individuals (Pb1 and Pb2, 89 years old), which is consistent with this age-related pattern (Figure 2, Figure S3 and Table S1).

4.2. Species-Specific Tree Water Status Dynamics

TWD and MDS serve as indirect indicators of tree water status in dendrometric studies. The relationship between TWD and drought stress is well established, as TWD is primarily influenced by evaporative demand and soil moisture availability [22]. While MDS is also a useful indicator of tree water relations [21], it differs from TWD in that it reflects ecophysiological processes such as transpiration and assimilation [23].
The TWD values for P. nigra subsp. pallasiana (Lamb.) Holmboe tended to be higher than those of P. brutia Ten. during both spring and summer (Figure 5). Results from the linear mixed-effects model (LMM) support this trend, indicating that P. nigra generally showed greater TWD under increasing VPD and declining soil water potential (Figure 6). However, under the most extreme conditions—when soil water potential approached the wilting point (−15 bar) and VPD was highest—TWD values of both species became similar, and the previously observed differences were no longer evident. Analysis of MDS revealed that P. brutia exhibited significantly higher MDS than P. nigra during the summer months (Figure 5).
A possible explanation for the lower TWD and higher MDS in P. brutia compared to P. nigra may lie in their distinct hydraulic traits, despite both species exhibiting isohydric behavior and drought avoidance tendencies [43,44]. Sabater et al. [45] reviewed the hydraulic differences in pine species that influence drought adaptation, reporting that P. brutia generally exhibits higher stomatal conductance (gs, mol m−2 s−1), greater CO2 assimilation (A, mmol m−2 s−1), lower leaf water potential at the turgor loss point (Ψtlp, mPa) and lower water potential at 50% lost hydraulic conductivity (PLC50, mPa), compared to P. nigra. Lower stomatal conductance in P. nigra suggests stricter stomatal control, leading to lower MDS [46]. Additionally, plants with lower Ψtlp tolerate water deficits better by maintaining a positive carbon balance and preventing cellular damage [47]. Similarly, a lower PLC50 indicates greater resistance to embolism [48]. These differences may partly explain the observed differences in TWD values between the two species under similar environmental conditions.
Beyond physiological traits, morphological differences between Pinus brutia and P. nigra likely contributed to the observed variation in tree water deficit (TWD) and maximum daily shrinkage (MDS). Root system architecture plays a key role in shaping species-specific water access strategies. P. brutia generally develops a shallow, laterally spreading and asymmetrical root system that enables rapid exploitation of ephemeral surface moisture following short rainfall events [13,19]. In contrast, P. nigra tends to form deeper and more symmetrical root systems when soil conditions permit, providing more stable access to deeper soil water but potentially limiting short-term rehydration capacity [15]. However, early-stage studies show that Mediterranean species like P. brutia may initially develop deeper roots than boreo-alpine species such as P. nigra, highlighting their plasticity and drought-avoidance capacity [19,49]. These rooting strategies may explain the observed patterns, while P. brutia exhibited larger MDS values and lower TWD values, likely due to its ability to quickly reabsorb water after transpiration peaks.
Aboveground structures reinforce this distinction. P. brutia possesses a broad and open crown with horizontally extended branches [9,10], which promotes light interception and photosynthetic activity but also increases transpiration demand. Its needles, arranged in pairs (two per fascicle), are typically longer, thinner and lighter in color, features that enhance gas exchange and responsiveness to environmental fluctuations [8]. Conversely, P. nigra develops a more compact and vertically oriented crown with shorter, darker and often stiffer needles occurring in pairs or threes, promoting conservative water use and reduced radiation load [15].
Bark characteristics further distinguish these species. P. nigra forms thick, deeply fissured bark that can exceed 3 cm in trees with DBH > 50 cm, offering enhanced insulation and fire resistance [18,50,51]. In contrast, P. brutia has thinner, reddish-brown bark that exfoliates irregularly and becomes moderately fissured with age [12,52]. This lower bark insulation may increase daytime stem shrinkage, consistent with the higher MDS observed in P. brutia. However, its shallow but plastic root system may facilitate faster diurnal recovery, thus maintaining lower TWD values despite higher evaporative demand. These contrasting morphological traits are consistent with ecological patterns reported in the literature. Pinus brutia is generally considered better adapted to Mediterranean environments with hot, dry summers and intermittent rainfall, whereas P. nigra is typically associated with higher-elevation or montane habitats and exhibits traits favoring drought tolerance under cooler but prolonged dry periods [45]. Such habitat-related adaptations may partially explain the species-specific differences observed in stem shrinkage and water deficit dynamics under fluctuating environmental conditions.
Supporting physiological and morphological differences, regional studies have also highlighted distinct drought responses between these species. Deligöz & Cankara [25] found that P. nigra had a higher midday water potential than P. brutia, while P. brutia exhibited a lower osmotic potential at the turgor loss point, reinforcing its superior drought resistance, in a region adjacent to the study site. Additionally, Mazza et al. [35] reported that P. brutia recovers from drought two to three times faster than P. nigra, which facilitates more efficient compensation for prolonged water deficits.

4.3. Environmental Determinants of Tree Growth and Tree Water Status Dynamics

Correlation analyses of the relationships between P. brutia Ten. and P. nigra subsp. pallasiana (Lamb.) Holmboe in terms of growth (GRO) and environmental factors revealed no significant differences between species in their climatic responses. A significant positive correlation (p < 0.01) was found between GRO in both species and maximum air temperature, vapor pressure deficit (VPD) and global radiation, while a notable negative correlation (p < 0.01) was observed with soil water potential and relative air humidity (Table 3).
These findings align with previous studies on pine species in Mediterranean regions, which indicate that climate-driven variations in stem radius are largely influenced by temperature at the beginning of the growing season and by precipitation during summer [53]. Similarly, research has shown that P. halepensis and P. pinea growth is positively affected by temperatures during the growing season [54]. In Türkiye, P. nigra responds favorably to increased temperatures at the start of the growing season, with precipitation being the primary limiting factor for its radial growth during spring and summer due to reduced soil water potential [24]. Our findings suggest that soil water availability is an important factor influencing radial growth in Mediterranean pines (Table 3), likely facilitating growth and replenishment of internal water reserves. Gompertz growth models showed that the primary growth period for both species overlapped with the highest rainfall and relatively high soil water availability (Figure 4).
Correlation analyses of TWD and climatic factors indicated that P. nigra and P. brutia exhibited similar responses (Table 3). In both species, the most significant correlations were between TWD, SWP and VPD, with negative correlation coefficients. This relationship has been well-documented in previous studies, where high VPD triggers transpiration, leading to increased TWD as trees struggle to replace lost water from the soil [21,49,55]. Our results further corroborate these patterns and demonstrate that the relationship between TWD and meteorological factors is comparable for the two species studied in the study site.
Correlation analyses also indicated that MDS was primarily influenced by minimum air temperature and VPD (Table 3). This effect likely arises from increased transpiration demands at higher temperatures, requiring more water from stem tissues to support this physiological process, as reported in previous studies [56]. A related study found that a 10 °C increase in temperature led to a 40% rise in stomatal conductance in P. taeda, primarily to facilitate leaf cooling, demonstrating the significant impact of temperature on plant water use [57]. Another key environmental factor negatively correlated with MDS was SWP, likely due to enhanced root water absorption under higher soil moisture conditions. This process reduces the amount of water drawn from stem tissues for transpiration, thereby decreasing MDS.
Correlation analyses indicated that the MDS of P. brutia was more strongly influenced by climate variables compared to that of P. nigra. Specifically, the correlation between MDS and both SWC and VPD was stronger in P. brutia. Higher MDS values are generally interpreted as indicators of greater stomatal openness, which may promote increased transpiration and assimilation. Previous research found that P. nigra closes its stomata earlier than P. brutia during drought, helping to mitigate declines in leaf water potential [26]. Our findings suggest that MDS is more sensitive to environmental fluctuations when stomata remain open for extended periods. Additionally, the higher MDS observed in P. brutia compared to P. nigra, particularly during dry periods, may indicate its superior ability to sustain hydraulic conductivity and maintain assimilation under the environmental conditions of the study area. Moreover, the relatively thinner bark of P. brutia likely contributed to the increased detectability of bark-related variations, as thinner bark may respond more visibly to short-term fluctuations in stem water status.

4.4. Limitations of the Study

The analyses in this study compared one-year stem growth (GRO), tree water deficit (TWD) and daily maximum shrinkage (MDS) data from four P. brutia and five P. nigra trees in a natural mixed forest stand in the Mediterranean region of Türkiye. Due to the natural forest setting and limited sample size, variation among tree age groups was not analyzed. Future studies should increase the number of sampled trees to evaluate whether radial stem increment differs among age classes. Moreover, identifying the age ranges during which each species exhibits peak growth would help clarify developmental differences.
While the one-year dendrometer data supported the established hypotheses under the specific site and climatic conditions of 2023, longer-term monitoring is needed to assess interannual variability in tree responses. For instance, years with markedly different precipitation or temperature patterns, particularly during the growing season, may reveal contrasting growth dynamics. Expanding future research to include various habitat types, such as different elevation gradients and site conditions, would provide a more comprehensive understanding of factors influencing radial growth and drought response strategies in these species.

5. Conclusions

Based on high-resolution dendrometer data collected over one year, this study examined the short-term patterns of radial stem increment of P. nigra and P. brutia growing in a natural, mixed stand in the Mediterranean region of southern Türkiye, as well as their differences in terms of tree water deficit and maximum daily shrinkage. The study also evaluated the relationship between these parameters and key climatic variables.
Although P. brutia had a longer growth period than P. nigra, the annual stem increments of the species were notably similar in the study site during 2023. However, P. brutia was able to maintain a lower tree water deficit than P. nigra under conditions of increasing atmospheric evaporative demand and decreasing soil water potential. In addition, the daily maximum shrinkage of P. brutia was higher than that of P. nigra, especially during the dry period, indicating a potentially greater ability to sustain assimilative activity under such conditions. The most influential climatic factors affecting growth of the species were air temperature, air vapor pressure deficit and soil water potential. The tree water deficit of the species is mostly negatively influenced by soil water potential and positively influenced by vapor pressure deficit. Air temperature, vapor pressure deficit and soil water potential were the primary climatic factors associated with maximum daily shrinkage in both species. During the study year and at the given site, these variables appeared to have a stronger effect on P. brutia than on P. nigra.
Considering that the Mediterranean region is projected to become much drier and hotter than it is today [2,35], prolonged low soil moisture is likely to constrain annual radial growth and shorten the growing periods of both P. nigra and P. brutia at the study site. However, P. brutia tended to maintain a lower tree water deficit under conditions of increased evaporative demand and reduced soil moisture. Its higher daily maximum shrinkage during the dry period may suggest a potential to sustain gas exchange for a longer duration under drought, although further physiological data would be required to confirm this. Furthermore, P. brutia achieved annual radial increments comparable to those of P. nigra, despite environmental conditions such as elevation and tree age appearing more favorable for P. nigra. In addition, the longer growth period of P. brutia compared to P. nigra may offer an advantage in the prolonged drought periods in the future. Therefore, under similar site conditions, prioritizing P. brutia in future management planning may be a viable option; however, this suggestion requires further validation through long-term and multi-site studies. The findings of this study may contribute to forest management strategies in areas where P. brutia and P. nigra co-occur, but should be supported by broader monitoring of stem water status using complementary indicators such as TWD, MDS, sap flow, and leaf water potential.

Supplementary Materials

The following supporting information can be downloaded at: https://www.mdpi.com/article/10.3390/f16081229/s1, Figure S1. Installation positions of dendrometers on sample trees. Figure S2. Stem radius change (SRC) of the sample trees from June to the end of 2022. Figure S3. Modeled radial growth of four P. brutia (a) and five P. nigra sample trees (b) according to Gompertz function and associated daily growth rates accordingly in 2023. (Pb: P. brutia, Pn: P. nigra). Table S1. Parameters estimated from the Gompertz functions. Table S2. Summary table for the linear mixed model of TWD (tree water deficit) as a function of atmospheric vapor pressure deficit (VPD), soil water potential (SWP) and tree species (P. nigra and P.brutia). Table S3. Averaged (mean ± standard deviation) annual tree water deficit (TWD) and maximum daily shrinkage (MDS) for P. nigra and P. brutia during 2023. Pn: P. nigra, Pb: P. brutia. Description of data: Supplementary Materials include dendrometer installation positions on the sample trees (Figure S1), stem radius changes of the sample trees from June to the end of 2022 indicating lack of growth during this time period (Figure S2), modeled radial growth and daily growth rates of each sample tree derived from the Gompertz function (Figure S3), parameter estimates from the Gompertz function for each sample tree (Table S1), a statistical summary of the linear mixed-effects model (LMM) (Table S2), and the mean and standard deviation of TWD and MDS for each sample tree (Table S3).

Funding

This research was funded by the Isparta University of Life Sciences Coordinatorship of Scientific Research Projects, grant number: 2021-ILK1-0157, “Monitoring intra-annual dynamics of tree water status with dendrometers in Pinus nigra Arn. and Pinus brutia Ten. in the Mediterranean Region”.

Data Availability Statement

The data supporting the findings of this study are available from the corresponding author upon reasonable request.

Acknowledgments

The author would like to thank Ibrahim Dursun, from the Faculty of Forestry, Isparta University of Applied Sciences (Türkiye), for his assistance in creating the introductory figure of the study site and Peter Fleischer Jr. from the Faculty of Forestry, Technical University of Zvolen (Slovakia), for his support in the implementation of the “dendRoAnalyst” package in the R software.

Conflicts of Interest

The author has no relevant financial or non-financial interests to disclose.

References

  1. Forzieri, G.; Dakos, V.; McDowell, N.G.; Ramdane, A.; Cescatti, A. Emerging signals of declining forest resilience under climate change. Nature 2022, 608, 534–539. [Google Scholar] [CrossRef]
  2. Lionello, P.; Scarascia, L. The relation between climate change in the Mediterranean region and global warming. Reg. Environ. Change 2018, 18, 1481–1493. [Google Scholar] [CrossRef]
  3. Noto, L.V.; Cipolla, G.; Francipane, A.; Pumo, D. Climate change in the Mediterranean Basin (Part I): Induced alterations on climate forcings and hydrological processes. Water Resour. Manag. 2023, 37, 2287–2305. [Google Scholar] [CrossRef]
  4. Cramer, W.; Guiot, J.; Fader, M.; Garrabou, J.; Gattuso, J.-P.; Iglesias, A.; Lange, M.A.; Lionello, P.; Llasat, M.C.; Paz, S.; et al. Climate change and interconnected risks to sustainable development in the Mediterranean. Nat. Clim. Change 2008, 8, 972–980. [Google Scholar] [CrossRef]
  5. Forner, A.; Valladares, F.; Bonal, D.; Granier, A.; Grossiord, C.; Aranda, I. Extreme droughts affecting Mediterranean tree species’ growth and water-use efficiency: The importance of timing. Tree Physiol. 2018, 38, 1127–1137. [Google Scholar] [CrossRef]
  6. Vatandaşlar, C.; Türkeş, M.; Semerci, A.; Karahan, A. Analyzing climate-induced mortality of Taurus fir based on temporal forest management plans and climatic variations and droughts in the Central Mediterranean sub-region of Turkey. Eur. J. For. Res. 2023, 142, 61–89. [Google Scholar] [CrossRef]
  7. GDF General Directorate of Forestry (Türkiye). Official Statistics. 2022. Available online: https://www.ogm.gov.tr/tr/e-kutuphane/resmi-istatistikler (accessed on 27 September 2024). (In Turkish)
  8. Boydak, M. Silvicultural characteristics and natural regeneration of Pinus brutia Ten.—A review. J. Plant Ecol. 2004, 171, 153–163. [Google Scholar] [CrossRef]
  9. Mauri, A.; Di Leo, M.; de Rigo, D.; Caudullo, G. Pinus halepensis and Pinus brutia in Europe: Distribution, habitat, usage and threats. In European Atlas of Forest Tree Species; San-Miguel-Ayanz, J., de Rigo, D., Caudullo, G., Houston Durrant, T., Mauri, A., Eds.; Publications Office of the European Union: Luxembourg, 2016; p. e0166b8+. [Google Scholar]
  10. Akkemik, Ü. Pinus nigra. In Türkiye’nin Doğal ve Egzotik Ağaç ve Çalıları–1, Gymnospermler–Angiospermler; Akkemik, Ü., Ed.; General Directorate of Forestry Publications: Ankara, Türkiye, 2018; pp. 182–184. (In Turkish) [Google Scholar]
  11. Atalay, İ.; Sezer, İ.; Çukur, H. Kızılçam (Pinus brutia Ten.) ormanlarının ekolojik özellikleri ve tohum nakli açısından bölgelere ayrılması. In Orman Ağaçları ve Tohumları Islah Araştırma Müdürlüğü Yayın No. 6; Ege Üniversitesi Basım Evi: İzmir, Türkiye, 1998. (In Turkish) [Google Scholar]
  12. Güney, C.O.; Güney, A.; Sarı, A.; Kavgacı, A.; Ryan, K.C.; Hood, S.M. Modeling post-fire mortality of Turkish pine (Pinus brutia Ten.). For. Ecol. Manag. 2024, 572, 122265. [Google Scholar] [CrossRef]
  13. Ganatsas, P.; Spanos, I. Root system assymetry of Mediterranean pines. Plant Soil. 2005, 278, 75–83. [Google Scholar] [CrossRef]
  14. Enescu, C.M.; de Rigo, D.; Caudullo, G.; Mauri, A.; Houston Durrant, T. Pinus nigra in Europe: Distribution, habitat, usage and threats. In European Atlas of Forest Tree Species; San-Miguel-Ayanz, J., de Rigo, D., Caudullo, G., Houston Durrant, T., Mauri, A., Eds.; Publications Office of the European Union: Luxembourg, 2016; p. e015138+. [Google Scholar]
  15. Atalay, İ.; Efe, R. Ecological attributes and distribution of Anatolian black pine [Pinus nigra Arnold. subsp. pallasiana Lamb. Holmboe] in Turkey. J. Environ. Biol. 2012, 33, 509–519. [Google Scholar]
  16. Sevgi, O.; Yılmaz, O.Y. Karaçam ormanlarının yayılışı. In Karaçam; Sevgi, O., Tecimen, B., Okan, T., Eds.; Türkiye Ormancılar Derneği Yayın No: E/22/62; Türkiye Ormancılar Derneği: Ankara, Türkiye, 2022; ISBN 978-605-71791-2-8. (In Turkish) [Google Scholar]
  17. Genç, M. Silvikültürün Temel Esasları; Süleyman Demirel Üniversitesi Yayınları, Yayın No. 44; Süleyman Demirel Üniversitesi: Isparta, Türkiye, 2004. (In Turkish) [Google Scholar]
  18. Valor, T.; Hood, S.M.; Pique, M.; Larranaga, A.; Casals, P. Resin ducts and bark thickness influence pine resistance to bark beetles after prescribed fire. For. Ecol. Manag. 2021, 494, 119322. [Google Scholar] [CrossRef]
  19. Sarris, D.; Mazza, G. Mediterranean pine root systems under drought. In Pines and Their Mixed Forest Ecosystems in the Mediterranean Basin; Ne’eman, G., Osem, Y., Eds.; Managing Forest Ecosystems; Springer: Cham, Switzerland, 2021; Volume 38, pp. 129–141. [Google Scholar]
  20. Zweifel, R.; Haeni, M.; Buchmann, N.; Eugster, W. Are trees able to grow in periods of stem shrinkage? New Phytol. 2016, 211, 839–849. [Google Scholar] [CrossRef]
  21. Leštianska, A.; Fleischer, P., Jr.; Merganičová, K.; Fleischer, P., Sr.; Střelcová, K. Intra-annual dynamics of stem circumference variation and water status of four coniferous tree species (Pinus sylvestris, Picea abies, Larix decidua and Abies alba) under warmer and water-limited conditions. Biologia 2025, 80, 1125–1142. [Google Scholar] [CrossRef]
  22. Zweifel, R.; Zimmermann, L.; Newbery, D.M. Modeling tree water deficit from microclimate: An approach to quantifying drought stress. Tree Physiol. 2005, 25, 147–156. [Google Scholar] [CrossRef]
  23. Güney, A.; Gülsoy, S.; Şentürk, Ö.; Niessner, A.; Küppers, M. Environmental control of daily stem radius increment in the montane conifer Cedrus libani. J. For. Res. 2020, 31, 1159–1171. [Google Scholar] [CrossRef]
  24. Köse, N.; Akkemik, Ü.; Dalfes, H.N.; Özeren, M.S.; Tolunay, D. Tree-ring growth of Pinus nigra Arn. subsp. pallasiana under different climate conditions throughout western Anatolia. Dendrochronologia 2012, 30, 295–301. [Google Scholar] [CrossRef]
  25. Deligöz, A.; Cankara, F.G. Differences in physiological and biochemical responses to summer drought of Pinus nigra subsp. pallasiana and Pinus brutia in a natural mixed stand. J. For. Res. 2020, 31, 1479–1487. [Google Scholar] [CrossRef]
  26. Bayar, E.; Deligöz, A. Ecophysiological Behavior of Mediterranean Woody Species Under Summer Drought. Bosque 2021, 42, 311–321. Available online: https://revistabosque.org/index.php/bosque/article/view/197 (accessed on 1 July 2025).
  27. ISRIC World Soil Information. 2024. Available online: https://soilgrids.org/ (accessed on 28 October 2024).
  28. Raffelsbauer, V.; Spannl, S.; Peña, K.; Pucha-Cofrep, D.; Steppe, K.; Bräuning, A. Tree circumference changes and species-specific growth recovery after extreme dry events in a montane rainforest in Southern Ecuador. Front. Plant Sci. 2019, 10, 342. [Google Scholar] [CrossRef]
  29. Aryal, S.; Häusser, M.; Grießinger, J.; Fan, Z.; Bräuning, A. “dendRoAnalyst”: A tool for processing and analysing dendrometer data. Dendrochronologia 2020, 64, 125772. [Google Scholar] [CrossRef]
  30. Duchesne, L.; Houle, D.; D’Orangeville, L. Influence of climate on seasonal patterns of stem increment of balsam fir in a boreal forest of Québec, Canada. Agric. For. Meteorol. 2012, 162, 108–114. [Google Scholar] [CrossRef]
  31. Li, W.; Yue, F.; Wang, C.; Liao, J.; Zhang, X. Climatic influences on intra-annual stem variation of Larix principis-rupprechtii in a semi-arid region. Front. For. Global Change 2022, 5, 948022. [Google Scholar] [CrossRef]
  32. Makowski, D.; Ben-Shachar, M.S.; Patil, I.; Lüdecke, D. Methods and algorithms for correlation analysis in R. J. Open Source Softw. 2020, 5, 2306. [Google Scholar] [CrossRef]
  33. Kuznetsova, A.; Brockhoff, P.B.; Christensen, R.H.B. lmerTest package: Tests in linear mixed effects models. J. Stat. Softw. 2017, 82, 1–26. [Google Scholar] [CrossRef]
  34. Wickham, H.; François, R.; Henry, L.; Müller, K. dplyr: A Grammar of Data Manipulation, R Package Version 1.0.10. 2022. Available online: https://CRAN.R-project.org/package=dplyr (accessed on 1 July 2025).
  35. Mazza, G.; Markou, L.; Sarris, D. Species-specific growth dynamics and vulnerability to drought at the single tree level in a Mediterranean reforestation. Trees 2021, 35, 1697–1710. [Google Scholar] [CrossRef]
  36. Çatal, Y.; Güzel, B.; Genç, M. Determination of free-to-grow stages for natural mixed Brutian pine–Anatolian black pine stands. Turk. J. For. Sci. 2017, 1, 145–154. [Google Scholar] [CrossRef]
  37. Chambel, M.R.; Climent, J.; Pichot, C.; Ducci, F. Mediterranean pines (Pinus halepensis Mill. and Pinus brutia Ten.). In Forest Tree Breeding in Europe; Pâques, L., Ed.; Managing Forest Ecosystems; Springer: Dordrecht, The Netherlands, 2013; Volume 25, pp. 179–213. [Google Scholar] [CrossRef]
  38. Fontaine, M.; Aerts, R.; Özkan, K.; Mert, A.; Gülsoy, A.; Süel, H.; Waelkens, M.; Muys, B. Elevation and exposition rather than soil types determine communities and site suitability in Mediterranean mountain forests of southern Anatolia, Turkey. For. Ecol. Manag. 2007, 247, 18–25. [Google Scholar] [CrossRef]
  39. Güner, Ş.T.; Çömez, A.; Özkan, K.; Karataş, R.; Çelik, N. Modeling the productivity of Anatolian black pine plantations in Turkey. J. Fac. For. Istanb. Univ. 2016, 66, 159–172. (In Turkish) [Google Scholar] [CrossRef]
  40. Şahin, A. Yield Research in Calabrian Pine (Pinus brutia Ten.) Stands of Mersin Region. Ph.D. Thesis, Department of Forest Engineering, Artvin Çoruh University, Artvin, Türkiye, 2015; p. 337. (In Turkish). [Google Scholar]
  41. Kahriman, A.; Şahin, A.; Sönmez, T.; Yavuz, M. Growth models for natural stands of Calabrian pine in the central Mediterranean region of Türkiye. Šum. List 2023, 147, 107–119. [Google Scholar] [CrossRef]
  42. Carus, S.; Sevgi, O.; Yılmaz, O.Y.; Tecimen, H.B.; Akburak, S. Doğal Karaçam (Pinus nigra Arnold) meşcerelerinde tek ağaç çap artım modeli: Alaçam Dağları örneği. In Karaçam; Sevgi, O., Tecimen, B., Okan, T., Eds.; Türkiye Ormancılar Derneği Yayın No: E/22/62; Türkiye Ormancılar Derneği: Ankara, Türkiye, 2022; pp. 400–416. ISBN 978-605-71791-2-8. (In Turkish) [Google Scholar]
  43. Forner, A.; Aranda, I.; Granier, A.; Valladares, F. Differential impact of the most extreme drought event over the last half century on growth and sap flow in two coexisting Mediterranean trees. Plant Ecol. 2014, 215, 703–719. [Google Scholar] [CrossRef]
  44. Houminer, N.; Riov, J.; Moshelion, M.; Osem, Y.; David-Schwartz, R. Comparison of morphological and physiological traits between Pinus brutia, Pinus halepensis, and their vigorous F1 hybrids. Forests 2022, 13, 1477. [Google Scholar] [CrossRef]
  45. Sabater, A.M.; Vicente, E.; Morcillo, L.; del Campo, A.; Larsen, E.K.; Moutahir, H.; Pastor, F.; Palau, J.L.; Bellot, J.; Vilagrosa, A. Water-based forest management of Mediterranean pine forests. In Pines and Their Mixed Forest Ecosystems in the Mediterranean Basin; Ne’eman, G., Osem, Y., Eds.; Managing Forest Ecosystems; Springer: Cham, Switzerland, 2021; Volume 38, pp. 615–642. [Google Scholar] [CrossRef]
  46. Klein, T. The variability of stomatal sensitivity to leaf water potential across tree species indicates a continuum between isohydric and anisohydric behaviours. Funct. Ecol. 2014, 28, 1313–1320. [Google Scholar] [CrossRef]
  47. Tordoni, E.; Petruzzellis, F.; Di Bonaventura, A.; Pavanetto, N.; Tomasella, M.; Nardini, A.; Boscutti, F.; Martini, F.; Bacaro, G. Projections of leaf turgor loss point shifts under future climate change scenarios. Glob. Change Biol. 2022, 28, 6640–6652. [Google Scholar] [CrossRef]
  48. Schumann, K.; Schuldt, B.; Fischer, M.; Ammer, C.; Leuschner, C. Xylem safety in relation to the stringency of plant water potential regulation of European beech, Norway spruce, and Douglas-fir trees during severe drought. Trees 2024, 38, 607–623. [Google Scholar] [CrossRef]
  49. Andivia, E.; Zuccarini, P.; Grau, B.; de Herralde, F.; Villar-Salvador, P.; Savé, R. Rooting big and deep rapidly: The ecological roots of pine species distribution in southern Europe. Trees 2018, 33, 293–303. [Google Scholar] [CrossRef]
  50. Tapias, R.; Climent, J.; Pardos, J.A.; Gil, L. Life histories of Mediterranean pines. Plant Ecol. 2004, 171, 53–68. [Google Scholar] [CrossRef]
  51. Ulusuan, M.D.; Eler, Ü. Variation of bark thickness on single stem of crimean pine (Pinus nigra Arnold subsp pallasiana (Lamb) Holmboe) In Natural Stands: Acase study of Isparta region. Turk. J. For. 2023, 24, 188–196. (In Turkish) [Google Scholar] [CrossRef]
  52. Fernandes, P.M.; Vega, J.A.; Jimenez, E.; Rigolot, E. Fire resistance of European pines. For. Ecol. Manag. 2008, 256, 246–255. [Google Scholar] [CrossRef]
  53. Camarero, J.J.; Olano, J.M.; Parras, A. Plastic bimodal xylogenesis in conifers from continental Mediterranean climates. New Phytol. 2010, 185, 471–480. [Google Scholar] [CrossRef]
  54. Altieri, S.; Niccoli, F.; Kabala, J.P.; Liyaqat, I.; Battipaglia, G. Influence of drought and minimum temperature on tree growth and water use efficiency of Mediterranean species. Dendrochronologia 2024, 83, 126162. [Google Scholar] [CrossRef]
  55. Bachofen, C.; Tumber-Dávila, S.J.; Mackay, D.S.; McDowell, N.G.; Carminati, A.; Klein, T.; Stocker, B.D.; Mencuccini, M.; Grossiord, C. Tree water uptake patterns across the globe. New Phytol. 2024, 242, 1891–1910. [Google Scholar] [CrossRef]
  56. Dong, M.; Wang, B.; Jiang, Y.; Ding, X. Environmental controls of diurnal and seasonal variations in the stem radius of Platycladus orientalis in northern China. Forests 2019, 10, 784. [Google Scholar] [CrossRef]
  57. Urban, J.; Ingwers, M.; McGuire, M.A.; Teskey, R.O. Stomatal conductance increases with rising temperature. Plant Signal. Behav. 2017, 12, e1356534. [Google Scholar] [CrossRef]
Figure 1. Geographical location of the study site and weather station in Burdur, Türkiye. The upper panels display Türkiye’s regional position and the study area within Burdur. The lower panel provides a satellite image, with the red box marking the study site and the black circle indicating the weather station.
Forests 16 01229 g001
Figure 2. Annual course of hourly stem radius change of the sample trees in 2023 (a) for P. brutia and (b) for P. nigra. The black lines in both graphs represent the calculated mean SRC (stem radius change) for each species. (Pb: P. brutia, Pn: P. nigra).
Forests 16 01229 g002
Figure 3. Climate conditions at the study site during 2023. (a) Global radiation (GR, W m−2, green bars). (b) Air relative humidity (RH, %, blue bars). (c) Mean daily vapor pressure deficit (VPD, kPa, yellow bars). (d) Precipitation events (Pp, mm, blue bars) and cumulative precipitation (Cumulative Pp, mm, red line). (e) Soil water potential (Ψ, bar, burgundy line and area). (f) Air temperature (Tair, °C, red line).
Forests 16 01229 g003
Figure 4. Modeled cumulative radial growth and daily growth rate of P. brutia and P. nigra. The figure shows the modeled cumulative radial growth (mm, upper graph) and daily growth rate (µm day−1, lower graph) of Pinus brutia (n = 4, red line) and Pinus nigra (n = 5, black line) during the 2023 growing season, based on Gompertz growth functions. The model fit was high for both species, with R2 = 0.98 for P. brutia and R2 = 0.96 for P. nigra.
Forests 16 01229 g004
Figure 5. Boxplots showing normalized TWD and MDS for P. nigra and P. brutia. Spring corresponds to 1 March–June 15, and summer to 16 June–31 October in 2023. Different letters indicate significant differences according to the Kruskal–Wallis test followed by Dunn’s post hoc test (p < 0.01). In each boxplot, the median is shown within the box (25th and 75th percentiles), while means are represented by red crosses. P. nigra is displayed in green and P. brutia in gold. TWD: Tree water deficit; MDS: maximum daily shrinkage.
Forests 16 01229 g005
Figure 6. Modeled normalized tree water deficit (TWD) in response to the interaction between vapor pressure deficit (VPD), soil water potential (SWP), and tree species. Colored lines represent model predictions for Pinus brutia (solid lines) and Pinus nigra (dashed lines) across four SWP levels: –15 bar (green), –10 bar (dark blue), –5 bar (black), and 0 bar (red). Corresponding raw data points are shown as light blue dots for P. brutia and orange dots for P. nigra. The model illustrates how increasing VPD and decreasing SWP influence normalized TWD differently between the two species.
Forests 16 01229 g006
Table 1. Characteristics of the P. nigra and P. brutia mixed stand.
Species/Tree IDHeight (m)DBH (cm)Age
Pinus nigra Arn. subsp. pallasiana (Lamb.) Holmboe
Pn115.538.588
Pn2154589
Pn3154289
Pn4185289
Pn5164680
Species’ mean15.9 ± 1.146.2 ± 3.687 ± 3.5
Pinus brutia Ten.
Pb1154585
Pb2195989
Pb3175470
Pb4175270
Species’ mean17 ± 1.452.5 ± 1.778.5 ± 8.6
Table 2. Mean values (± standard deviation) and long-term averages of climate variables measured at the study site.
Variable2023Long Term Average x
Mean ± SD *Range
Air temperature (°C)13.3 ± 8.2−7.2–33.413.6
Global radiation (W m−2) **349 ± 2083.3–959.5
Relative humidity (%)63.4 ± 24.86.9–10057.4
Daily precipitation (mm) ***1.3 ± 0.40–15.71.03
Soil water potential (bar)−5.2 ± 6.5−0.16–−14.5
* Standard deviation. ** The global radiation values in the table represent mean daytime radiation. *** Daily precipitation data were obtained by dividing annual precipitation by 365. –: data not available. x: Long-term averages calculated from the Burdur Meteorological Station (37°43′19.2″ N, 30°17′38.3″ E; 950 m a.s.l.) covering the years 1993–2023.
Table 3. Spearman’s correlation coefficients between daily means of GRO, TWD, MDS and daily means of climate variables in 2023.
VariableGR TmeanTmaxTminRHSWPPpVPD
MDS Pb0.47 ***0.63 ***0.60 ***0.67 ***−0.40 ***−0.51 ***−0.17 ***0.55 ***
MDS Pn0.28 ***0.41 ***0.37 ***0.44 ***−0.16 ***−0.21 ***0.01 0.29 ***
TWD Pb0.301 **0.69 ***0.69 ***0.68 ***−0.62 ***−0.78 ***−0.39 ***0.72 ***
TWD Pn−0.26 ***0.62 **0.62 *0.61 ***−0.60 ***−0.77 ***−0.33 ***0.67 ***
GRO Pb0.40 **0.77 **0.77 **0.76 **−0.41 **0.61 ** −0.1700.62 **
GRO Pn0.40 **0.77 **0.77 **0.76 **−0.41 **0.61 * −0.140.62 **
GR: global radiation, W m−2. Tmin, Tmax, Tmean: daily minimum, maximum and mean air temperatures, °C. RH: air relative humidity, %. SWP: soil water potential, bar. Pp: precipitation, mm. VPD: vapor pressure deficit, kPa. Pb: Pinus brutia, Pn: Pinus nigra. The significance levels were established as * p < 0.05, ** p < 0.01, and *** p < 0.001. The strongest correlation for each dependent variable is emphasized in bold. n = 312 days.
Disclaimer/Publisher’s Note: The statements, opinions and data contained in all publications are solely those of the individual author(s) and contributor(s) and not of MDPI and/or the editor(s). MDPI and/or the editor(s) disclaim responsibility for any injury to people or property resulting from any ideas, methods, instructions or products referred to in the content.

