Article

Stem Volume Prediction of Chamaecyparis obtusa in South Korea Using Machine Learning and Field-Measured Tree Variables

1
Division of Forest Management Research, National Institute of Forest Science, Seoul 02455, Republic of Korea
2
Department of Forest Ecology and Protection, Kyungpook National University, Sangju 37224, Republic of Korea
*
Author to whom correspondence should be addressed.
Forests 2025, 16(8), 1228; https://doi.org/10.3390/f16081228
Submission received: 1 July 2025 / Revised: 21 July 2025 / Accepted: 24 July 2025 / Published: 25 July 2025
(This article belongs to the Section Forest Inventory, Modeling and Remote Sensing)

Abstract

Accurate estimation of individual tree stem volume is essential for forest resource assessment and the implementation of sustainable forest management. In South Korea, traditional regression models based on non-destructive and easily measurable field variables such as diameter at breast height (DBH) and total height (TH) have been widely used to construct stem volume tables. However, these models often fail to adequately capture the nonlinear taper of tree stems. In this study, we evaluated and compared the predictive performance of traditional regression models and two machine learning algorithms—Random Forest (RF) and Extreme Gradient Boosting (XGBoost)—using stem profile data from 1000 destructively sampled Chamaecyparis obtusa trees collected across 318 sites nationwide. To ensure compatibility with existing national stem volume tables, all models used only DBH and TH as input variables. The results showed that all three models achieved high predictive accuracy (R2 > 0.997), with XGBoost yielding the lowest RMSE (0.0164 m3) and MAE (0.0126 m3). Although differences in performance among the models were marginal, the machine learning approaches demonstrated flexible and generalizable alternatives to conventional models, providing a practical foundation for large-scale forest inventory and the advancement of digital forest management systems.

1. Introduction

Stem volume is a key indicator of forest inventory, harvest planning, and estimation of biomass and carbon storage [1,2]. Accordingly, the accurate and reliable prediction of stem volume is essential not only for implementing sustainable forest management, but also for establishing a nationwide forest monitoring system [3,4,5]. In South Korea, empirical regression models using easily measurable field attributes, such as diameter at breast height (DBH) and total tree height (TH), have been widely employed for volume estimation [6,7,8]. National forest inventory data and stem volume tables have also been developed using regression-based approaches [9,10,11,12,13].
Although these regression-based models are advantageous in terms of practical applicability, they have structural limitations in capturing the complex curvature of the stem form and the nonlinear interactions between input variables [14]. Stem shape is influenced by various factors, including species characteristics, site conditions, and stand structure, often resulting in multivariate and nonlinear forms [15,16]. Therefore, more flexible modeling approaches are required.
Chamaecyparis obtusa (Siebold & Zucc.) Endl is one of the most economically and ecologically valuable plantation species in South Korea [17,18,19,20,21,22]; it is widely used for high-quality timber production and is recognized for its potential in climate change mitigation [23,24,25]. Despite its importance, research on stem volume prediction for this species largely relies on indirect regression-based methods. Machine learning models developed using precise stem profile data obtained from felled trees are rare [26]. Machine learning (ML) models offer a compelling alternative to regression-based approaches, as they can automatically learn complex and nonlinear patterns from data without requiring a predefined functional form. These methods often achieve higher accuracy and robustness, making them increasingly attractive for improving stem volume estimation in modern forest management systems [27,28]. In recent years, machine learning (ML) techniques have been increasingly applied globally to estimate stem volume in species such as Pinus pseudostrobus and Cedrus libani. These studies demonstrated notable improvements in predictive accuracy over conventional regression-based approaches [29,30]. This global trend supports the necessity of applying machine learning approaches to Chamaecyparis obtusa, a major plantation species in South Korea. Recent studies have demonstrated that machine learning models can accurately predict stem volume using only DBH and TH, which are the most practical and non-destructive variables in field surveys [31]. This approach offers a balance between measurement simplicity and predictive performance, making it highly applicable in operational forestry.
Recent advancements in ML have led to its widespread adoption across various fields, including forestry. ML algorithms often outperform traditional regression models in both predictive accuracy and generalizability, owing to their capacity to learn complex nonlinear relationships [32,33,34,35,36,37,38,39]. In particular, the development of remote sensing technologies, such as LiDAR, unmanned aerial vehicles (UAVs), and satellite imagery, has enhanced the ability to map forest structure at scale [40,41,42,43,44]. However, the reliability of remote sensing models remains heavily reliant on high-quality ground reference data, with stem profile measurements from felled trees serving as a crucial benchmark for this purpose [45]. In South Korea, the application of ML techniques to stem volume prediction remains limited despite its growing utility. Most previous South Korean studies have either been constrained to specific species or regions or relied on complex input variables that are not compatible with the national forest inventory framework [6,8,14]. Furthermore, only a few studies have quantitatively compared traditional regression models and ML algorithms under minimal input conditions. Specifically, these studies have only used diameter at breast height (DBH) and total tree height (TH), which are the primary field variables used in practice. A key limitation of existing stem volume tables currently used in South Korea is their discrete structure, as volume values are provided only for fixed integer combinations of DBH and TH [9]. This limits the precision of volume estimation for trees with measurements that fall between these predefined classes. In contrast, ML algorithms do not require a predefined functional form or fixed input ranges. These algorithms can flexibly accommodate continuous and high-dimensional inputs, allowing for more refined and adaptive volume predictions.
To address these gaps, the present study aimed to develop and evaluate stem volume prediction models for C. obtusa using approximately 1000 destructively sampled trees collected across South Korea. The models were built using two widely adopted treto ML algorithms, and their performance was compared to that of traditional regression models under identical input conditions. We hypothesized that ML models, by effectively capturing the nonlinear structural characteristics of tree stems, would yield superior predictive accuracy even when limited to DBH and TH. This study offers a practical and field-applicable modeling framework that supports the ongoing shift toward data-driven forest inventory and promotes the advancement of precision forestry in South Korea.

2. Materials and Methods

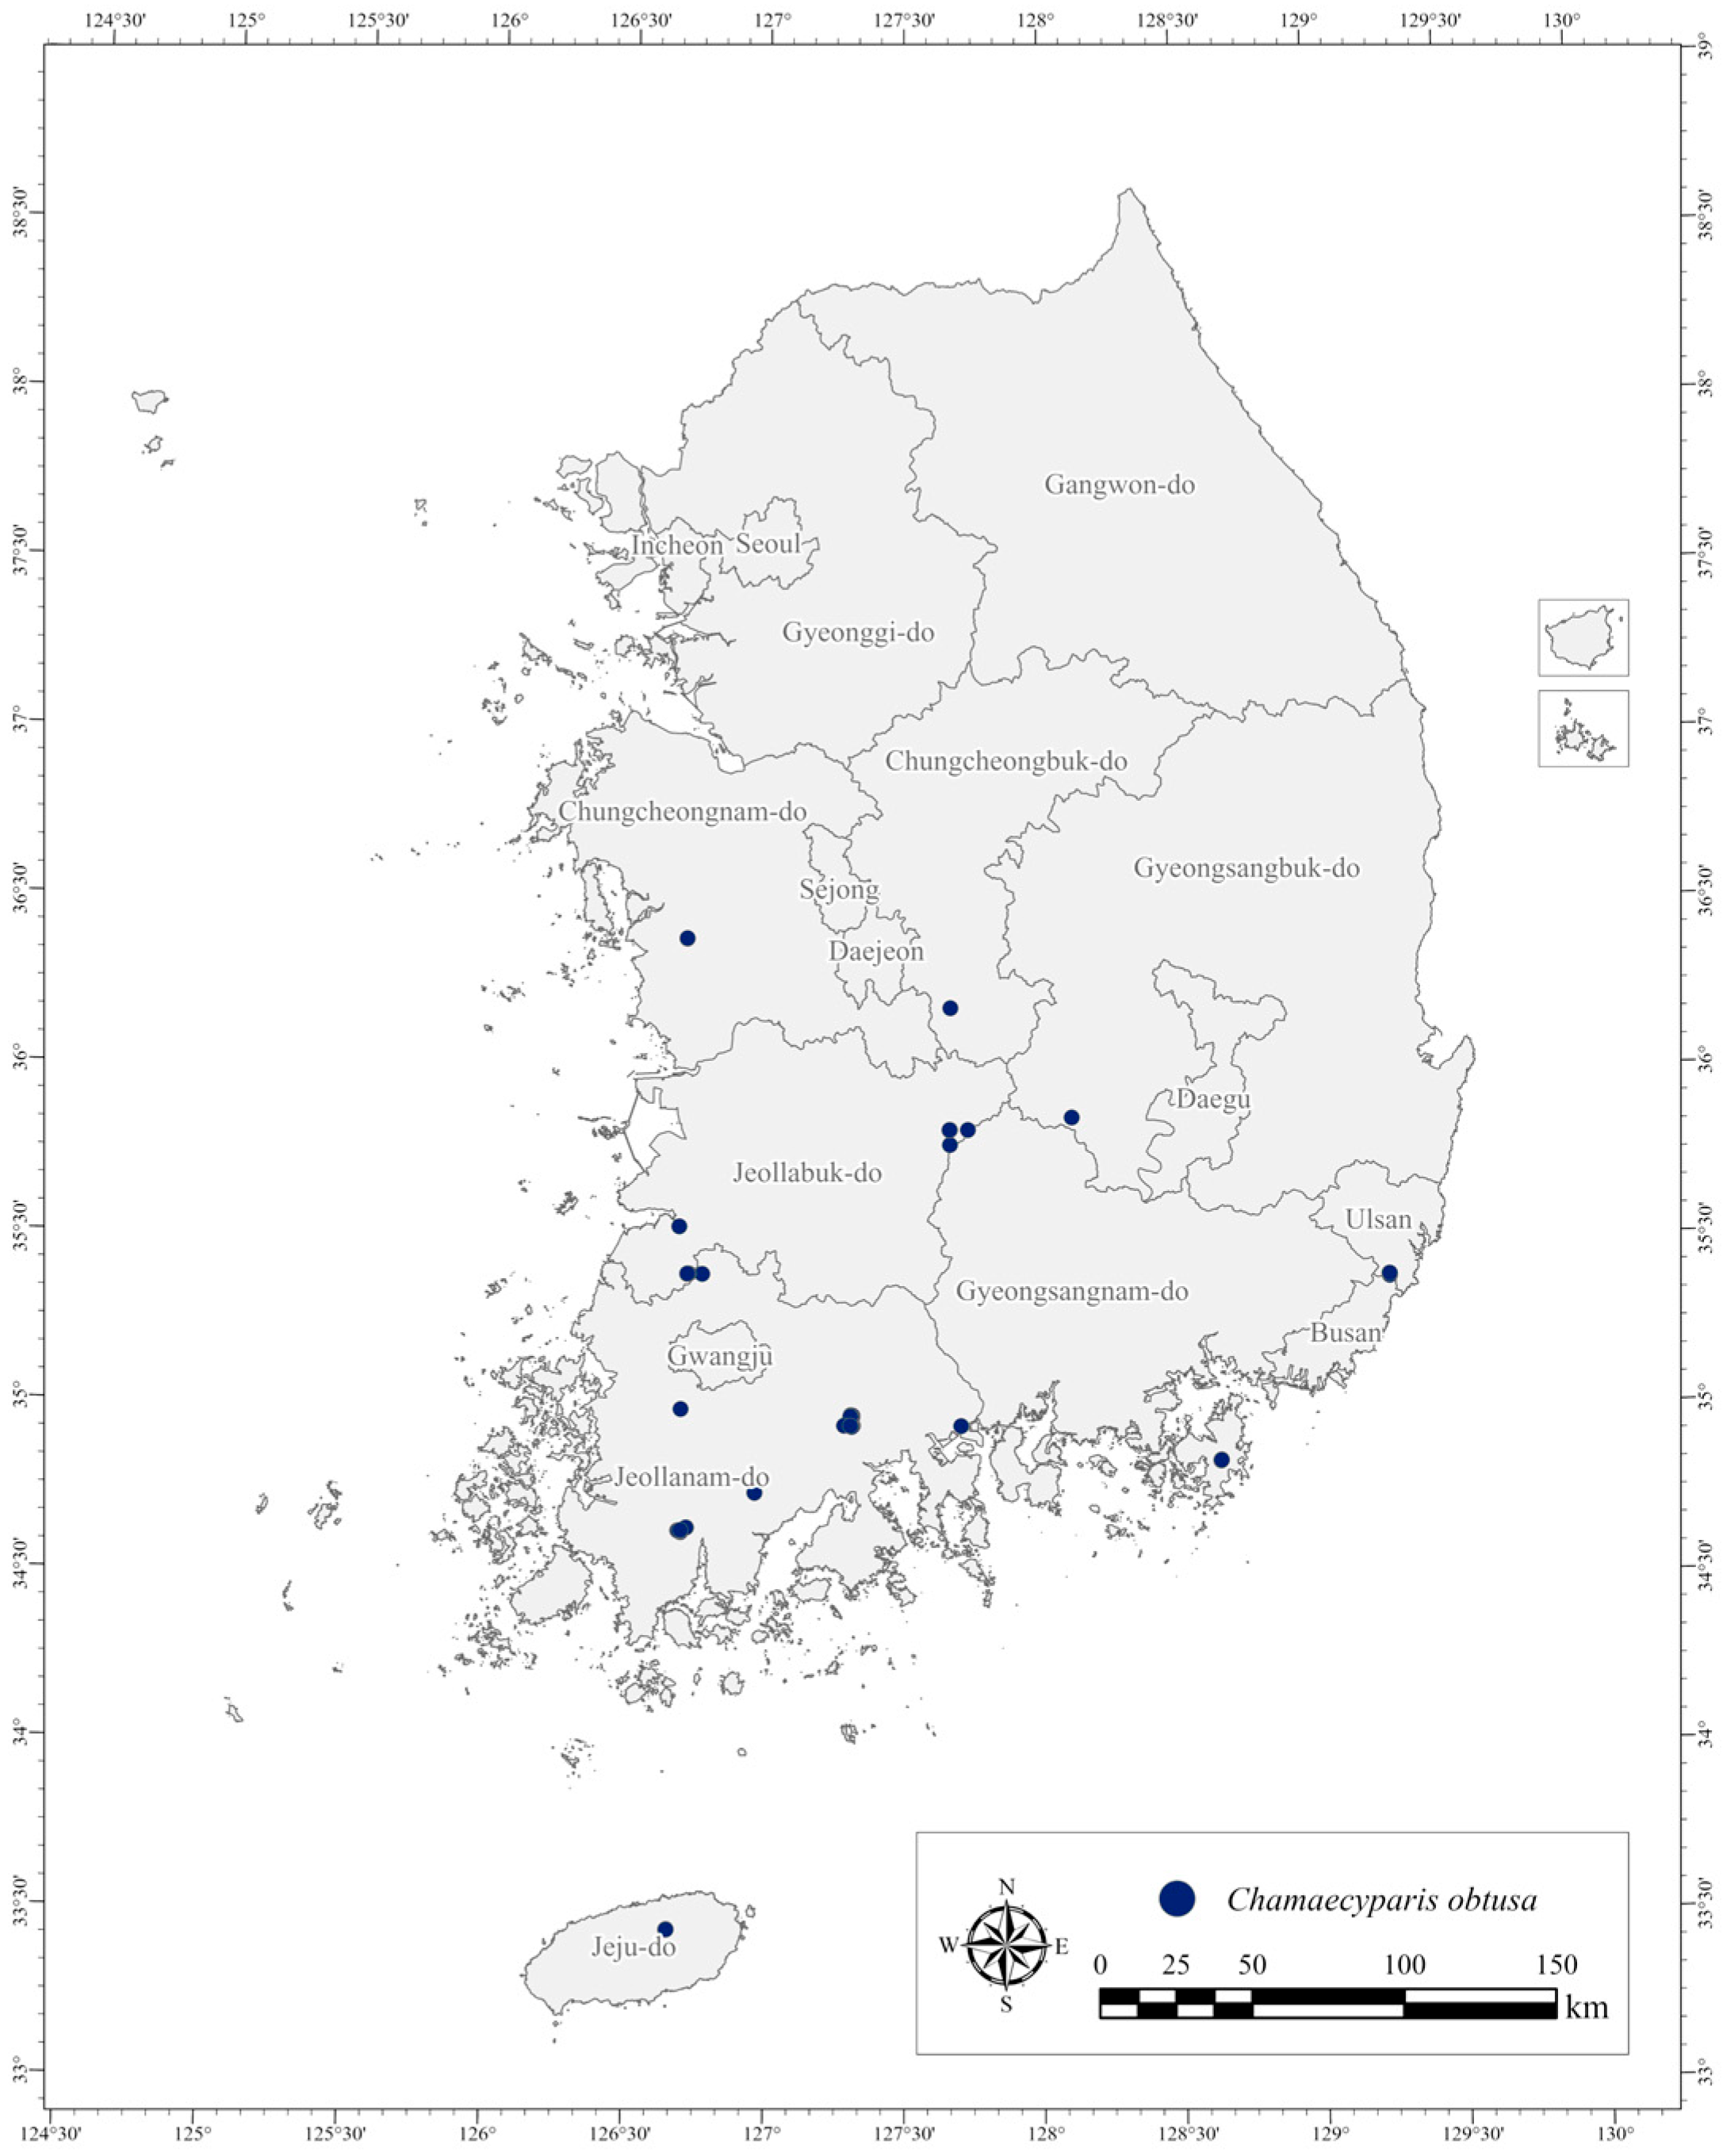
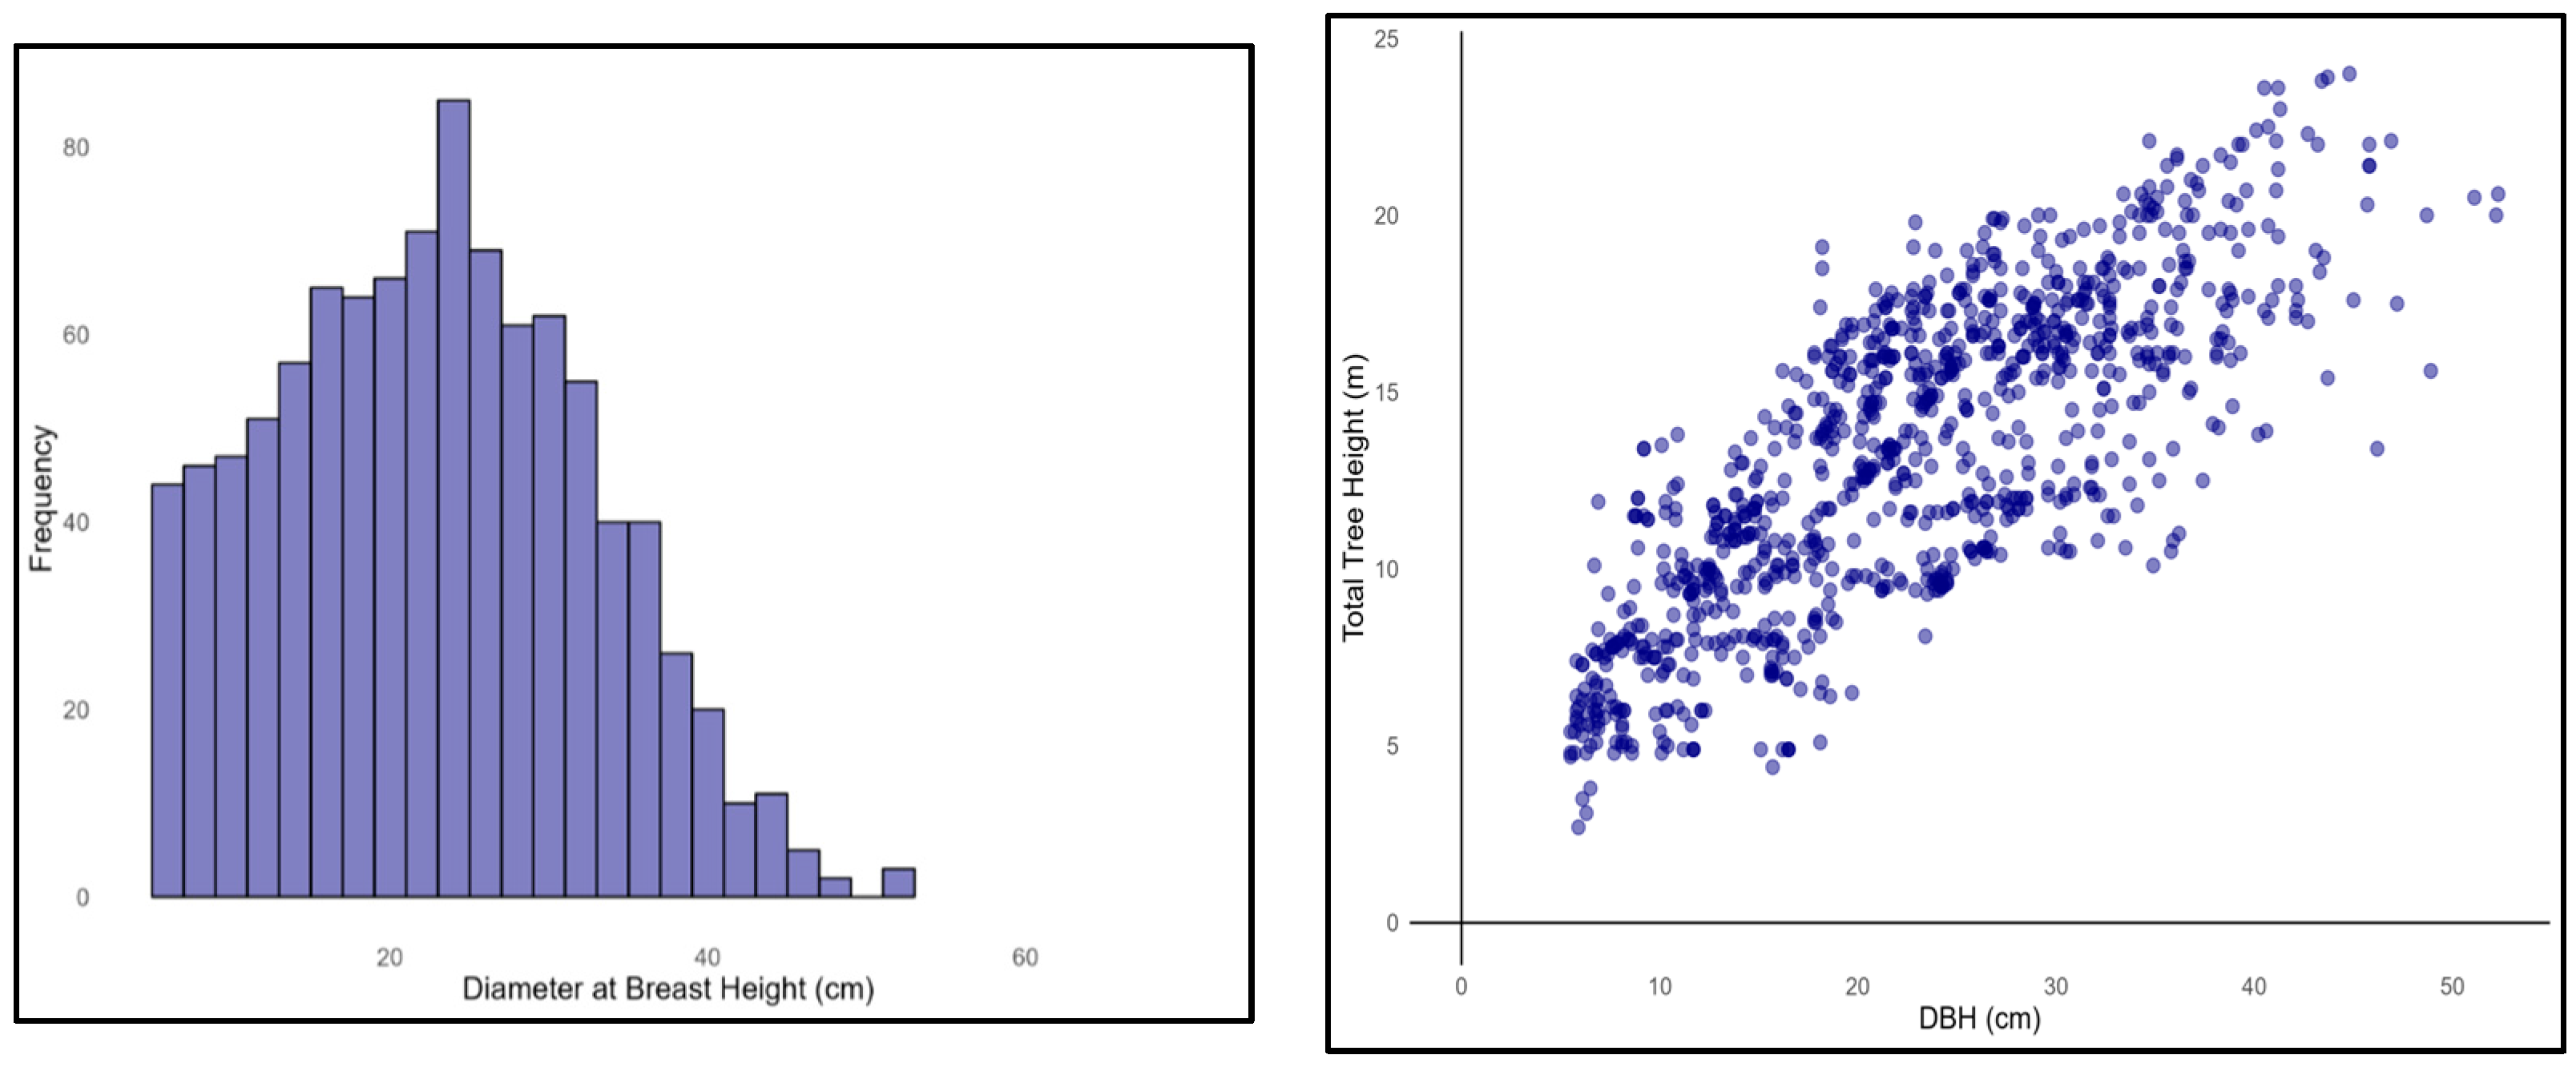
2.1. Study Materials

This study was conducted using stem profile data collected from Chamaecyparis obtusa plantations in the southern region of South Korea. A total of 1000 sample trees were obtained from 318 sites nationwide, and sample selection followed a stratified random sampling method based on diameter at breast height (DBH) classes, ensuring regional representativeness and variability (Figure 1). For each felled tree, tree attributes such as DBH and total height (TH) were measured, and stem profile data were collected at 2 m intervals to construct relative height (RH)-based stem profiles. Site variables including slope, elevation, and aspect were also recorded. Although additional variables could be obtained from felled trees, this study focused on using only DBH and TH as input variables, with the aim of developing a practical and generalizable model based on non-destructive and easily measurable field attributes. This approach was intended to ensure compatibility with existing national stem volume tables and to enhance the operational applicability of the model. Previous studies have also demonstrated that these two variables alone can achieve sufficiently high predictive accuracy, supporting their use in large-scale forest resource assessments.
The dataset underwent quality control procedures, including the removal of outliers and treatment of missing values. Before modeling, an exploratory data analysis was conducted to examine the distribution of the key variables. The results show that the mean DBH was 22.72 cm, the mean TH was 13.28 m, the mean stand age (SA) was 32.83 years, and the height to the crown base (HCB) was 5.10 m (Table 1). The histogram (Figure 2) indicates that the DBH values are concentrated between approximately 15 and 30 cm, whereas the scatter plots reveal a clear positive correlation between DBH and TH (Figure 2 and Figure 3).

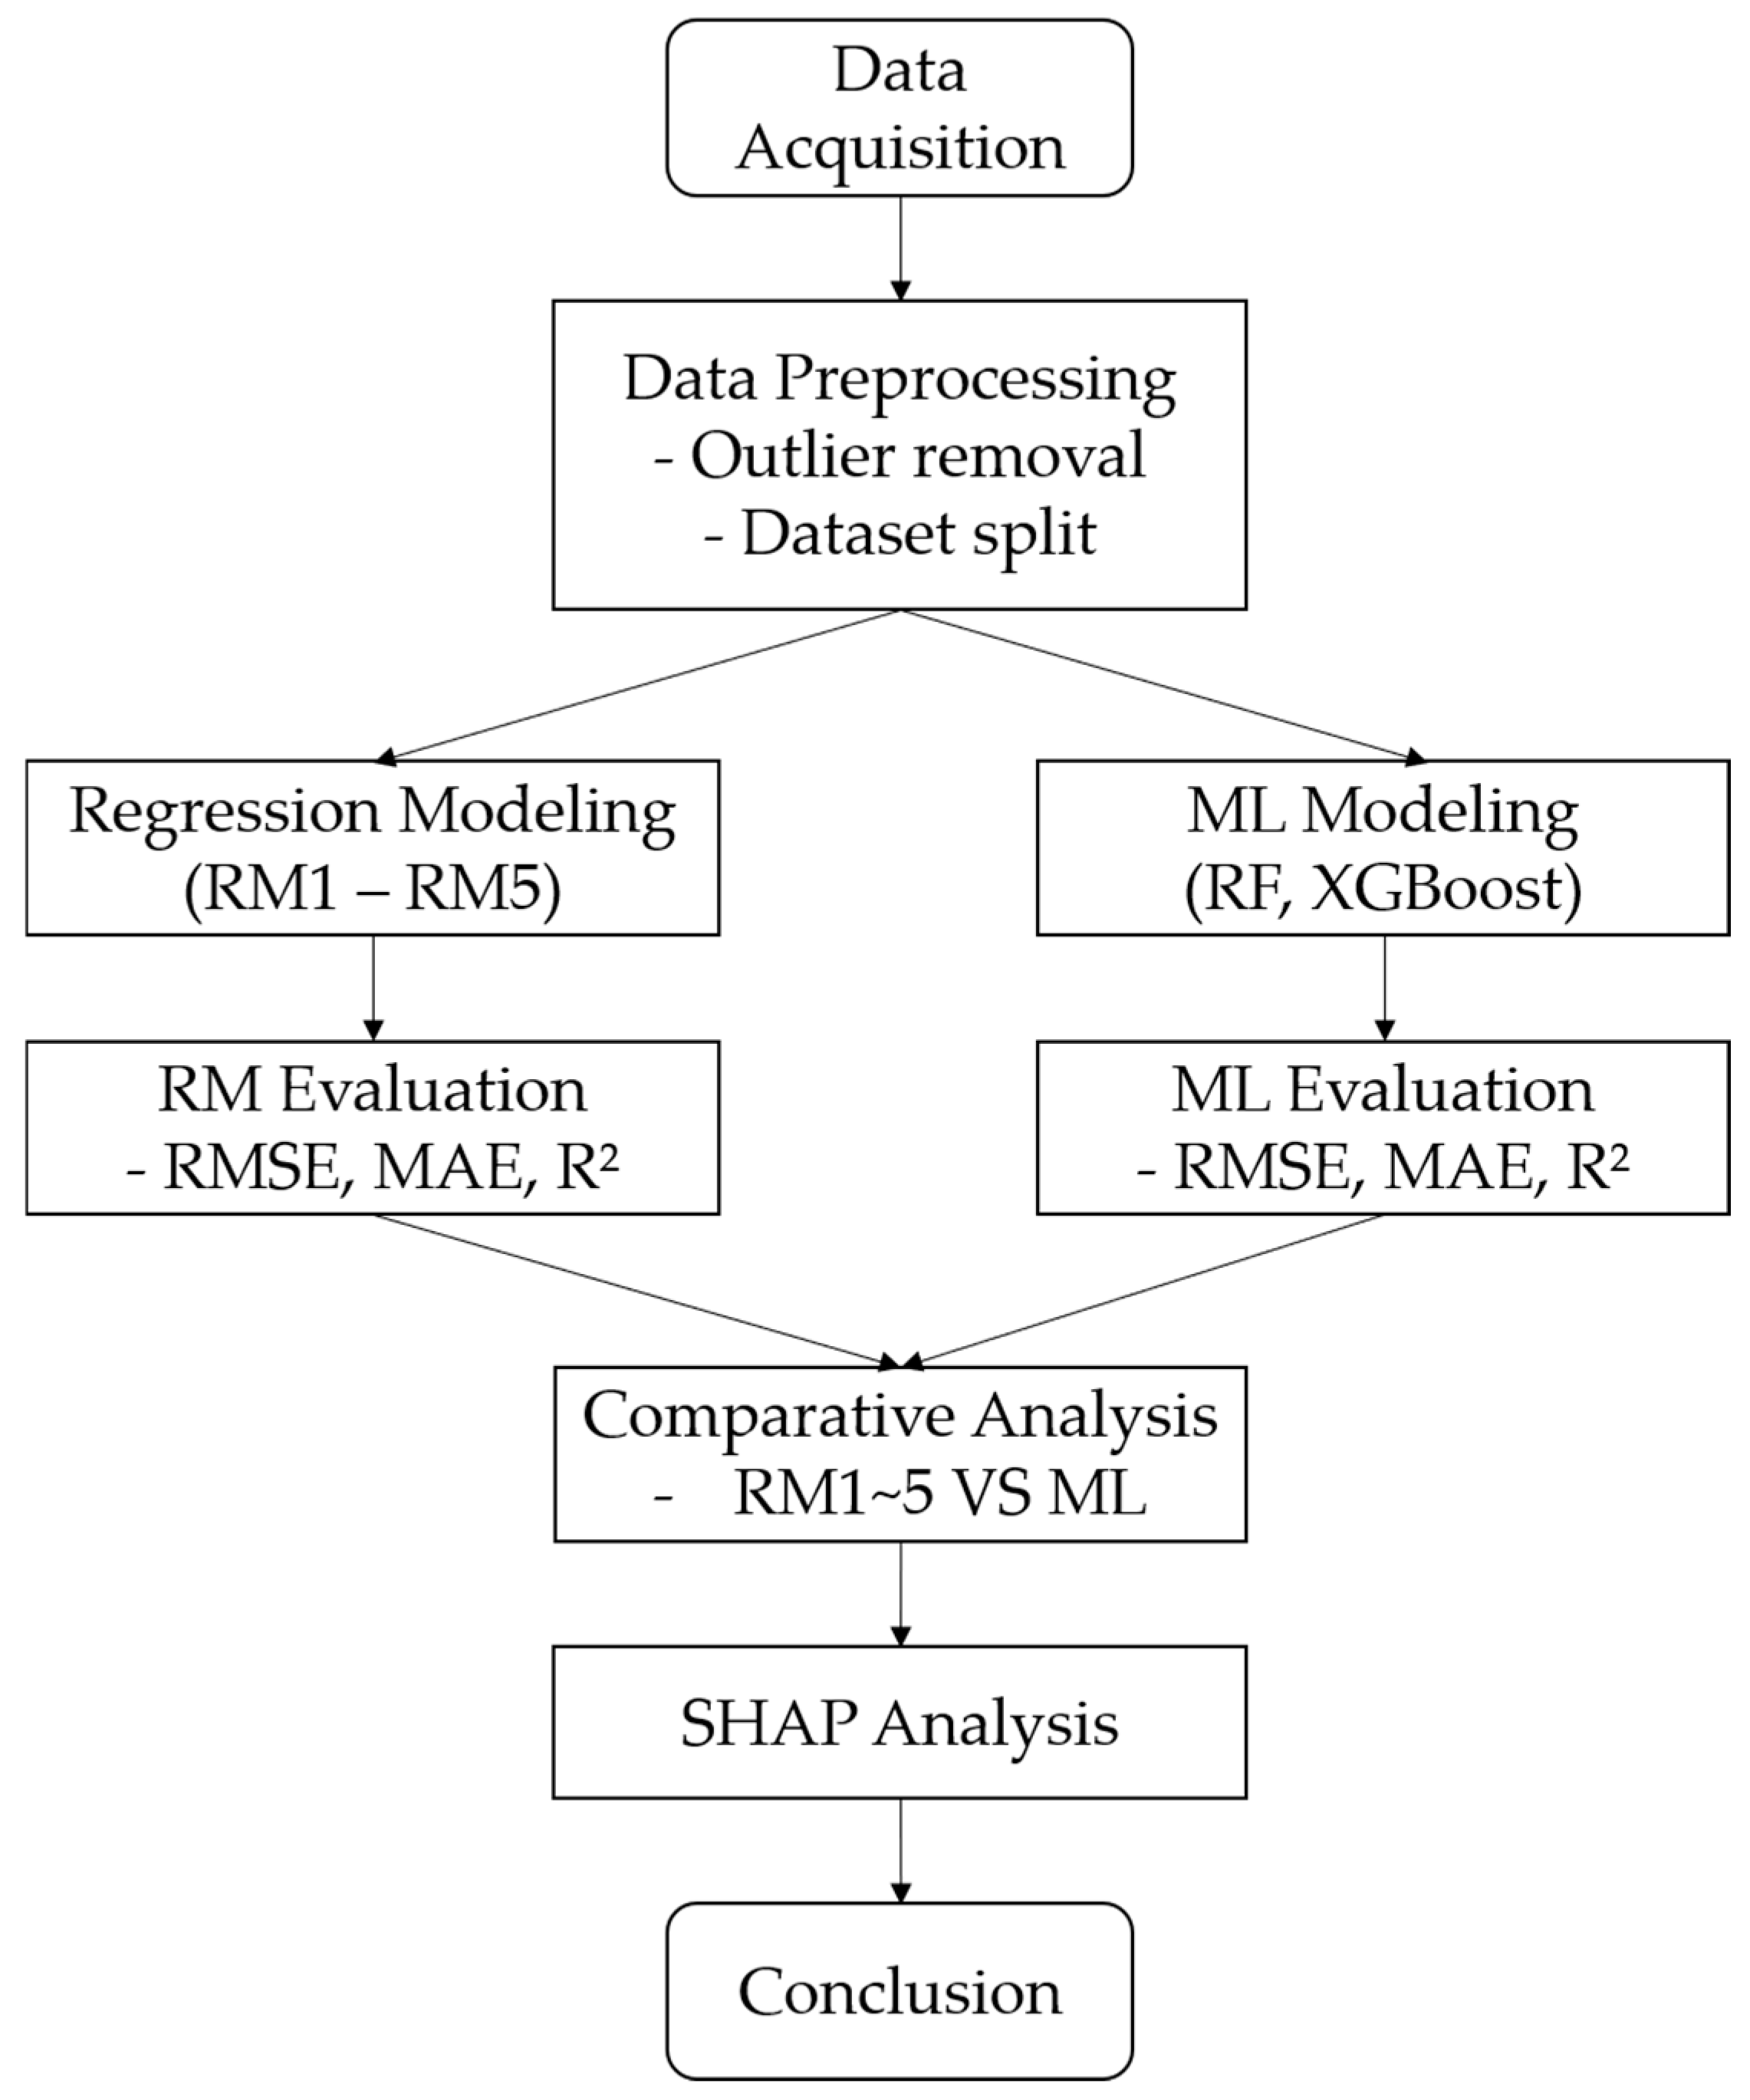
2.2. Analytical Methods

The study compared traditional regression models and machine learning algorithms to predict individual tree stem volumes based on detailed stem profile data. Before analysis, the dataset underwent preprocessing, including the removal of outliers, imputation of missing values, and normalization of variables. The data were randomly split at the individual tree level using a unique tree identifier, with 70% assigned to the training set, 15% to the validation set, and the remaining 15% to the test set. To ensure statistical independence, data from the same tree were not distributed across multiple subsets. A fixed random seed was applied to ensure reproducibility of the results, and it was confirmed that no overlap of individual trees occurred across the three subsets.
For the traditional regression models, the model coefficients were estimated using the training dataset, and the predictive performance was evaluated using the test dataset. A validation dataset was not used in this study. In contrast, for the machine learning models, namely RF [32] and Extreme Gradient Boosting (XGBoost) [33], the validation set was employed to optimize the hyperparameters and prevent overfitting during training. Consequently, although the dataset was partitioned in the same manner, its usage differed between the model types depending on the methodological requirements.
The reference stem volume for each tree was calculated using numerical integration at 10 cm intervals based on the Kozak (1988) [46] stem taper model. This estimation approach aligns with the current methodology used in the development of official stem volume tables in South Korea. The model assumes a neiloid shape for the basal section, a paraboloid shape for the middle section, and a cone shape for the upper section, adding the volume of each segment to derive the total stem volume [9].

2.2.1. Traditional Regression Models (RM1–RM4)

This study employed four traditional regression models that have been widely proposed in previous studies to estimate stem volume: the Kopezky–Gehrhardt, Brenac, Modified Spurr, and Schumacher–Hall models [47,48]. All models were log-transformed to achieve linearization and were labeled RM1 through RM4.
RM1: Kopezky–Gehrhardt model (univariate; based on DBH only)
ln(V) = β0 + β1·ln(DBH2)
RM2: Brenac model (based on DBH and its reciprocal form)
ln(V) = β0 + β1·ln(DBH) + β2·(1/DBH)
RM3: Modified Spurr model (power function based on DBH2 and H)
ln(V) = β0 + β1·ln(DBH2·TH)
RM4: Schumacher–Hall model (log–log-linear form)
ln(V) = β0 + β1·ln(DBH) + β2·ln(TH)
These models cover a range of formulations, from simple univariate regressions to bivariate models with interaction terms, and are structured to accommodate linearization through logarithmic transformation.

2.2.2. Custom Polynomial Regression Model (RM5)

To address the limitations of traditional regression models and to explore a structurally comparable framework to machine learning approaches, a custom polynomial regression model (RM5) was additionally formulated.
RM5: Polynomial regression model
V = α + bD + cH + dD2 + e(TH)
This model explicitly incorporates nonlinearities and interaction effects among input variables, thereby enhancing both interpretability and predictive accuracy compared with machine learning-based models.

2.3. Machine Learning-Based Predictive Models

In this study, two widely used tree-based ML algorithms, RF and XGBoost, were applied to predict individual tree stem volumes based on stem profile measurements. These ensemble regression models effectively capture nonlinear relationships, interactions among variables, and high-dimensional data structures, thereby addressing the structural limitations of traditional regression models. These models are effective in predicting the complex, nonlinear relationships inherent in stem volume prediction. Specifically, RF was selected for its resistance to overfitting and its ability to provide interpretable insights through variable importance measures. XGBoost was employed for its superior predictive accuracy, computational efficiency, and ability to effectively capture abrupt and irregular curvature variations along the stem profile [32,33].
All machine learning models were trained and evaluated using the training, validation, and test datasets described in Section 2.2. Only tree-level morphological variables (DBH and TH) were used as input features to ensure comparability with conventional stem volume tables. Environmental variables at the study sites were excluded.
The model was implemented in R. RF was implemented using the Random Forest package, with the number of trees (ntree) set to 500 and the number of variables tried at each split (mtry) determined automatically. XGBoost was implemented using the xgBoost package. Preliminary experiments were conducted to tune key hyperparameters, including the learning rate (eta), maximum tree depth (max_depth), subsample ratio (subsample), and column sampling ratio (colsample_bytree). The optimal values were set to eta = 0.05, max_depth = 4, subsample = 0.8, and colsample_bytree = 0.8. The number of boosting rounds (nrounds) was determined as 870, incorporating an early stopping criterion. This tuning process contributed to both the predictive stability and generalization performance of the model.

2.4. Model Training and Evaluation

The model performance was evaluated using four key metrics: RMSE, MAE, coefficient of determination (R2), and FI.
The RMSE measures the magnitude of the prediction error, with lower values indicating higher predictive accuracy. The MAE represents the mean absolute difference between the predicted and observed values, and is less sensitive to extreme errors than the RMSE. R2 indicates how well the model explains the variance in the observed data, with values closer to 1 indicating greater explanatory power. The FI is a supplementary metric used to compare model performance across regression models with different scales or transformations (e.g., log-transformed or nonlinear models). It was calculated as the standard error of the estimate divided by the derivative of the response variable. A lower FI indicates a better model fit, making it useful for evaluating model adequacy regardless of unit differences.
All analyses were conducted using R software (version 4.3.2). Traditional regression models were implemented using the lm() and nls() functions, whereas machine learning models were developed using the randomForest and xgboost packages. Hyperparameter tuning was performed using the Caret package, and data visualization was performed using ggplot2 and patchwork. A summary of the evaluation metrics is presented in Table 2.

2.5. Statistical Comparison of Model Performance

To assess whether the predictive performance differed significantly among the models, pairwise statistical tests were conducted using the performance metrics (RMSE, MAE, R2, and FI) obtained from the test dataset. The testing procedure followed the steps described below:
Normality assessment: The Shapiro–Wilk test (Shapiro–Wilk test()) was applied to the differences in prediction errors between the model pairs to assess normality. A p-value ≥ 0.05 was considered to indicate that the normality assumption was met.
Paired t-test: If the normality assumption was satisfied, a paired t-test (t-test()) was used to examine whether the performance differences between the two models were statistically significant. The null hypothesis assumed no difference in model performance, and p-values < 0.05 were interpreted as indicating a statistically significant difference.
Wilcoxon signed-rank test: If normality was not satisfied or the distribution was unclear, a non-parametric Wilcoxon signed-rank test (wilcox.test()) was applied. This method does not require the assumption of normal distribution, and is particularly useful for small sample sizes. All statistical significance was evaluated at a significance level of α = 0.05.
In addition to p-value interpretation, model comparisons are discussed in terms of practical applicability and effect size to provide a more comprehensive understanding of performance differences beyond statistical significance.
Furthermore, SHAP (SHapley Additive Explanations) analysis was conducted to enhance the interpretability of the machine learning models [49]. SHAP decomposes model predictions into the additive contributions of each input feature, allowing for the interpretation of variable importance at both global and instance-specific levels [50,51]. Unlike conventional feature importance rankings, SHAP enables detailed explanations for individual predictions, thereby improving both the transparency and practical usability of the models. To effectively apply this SHAP-based interpretation, the selection of machine learning models in this study was intentionally limited to tree-based ensemble algorithms—Random Forest and XGBoost. These models are natively compatible with TreeSHAP, a computationally efficient implementation of SHAP specifically optimized for decision tree structures, which ensures fast, stable, and consistent attribution of feature contributions. In contrast, other machine learning algorithms such as Artificial Neural Networks (ANN), Support Vector Regression (SVR), and MARS require the use of model-agnostic approaches like KernelSHAP for interpretation. These methods tend to be computationally intensive and may result in less stable or interpretable outputs, particularly when modeling complex, nonlinear relationships. Therefore, this study focused on SHAP-compatible tree-based models to strike a balance between predictive performance, interpretability, and practical applicability in operational forest management settings. To visually summarize the modeling framework and comparative evaluation steps described above, the overall workflow of this study is presented in Figure 3. The flowchart outlines the sequential procedures from data acquisition to model interpretation, including both regression- and ML-based approaches.

3. Results

3.1. Predictive Performance of Traditional Regression Models

The predictive performance of the traditional regression models RM1 through RM5 was evaluated using the test dataset, and the results are presented in Table 3.
The univariate models RM1 and RM2, which rely solely on DBH or its reciprocal transformation, yielded RMSE values of 0.0994 and 0.0995, respectively, and R2 values of around 0.935. These results indicate that relying solely on DBH or its simple functions is insufficient to achieve high accuracy in stem volume prediction.
In contrast, the bivariate log-transformed models RM3 and RM4 demonstrated superior predictive performance. RM3 achieved an RMSE of 0.0128 and an R2 of 0.9989, while RM4 recorded the best performance across all metrics, with an RMSE of 0.0123, an MAE of 0.0087, an R2 of 0.9990, and a Furnival Index (FI) of 0.0124. These results highlight the effectiveness of log–log-linear regression structures that simultaneously consider both DBH and total height (TH) for predicting stem volume. The custom polynomial regression model RM5 showed slightly lower performance than RM4, with an RMSE of 0.0146, an MAE of 0.0112, and an R2 of 0.9986. Nevertheless, it maintained high explanatory power. RM5 was designed to extend the conventional bivariate regression model by incorporating nonlinear and interaction terms. This approach aimed to better capture the complex patterns that cannot be fully explained by a simple linear relationship between DBH and TH. In terms of model simplicity and predictive stability, RM4 appears to offer the best overall balance.
In summary, the traditional univariate models (RM1 and RM2) were limited in prediction accuracy, while the bivariate log–log model (Schumacher–Hall, RM4) showed the highest overall performance. Therefore, it was considered the most effective benchmark model for predicting the stem volume of Chamaecyparis obtusa.

3.2. Predictive Performance and Interpretation of Machine Learning Models

The results of stem volume prediction using RF and XGBoost are presented in Table 4. Both the models demonstrated high predictive accuracies. The RF model yielded an RMSE of 0.0187, MAE of 0.0086, and R2 of 0.9977, indicating a lower error and greater explanatory power than traditional regression models. This improvement is likely attributable to the capacity of the tree-based structure to learn complex stem shape variations effectively.
The XGBoost model achieved even lower prediction errors, with an RMSE of 0.0164, an MAE of 0.0068, and the highest R2 value of 0.9982. These results reflect the effectiveness of boosting algorithms that iteratively correct residual errors and incorporate regularization to prevent overfitting. The observed model performance is consistent with previous studies, which have reported the superior accuracy of machine learning models for stem prediction tasks.

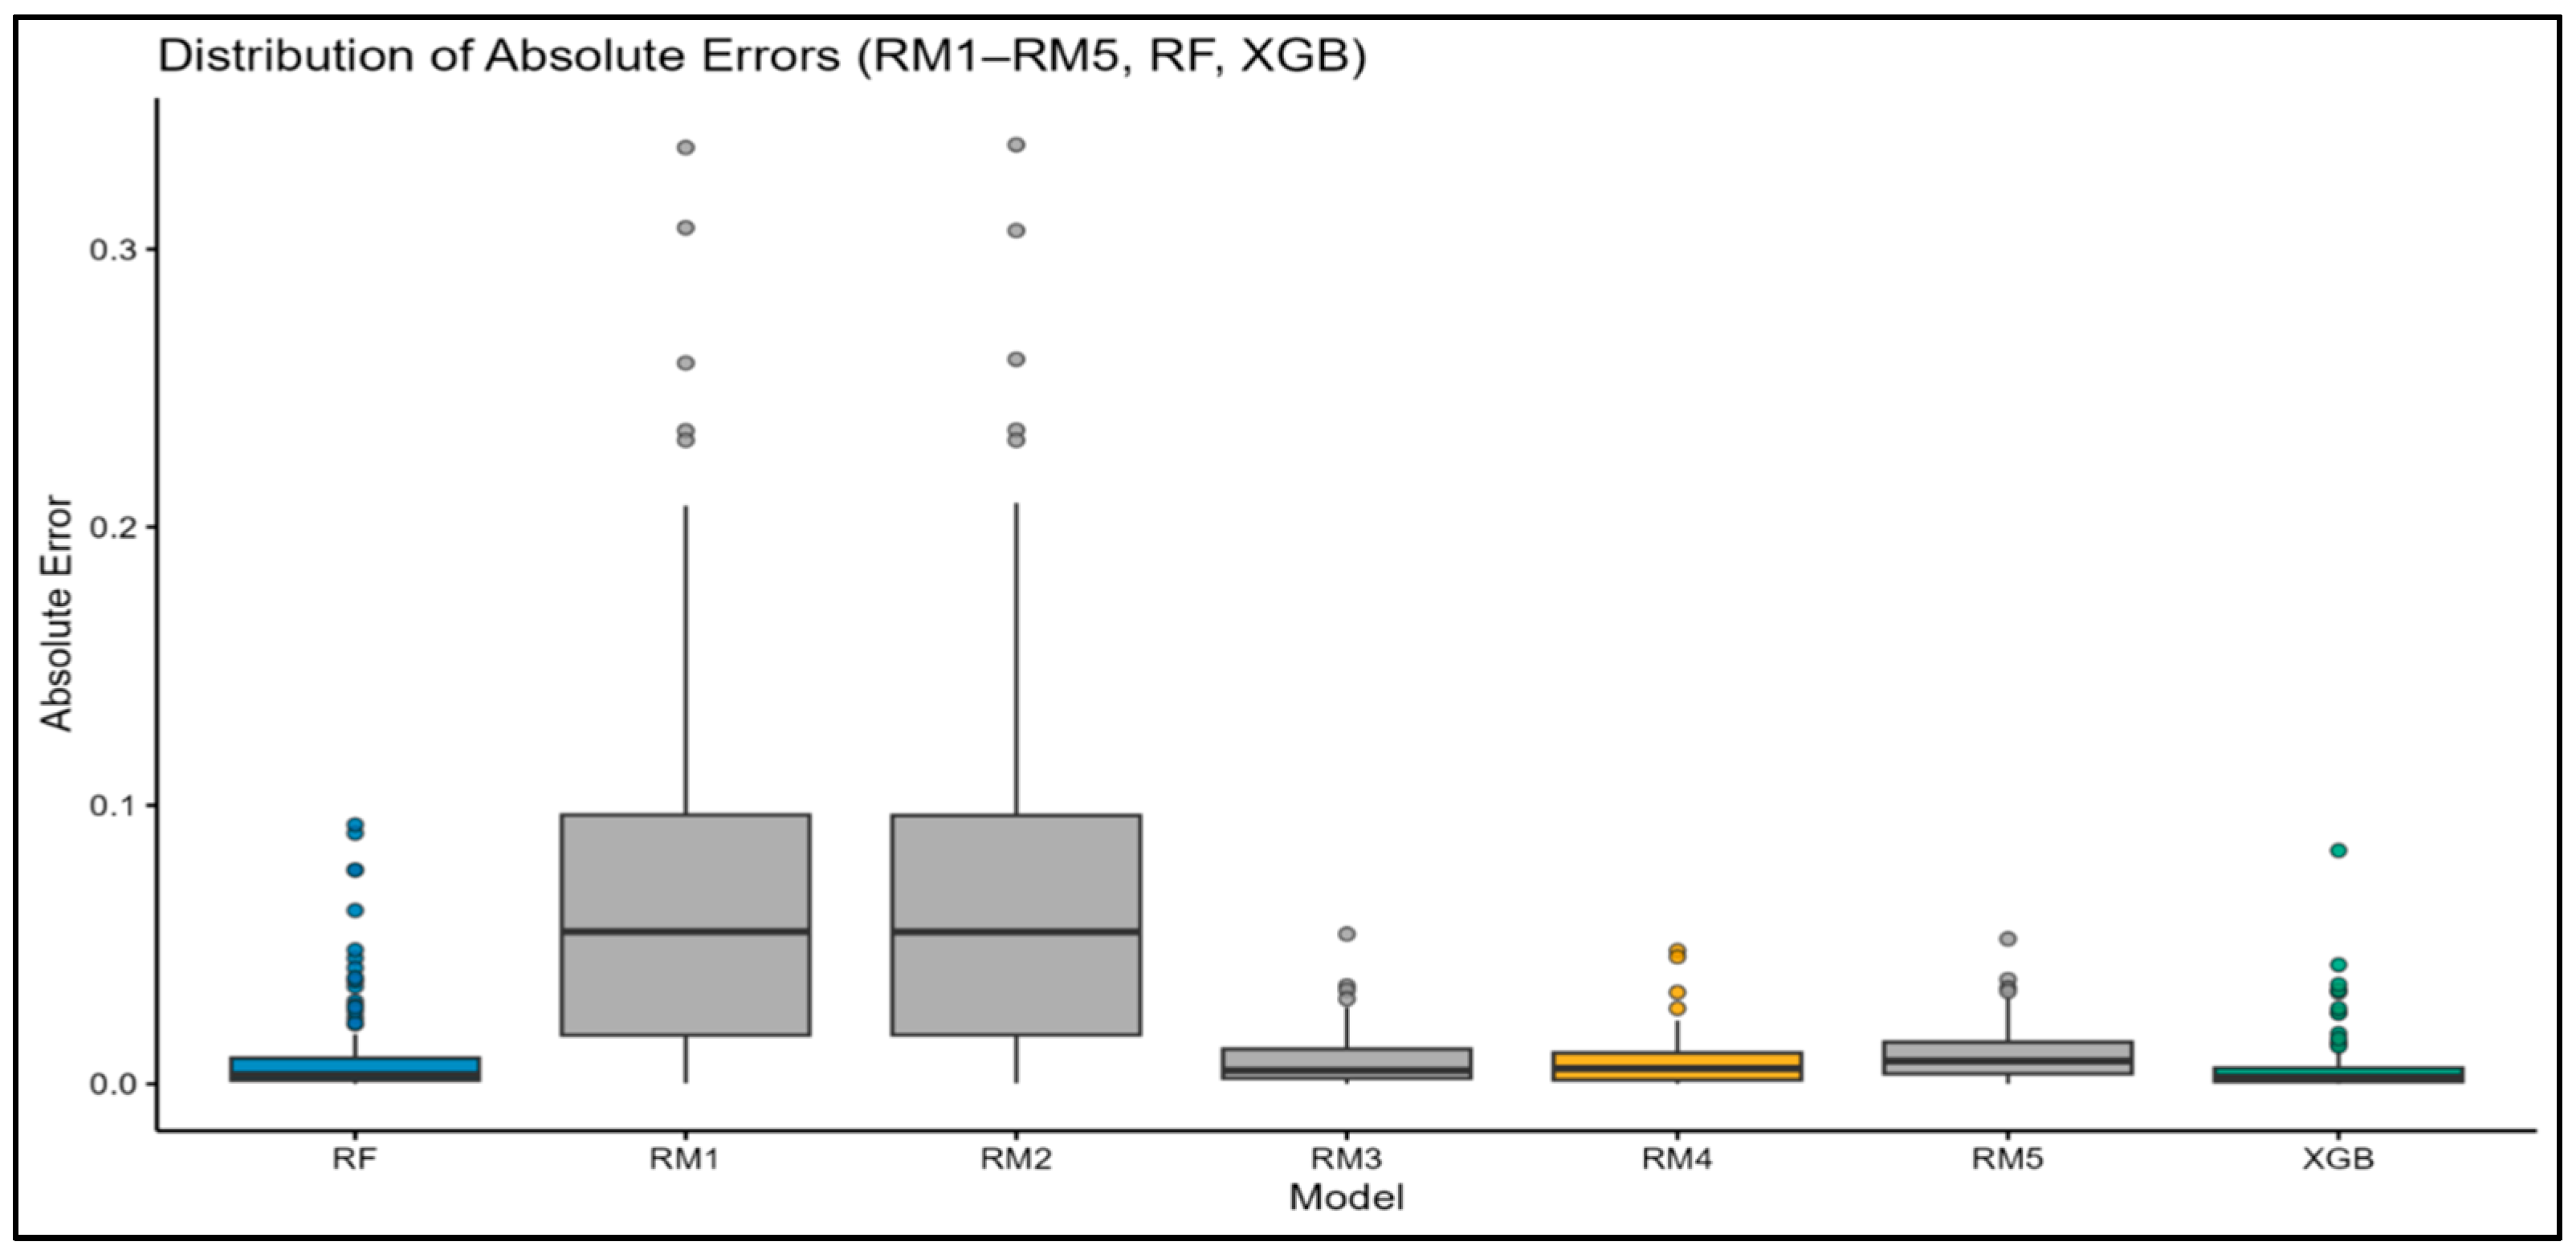
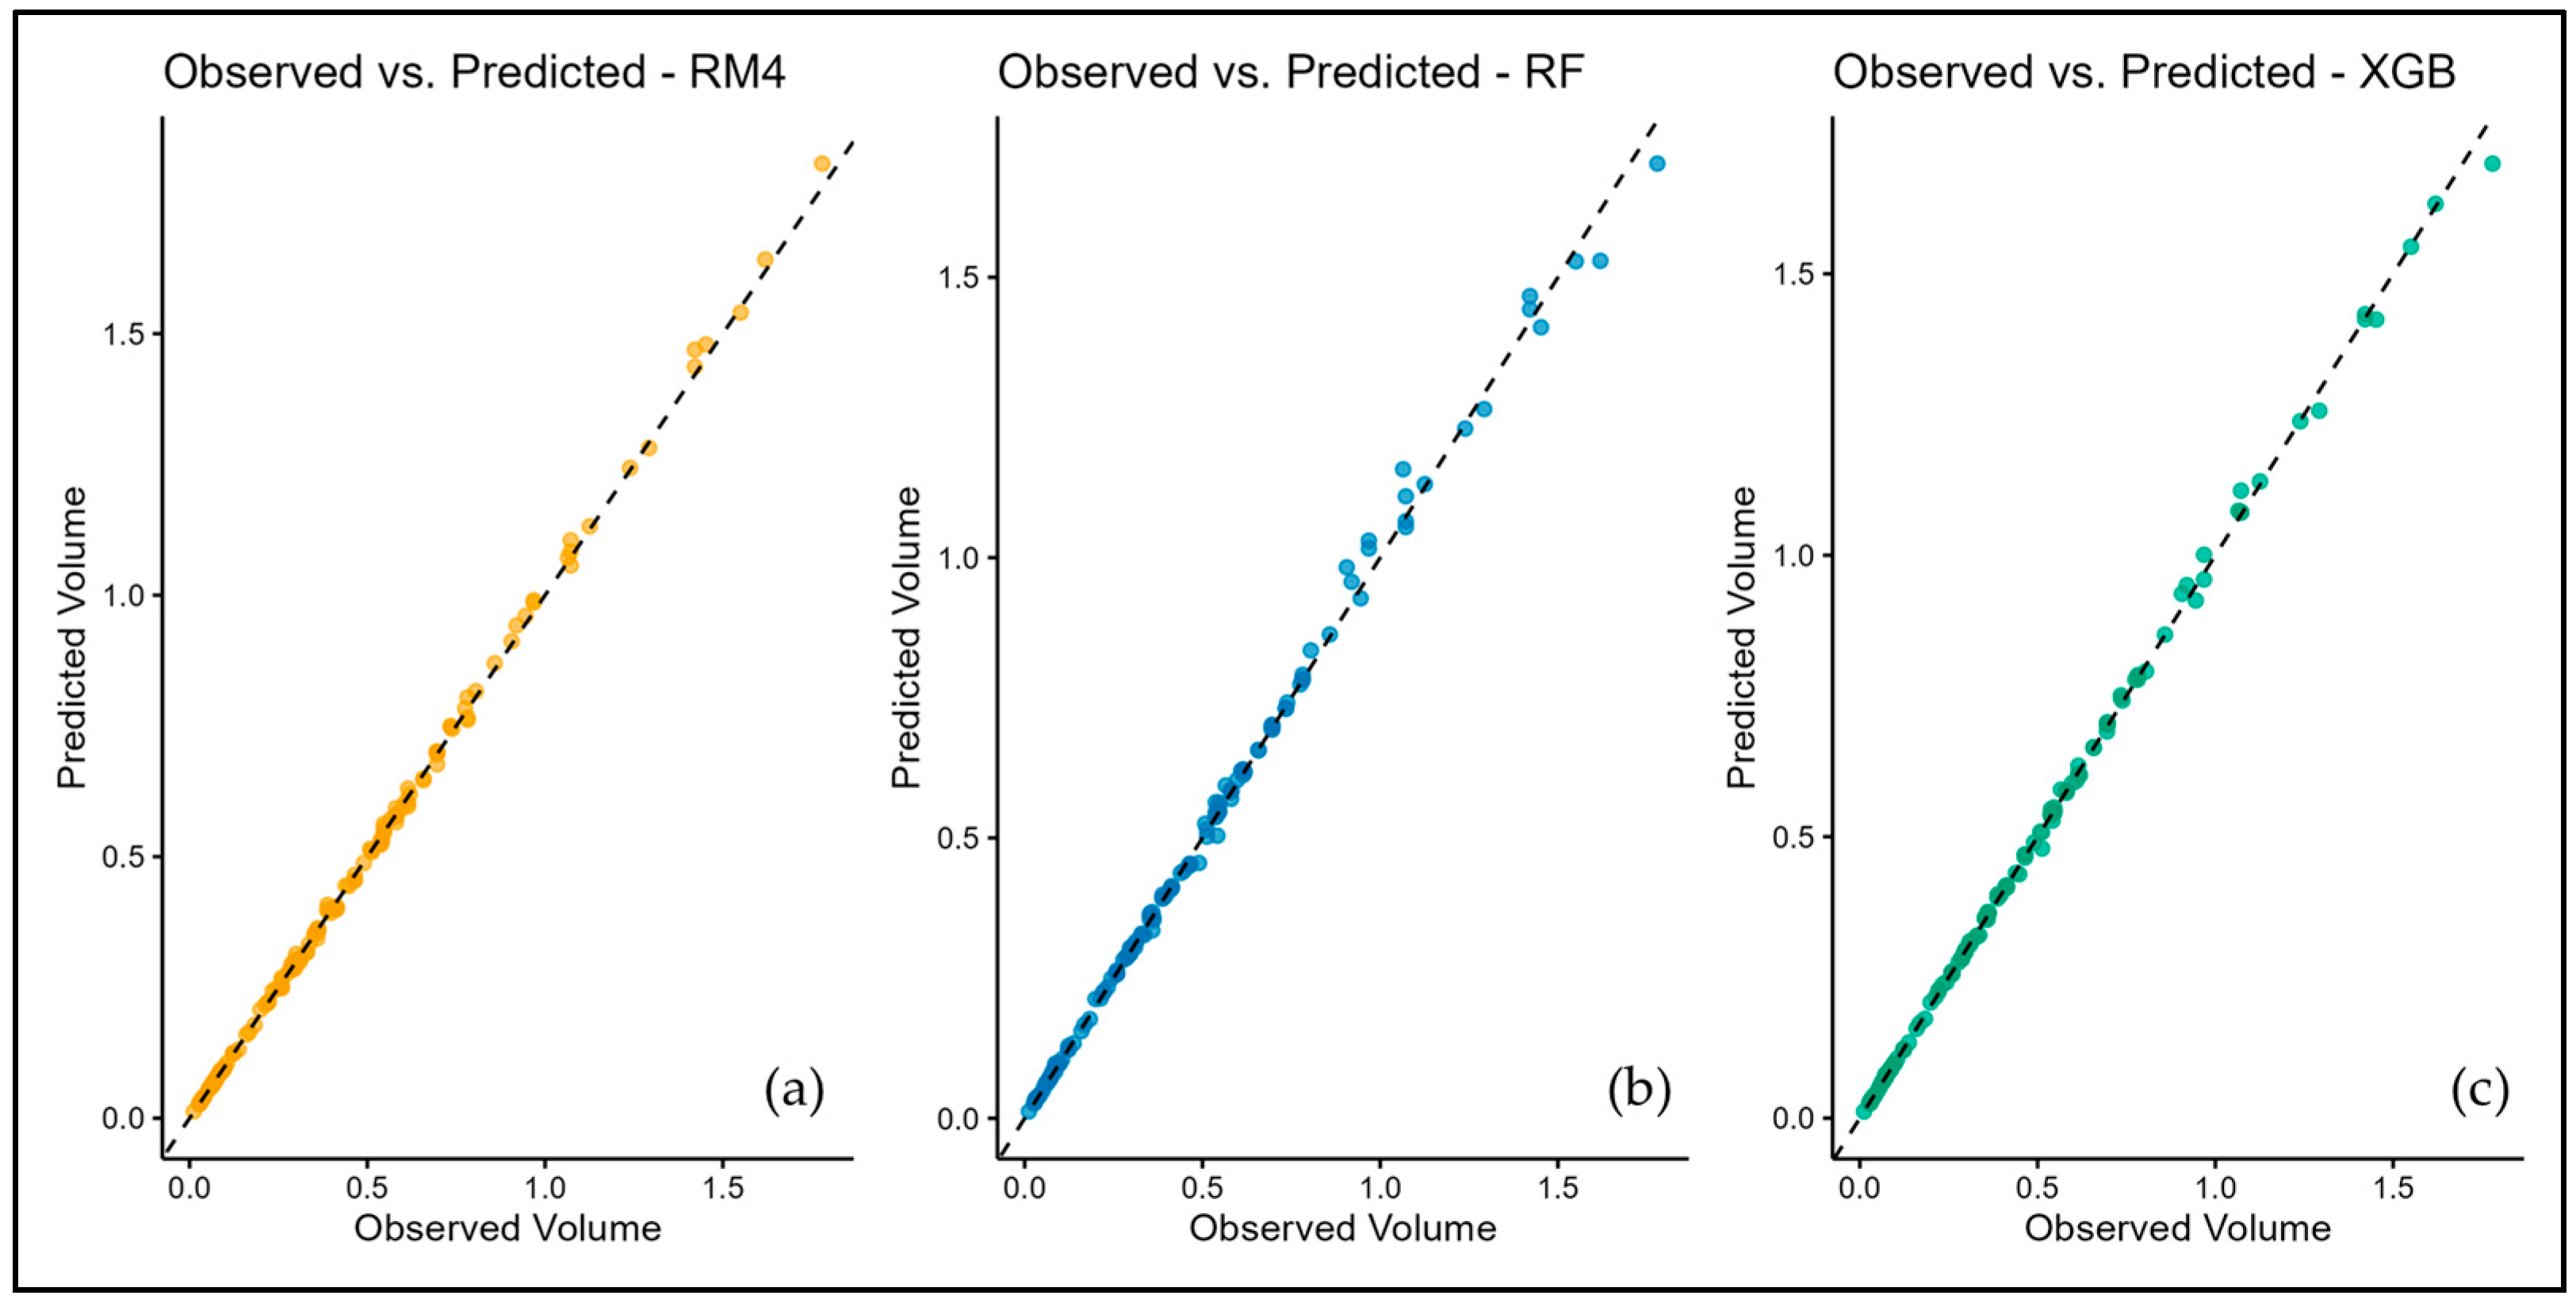
3.3. Statistical Testing and Visual Interpretation of Model Performance Differences

To compare predictive performance among models, we conducted statistical tests based on absolute errors from the test dataset. XGBoost, which showed the lowest prediction error, was used as the reference. The absolute error distributions of the traditional regression models (RM1–RM5) and RF were compared against those of XGBoost.
The Shapiro–Wilk test rejected the normality assumption for all model pairs (p < 0.05), leading to the use of the non-parametric Wilcoxon signed-rank test. All models showed statistically significant differences from XGBoost (p < 0.001; Table 5), confirming that XGBoost consistently produced lower absolute errors. These results were supported by visualizations. In the boxplot (Figure 4), XGBoost has the lowest median and the narrowest interquartile range, indicating both high accuracy and stability. RM1–RM3 shows higher and more variable errors, while RM4 and RF are more stable, but still less accurate than XGBoost. Scatter plots (Figure 5) show that all three models (XGBoost, RF, RM4) generally follow the 1:1 line, but XGBoost’s predictions are more tightly clustered, reflecting greater precision. Residual plots (Figure 6) further show that XGBoost has the smallest and most symmetric residuals around zero, while RM4 and RF exhibit wider error spreads.

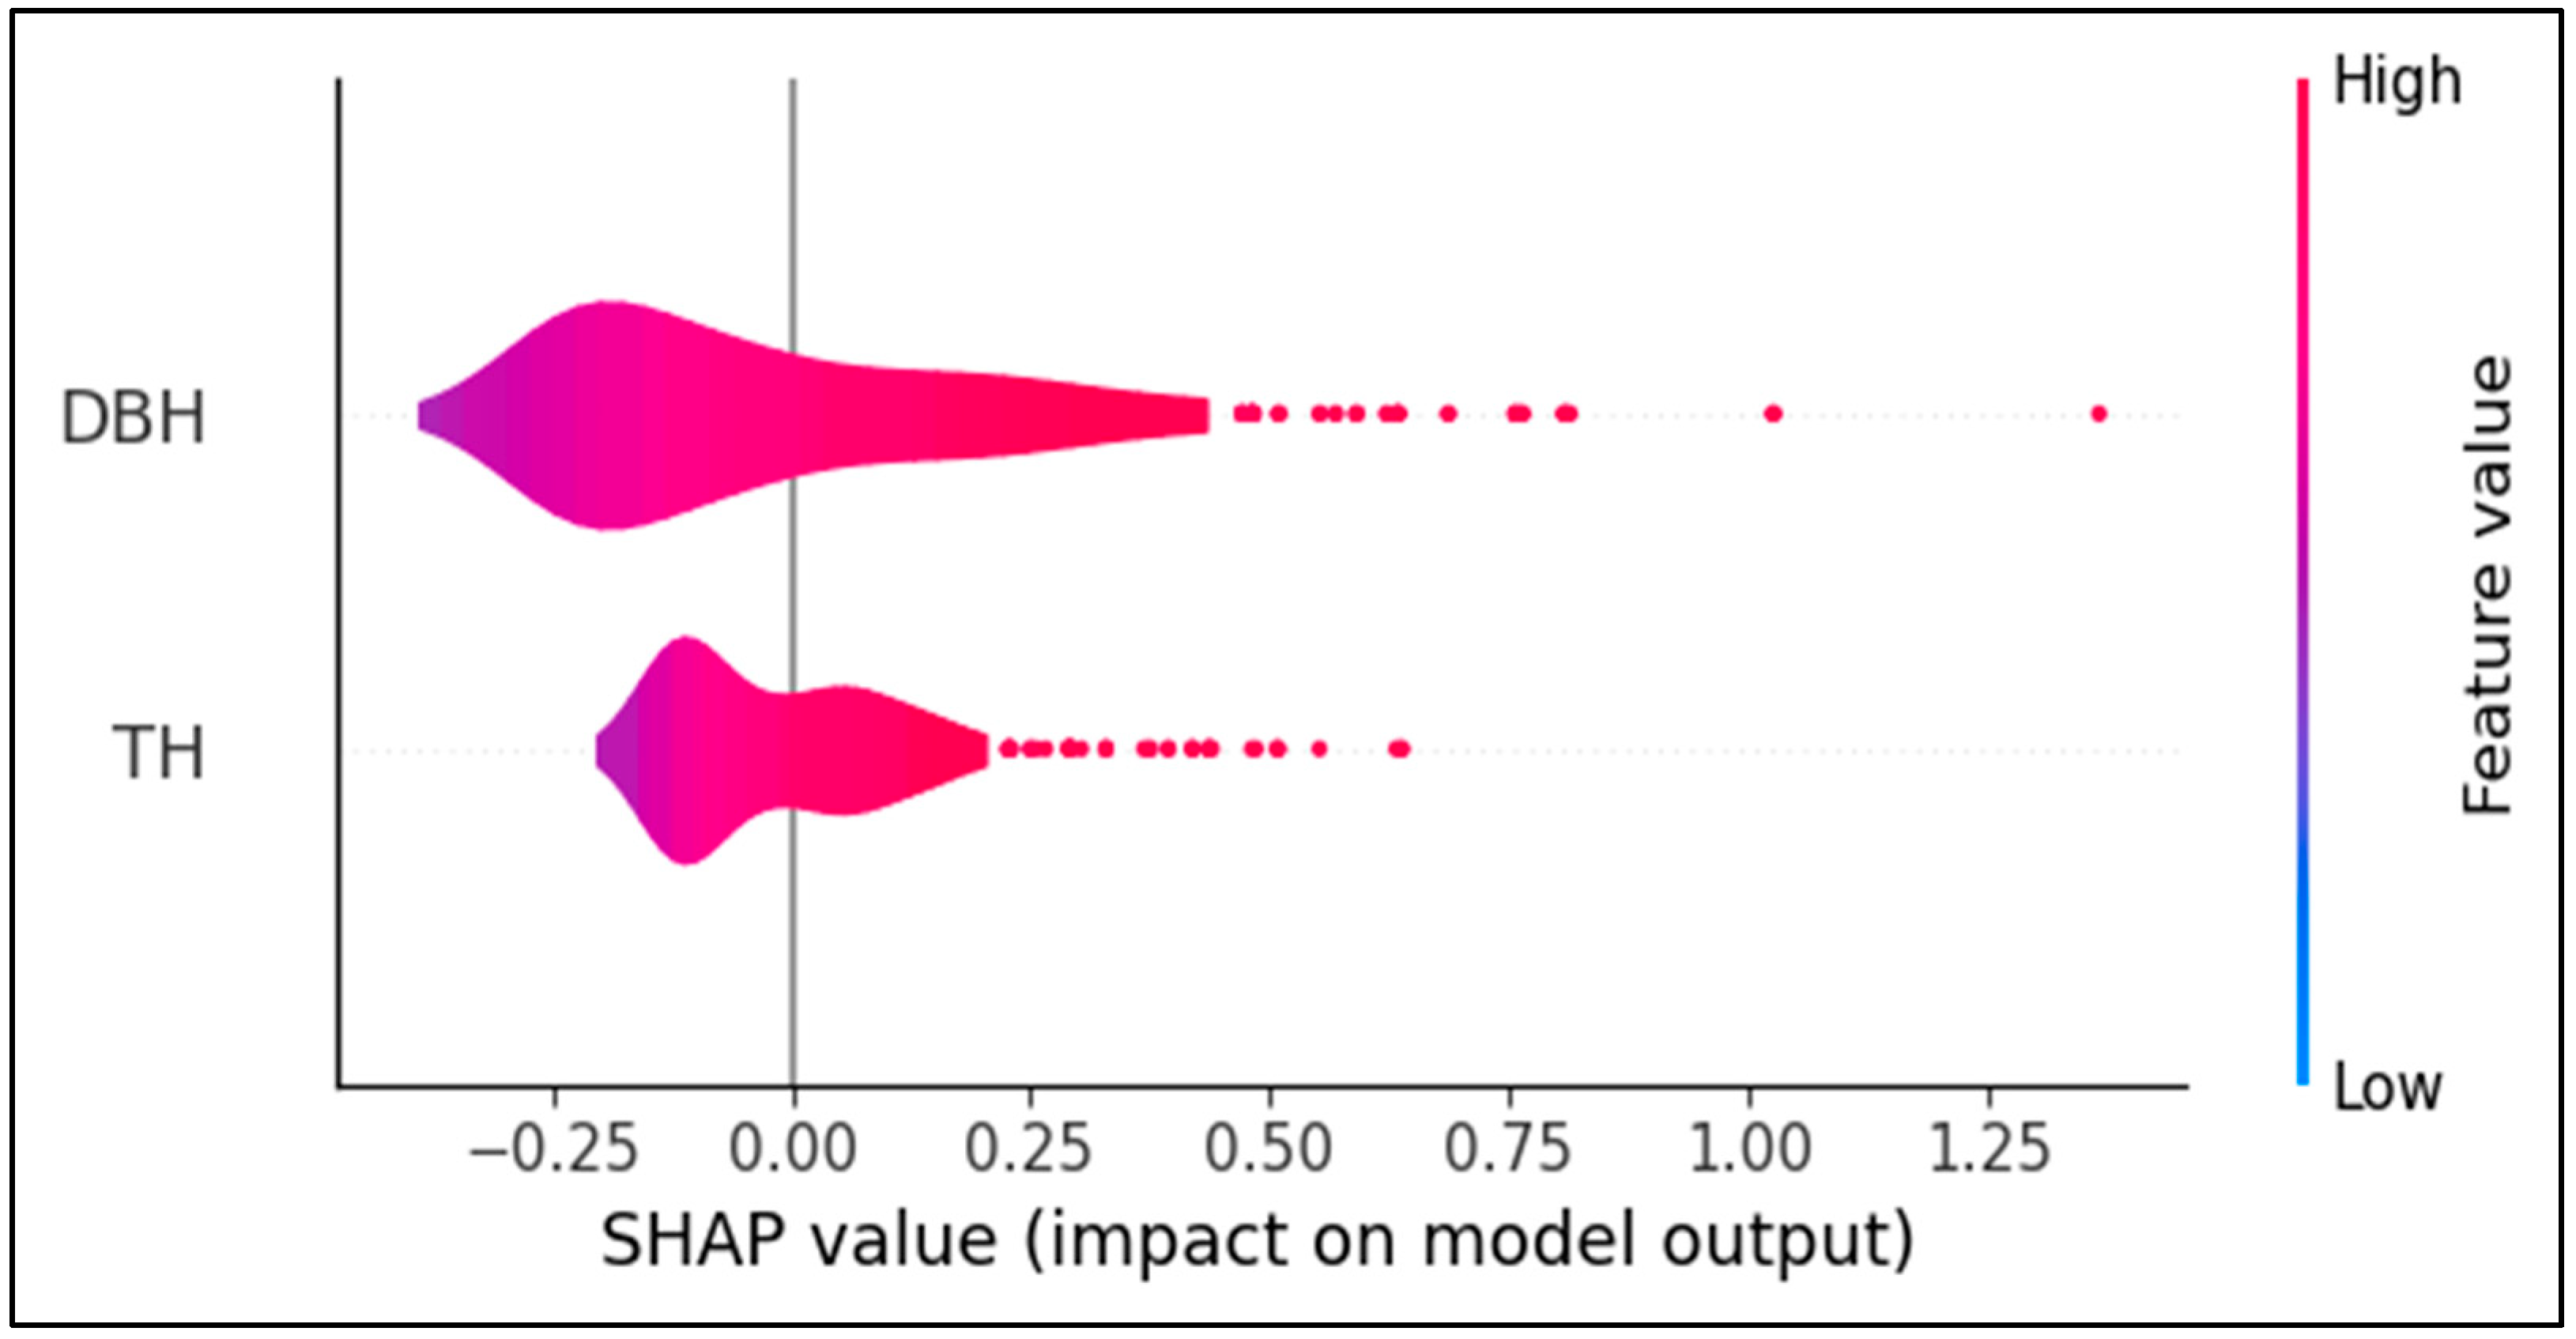
3.4. Variable Contribution Analysis Based on SHAP

To enhance model interpretability, the SHAP library in the Python (v3.13.5) environment was employed. Variable importance was visualized using a SHAP summary plot (Figure 7), which simultaneously presents both the magnitude and direction (positive or negative) of each the contribution of each feature to individual predictions. The analysis revealed that DBH was the most influential predictor for estimating stem volume, with SHAP values ranging broadly from approximately 0.0 to 1.25. An evident positive relationship was observed. Specifically, increased DBH values (represented in red) were associated with elevated SHAP values, indicating a consistent increase in predicted stem volume. In contrast, low DBH values (in blue) corresponded to negative SHAP values, suggesting a decreasing effect on the predictions. While TH exhibited a generally positive influence, its SHAP values were significantly smaller and more narrowly distributed than those of DBH, and were mostly concentrated between 0.0 and 0.5. This finding suggests that while TH contributes to the prediction, its relative influence is modest, and the model is less sensitive to variations in TH.
The distributional shape of the SHAP values also provides important insights. DBH exhibits a wider and more positively skewed distribution than TH, with some outliers. This finding indicates that the model responds sensitively to variations in DBH, particularly in large-diameter trees. In contrast, the SHAP values for TH are more tightly clustered around the center, with a narrower range, suggesting a more conservative influence on model output than that of DPH.
These results confirm that DBH plays a central role in predicting stem volume, and they align with operational forestry practices, where DBH is the most commonly measured variable in field inventories. However, the heavy reliance of the model on DBH may limit its ecological interpretability. This issue is further discussed in the following section.

4. Discussion

ML models offer clear advantages in modeling nonlinear forest attributes, demonstrating both flexibility and high predictive accuracy. Specifically, ANNs outperform traditional regression models, exhibiting lower RMSE and MAE values, with residuals symmetrically distributed around zero [52]. Moreover, ANN-based predictions are more tightly clustered around the 1:1 line than those of nonlinear mixed-effects models [53]. Notably, RF models exhibit lower median errors and narrower interquartile ranges than conventional taper models [35]. Additionally, Sanquetta et al. [54] confirmed the superior performance of ML-based approaches over traditional regression models in estimating carbon stocks. However, the application of ML models to predict stem volume remains limited in South Korea. The present study aimed to predict the individual stem volume of C. obtusa using only two easily measurable variables, including DBH and TH, and compared the predictive performance of traditional regression models (RM1–RM5) using ML algorithms (RF and XGBoost). Our results are consistent with earlier findings. Among the regression models, RM4 exhibited the highest accuracy, while XGBoost demonstrated the best performance among the ML models, achieving the lowest prediction error and the highest explanatory power. Statistically, XGBoost significantly outperformed all regression models, and SHAP analysis identified DBH as the most influential predictor. These findings demonstrate that accurate stem volume estimation is achievable even with a limited set of input variables, highlighting the potential of ML-based approaches for individual tree volume assessment.
In the present study, XGBoost outperformed both RF and traditional regression models in terms of absolute error, RMSE, and residual distribution, consistently with previous findings [35,52,53,54]. While the Wilcoxon signed-rank test confirmed that the differences in prediction error between XGBoost and the other models were significant (p < 0.001), the actual magnitude of the difference was relatively small. For example, the RMSE gap between XGBoost and RF was approximately 0.0023, which is negligible in practical forestry applications. Therefore, rather than claiming that XGBoost is categorically superior, it is more appropriate to consider it a robust and consistently high-performing alternative, particularly under constrained input conditions that rely only on DBH and TH.
Both DBH and TH exhibited considerable variability across the sampled trees; however, both the traditional regression model (RM4) and the XGBoost model yielded considerably high R2 values (≥0.998). While this result could be interpreted as overfitting, it can be explained by several methodological factors. First, the reference stem volumes were computed using numerical integration of high-resolution stem profiles. These values were derived from precise measurements and were largely free from observational noise, providing a reliable target for model training. Second, the log-transformed form of the Schumacher–Hall model linearized nonlinear stem curvature, improving its fit despite variable input dimensions. Third, the boosting framework and regularization mechanisms of XGBoost help to minimize residuals without overfitting, even under noisy or imbalanced data structures. Taken together, the high R2 values are consistent with the quality of the reference data and the modeling techniques applied, rather than being indicative of artificial inflation or model bias. Notably, this performance stability is largely attributable to the boosting-based architecture of XGBoost, which enhances consistency even under complex, nonlinear relationships. These characteristics are especially valuable in operational forestry, where stem form is often shaped by ecological and silvicultural variability. Furthermore, as non-parametric models, ML-based approaches are inherently adaptable to diverse datasets without the need for predefined equations, making them suitable for broader applications such as biomass or carbon stock estimation.
Another important finding of this study is the dominant influence of DBH, as revealed through SHAP-based feature importance analysis. The SHAP distribution revealed a distinct nonlinear pattern, with large-diameter trees contributing disproportionately to model predictions. This finding indicates that the model is particularly sensitive to dominant individuals, which has practical implications for forest management tasks such as determining rotation age or selecting high-value timber. Notably, similar patterns have been observed in previous studies. Yazdi et al. [55] emphasized the role of DBH in crown development modeling. Du et al. [56] identified DBH and related metrics as key predictors in stand productivity estimation. Moreover, Al Saim and Aly [57] reported that DBH, elevation, and vegetation indices were primary contributors to species classification, based on SHAP and remote sensing data. While the prominence of DBH is advantageous for operational applications, it may limit the ecological interpretability of the model, as it is routinely measured in forest inventories. To address this issue, future models should consider integrating additional variables that better capture tree architecture and site conditions, such as height to crown base (HCB), the site index, or the DBH-to-TH ratio. Furthermore, dynamic SHAP analysis using time-series data could provide valuable insights into how variable importance evolves across different stages of tree development.
This study had some limitations. Superficially, spatial stratification and spatial autocorrelation were not explicitly accounted for in the model design and validation. This decision was guided by practical considerations in South Korea, where nationwide stem volume tables are applied uniformly without regional differentiation. However, future research should explore validation strategies that incorporate spatial structures, such as region-based cross-validation or spatial block validation, to improve model generalizability in heterogeneous environments.
The findings of the present study support the potential of tree-based ensemble models as interpretable and practically viable alternatives to traditional regression-based stem volume equations used in South Korea. XGBoost demonstrated a well-balanced combination of predictive accuracy, model stability, and interpretability. Even with a minimal set of input variables, it aligned well with the data structure of the national forest inventory and proved useful for advancing precision forestry.

5. Conclusions

The present study did not aim to develop new ML algorithms. Rather, it sought to evaluate whether tree-based ensemble models, specifically RF and XGBoost, could serve as interpretable and practically viable alternatives to traditional regression-based stem volume equations used in South Korea. The findings demonstrated that accurate stem volume estimation is achievable even with a limited set of input variables, highlighting the potential of ML-based approaches for individual tree volume assessment. Notably, this study employed stem volumes calculated through numerical integration of stem profile data as reference values, ensuring structural consistency with national volume tables. Furthermore, the incorporation of SHAP-based variable importance analysis and statistical significance testing provided an interpretable and quantitative framework for model evaluation. Nevertheless, this study was limited to a single species and did not incorporate site-specific environmental variables or external datasets. Future research should evaluate the generalizability and practical applicability of the models using multi-species and multi-site datasets, and should develop external validation frameworks to support operational implementation.

Author Contributions

Conceptualization, C.K.; methodology, C.K. and D.K.; software, C.K.; validation, C.K. and J.K.; formal analysis, C.K.; investigation, C.K.; resources, C.K. and D.K.; data curation, C.K.; writing—original draft preparation, C.K.; writing—review and editing, C.K. and D.K.; visualization, C.K.; supervision, J.K.; project administration, C.K.; funding acquisition, C.K. All authors have read and agreed to the published version of the manuscript.

Funding

This research was funded by the National Institute of Forest Science, under grant number FM0300-2024-01-2025.

Data Availability Statement

The original contributions presented in this study are included in the article. Further inquiries can be directed to the corresponding author.

Conflicts of Interest

The authors declare no conflicts of interest.

References

  1. Kim, H.; Jung, S.; Lee, G. Development of stem volume tables for Pinus thunbergii in Southern Korea based on comparison of major stem-taper equations. J. Environ. Sci. Int. 2024, 33, 453–462. [Google Scholar] [CrossRef]
  2. Jung, S.; Lee, K.S.; Kim, H.S.; Park, J.H.; Kim, J.; Park, C.; Son, Y. Derivation of stem taper equations and a stem volume table for Quercus acuta in a warm temperate region. J. Korean Soc. For. Sci. 2023, 112, 417–425. [Google Scholar] [CrossRef]
  3. Bae, E.J.; Son, Y.; Kang, J.-T. Estimation of stem taper equations and stem volume tables for Phyllostachys pubescens Mazel in South Korea. J. Korean Soc. For. Sci. 2022, 111, 622–629. [Google Scholar] [CrossRef]
  4. Kim, H.-S.; Jung, S.-Y.; Lee, K.-S. Evaluation of major taper equation models for developing a stem volume table for Cryptomeria japonica on Jeju Island. J. Environ. Sci. Int. 2022, 31, 941–950. [Google Scholar] [CrossRef]
  5. Shin, J.-H.; Han, H.; Kim, Y.-H.; Yim, J.-S.; Chang, Y.-S. Uncertainty in stand volume estimation based on taper-derived stand volume tables and its implications on carbon stock bias: A case study in Hongcheon-gun, Gangwon-do, Korea. J. Clim. Change Res. 2022, 13, 355–364. [Google Scholar] [CrossRef]
  6. Son, Y.-M.; Kim, H.; Lee, H.Y.; Kim, C.-M.; Kim, C.-S.; Kim, J.-W.; Ju, R.-W.; Lee, K.-H. Taper equations and stem volume tables for Eucalyptus pellita and A. mangium plantations in Indonesia. J. Korean Soc. For. Sci. 2009, 98, 633–638. [Google Scholar]
  7. Lee, S.J.; Ko, C.U.; Yim, J.S.; Kang, J.T. A study on the application of a new stem volume table to estimate forest carbon stocks in South Korea. J. Clim. Change Res. 2019, 10, 463–471. [Google Scholar] [CrossRef]
  8. Son, Y.-M.; Jeon, J.-H.; Pyo, J.-K.; Kim, K.-N.; Kim, S.-W.; Lee, K.-H. Development of a stem volume table for Robinia pseudoacacia using Kozak’s stem profile model. J. Agric. Life Sci. 2012, 46, 43–49. [Google Scholar]
  9. National Institute of Forest Science. Stem Volume and Biomass, Yield Table; NIFoS: Seoul, Republic of Korea, 2023. [Google Scholar]
  10. Moon, G.H.; Yim, J.S. Changes in the carbon stocks of coarse woody debris in national forest inventories: Focusing on Gangwon province. J. Korean Soc. For. Sci. 2021, 110, 233–243. [Google Scholar] [CrossRef]
  11. Kim, E.; Kim, K.-M.; Kim, C.-C.; Lee, S.-H.; Kim, S.-H. The spatial distribution of forest stand volume in Gyeonggi Province was estimated using national forest inventory data and forest-type maps. J. Korean Soc. For. Sci. 2010, 99, 827–835. [Google Scholar]
  12. Seo, Y.O.; Lee, Y.J.; Noh, D.K.; Kim, S.H.; Choi, J.K.; Lee, W.K.; Height, D.B.H. Growth models of major tree species in Chungcheong Province. J. Korean Soc. For. Sci. 2011, 100, 62–69. [Google Scholar]
  13. Yim, J.-S.; Shin, M.-Y.; Jeong, I.-B.; Kim, C.-C.; Kim, S.-H.; Ryu, J.-H. Estimation of forest growing stock by combining annual forest inventory data. J. Korean Soc. For. Sci. 2012, 101, 213–219. [Google Scholar]
  14. Ko, C.; Kim, D.-G.; Kang, J.-T. Estimation of the stem volume table of Quercus acutissima in South Korea Using Variable Exponent Equation. J. Korean Soc. For. Sci. 2019, 108, 357–363. [Google Scholar] [CrossRef]
  15. Gonzalez-Benecke, C.A.; Gezan, S.A.; Samuelson, L.J.; Cropper, W.P., Jr.; Leduc, D.J.; Martin, T.A. Estimating Pinus palustris Tree diameter and stem volume from tree height, crown area and stand-level parameters. J. For. Res. 2014, 25, 43–52. [Google Scholar] [CrossRef]
  16. Buba, T. Relationship between stem diameter at breast height (DBH), tree height, crown length, and crown ratio of Vitellaria paradoxa C.F. Gaertn in the Nigerian Guinea Savanna. Afr. J. Biotechnol. 2013, 12, 22. [Google Scholar]
  17. Bae, S.; Lee, C.; Kim, K.; Park, B.; Kwon, K.; Kang, G.; Lee, W.; Hong, S.; Lee, K.; Song, T.; et al. Economically Important Tree Species V: Chamaecyparis obtusa (Hinoki Cypress); Korea Forest Research Institute: Seoul, Republic of Korea, 2012; pp. 1–155. [Google Scholar]
  18. Kang, J.T.; Seo, Y.O.; Park, J.; Ko, C.; Kwon, S. Development of weight estimation equation and weight table for Chamaecyparis obtusa and Cryptomeria japonica. J. Korean Soc. For. Sci. 2025, 114, 94–109. [Google Scholar]
  19. Baek, G.W.; Hwang, D.K.; Kim, C.S. Effects of thinning on nutrient concentrations and stocks in Cryptomeria japonica and Chamaecyparis obtusa plantations. J. Agirc Life Sci. 2025, 59, 97–104. [Google Scholar] [CrossRef]
  20. Jung, S.; Lee, K.S.; Kim, H.S.; Park, J. Improvement of the thinning system by exploring stand density management criteria for Chamaecyparis obtusa in South Korea. J. Korean Soc. For. Sci. 2024, 113, 131–142. [Google Scholar]
  21. Kim, S.-J. Preparation and characterization of wood-plastic composite panels fabricated with Chamaecyparis obtusa Wood Flour. J. Converg. Inform. Technol. 2022, 12, 126–132. [Google Scholar] [CrossRef]
  22. Hwang, D.; Baek, G.; Bae, E.J.; Kim, C. Short-term effect of thinning on carbon stocks in Cryptomeria japonica and Chamaecyparis obtusa plantations. Korean J. Agric. For. Meteorol. 2024, 26, 295–302. [Google Scholar]
  23. Sumida, A.; Miyaura, T.; Torii, H. Relationships of tree height and diameter at breast height revisited: Analyses of stem growth using 20-year data from an even-aged Chamaecyparis obtusa stand. Tree Physiol. 2013, 33, 106–118. [Google Scholar] [CrossRef] [PubMed]
  24. Kumagai, T.; Nagasawa, H.; Mabuchi, T.; Ohsaki, S.; Kubota, K.; Kogi, K.; Utsumi, Y.; Koga, S.; Otsuki, K. Sources of error in estimating stand transpiration using allometric relationships between stem diameter and sapwood area for Cryptomeria japonica and Chamaecyparis obtusa. For. Ecol. Manag. 2005, 206, 191–195. [Google Scholar] [CrossRef]
  25. Hemery, G.E.; Savill, P.S.; Pryor, S.N. Applications of the crown diameter–stem diameter relationship for different species of broadleaved trees. For. Ecol. Manag. 2005, 215, 285–294. [Google Scholar] [CrossRef]
  26. Ko, C.; Kang, J.; Won, H.; Seo, Y.; Lee, M. Stem profile estimation of Pinus densiflora in Korea using machine learning models: Towards precision forestry. Forests 2025, 16, 840. [Google Scholar] [CrossRef]
  27. Özçelik, R.; Diamantopoulou, M.J.; Trincado, G. Evaluation of potential modeling approaches for Scots pine stem diameter prediction in north-eastern Turkey. Comput. Electron. Agric. 2019, 162, 773–782. [Google Scholar] [CrossRef]
  28. Bayat, M.; Bettinger, P.; Heidari, S.; Henareh Khalyani, A.; Jourgholami, M.; Hamidi, S.K. Estimation of Tree Heights in an Uneven-Aged, Mixed Forest in Northern Iran Using Artificial Intelligence and Empirical Models. Forests 2020, 11, 324. [Google Scholar] [CrossRef]
  29. Özçelik, R.; Diamantopoulou, M.J.; Brooks, J.R.; Wiant, H.V., Jr. Estimating tree bole volume using artificial neural network models for four species in Turkey. J. Environ. Manag. 2009, 90, 3687–3695. [Google Scholar] [CrossRef] [PubMed]
  30. Antúnez, P.; Wehenkel, C.; Basave-Villalobos, E.; Calixto-Valencia, C.G.; Valenzuela-Encinas, C.; Ruiz-Aquino, F.; Sarmiento-Bustos, D. Predictive modeling of volume and biomass in Pinus pseudostrobus using machine learning and allometric approaches. For. Sci. Technol. 2025, 21, 110–122. [Google Scholar] [CrossRef]
  31. Diamantopoulou, M.J.; Georgakis, A. Improving European Black Pine Stem Volume Prediction Using Machine Learning Models with Easily Accessible Field Measurements. Forests 2024, 15, 2251. [Google Scholar] [CrossRef]
  32. Breiman, L.; Forests, R. Random forests. Mach. Learn. 2001, 45, 5–32. [Google Scholar] [CrossRef]
  33. Chen, T.; Guestrin, C. XGBoost: A scalable tree boosting system. In Proceedings of the 22nd ACM SIGKDD International Conference on Knowledge Discovery and Data Mining, San Francisco, CA, USA, 13–17 August 2016; ACM: New York, NY, USA, 2016; pp. 785–794. [Google Scholar] [CrossRef]
  34. Lee, S.H.; Ko, C.U.; Shin, J.H.; Kang, J.T. Estimation of Stem Taper for Quercus acutissima Using Machine Learning Techniques. J. Agirc Life Sci. 2020, 54, 29–37. [Google Scholar] [CrossRef]
  35. Nunes, M.H.; Görgens, E.B. Artificial intelligence procedures for tree taper estimation within a complex vegetation mosaic in Brazil. PLoS ONE 2016, 11, e0154738. [Google Scholar] [CrossRef] [PubMed]
  36. Mauro, F.; Frank, B.; Monleon, V.J.; Temesgen, H.; Ford, K.R. Prediction of diameter distributions and tree-lists in Southwestern Oregon using LiDAR and stand-level auxiliary information. Can. J. For. Res. 2019, 49, 775–787. [Google Scholar] [CrossRef]
  37. Yang, S.I.; Burkhart, H.E.; Seki, M. Evaluating semi- and nonparametric regression algorithms in quantifying stem taper and volume with alternative test data selection strategies. Forestry 2023, 96, 465–480. [Google Scholar] [CrossRef]
  38. Pokhrel, N.R.; Subedi, M.R.; Malego, B. Fitting and evaluating taper functions to predict upper stem diameter of planted teak (Tectona grandis L.f.) in eastern and central regions of Nepal. Forests 2025, 16, 77. [Google Scholar] [CrossRef]
  39. Yang, S.I.; Burkhart, H.E. Robustness of parametric and nonparametric fitting procedures of tree-stem taper with alternative definitions for validation data. J. For. 2020, 118, 576–583. [Google Scholar] [CrossRef]
  40. Chen, Q.; Gong, P.; Baldocchi, D.; Tian, Y.Q. Estimating basal area and stem volume for individual trees from lidar data. Photogramm. Eng. Remote Sens. 2007, 73, 1355–1365. [Google Scholar] [CrossRef]
  41. An, Z.; Froese, R.E. Tree stem volume estimation from terrestrial LiDAR point cloud by unwrapping. Can. J. For. Res. 2023, 53, 2. [Google Scholar] [CrossRef]
  42. Lee, Y.; Lee, J. Advancing stem volume estimation using multi-platform LiDAR and taper model integration for precision forestry. Remote Sens. 2025, 17, 785. [Google Scholar] [CrossRef]
  43. Hyyppä, J.; Yu, X.; Hakala, T.; Kaartinen, H.; Kukko, A.; Hyyti, H.; Muhojoki, J.; Hyyppä, E. Under-canopy UAV laser scanning providing canopy height and stem volume accurately. Forests 2021, 12, 856. [Google Scholar] [CrossRef]
  44. Balestra, M.; Marselis, S.; Sankey, T.T.; Cabo, C.; Liang, X.; Mokroš, M.; Peng, X.; Singh, A.; Stereńczak, K.; Vega, C.; et al. LiDAR data fusion to improve forest attribute estimates: A review. Curr. For. Rep. 2024, 10, 281–297. [Google Scholar] [CrossRef]
  45. Ko, C.; Lee, S.; Yim, J.; Kim, D.; Kang, J. Comparison of forest inventory methods at plot-level between a backpack personal laser scanning (BPLS) and conventional equipment in Jeju island, South Korea. Forests 2021, 12, 308. [Google Scholar] [CrossRef]
  46. Kozak, A. A variable-exponent taper equation. Can. J. For. Res. 1988, 18, 1363–1368. [Google Scholar] [CrossRef]
  47. Cysneiros, V.C.; Gaui, T.D.; Silveira Filho, T.B.; Pelissari, A.L.; Machado, S.d.A.; De Carvalho, D.C.; Moura, T.A.; Amorim, H.B. Tree volume modeling for forest types in the Atlantic Forest: Generic and specific models. iForest 2020, 13, 417–425. [Google Scholar] [CrossRef]
  48. Oliveira, L.Z.; Klitzke, A.R.; Fantini, A.C.; Uller, H.F.; Correia, J.; Vibrans, A.C. Robust volumetric models for supporting the management of secondary forest stands in the Southern Brazilian Atlantic Forest. An. Acad. Bras. Ciênc 2018, 90, 3729–3744. [Google Scholar] [CrossRef] [PubMed]
  49. Shapley, L.S. A value for n-person games. In Contributions to the Theory of Games II; Kuhn, H.W., Tucker, A.W., Eds.; Princeton University Press: Princeton, NJ, USA, 1953; Volume 2, pp. 307–317. [Google Scholar]
  50. Lundberg, S.M.; Lee, S.-I. A unified approach to interpreting model predictions. arXiv 2017. [Google Scholar] [CrossRef]
  51. Kim, Y.; Kim, Y. Explainable heat-related mortality with random forest and SHapley Additive exPlanations (SHAP) models. Sustain. Cities Soc. 2022, 79, 103677. [Google Scholar] [CrossRef]
  52. Socha, J.; Netzel, P.; Cywicka, D. Stem taper approximation by artificial neural network and a regression set models. Forests 2020, 11, 79. [Google Scholar] [CrossRef]
  53. Özçelik, R.; Diamantopoulou, M.J.; Brooks, J.R. The use of tree crown variables in over-bark diameter and volume prediction models. iForest 2014, 7, 132–139. [Google Scholar] [CrossRef]
  54. Sanquetta, C.R.; Wojciechowski, J.; Dalla Corte, A.P.D.; Rodrigues, A.L.; Maas, G.C.B. On the use of data mining for estimating carbon storage in the trees. Carbon Balance Manag. 2013, 8, 6. [Google Scholar] [CrossRef] [PubMed]
  55. Yazdi, H.; Moser-Reischl, A.; Rötzer, T.; Ludwig, F.; Tost, J. Machine learning-based prediction of tree crown development in competitive urban environments. Urban For. Urban Green 2024, 101, 128527. [Google Scholar] [CrossRef]
  56. Du, Q.; Zhu, C.; Ji, B.; Xu, S.; Xie, B.; Wang, J.; Wang, Z. Quantification of the influencing factors of stand productivity of subtropical natural broadleaved forests in Eastern China using an explainable machine learning framework. Forests 2025, 16, 95. [Google Scholar] [CrossRef]
  57. Al Saim, A.A.; Aly, M. Enhancing tree species mapping in Arkansas’ forests through machine learning and satellite data fusion: A google earth engine–based approach. J. Geovisualization Spat. Anal. 2025, 9, 20. [Google Scholar] [CrossRef]
Figure 1. The spatial distribution of the sampled Chamaecyparis obtusa trees across 318 locations in South Korea. The histogram (inset) shows the frequency distribution of DBH.
Forests 16 01228 g001
Figure 2. A summary of the dimensional characteristics of the trees. (left) The distribution of diameter at breast height (DBH) for the sampled trees (n = 1000); (right) the relationship between DBH and total height (TH), indicating a strong positive correlation.
Forests 16 01228 g002
Figure 3. The overall workflow of the modeling and evaluation framework, including data preprocessing, regression and machine learning modeling, comparative analysis, and interpretation.
Forests 16 01228 g003
Figure 4. Boxplots of absolute prediction errors for each model. XGBoost shows the lowest median and narrowest interquartile range (IQR), indicating superior accuracy and stability.
Forests 16 01228 g004
Figure 5. Scatter plots comparing observed and predicted stem volumes for three models: (a) RM4 model; (b) Random Forest model; (c) XGBoost model. All panels align closely along the 1:1 reference line, with XGBoost (c) showing the best agreement between observed and predicted values.
Forests 16 01228 g005
Figure 6. Residual plots for XGBoost, Random Forest, and RM4. XGBoost exhibits the most symmetrical and narrow residual distribution around zero.
Forests 16 01228 g006
Figure 7. The SHAP summary plot for XGBoost, showing the contribution of DBH and TH to the model’s predictions. DBH is the most influential variable, with a predominantly positive effect.
Forests 16 01228 g007
Table 1. Summary statistics of the main structural and environmental variables for the sampled Chamaecyparis obtusa trees (n = 1000), including diameter at breast height (DBH), total height (TH), stand age (SA), and height to crown base (HCB).
VariableMeanStandard DeviationMinimumMaximum
DBH (cm)18.357.62646
TH (m)12.563.25421
Stand Age (yr)35.918.971362
Height to Crown Base (m)5.11.830.813.2
Table 2. Equations used for model performance evaluation metrics: root mean square error (RMSE), mean absolute error (MAE), coefficient of determination (R2), and Furnival Index (FI).
StatisticsCalculation Forms
Root mean square error (RMSE) i = 1 n ( y i y i ^ ) 2 n
Mean absolute error (MAE) 1 n i = 1 n | y i y i ^ |
Coefficient of determination (R2) 1 ( y i y ^ i ) 2 ( y i y i ¯ ) 2
Furnival Index (FI) F I = S E E g ( y )
Table 3. The prediction performance of the traditional regression models (RM1–RM5) based on the test dataset. Root mean square error (RMSE), mean absolute error (MAE), R2, and Furnival Index (FI) values are reported.
ModelRMSEMAER2FI
RM10.09940.07450.93480.0995
RM20.09950.07450.93470.0996
RM30.01280.00910.99890.0129
RM40.01230.00870.99900.0124
RM50.01460.01120.99860.0147
Table 4. The prediction performance of the machine learning models (Random Forest and XGBoost) based on the test dataset. XGBoost achieved the highest overall accuracy.
ModelRMSEMAER2
Random Forest0.01870.00860.9977
XGBoost0.01640.00680.9982
Table 5. Results of statistical tests comparing absolute prediction errors of each model to those of XGBoost. Shapiro–Wilk tests indicate non-normality, and Wilcoxon signed-rank tests show that all models differ significantly from XGBoost (p < 0.001).
Model vs. XGBShapiro–Wilk pMethodWilcoxon p
RM1 vs. XGB<0.00001Wilcoxon Signed-rank2.57 × 10−23
RM2 vs. XGB<0.000012.52 × 10−23
RM3 vs. XGB<0.000019.09 × 10−5
RM4 vs. XGB<0.000011.13 × 10−4
RM5 vs. XGB<0.000019.27 × 10−11
RF vs. XGB<0.000013.65 × 10−4
Disclaimer/Publisher’s Note: The statements, opinions and data contained in all publications are solely those of the individual author(s) and contributor(s) and not of MDPI and/or the editor(s). MDPI and/or the editor(s) disclaim responsibility for any injury to people or property resulting from any ideas, methods, instructions or products referred to in the content.

