Article

Growth and Water-Use Efficiency of European Beech and Turkey Oak at Low-Elevation Site

1
Research Institute on Terrestrial Ecosystems (CNR_IRET), Via Madonna del Piano 10, 50019 Sesto Fiorentino, Italy
2
Research Institute on Terrestrial Ecosystems (CNR_IRET), Via Marconi 2, 05010 Porano, Italy
3
National Biodiversity Future Center, Piazza Marina 61, 90133 Palermo, Italy
*
Author to whom correspondence should be addressed.
Forests 2025, 16(8), 1210; https://doi.org/10.3390/f16081210
Submission received: 10 June 2025 / Revised: 17 July 2025 / Accepted: 18 July 2025 / Published: 23 July 2025

Abstract

In Italy, beech and Turkey oak are among the most widespread tree species, thriving across various climatic zones. However, rising temperatures and prolonged droughts significantly affect their physiological performance and growth dynamics. To assess their long-term responses to climate change, mature beech and Turkey oak trees were studied in Central Italy at an elevation of 450 m. Using dendrochronological and stable isotope analyses (1981–2020), their growth patterns and physiological adaptations were evaluated. Beech exhibited a higher growth rate, with a basal area increment (BAI) of 17.1 ± 1.1 cm2 year−1, compared to Turkey oak, showing a BAI of 12.7 ± 0.96 cm2 year−1. Both species actively responded to increasing atmospheric CO2 levels. Additionally, spring and the previous summer’s climatic conditions played a key role in growth, while summer temperature and precipitation influenced carbon discrimination. For beech, correlations between BAI and iWUE (intrinsic water efficiency, defined as the ratio between photosynthesis and stomatal conductance) were initially weak and not statistically significant. However, the correlation became significant, strengthening steadily into the early 2000s, likely related to thinning of the beech trees. For Turkey oak, the correlation was already significant and strong from the beginning of the analysis period (1981), persisting until the late 1990s. Our findings suggest that both species actively adjust their iWUE in response to an increasing atmospheric CO2 concentration. However, while Turkey oak’s iWUE and BAI relationship remains unaffected by the likely thinning, beech benefits from reduced competition for light, nutrients, and water. Despite climate change’s impact on marginal populations, microclimatic conditions allow beech to outperform Turkey oak, a species typically better suited to drier climates.

1. Introduction

European beech (Fagus sylvatica L.) and Turkey oak (Quercus cerris L.) are among the most widespread forest tree species in Europe, extending across various climatic zones [1,2]. Nevertheless, climate-related growth declines in beech trees have been reported in northeast Spain and Central Italy [3,4]. Most climate projections indicate rising temperatures and more frequent and prolonged summer droughts [5]. This may reduce beech trees’ growth and competitiveness [6] as they are sensitive to water scarcity [7]. In contrast, Turkey oak is characterized by high phenotypic and genetic variability, and it is generally considered to be a drought-tolerant species [2,8]. In the case of drought, this species responded with a significant growth reduction, but it is characterized by a faster recovery after stressful periods [9].
However, under changing environmental conditions, the physiology of both species’ trees can be significantly influenced by rising temperatures and prolonged droughts. These changes can influence the provision of essential forest ecosystem goods and services, such as wood production, carbon sequestration and recreation, which ultimately affect human well-being [10,11]. Hence, it is important to analyze the response of these two contrasting drought-tolerant species in critical zones, such as the lower elevation edge of a species distribution. In general, trees exhibited a decline in growth and an increased vulnerability to rising temperatures and prolonged drought [12]. In the case of beech, the impact of summer drought is more pronounced at lower elevations than at higher-altitude sites [13,14,15]. However, the interaction of local favorable factors can create site-specific growing conditions that override potential climatic constraints on growth [16]. In Central Italy, beech typically occupies mountain forests above an elevation of 900–1000 m [17], although isolated “depressed” stands can be found as low as 400 m [18]. The occurrence of beech in these lower elevations is closely tied to favorable soil and microclimatic conditions. However, these localized conditions are increasingly at risk due to recent climate warming, which threatens the species’ long-term survival and its ability to persist under progressively warmer environments, favoring other more drought-tolerant tree species, such as oak [19]. Moreover, in the face of climate change, local adaptations, such as drought tolerance, may be essential to conserve beech’s genetic diversity. Indeed, in the eastern part of the beech distribution range, the highest levels of heterozygosity were found at low elevation, near the xeric limit of the species. In this area, late spring and summer droughts significantly constrain species distribution, suggesting that abiotic stress acts as a strong selective force, favoring individuals with higher overall heterozygosity [20]. For this reason, marginal beech provenances showed better drought adaptation [21].
To anticipate future ecosystem responses, it is essential to understand how forests have reacted over the past few decades, particularly concerning carbon and water fluxes [22]. The relationship between carbon and water dynamics in plants can be examined using stable isotopes [23]. The carbon isotope composition (δ13C) of tree rings and related parameters record environmental variations that affect the physiological processes involved in xylogenesis [24]. Among these, intrinsic water-use efficiency (iWUE) reflects long-term shifts in the balance between carbon assimilation and water loss. It serves as a valuable proxy for drought adaptation, offering insights into tree responses to both climate variability and forest management practices [25,26]. The main driver of variation in iWUE is the atmospheric CO2 concentration (Ca), which has become increasingly depleted in 13C due to the large-scale emission of isotopically light CO2 from the combustion of fossil fuels [27]. However, the impact of rising Ca is further shaped by climatic factors, such as vapor pressure deficit (VPD), temperature, precipitation, and soil water content [25]. Evidence from tree ring studies around the world indicates that the iWUE of trees increased by approximately 15%–30% over the course of the 20th century [28]. However, establishing a direct link to tree growth is complex. At the rear edge of beech populations in the Iberian Peninsula, the increase in iWUE is reflected in enhanced growth [29]. However, this relationship is not consistently observed at sites with optimal climatic conditions [30,31]. In contrast, following the 2003 drought, BAI declined at the northern Italian beech site while iWUE increased, suggesting a shift toward more conservative water-use strategies [31]. In fact, increasing iWUE does not necessarily result in greater tree growth, as other local stressors, such as warming-induced drought, hydric stress, light competition, nutrient limitations, and long-term physiological acclimation, can counteract the potential benefits [32,33,34].
Forest thinning reduces competition among individual trees, creates space for canopy expansion, reduces crown rivalry for light, and enhances water and nutrient availability [35]. However, the benefits of thinning for trees’ water-use efficiency and growth vary depending on species and intensity [30,36]. For example, in Central Europe, under similar climatic conditions, competition reduction did not affect oak but improved beech growth [37]. A study conducted in Central Italy on the conversion of Turkey oak stands from coppice to high forest revealed that thinning had a significant effect on both tree ring growth, even though for a short period, and Δ13C. The intervention led to lower iWUE values, attributed to increased stomatal conductance resulting from improved soil water availability [26].
In this context, understanding the species-specific long-term growth dynamics and physiological responses of beech and Turkey oak is essential for developing effective adaptation and mitigation strategies [38,39], particularly for the conservation of this unique genetic beech population. In this study, we want to verify whether beech trees, growing near the lower limit of their elevational range, exhibit lower performance compared to Turkey oak, which occurs within its typical elevational zone. To this end, we conducted an integrated analysis combining dendrochronological and stable isotope data at a low-elevation site, with three primary objectives: (i) to assess the long-term growth trajectories of both species; (ii) to identify the climatic drivers of Δ13C and radial growth; and (iii) to explore species-specific relationships between intrinsic water-use efficiency (iWUE) and productivity over a 40-year period from 1981 to 2020.

2. Materials and Methods

2.1. Study Area

The study area is located in Umbria (Central Italy; coordinates 42.755° N, 11.983° E) at a mean elevation of 450 m a.s.l. (Figure 1a). The area is characterized by a Mediterranean climate with hot and dry summers and mild/cold winters, with a mean annual temperature of 14.7 °C and mean annual precipitation of 900 mm. During the summer, the reduction in precipitation and the increase in temperature lead to a long period of drought (Figure 1b). The soils are Cambisols developed on volcanic deposits, with moderate water retention and good natural fertility.
In the region, Turkey oak coppices are the main forest system, as in other areas of Central and Southern Italy [26]. However, the study area is characterized by the presence of a patch of thermophilic pure beech forest surrounded by a stand of pure Turkey oak. The stands are transitional high forest, characterized by some stumps with two stems. Both forests are the result of a conversion from coppice with standards to high forest, which occurred at the beginning of 2000s, to allow access to an Etruscan necropolis. The beech and the Turkey oak stands have a similar age of 60 years and structural characteristics (Table 1).

2.2. Meteorological Data

The climatic parameters of temperature and precipitation were obtained from the Climate Downscaling Tool (ClimateDT, https://www.ibbr.cnr.it/climate-dt/, accessed on 9 May 2025). The aim of this geo-web service is to downscale a wide range of climate variables and indices from multiple climate scenarios. It operates on a 1 km grid, integrating CRU-TS data for the historical climate record (1901–present) with a combination of planar spatial interpolation methods (e.g., bilinear, inverse distance weighting) and dynamic lapse rate adjustments, allowing scale-free queries across Europe [40].

2.3. Tree Sampling and Dendrochronological Analysis

Co-dominant and mature trees, without damaged crown and stems, were selected, and two increment cores at breast height (1.3 m) were collected from each tree, using a borer with a 5 mm inner diameter. Considering the varying abundance of species in the study area, 13 beech and 32 Turkey oak trees were sampled (Table 2).
After polishing, tree ring width (TRW) was measured at 0.01 mm resolution using a LINTAB (Rinntech, Heidelberg, Germany) coupled with a Leica MS5 stereoscope (Leica Microsystems, Wetzlar, Germany) and TSAP-Win Version 4 Scientific software.
Detrending was applied to each TRW series to calculate the Ring Width Index (RWI) using the “ModNegExp” method, which applies a modified negative exponential curve to remove age-related trends in tree ring data. This was done using the R-based [41] package dplR (version 1.7.8) [42]. The RWIs from each series were then combined to produce a standardized chronology for both beech and Turkey oak.
From TRW series, basal area increment (BAI) was calculated as follows:
BAI = π (rn2 − rn−12)
where “r” is the radius of the tree and “n” is the year of tree ring formation. BAI, indicator of productivity being correlated to volume increment [43], was used for assessing the relationships between iWUE and growth.

2.4. Sample Preparation, δ13C, Δ13C and iWUE Calculation

For isotopic analysis, for each species, five cores, with significant similarity with the species chronology (Gleichläufigkeit (GLK) > 60), were selected (Table 1). GLK is a classical agreement test based on sign tests, which quantifies the percentage of shared year-to-year growth change between two tree ring series [44,45]. Single tree rings were cut and finely ground using a miller (MF 10 Miller IKA, Staufen, Germany). To avoid possible juvenile age effects [46], δ13C analyses were performed on single tree ring wood for the years 1981–2020.
Analyses of the 13C/12C isotope ratios were performed using an isotope ratio mass spectrometer (Isoprime, GV, Cheadle, UK) connected to elemental analyzer (NA1500, Carlo Erba, Milan, Italy). An aliquot of 0.5 mg wood dry matter was collected to perform carbon isotope analysis following a standard methodology [47].
The isotopic compositions were scale-normalized with the IAEA international standards and are expressed as ‰ notation according to the following expression:
δ (‰) = (Rs − Rstd)/Rstd × 1000
where Rs is the isotope ratio of the sample and Rstd is the isotope ratio of the international standard. The standard deviation (SD) of replicate measurements for each standard and sample was 0.1‰ and ±0.3‰, respectively.
The Δ13C (carbon isotopic discrimination) was calculated as
13C = (δ13Cair − δ13Cplant)/ (1 − δ13Cplant)
Following ref. [48], we used published values for air δ13C relative to each year to consider the so-called Suess effect.
Δ13C is related to the Ci over Ca ratio using the following equation:
Δ13C = a + (b − a) × (Ci/Ca)
where a is the discrimination against 13CO2 during CO2 diffusion through stomata (a = 4.4‰) and b is the discrimination associated with carboxylation (b = 27‰). Ci and Ca are the CO2 concentrations in the intercellular space of the leaves and in the atmosphere, respectively. δ13Cair and Ca values were obtained from NOAA database (https://gml.noaa.gov/dv/iadv/graph.php?code=MLO&program=ccgg&type=fi, accessed on 9 May 2025).
Ci can be obtained based on Equations (3) and (4).
The iWUE is the ratio of net photosynthetic assimilation rate (A), measured as CO2 uptake, to stomatal conductance (gs) and was calculated as:
iWUE = A/gs = Ca × [(1 − Ci/Ca)/1.6] = Ca × [1 − (Δ − a)/(b − a)]/1.6
where 1.6 is the ratio of binary diffusivities of water and CO2 in air.
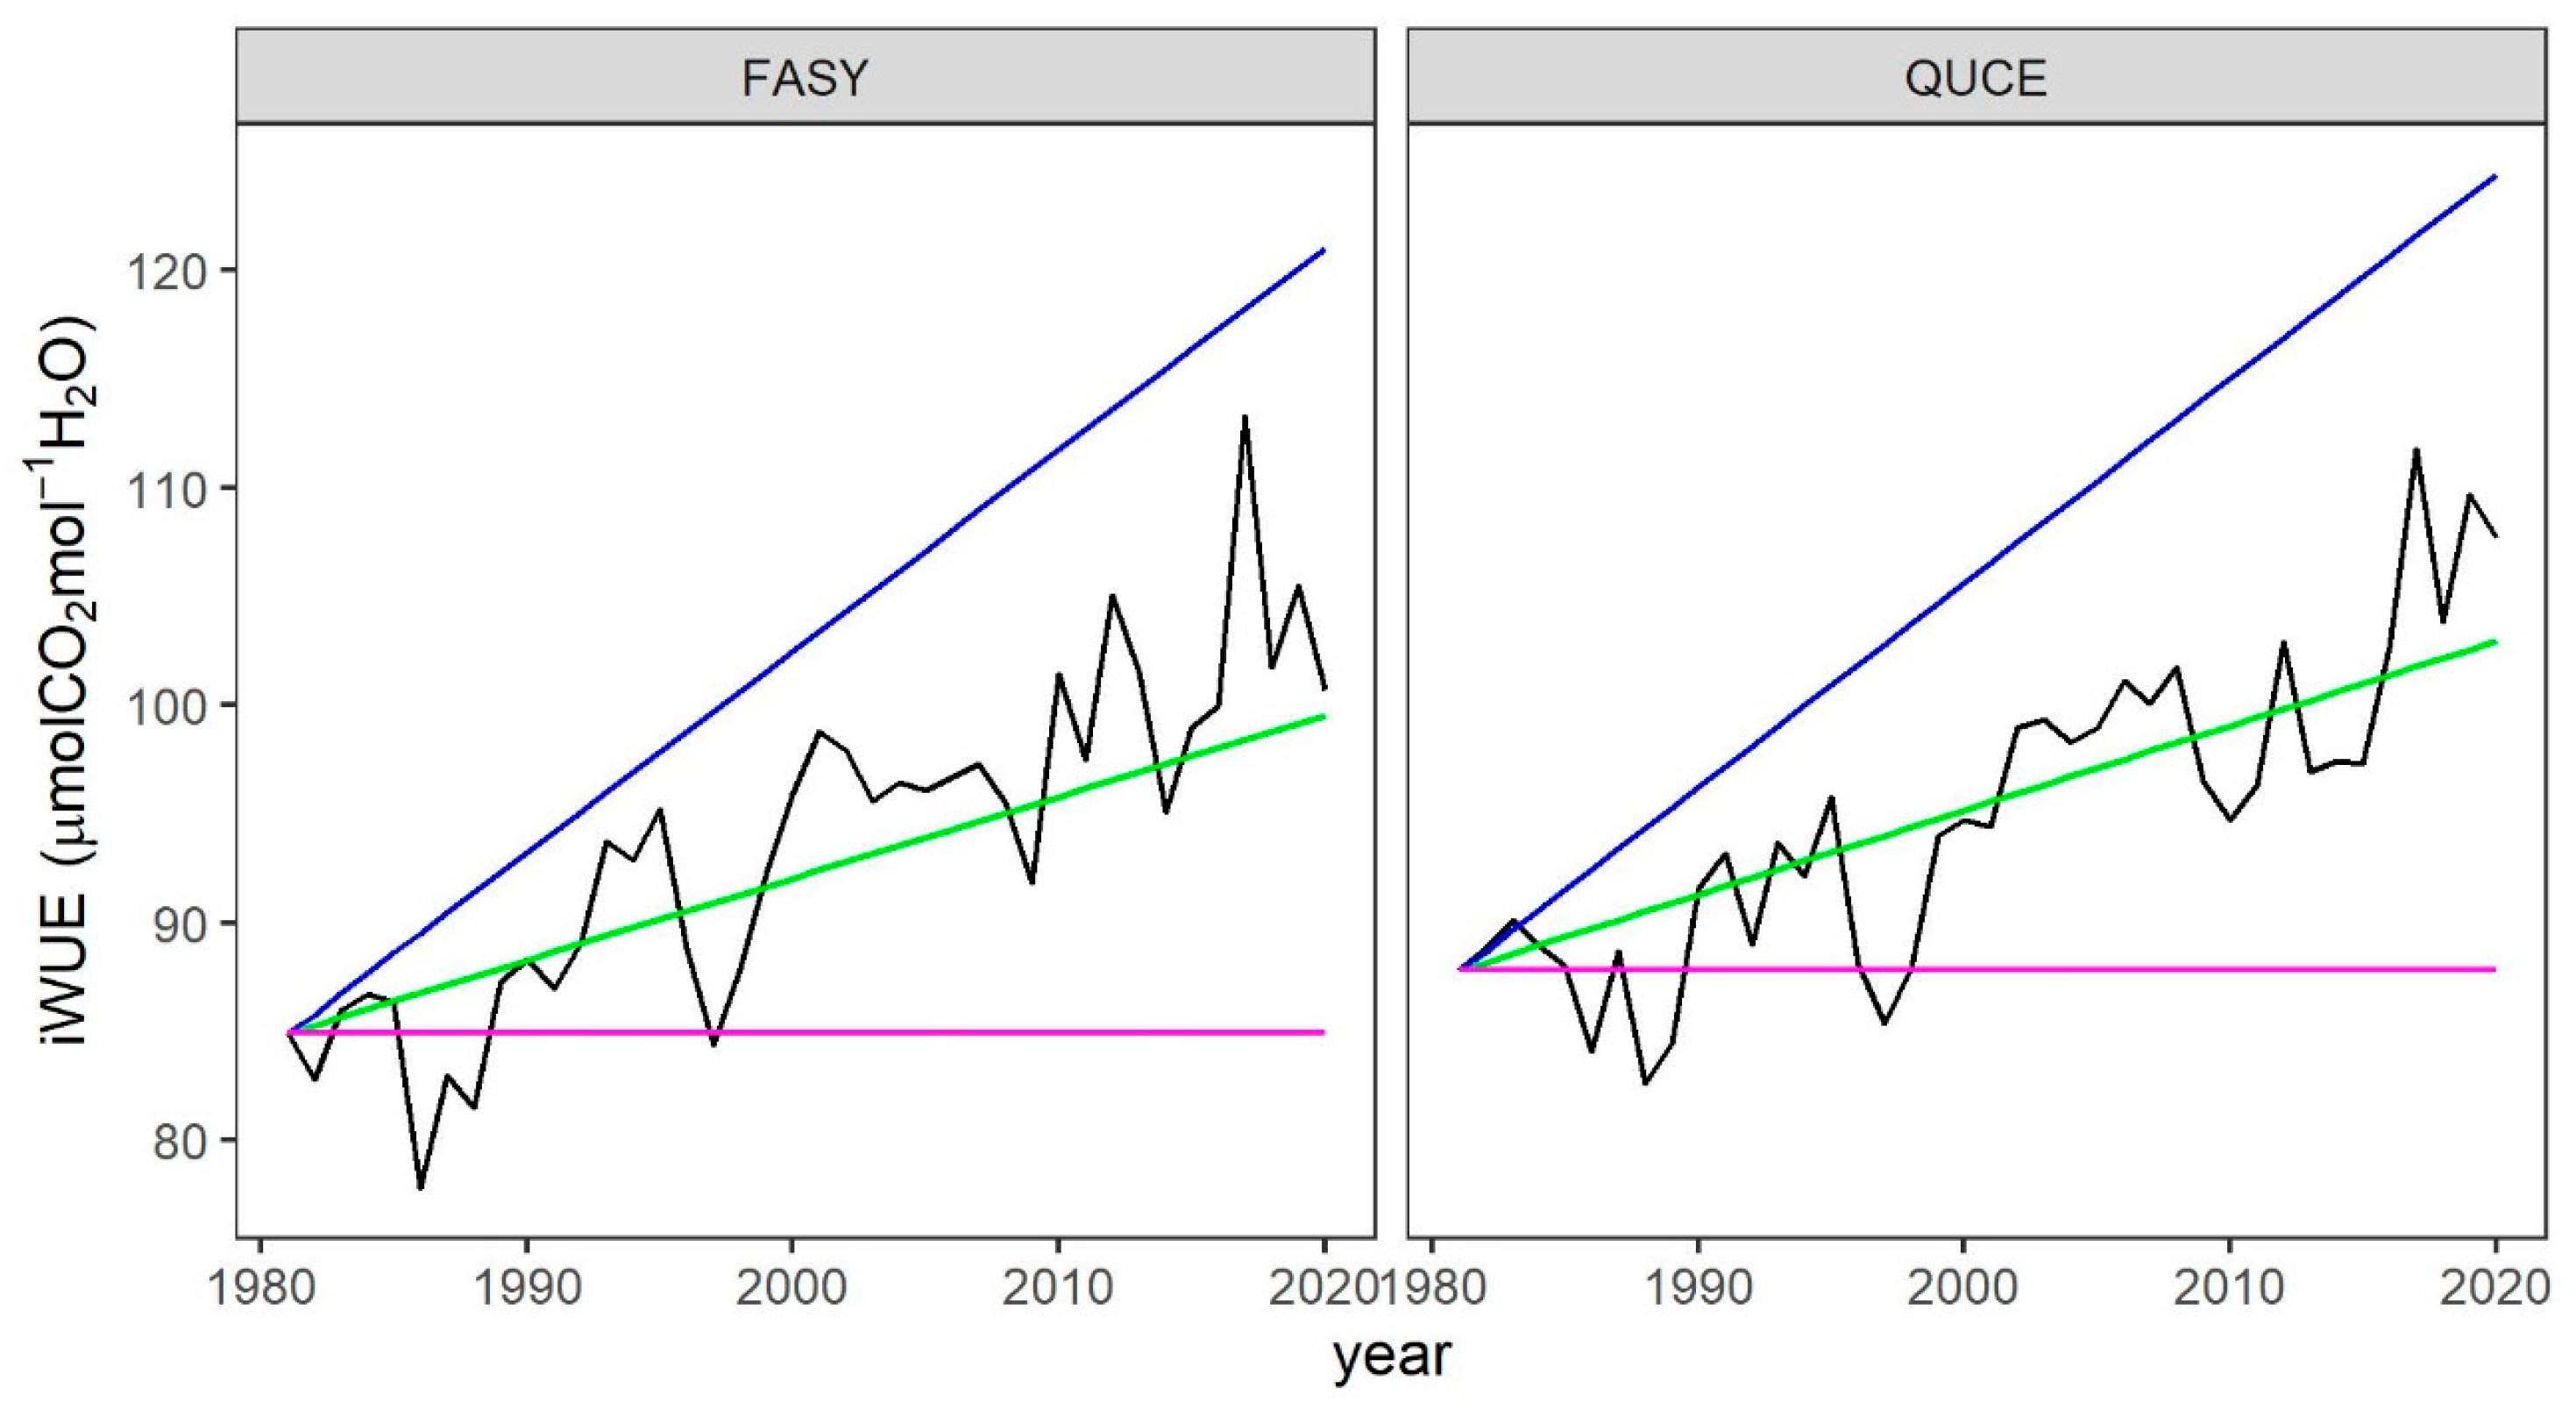
We compared the iWUE dynamic of each species with the three scenarios depending on the Ci response to the increase in Ca: (i) not at all (costant Ci), (ii) in a proportional way (constant Ci/Ca), active response and (iii) at the same rate (constant Ca—Ci), passive response [22].
In the iWUE calculation, only Ca and Ci are the non-constant factors that control the isotope fractionation at the leaf level. Consequently, we did not account for potential variations in mesophyll conductance of CO2 [49] or post-photosynthetic fractionation affecting tree ring δ13C [24,50].

2.5. Statistical Analysis

T-test and Mann–Whitney Rank Sum Test were used for detecting differences between the characteristics of sampled trees and species chronologies. The Granger Causality test was applied using the granger test function from the “lmtest” R-package to assess differences between species in δ13C, Δ13C, Ci and iWUE time series [51].
Analysis of variance (ANOVA) and Post Hoc Fisher multiple comparison test were conducted to determine significant differences in the mean values δ13C, Δ13C, Ci and iWUE between species.
The relationship between RWI, Δ13C and climate variables was analyzed using bootstrapped correlations throughout the Treeclim R-packages 2.0.7.1 [51]. The monthly maximum average temperature and monthly precipitation sums from June of the previous year to September of the current growing year were considered. The statistical significance threshold was set at p ≤ 0.05.
For each species, we performed moving-window Pearson correlation analyses between BAI and iWUE using time windows that progressively shortened while keeping the end year fixed, with a minimum window size of 10 years. This approach enabled us to track changes in the strength and statistical significance of the relationship change over time. The correlation was considered statistically significant at p ≤ 0.05.
All analyses were conducted in R (v.4.3), and visualizations were generated using the ggplot2 package 3.5.1.

3. Results

3.1. Growth Patterns and Trends

The mean age, mean TRW and diameter at breast height (DBH) of the sampled trees for each species were similar (Table 2). In both species, the highly expressed population signal (EPS > 0.85) indicates that the chronologies provided a reliable representation of the hypothetical population dynamics (Table 2).
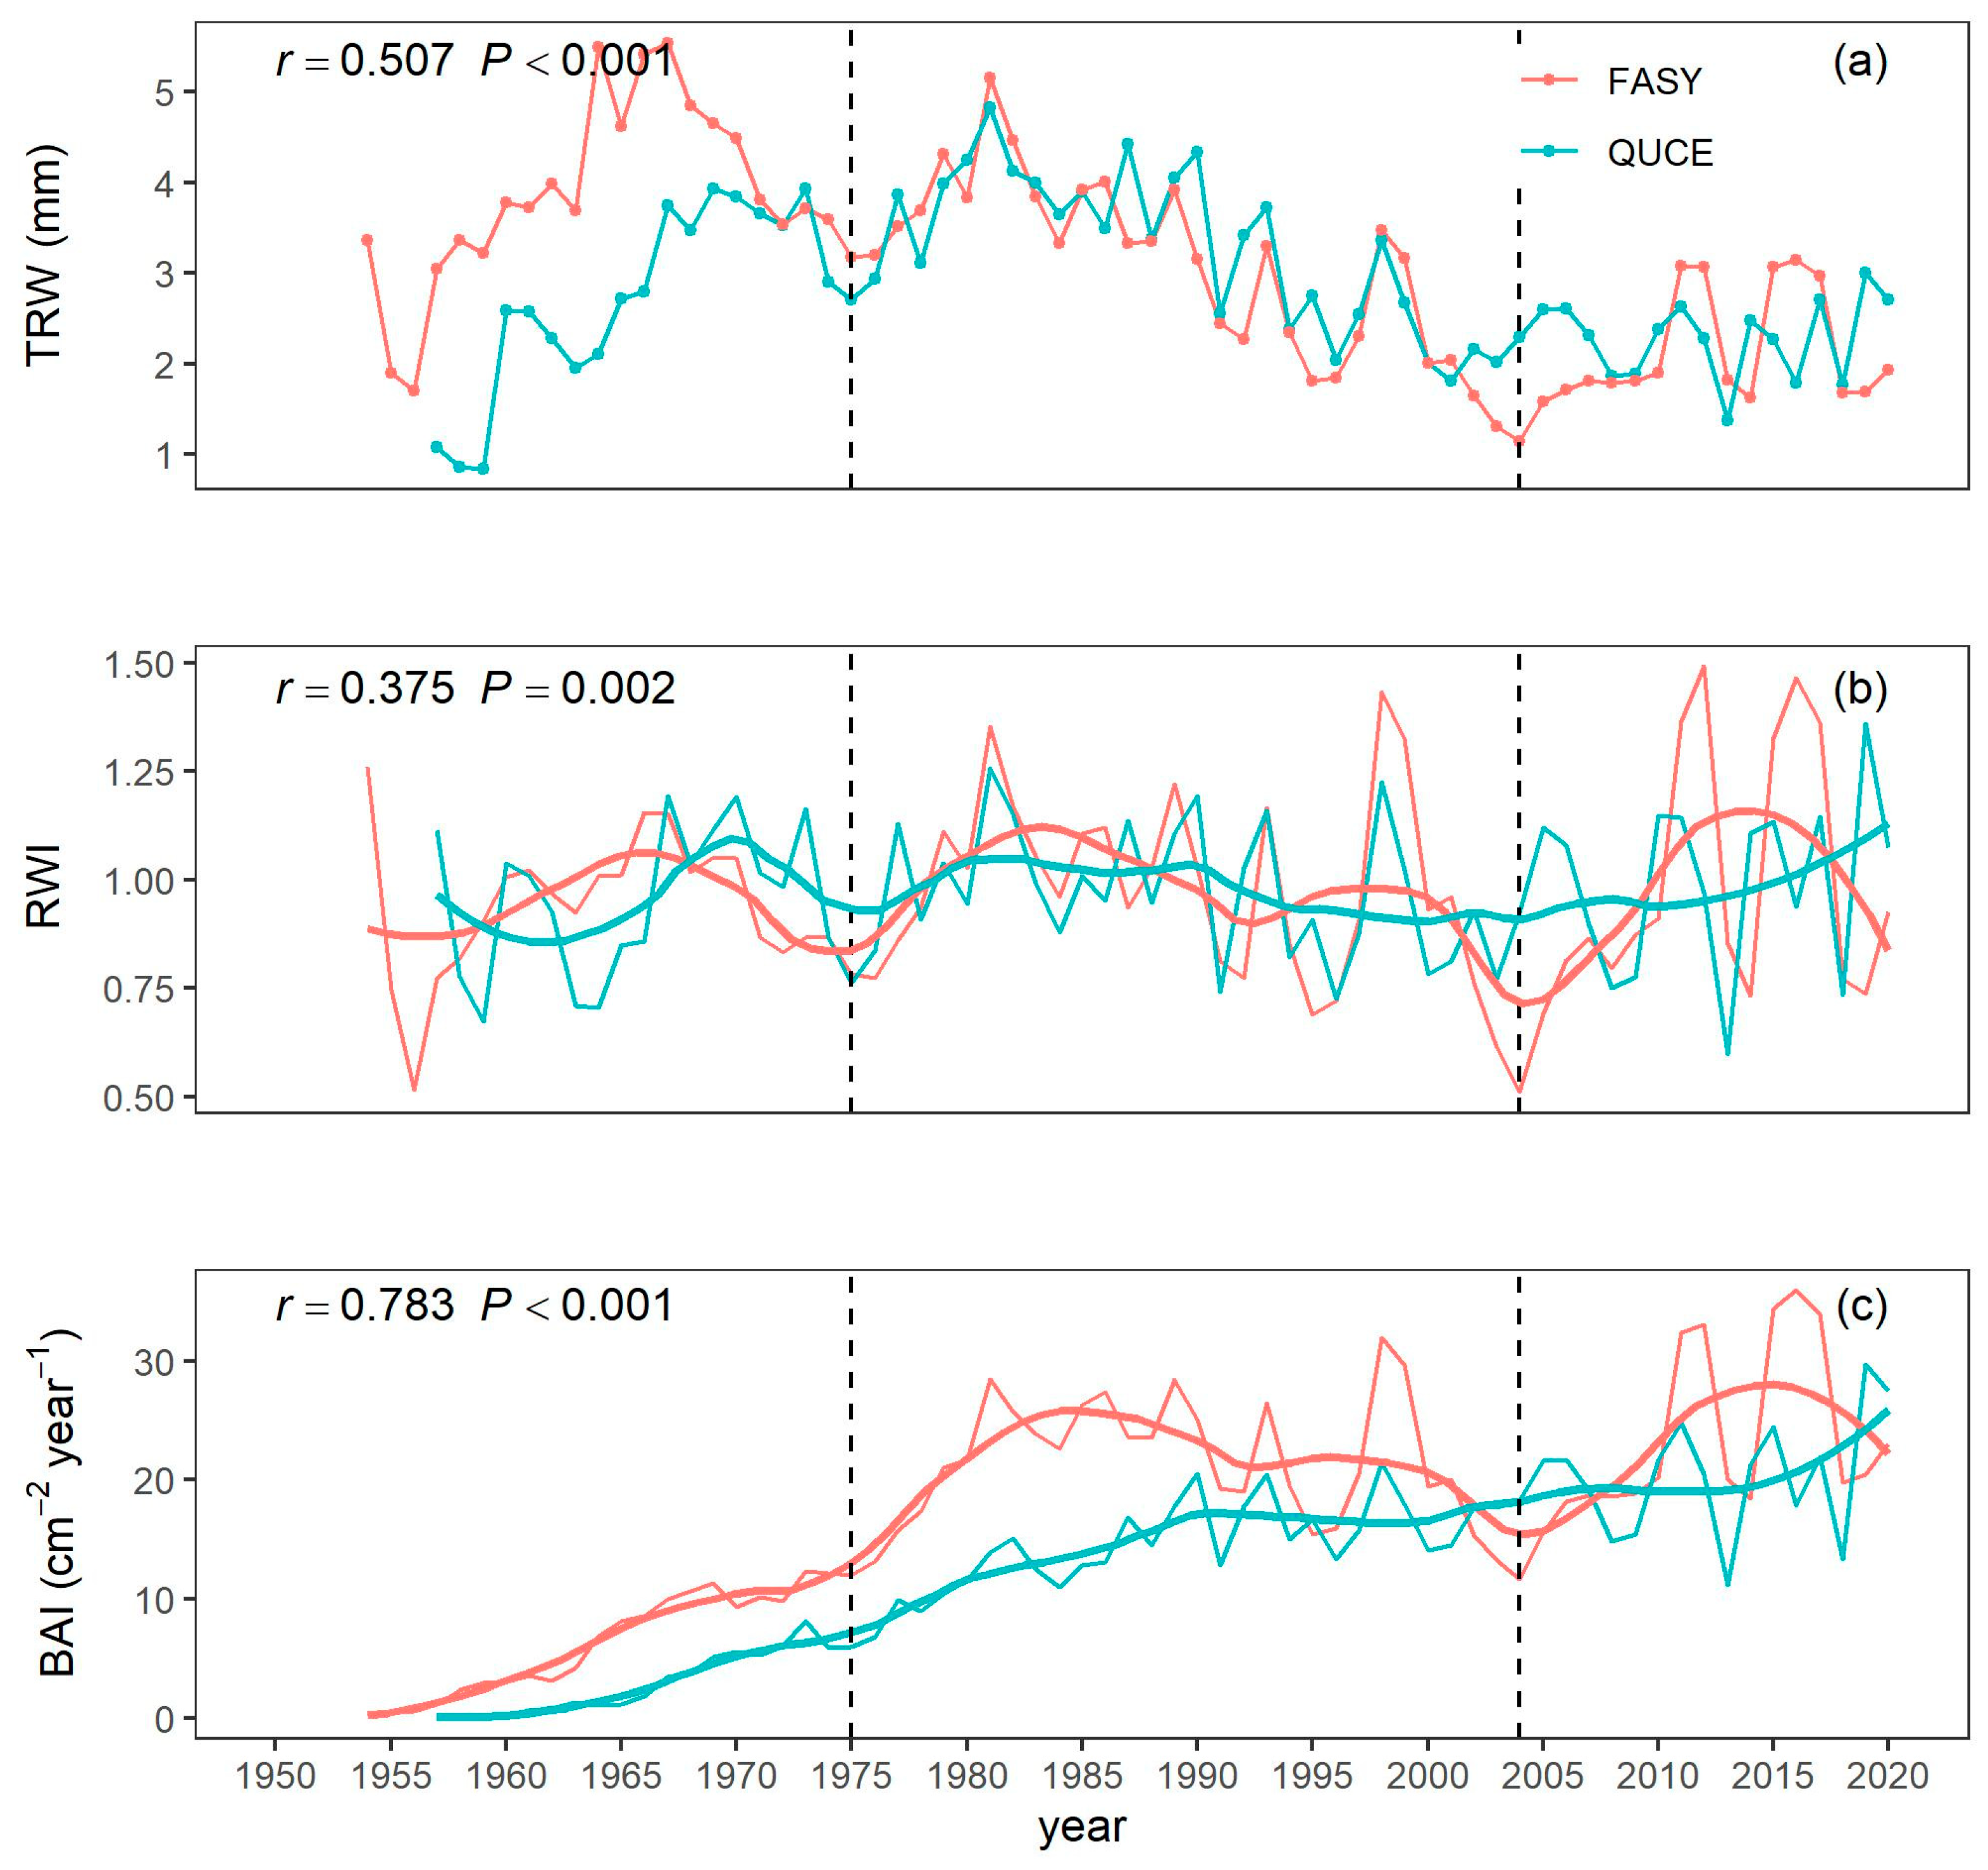
For the Turkey oak, TRW and BAI series (Figure 2), an early growth suppression phase was typically observed until 1965, followed by a rapid increase in BAI during the release phase until 1990. Afterwards, growth remained stable during the maturity phase, with an increasing trend evident from 2015 onwards. In contrast (Figure 2), three distinct development phases were identified for beech: the end of growth suppression at the end of the 1960s, a rapid increase in growth (release phase) until 1985, and a subsequent slight decline in BAI until the early 2000s. In recent years, a small increase in BAI has been observed, with a tendency to further decline. The BAI of beech (17.1 ± 1.1 cm2 year−1) was higher than that of Turkey oak (12.7 ± 0.96 cm2 year−1, t = −2.942, p < 0.01). A strong correlation was found between TRW (r = 0.507, p < 0.001), RWI (r = 0.375, p = 0.002) and BAI (r = 0.783, p < 0.001) for beech and Turkey oak.

3.2. Isotope-Derived Parameter Temporal Dynamics and Relation to CO2 Increment

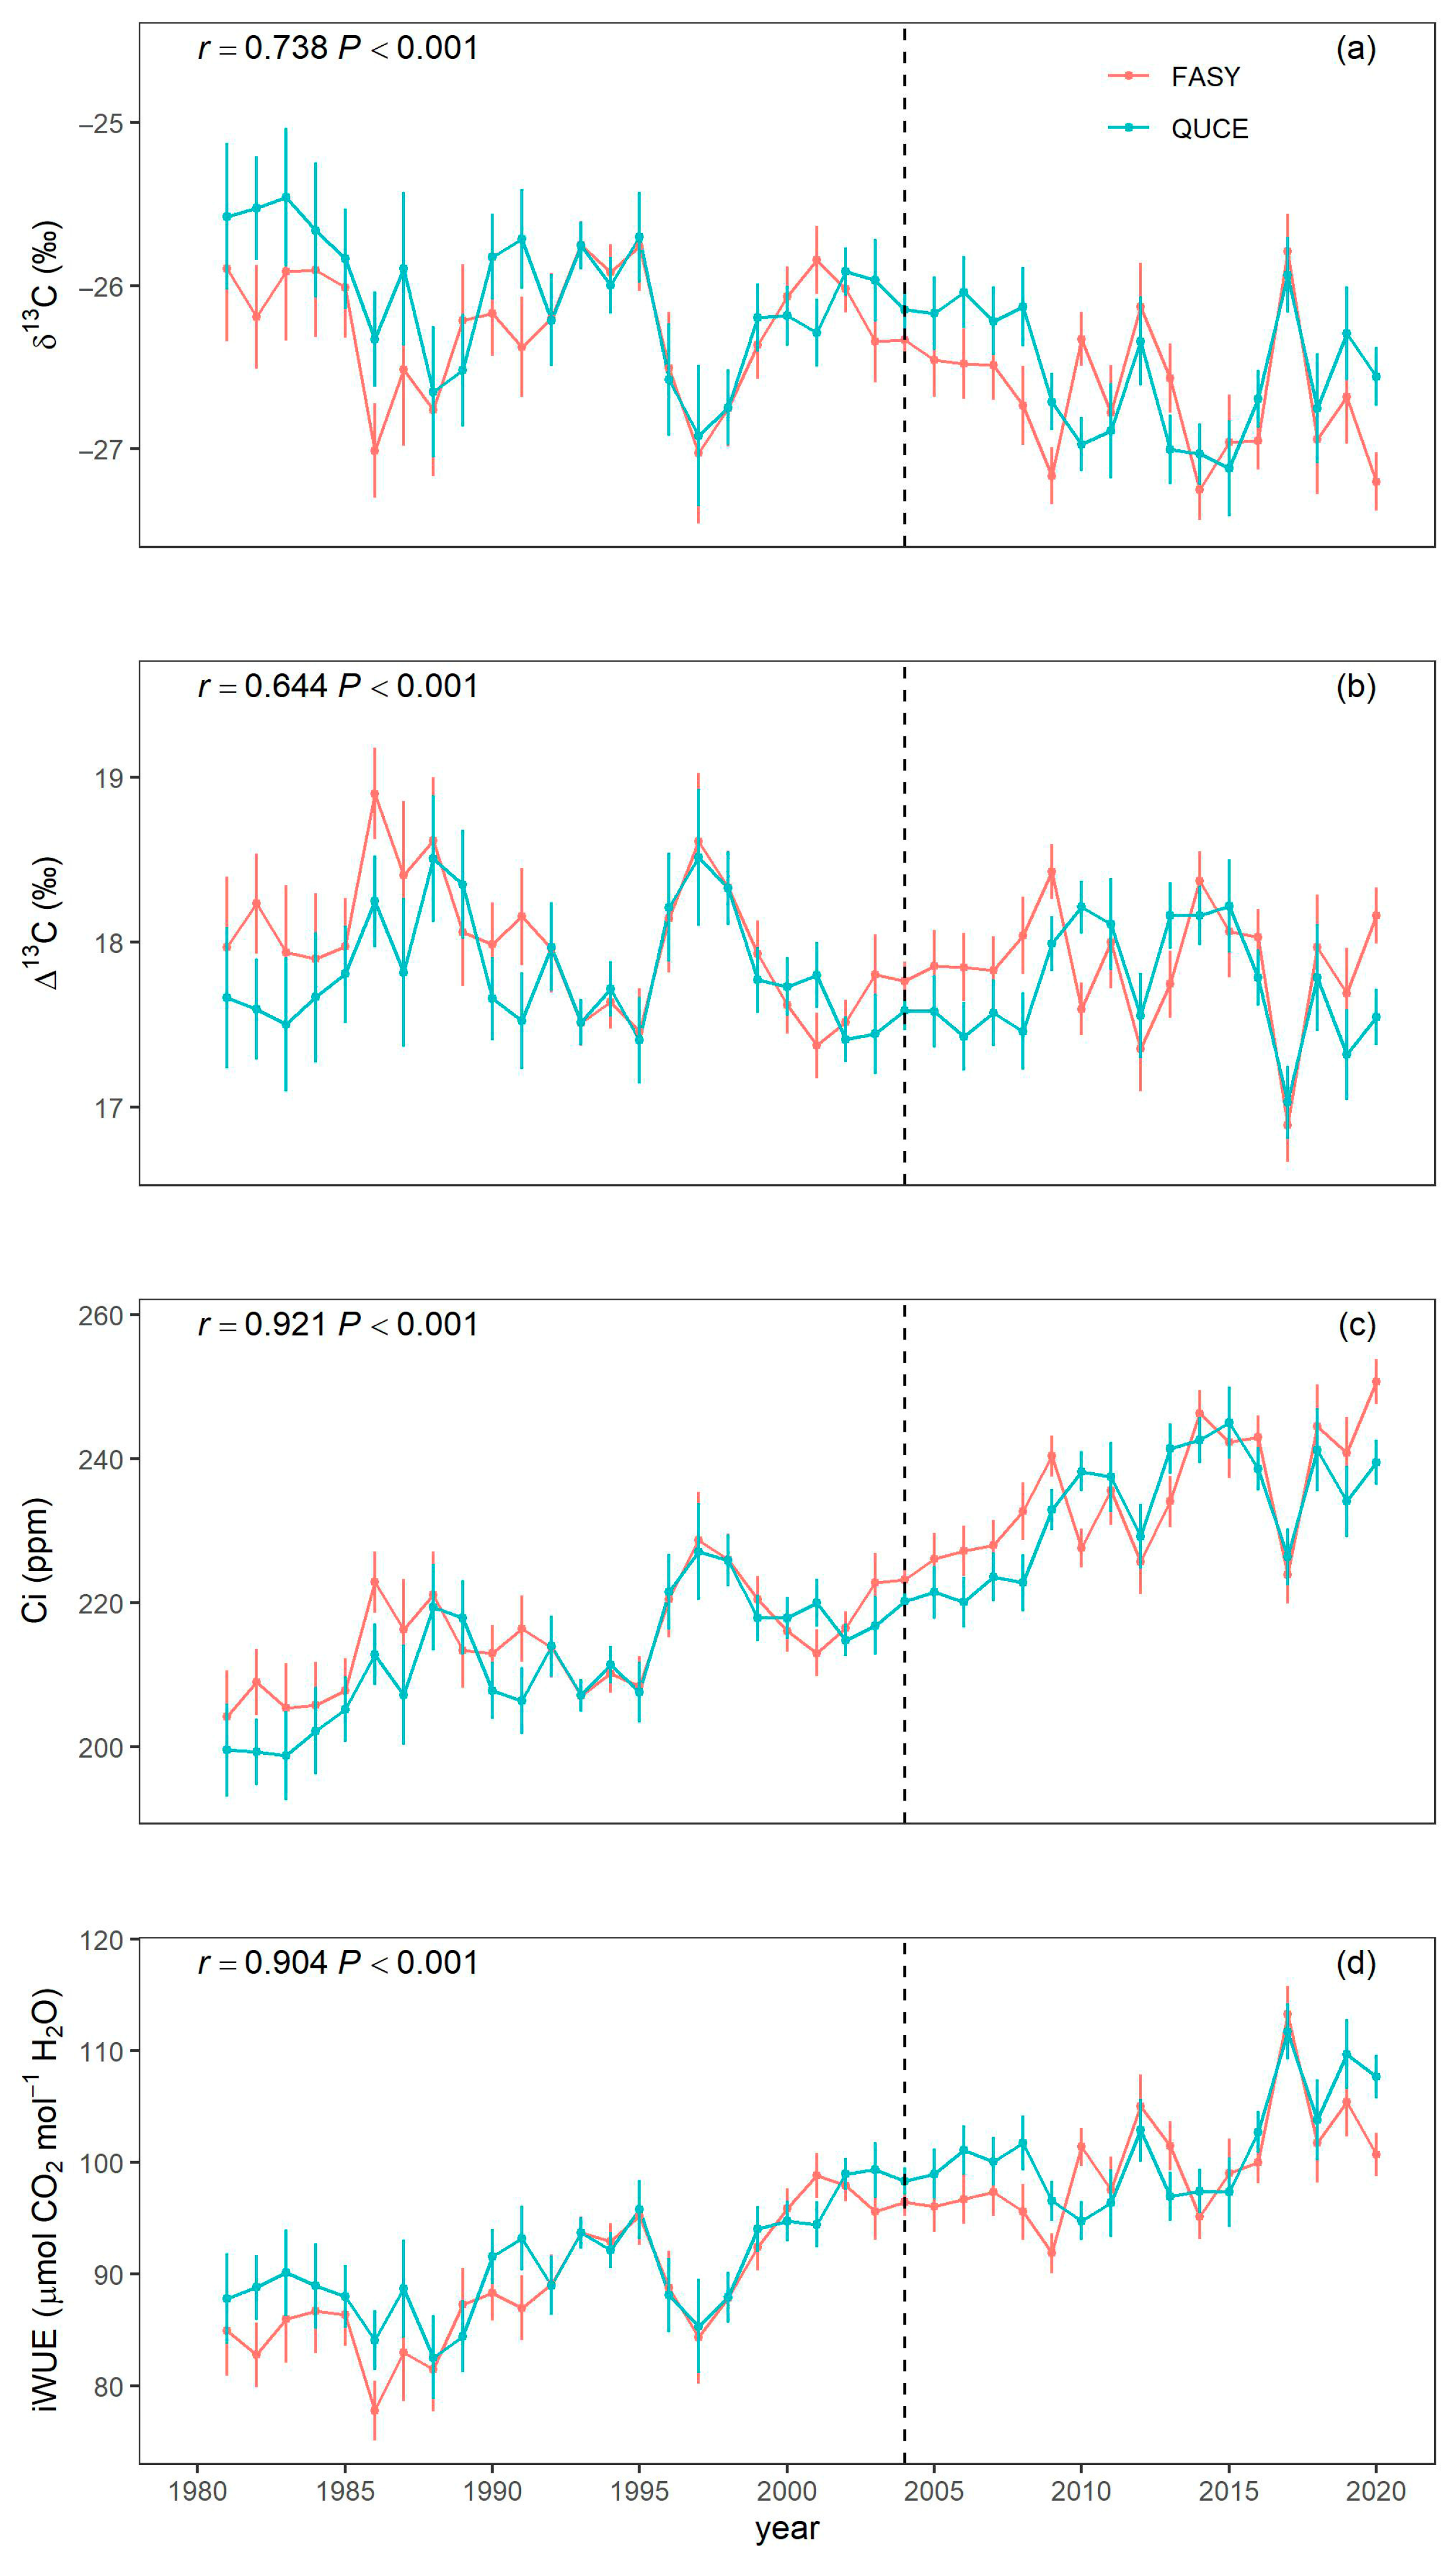
The 13C analysis of the tree rings, performed for the period between 1981 and 2020, resulted in an average value of δ13C of −26.40 ± 0.65‰ for beech and −26.20 ± 0.50‰ for turkey oak, with no significant difference observed between the two species. For both species, the chronologies of δ13C showed a slightly increasing trend (toward fewer negative values) and were strictly correlated (R = 0.736, p < 0.001) (Figure 3a). The carbon discrimination was 17.8 ± 0.4‰ and 17.9 ± 0.8‰ for Turkey oak and beech, respectively. For both species, the chronologies of Δ13C were stable in time and were strictly correlated (R = 0.644, p < 0.001) (Figure 3b). Over the last 40 years, iWUE increased by a slightly greater amount in beech than in oak, with a gain of 45.6% (from 77.8 μmol mol−1 to 113.3 μmol mol−1) and 35.2% (from 82.6 to 111.7 μmol mol−1), respectively (Figure 3d).
The Granger Causality test revealed no significant differences in the δ13C, Δ13C, Ci and iWUE time series between the two species. Similarly, the mean values of δ13C, Δ13C, Ci and iWUE were not statistically different between the two species (Table 3). Both species exhibited an active response to increasing Ca, as evidenced by the overlap between the estimated iWUE and the scenario of constant Ci/Ca (Figure 4).

3.3. Climatic Influence on Tree Growth and Carbon Isotope Discrimination

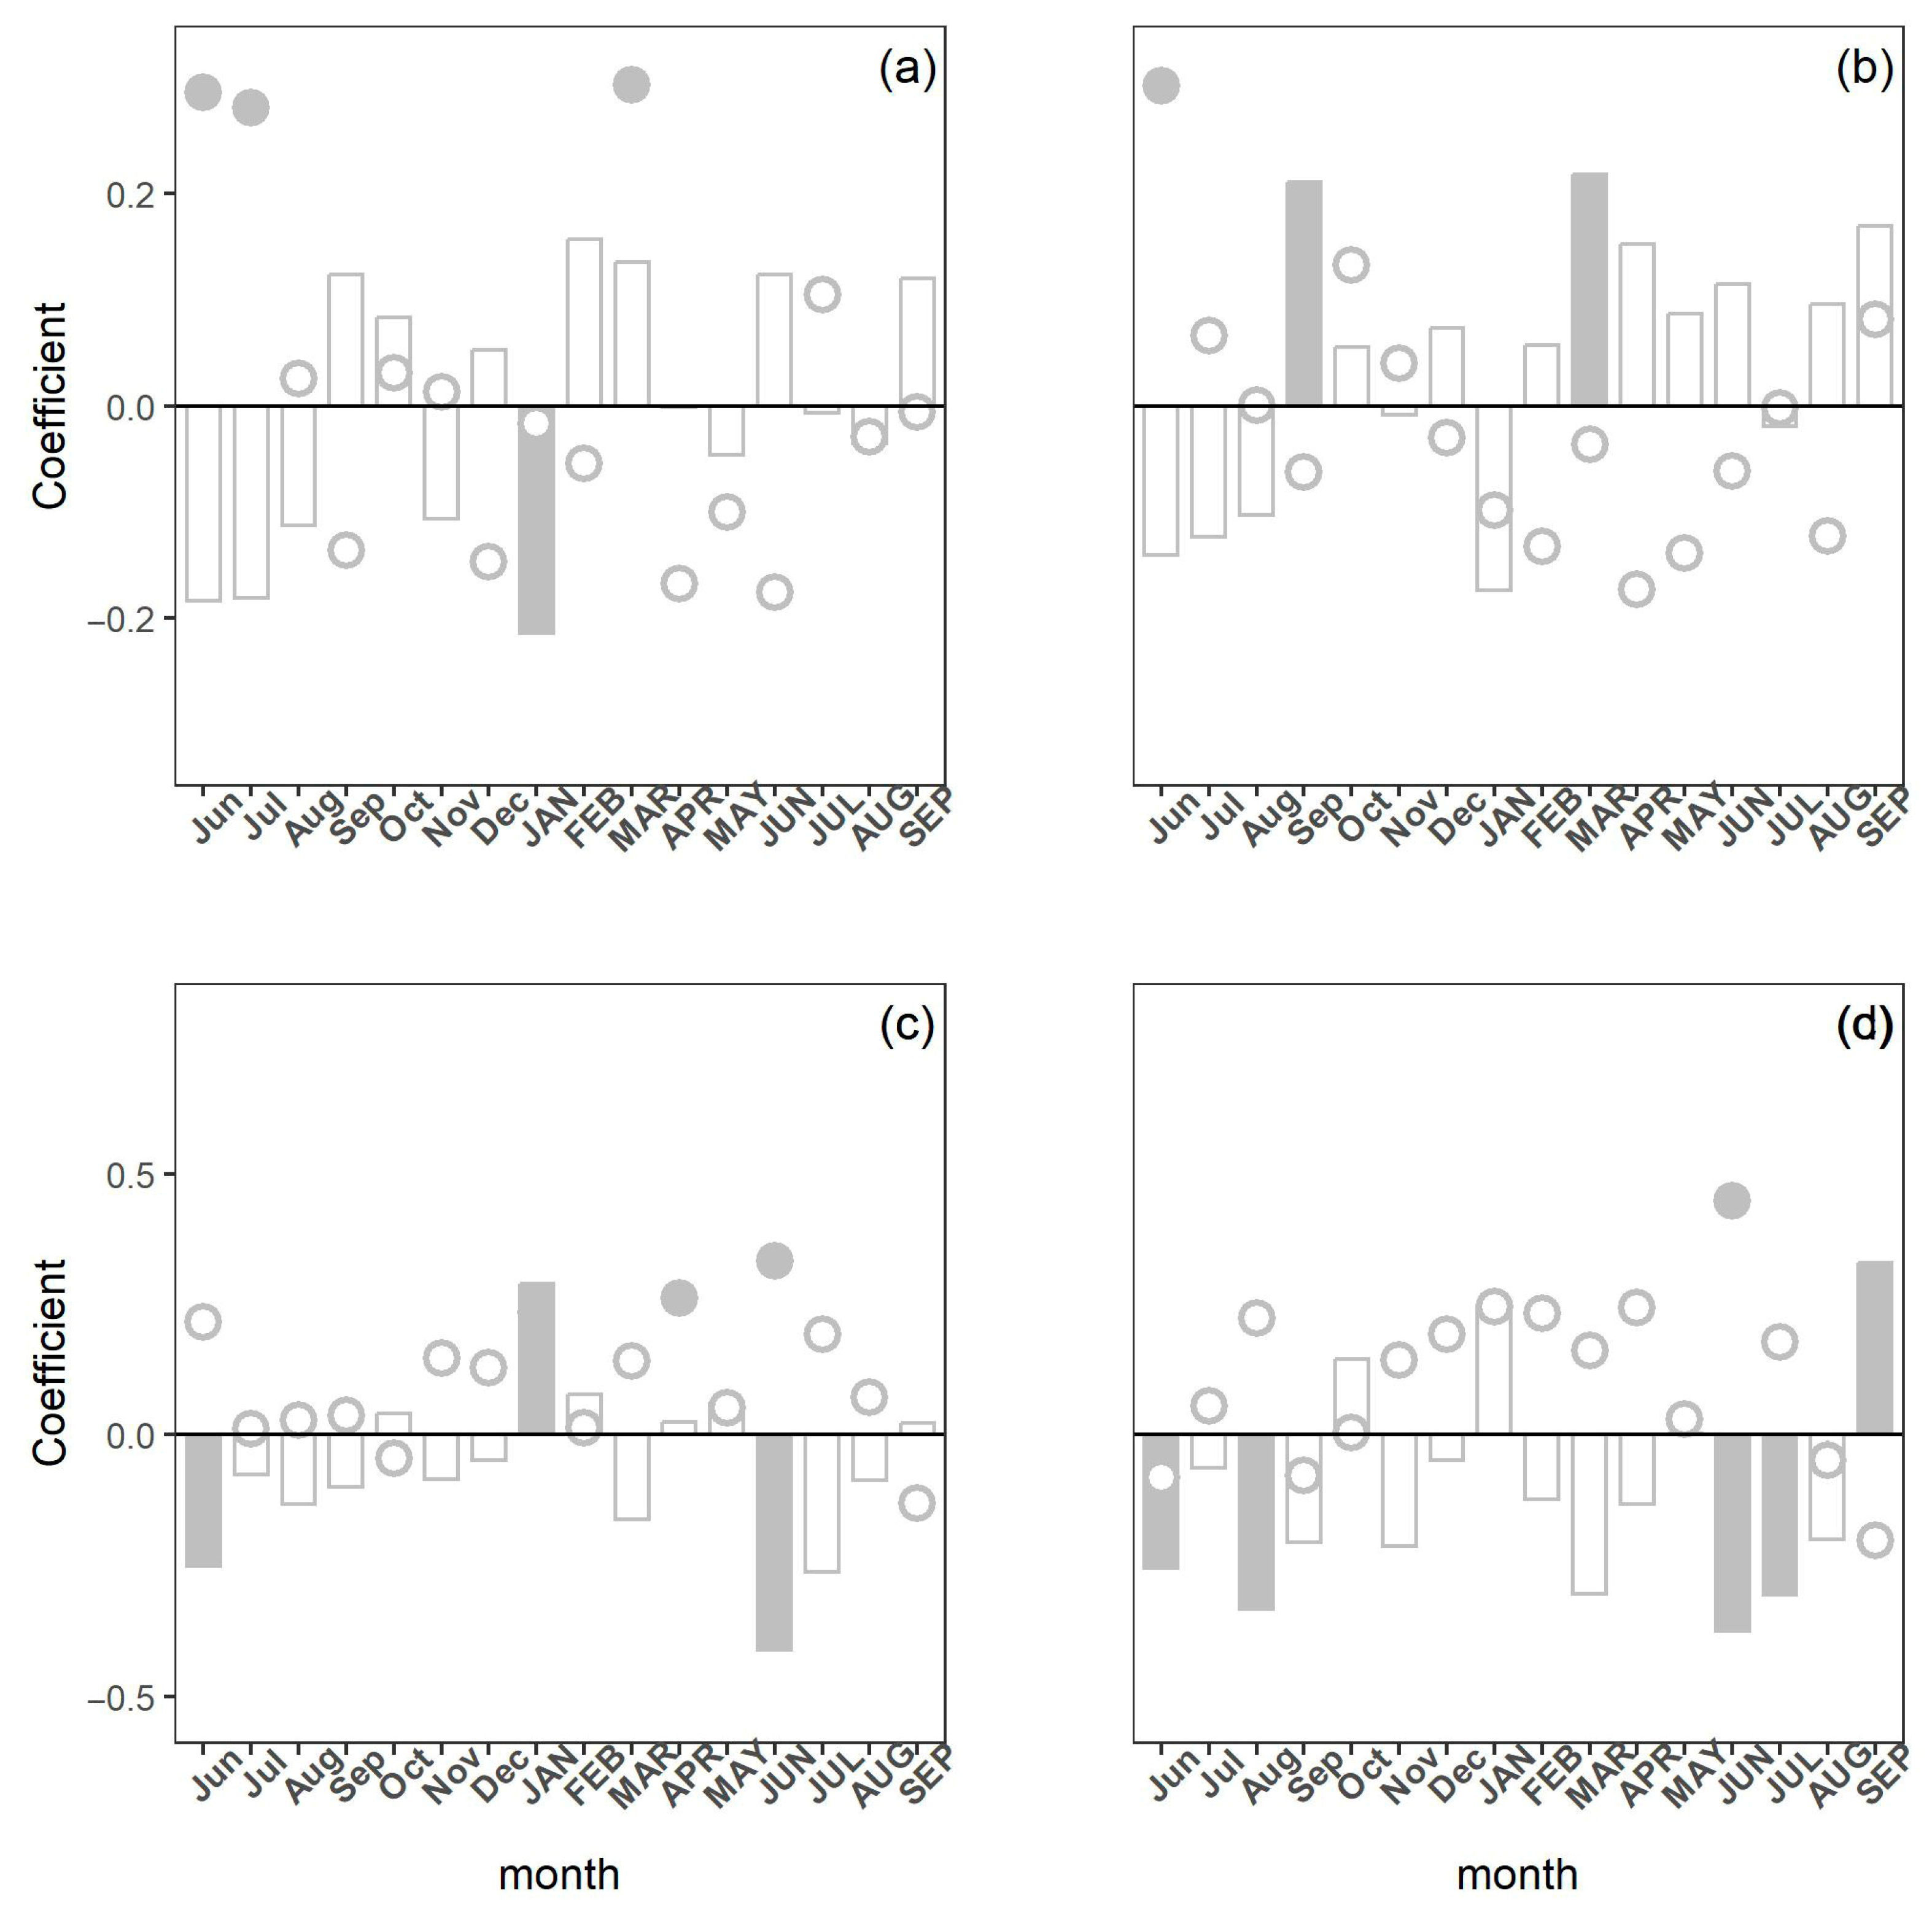
In oak, RWI was positively correlated with the precipitation in June and July from the previous year and with that in March of the current year. Only Tmax in January of the current year was negatively correlated with growth (Figure 5a).
In beech, RWI was positively correlated with the precipitation of the previous year’s June and with the Tmax of the previous September and current March (Figure 5a).
In both species, Δ13C showed a negative correlation with Tmax during the summer of the previous year, as well as with Tmax during the summer months of the current year (Figure 5c,d). In Turkey oak, Δ13C was positively correlated with the precipitation in April and June of the current year. In beech, only the precipitation in June of the current year affected the Δ13C (Figure 5d).

3.4. Interaction Between iWUE and Radial Growth

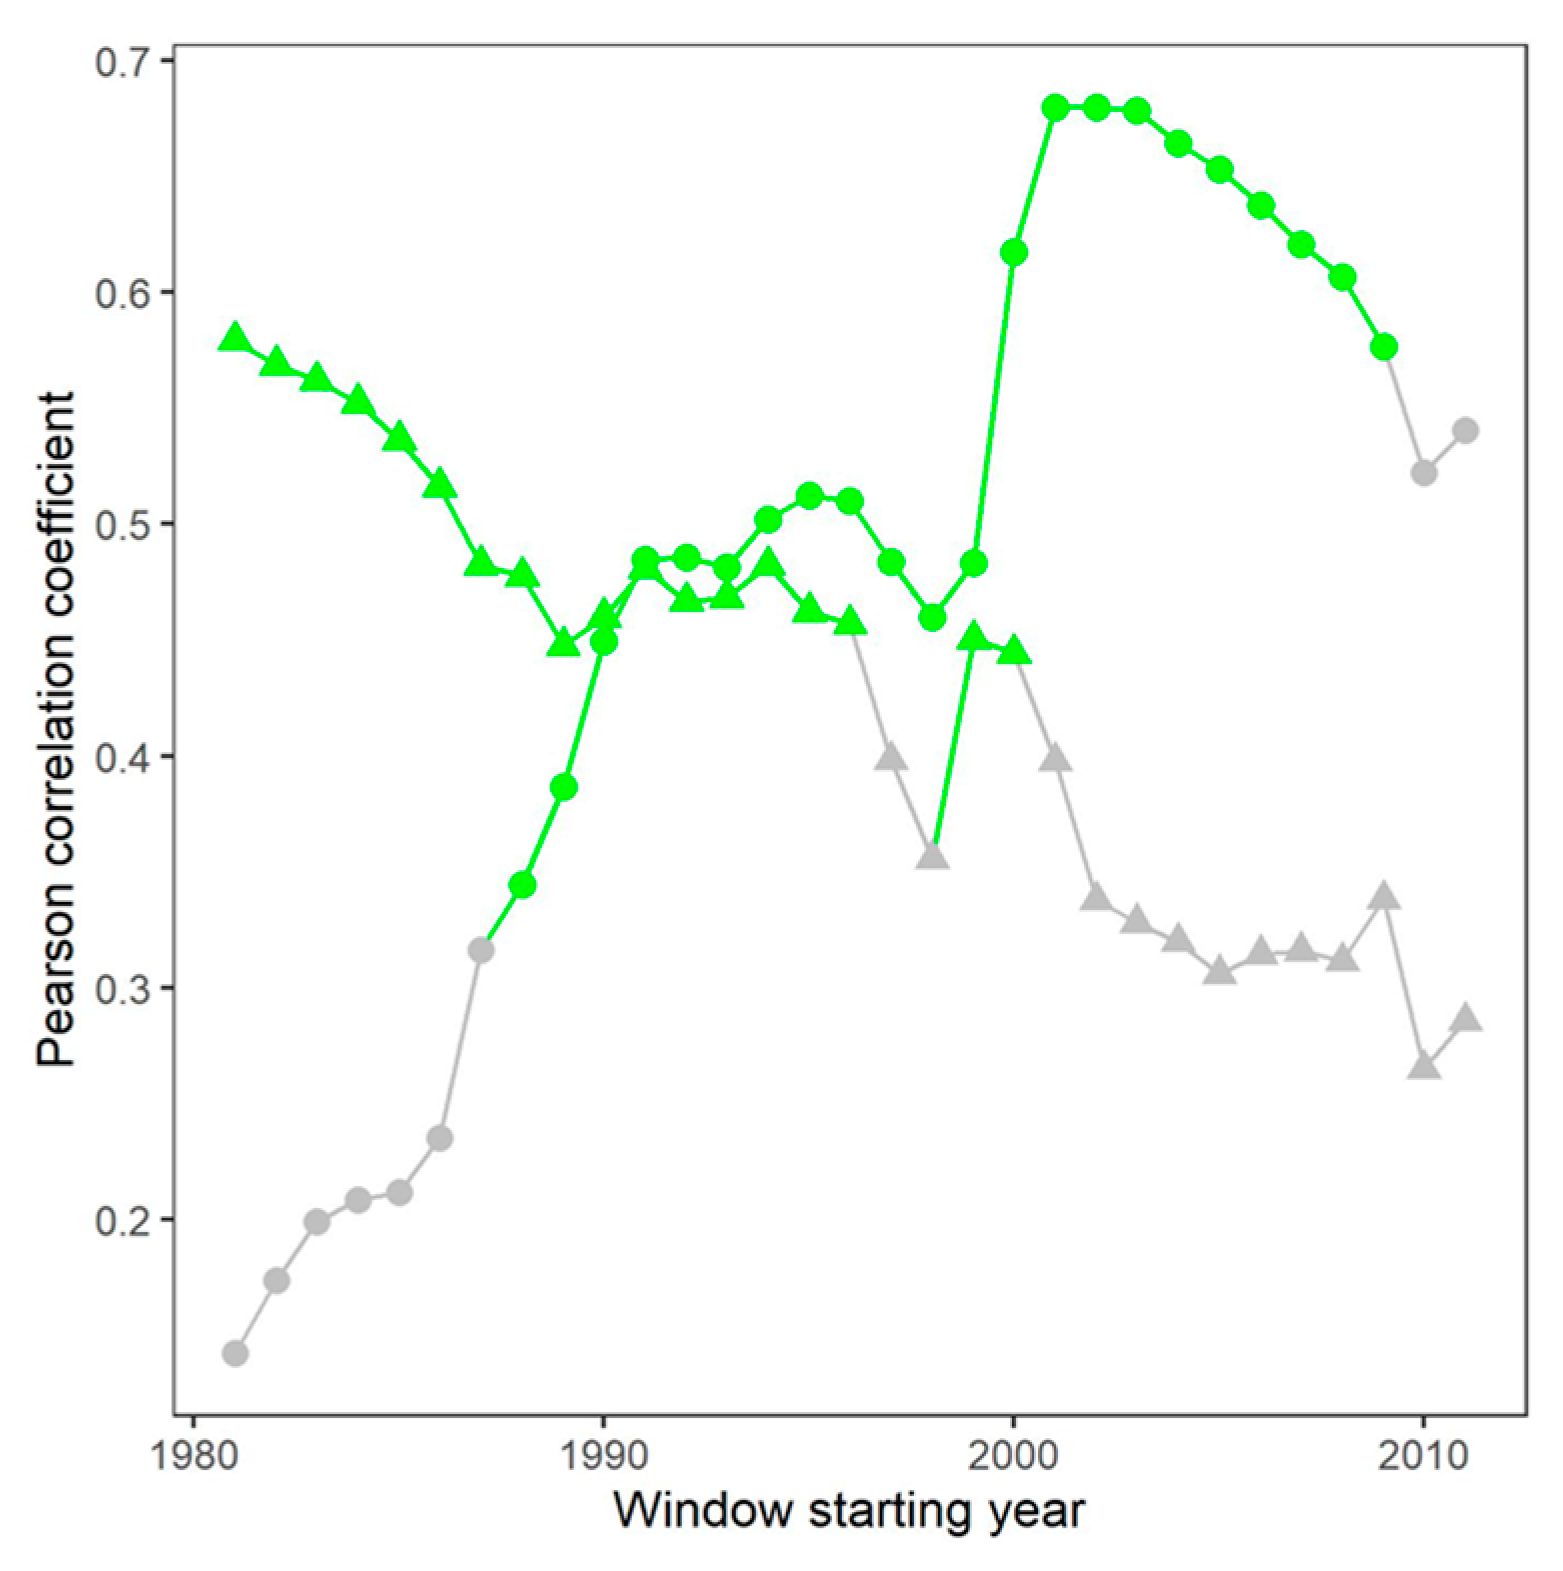
We analyzed how the relationships between BAI and intrinsic iWUE evolved over time for beech and Turkey oak, using a moving-window approach with progressively shrinking time windows (1981–2020 to 2010–2020) (Figure 6).
For beech, correlations were initially weak and not statistically significant through the 1980s and early 1990s. However, from the window starting in 1988 onwards, the correlation became statistically significant, strengthening steadily into the early 2000s. The correlation peaked around the 2001–2002 (r = 0.68, p < 0.001), suggesting a robust positive relationship during that period. After 2009, significance was lost, also in relation to the low number of observations.
For Turkey oak, the correlation was already significant and strong from the beginning of the analysis period (1981), with high coefficients (r = 0.58–0.68, p < 0.001) persisting until the late 1990s. A temporary decline in significance occurred in the windows starting in 1997 and 1998, followed by a brief recovery. However, the correlation progressively weakened and lost statistical significance after 2001.

4. Discussion

4.1. Tree Growth and the Influence of Climatic Factors

In both beech and oak, the observed fluctuations in RWI and BAI may be due to variations in the climate during the trees’ growth and the cyclical phases of forest development. We found that beech exhibited a higher growth rate than Turkey oak. However, this finding contrasts with results obtained in a thermophilic beech forest, where older beech trees were affected by a decline in favourable microclimatic conditions, which weakened their future survival capacity [52]. This difference highlights the crucial role of the development stage, with younger trees more resilient, and the sensitivity of this species to microclimatic conditions. The BAI of beech in our study was comparable to values reported for other stands growing within the elevation range of this species [30,53,54]. This suggests that microclimatic conditions are fundamental for its growth. Indeed, during glaciations, mountain vegetation zones moved towards lower altitudes because of the expansion of ice sheets [55]. It was only after the ice sheets retreated that the beech trees moved back to higher altitudes where they can currently be found [56,57], leaving sporadic beech forests at lower altitudes, with favorable environmental conditions. For example, forests are frequent in the volcanic area of Central Italy, even around 450 m [4,18,52]. An example of this is in Oriolo Romano, where the presence of large trees led to maximum BAI values of 50–60 cm2 year−1 [4]. The radial growth in beech, a diffuse-porous species, begins after budburst and is highly dependent on leaf phenology and photosynthesis [58,59]. Hence, the fast maturation of leaves promotes ring formation. In beech stands, maximum forest carbon uptake and stem radial growth rates occur after full canopy development [60]. The positive correlation between growth and September’s temperature of the previous year could be related to its effect on starch metabolism. Indeed, an increase in temperature promotes starch synthesis rather than degradation [61], leading to its accumulation in parenchyma tissue. This allows beech trees to refill their reserve pool to fuel the leaves’ development in the subsequent year.
The growth rate of Turkey oak was consistent with that of stands growing under similar environmental conditions and under the same management system [26]. Similar BAI values were also found in Turkey oak growing in Hungary [62]. The radial growth of Turkey oak, a ring-porous species, begins before budburst [63,64]. The wood formation starts before photosynthesis, with earlywood formation fueled by carbon reserves [65]. This anticipation of new vessel production is necessary in order to restore the water flow pathway before the onset of transpiration, as a consequence of the winter embolism of large xylem vessels [66]. Therefore, the positive correlation between previous summer precipitation and growth is linked to conditions that affect the accumulation of reserves. Furthermore, the negative correlation between winter temperature and growth may be related to an increase in maintenance respiration that is strictly dependent on temperature [59] and totally fueled by carbon reserves [67,68]. This causes a depletion of C that is necessary for starting the vegetative period. Summer precipitation and temperature have been identified as key drivers of oak growth in temperate regions of Eastern Europe [62]. However, the importance of summer water balance diminishes in more xeric environments [69], suggesting a context-dependent relationship between climate variables and oak growth.
The importance of spring climatic conditions has been demonstrated for both species. Precipitation in early spring affects Turkey oak growth, highlighting the tree’s dependence on water availability in Mediterranean areas [4]. Furthermore, beech growth was positively related to temperatures in March, likely because higher temperatures promote the early onset of photosynthetic activity, enabling trees to grow under favourable conditions (i.e., soil water availability) [30,70].

4.2. Carbon Isotope Composition, Discrimination, Ci and iWUE

Variations in the δ13C of tree rings reflect the isotopic ratio of the atmospheric CO2 used in photosynthesis and the fractionation processes that occur during the diffusion of CO2 from the atmosphere to the intercellular airspace inside chloroplasts during the carboxylation process by Rubisco and post-photosynthetic fractionation during tree ring formation [24,71]. A declining trend in tree ring δ13C was observed in both oak and beech, which is consistent with previous findings [72,73]. These negative trends in δ13C reflect the physiological response of trees to climate variation, the anthropogenic increase in the atmospheric CO2 concentration, as well as the decreasing δ13C values of atmospheric CO2 due to the burning of fossil fuels, known as the Suess effect [74]. Both species have shown an adaptation to environmental variation. The negative correlations between Δ13C and summer temperatures and the positive correlation with precipitation suggest the expected influence of climatic constraints on inter-annual variation in C discrimination. This serves as a proxy for the plant strategy in the water and carbon economy. However, if stomata respond to increased CO2 by slightly reducing conductance, a reduction in transpiration would occur, even with constant Ci/Ca. These adjustments in gas exchange could lead to an increase in iWUE by the trees [50,75]. The observed trends in δ13C, Δ13C, Ci and iWUE are similar between the two species, with peaks and troughs occurring approximately in the same periods. Both species showed an increase in iWUE throughout the analyzed years, while Ci/Ca remained stable. This increase in iWUE, despite a constant Ci/Ca ratio, suggests a proportional regulation of stomatal conductance and photosynthetic rates [22,76]. As Ca rises and Ci increases, photosynthesis is typically stimulated [77]. Conversely, if stomata respond to increased CO2 by slightly reducing conductance, a reduction in transpiration would occur, even with constant Ci/Ca. These adjustments in gas exchange could lead to an increase in iWUE by the trees. Over the last 40 years, iWUE increased slightly more in beech than in oak, with gains of 45.6% and 35.2%, respectively. This increase in iWUE aligns with the broader trend observed around the world [78,79].

4.3. iWUE and Radial Growth

The influence of rising iWUE on tree growth may depend on the local microclimatic conditions and on the phenological, as well as physiological, responses of trees [80,81]. The temporal dynamics of the correlation between BAI and iWUE reveal contrasting trajectories for the two species. For European beech, the initially weak and non-significant relationship gradually strengthened over time, becoming statistically significant from the late 1980s onwards and peaking in the early 2000s. This trend suggests an increasing coupling between growth and water-use efficiency, reflecting the active physiological adjustments to environmental changes such as the rising atmospheric CO2 level and increasing drought pressure. In particular, warming-related drought may have led to a reduction in stomatal conductance to prevent hydraulic failure [33,82]. This, in turn, slowed down photosynthetic rates and carbon assimilation, implying a tradeoff between resource use efficiency and stem growth [83].
In contrast, Turkey oak displayed a strong and significant correlation between BAI and iWUE early in the time series, implying that growth and water-use efficiency were closely linked during the 1980s and 1990s. The subsequent decline in significance and correlation strength after 2001 suggests a decoupling of these processes in recent decades. This may reflect a shift in the factors limiting growth (e.g., nutrient or hydraulic constraints) or the saturation of the iWUE response under prolonged environmental stress. Around 2000, for both species, we observed an increase in BAI for both species, along with a strong correlation with iWUE. This could reflect the impact of the conversion from coppice to high forest that occurred at the study site when the stand was about 40 years old. Indeed, according to local forestry regulations, the first thinning is prescribed when coppice stands reach 35 to 50 years of age, approximately one and a half times the typical rotation age of coppice stands at the time of conversion [84,85]. Hence, the surviving beech trees, in particular, benefited from reduced competition for resources, allowing for gradual regrowth in subsequent years [86]. The impact of thinning on beech tree physiology was also observed in other stands growing in the Mediterranean mountains and Central Europe [30]. Thinning drastically reduces the leaf area index, enabling the surviving trees to expand their canopies laterally, for a faster occupation of free space [87]. This deeply alters the ratio of shade to light leaves, increasing the number of light leaves with higher photosynthetic rates and similar stomatal conductance [88]. Therefore, the iWUE is mostly controlled by the A, which is mirrored in BAI, then gs. Our results confirmed the different sensitivities of beech and oak to silvicultural treatments, as reported across many studies in different regions of Europe [37,52,89].

5. Conclusions

Stable carbon isotopes (δ13C) combined with dendrochronological analyses provided valuable insights into species-specific ecophysiological responses related to growth and intrinsic water-use efficiency (iWUE). We tested the hypothesis that beech trees, growing near the lower limit of their elevational distribution, would perform less effectively than Turkey oak, which grows within its typical elevation range. However, our results did not support this hypothesis, as no significant differences in growth or physiological responses were found between the two species. This may be due to the impact of forest management practices on beech trees, which could have masked potential species-specific differences. Despite the pressures of climate change on marginal populations, favorable microclimatic conditions and active forest management seem to enhance the plasticity of both species. Furthermore, conserving low-altitude beech populations could be vital in identifying drought-resistant genotypes. These could then be used to restore degraded ecosystems by establishing plantations adapted to future climate scenarios.

Author Contributions

Conceptualization, N.R., S.P. and E.D.; methodology, N.R., S.P. and E.D.; formal analysis, N.R., S.P., E.D. and M.C.; investigation, N.R., S.P. and E.D.; writing—original draft preparation, N.R., S.P. and E.D.; writing—review and editing, N.R., S.P., E.B., M.C. and E.D.; funding acquisition, S.P. and E.B. All authors have read and agreed to the published version of the manuscript.

Funding

This research was funded by Programma di Sviluppo Rurale per l’Umbria 2014–2020—Misura 16—Sottomisura 16.5—Intervento 16.5.1 Sostegno per azioni congiunte per la mitigazione del cambiamento climatico e l’adattamento ad esso e sostegno per approcci comuni ai progetti e alle pratiche ambientali in corso, Project title “Adattamento ai cambiamenti climatici ed azioni di resilienza nelle aree interne del sud ovest dell’orvietano (A.C.A.R.O).” and “Project funded under the National Recovery and Resilience Plan (NRRP), Mission 4 Component 2 Investment 1.4—Call for tender No. 3138 of 16 December 2021, rectified by Decree n.3175 of 18 December 2021 of Italian Ministry of University and Research funded by the European Union—NextGenerationEU; Award Number: Project code CN 00000033, Concession Decree No. 1034 of 17 June 2022 adopted by the Italian Ministry of University and Research, CUP B83C22002910001, Project title “National Biodiversity Future Center—NBFC.

Data Availability Statement

Dataset available on request from the authors.

Acknowledgments

We express our sincere appreciation to Anna Endreny, whose careful language editing greatly improved the clarity and readability of the manuscript.

Conflicts of Interest

The authors declare no conflicts of interest.

References

  1. De Laurentis, D.; Papitto, G.; Cindolo, C.; Cocciufa, C.; Clementel, F.; Morelli, S.; Rizzo, M.; Zanotelli, S. Inventario Forestale Nazionale INFC2015; Carabinieri Command of Forestry, Environmental and Agri-Food Units Studies and Projects Office of the Carabinieri Command for the Protection of Biodiversity and Parks: Rome, Italy, 2015. [Google Scholar]
  2. Lados, B.B.; Benke, A.; Borovics, A.; Köbölkuti, Z.A.; Molnár, C.; Nagy, L.; Gy Tóth, E.; Cseke, K. What we know about Turkey oak (Quercus cerris L.)—from evolutionary history to species ecology. Forestry 2024, 97, 497–511. [Google Scholar] [CrossRef]
  3. Jump, A.S.; Hunt, J.M.; Penuelas, J. Rapid climate change-related growth decline at the southern range edge of Fagus sylvatica. Glob. Change Biol. 2006, 12, 2163–2174. [Google Scholar] [CrossRef]
  4. Piovesan, G.; Biondi, F.; Di Filippo, A.; Alessandrini, A.; Maugeri, M. Drought-driven growth reduction in old beech (Fagus sylvatica L.) forests of the central Apennines, Italy. Glob. Change Biol. 2008, 14, 1265–1281. [Google Scholar] [CrossRef]
  5. Lindner, M.; Fitzgerald, J.; Zimmermann, N.; Reyer, C.; Delzon, S.; van der Maaten, E.; Schelhaas, M.; Lasch, P.; Eggers, J.; van der Maaten-Theunissen, M.; et al. Climate change and European forests: What do we know, what are the uncertainties, and what are the implications for forest management? J. Environ. Manag. 2014, 146, 69–83. [Google Scholar] [CrossRef] [PubMed]
  6. Peuke, A.D.; Schraml, C.; Hartung, W.; Rennenberg, H. Identification of drought-sensitive beech ecotypes by physiological parameters. New Phytol. 2002, 154, 373–387. [Google Scholar] [CrossRef] [PubMed]
  7. Fotelli, M.N.; Rennenberg, H.; Geßler, A. Effects of drought on the competitive interference of an early successional species (Rubus fruticosus) on Fagus sylvatica L. seedlings: 15N uptake and partitioning, responses of amino acids and other N compounds. Plant Biol. 2002, 4, 311–320. [Google Scholar] [CrossRef]
  8. Kostić, S.; Levanič, T.; Orlović, S.; Matović, B.; Stojanović, D.B. Turkey oak (Quercus cerris L.) is more drought tolerant and better reflects climate variations compared to pedunculate oak (Quercus robur L.) in lowland mixed forests in northwestern Serbia: A stable carbon isotope ratio (δ13C) and radial growth approach. Ecol. Indic. 2022, 142, 109242. [Google Scholar] [CrossRef]
  9. Móricz, N.; Illés, G.; Mészáros, I.; Garamszegi, B.; Berki, I.; Bakacsi, Z.; Kámpel, J.; Szabó, O.; Rasztovits, E.; Cseke, K.; et al. Different drought sensitivity traits of young sessile oak (Quercus petraea (Matt.) Liebl.) and Turkey oak (Quercus cerris L.) stands along a precipitation gradient in Hungary. For. Ecol. Manag. 2021, 492, 119165. [Google Scholar] [CrossRef]
  10. Gómez-Guerrero, A.; Doane, T. Chapter Seven—The Response of Forest Ecosystems to Climate Change. In Climate Change Impacts on Soil Processes and Ecosystem Properties; Horwath, W.R., Kuzyakov, Y., Eds.; Developments in Soil Science; Elsevier: Amsterdam, The Netherlands, 2018; Volume 35, pp. 185–206. [Google Scholar]
  11. Kasper, J.; Weigel, R.; Walentowski, H.; Gröning, A.; Petritan, A.M.; Leuschner, C. Climate warming-induced replacement of mesic beech by thermophilic oak forests will reduce the carbon storage potential in aboveground biomass and soil. Ann. For. Sci. 2021, 78, 89. [Google Scholar] [CrossRef]
  12. Jump, A.S.; Cavin, L.; Hunter, P.D. Monitoring and managing responses to climate change at the retreating range edge of forest trees. J. Environ. Monit. 2010, 12, 1791–1798. [Google Scholar] [CrossRef] [PubMed]
  13. Di Filippo, A.; Biondi, F.; Čufar, K.; de Luis, M.; Grabner, M.; Maugeri, M.; Presutti Saba, E.; Schirone, B.; Piovesan, G. Bioclimatology of beech (Fagus sylvatica L.) in the Eastern Alps: Spatial and altitudinal climatic signals identified through a tree-ring network. J. Biogeogr. 2007, 34, 1873–1892. [Google Scholar] [CrossRef]
  14. Hartl-Meier, C.; Zang, C.; Büntgen, U.; Esper, J.; Rothe, A.; Göttlein, A.; Dirnböck, T.; Treydte, K. Uniform climate sensitivity in tree-ring stable isotopes across species and sites in a mid-latitude temperate forest. Tree Physiol. 2014, 35, 4–15. [Google Scholar] [CrossRef] [PubMed]
  15. Dittmar, C.; Zech, W.; Elling, W. Growth variations of Common beech (Fagus sylvatica L.) under different climatic and environmental conditions in EuropeÐa dendroecological study. For. Ecol. Manag. 2003, 173, 63–78. [Google Scholar] [CrossRef]
  16. Cavin, L.; Jump, A.S. Highest drought sensitivity and lowest resistance to growth suppression are found in the range core of the tree Fagus sylvatica L. not the equatorial range edge. Glob. Change Biol. 2017, 23, 362–379. [Google Scholar] [CrossRef] [PubMed]
  17. Nocentini, S. Structure and management of beech (Fagus sylvatica L.) forests in Italy. IForest 2009, 2, 105–113. [Google Scholar] [CrossRef]
  18. Piovesan, G.; Biondi, F.; Bernabei, M.; Di Filippo, A.; Schirone, B. Spatial and altitudinal bioclimatic zones of the Italian peninsula identified from a beech (Fagus sylvatica L.) tree-ring network. Acta Oecologica 2005, 27, 197–210. [Google Scholar] [CrossRef]
  19. Cavin, L.; Mountford, E.P.; Peterken, G.F.; Jump, A.S. Extreme drought alters competitive dominance within and between tree species in a mixed forest stand. Funct. Ecol. 2013, 27, 1424–1435. [Google Scholar] [CrossRef]
  20. Höhn, M.; Major, E.; Avdagic, A.; Bielak, K.; Bosela, M.; Coll, L.; Dinca, L.; Giammarchi, F.; Ibrahimspahic, A.; Mataruga, M.; et al. Local characteristics of the standing genetic diversity of european beech with high within-region differentiation at the eastern part of the range. Can. J. For. Res. 2021, 51, 1791–1798. [Google Scholar] [CrossRef]
  21. Rose, L.; Leuschner, C.; Köckemann, B.; Buschmann, H. Are marginal beech (Fagus sylvatica L.) provenances a source for drought tolerant ecotypes? Eur. J. For. Res. 2009, 128, 335–343. [Google Scholar] [CrossRef]
  22. Saurer, M.; Siegwolf, R.T.W.; Schweingruber, F.H. Carbon isotope discrimination indicates improving water-use efficiency of trees in northern Eurasia over the last 100 years. Glob. Change Biol. 2004, 10, 2109–2120. [Google Scholar] [CrossRef]
  23. Cherubini, P.; Battipaglia, G.; Innes, J.L. Tree Vitality and Forest Health: Can Tree-Ring Stable Isotopes Be Used as Indicators? Curr. For. Rep. 2021, 7, 69–80. [Google Scholar] [CrossRef]
  24. Geßler, A.; Ferrio, J.P.; Hommel, R.; Treydte, K.; Werner, R.A.; Monson, R.K. Stable isotopes in tree rings: Towards a mechanistic understanding of isotope fractionation and mixing processes from the leaves to the wood. Tree Physiol. 2014, 34, 796–818. [Google Scholar] [CrossRef] [PubMed]
  25. Mathias, J.M.; Thomas, R.B. Global tree intrinsic water use efficiency is enhanced by increased atmospheric CO2 and modulated by climate and plant functional types. Proc. Natl. Acad. Sci. USA 2021, 118, e2014286118. [Google Scholar] [CrossRef] [PubMed]
  26. Di Matteo, G.; De Angelis, P.; Brugnoli, E.; Cherubini, P.; Scarascia-Mugnozza, G. Tree-ring Δ13C reveals the impact of past forest management on water-use efficiency in a Mediterranean oak coppice in Tuscany (Italy). Ann. For. Sci. 2010, 67, 510. [Google Scholar] [CrossRef]
  27. McCarroll, D.; Gagen, M.H.; Loader, N.J.; Robertson, I.; Anchukaitis, K.J.; Los, S.; Young, G.H.F.; Jalkanen, R.; Kirchhefer, A.; Waterhouse, J.S. Correction of tree ring stable carbon isotope chronologies for changes in the carbon dioxide content of the atmosphere. Geochim. Cosmochim. Acta 2009, 73, 1539–1547. [Google Scholar] [CrossRef]
  28. Heilman, K.A.; Trouet, V.M.; Belmecheri, S.; Pederson, N.; Berke, M.A.; McLachlan, J.S. Increased water use efficiency leads to decreased precipitation sensitivity of tree growth, but is offset by high temperatures. Oecologia 2021, 197, 1095–1110. [Google Scholar] [CrossRef] [PubMed]
  29. Olano, J.M.; Sangüesa-Barreda, G.; García-López, M.A.; García-Hidalgo, M.; Rozas, V.; García-Cervigón, A.I.; Delgado-Huertas, A.; Hernández-Alonso, H. Water use efficiency and climate legacies dominate beech growth at its rear edge. J. Ecol. 2023, 111, 2160–2171. [Google Scholar] [CrossRef]
  30. Rezaie, N.; D’Andrea, E.; Bräuning, A.; Matteucci, G.; Bombi, P.; Lauteri, M. Do atmospheric CO2 concentration increase, climate and forest management affect iWUE of common beech? Evidences from carbon isotope analyses in tree rings. Tree Physiol. 2018, 38, 1110–1126. [Google Scholar] [CrossRef] [PubMed]
  31. Puchi, P.F.; Dalmonech, D.; Vangi, E.; Battipaglia, G.; Tognetti, R.; Collalti, A. Contrasting patterns of water use efficiency and annual radial growth among European beech forests along the Italian peninsula. Sci. Rep. 2024, 14, 6526. [Google Scholar] [CrossRef] [PubMed]
  32. Peñuelas, J.; Canadell, J.G.; Ogaya, R. Increased water-use efficiency during the 20th century did not translate into enhanced tree growth. Glob. Ecol. Biogeogr. 2011, 20, 597–608. [Google Scholar] [CrossRef]
  33. Levanič, T.; Čater, M.; McDowell, N.G. Associations between growth, wood anatomy, carbon isotope discrimination and mortality in a Quercus robur forest. Tree Physiol. 2011, 31, 298–308. [Google Scholar] [CrossRef] [PubMed]
  34. Linares, J.C.; Camarero, J.J. From pattern to process: Linking intrinsic water-use efficiency to drought-induced forest decline. Glob. Change Biol. 2012, 18, 1000–1015. [Google Scholar] [CrossRef]
  35. Canham, C.D.; Papaik, M.J.; Uriarte, M.; McWilliams, W.H.; Jenkins, J.C.; Twery, M.J. Neighborhood analyses of canopy tree competition along environmental gradients in New England forests. Ecol. Appl. 2006, 16, 540–554. [Google Scholar] [CrossRef] [PubMed]
  36. Zhang, Z.; Zhang, L.; Xu, H.; Creed, I.F.; Blanco, J.A.; Wei, X.; Sun, G.; Asbjornsen, H.; Bishop, K. Forest water-use efficiency: Effects of climate change and management on the coupling of carbon and water processes. For. Ecol. Manag. 2023, 534, 120853. [Google Scholar] [CrossRef]
  37. Verdonck, S.; Geussens, A.; Zweifel, R.; Thomaes, A.; Van Meerbeek, K.; Muys, B. Mitigating drought stress in European beech and pedunculate oak: The role of competition reduction. For. Ecosyst. 2025, 13, 100303. [Google Scholar] [CrossRef]
  38. Urrutia-jalabert, R.; Malhi, Y.; Barichivich, J.; Lara, A.; Delgado-huertas, A.; Rodríguez, C.G.; Cuq, E. Increased water use efficiency but contrasting tree growth patterns in Fitzroya cupressoides forests of southern Chile during recent decades. J. Geophys. Res. Biogeosci. 2015, 120, 2505–2524. [Google Scholar] [CrossRef]
  39. Voelker, S.L.; Meinzer, F.C.; Lachenbruch, B.; Brooks, J.R.; Guyette, R.P. Drivers of radial growth and carbon isotope discrimination of bur oak (Quercus macrocarpa Michx.) across continental gradients in precipitation, vapour pressure deficit and irradiance. Plant. Cell Environ. 2014, 37, 766–779. [Google Scholar] [CrossRef] [PubMed]
  40. Marchi, M.; Bucci, G.; Iovieno, P.; Ray, D. ClimateDT: A Global Scale-Free Dynamic Downscaling Portal for Historic and Future Climate Data. Environ. 2024, 11, 82. [Google Scholar] [CrossRef]
  41. R Core Team. A Language and Environment for Statistical Computing; R Core Team: Vienna, Austria, 2018. [Google Scholar]
  42. Bunn, A.G. A dendrochronology program library in R (dplR). Dendrochronologia 2008, 26, 115–124. [Google Scholar] [CrossRef]
  43. Phipps, R.L.; Whiton, J.C. Decline in long-term growth trends of white oak. Can. J. For. Res. 1988, 18, 24–32. [Google Scholar] [CrossRef]
  44. Buras, A.; Wilmking, M. Correcting the calculation of Gleichläufigkeit. Dendrochronologia 2015, 34, 29–30. [Google Scholar] [CrossRef]
  45. Eckstein, D.; Bauch, J. Beitrag zur Rationalisierung eines dendrochronologischen Verfahrens und zur Analyse seiner Aussagesicherheit. Forstwiss. Cent. 1969, 88, 230–250. [Google Scholar] [CrossRef]
  46. Liu, X.; Wang, W.; Xu, G.; Zeng, X.; Wu, G.; Zhang, X.; Qin, D. Tree growth and intrinsic water-use efficiency of inland riparian forests in northwestern China: Evaluation via δ13C and δ18O analysis of tree rings. Tree Physiol. 2014, 34, 966–980. [Google Scholar] [CrossRef] [PubMed]
  47. Portarena, S.; Farinelli, D.; Famiani, F.; Cinosi, N.; Traini, C.; Rezaei, N.; Brugnoli, E. Differential tolerance to summer stress conditions in two olive cultivars using the dendro-isotopic approach. Dendrochronologia 2024, 84, 126182. [Google Scholar] [CrossRef]
  48. Farquhar, G.D.; O’Leary, M.H.; Berry, J.A. On the Relationship between Carbon Isotope Discrimination and Intercellular Carbon Dioxide Concentration in Leaves. Aust. J. Plant Physiol. 1982, 9, 121–137. [Google Scholar] [CrossRef]
  49. Seibt, U.; Rajabi, A.; Griffiths, H.; Berry, J.A. Carbon isotopes and water use efficiency: Sense and sensitivity. Oecologia 2008, 155, 441–454. [Google Scholar] [CrossRef] [PubMed]
  50. Frank, D.C.; Poulter, B.; Saurer, M.; Esper, J.; Huntingford, C.; Helle, G.; Treydte, K.; Zimmermann, N.E.; Schleser, G.H.; Ahlström, A.; et al. Water-use efficiency and transpiration across European forests during the Anthropocene. Nat. Clim. Chang. 2015, 5, 579–583. [Google Scholar] [CrossRef]
  51. Zang, C.; Biondi, F. treeclim: An R package for the numerical calibration of proxy-climate relationships. Ecography 2015, 38, 431–436. [Google Scholar] [CrossRef]
  52. Mazza, G.; Monteverdi, M.C.; Altieri, S.; Battipaglia, G. Climate-driven growth dynamics and trend reversal of Fagus sylvatica L. and Quercus cerris L. in a low-elevation beech forest in Central Italy. Sci. Total Environ. 2024, 908, 168250. [Google Scholar] [CrossRef] [PubMed]
  53. Di Filippo, A.; Biondi, F.; Maugeri, M.; Schirone, B.; Piovesan, G. Bioclimate and growth history affect beech lifespan in the Italian Alps and Apennines. Glob. Change Biol. 2012, 18, 960–972. [Google Scholar] [CrossRef]
  54. Martinez del Castillo, E.; Zang, C.S.; Buras, A.; Hacket-Pain, A.; Esper, J.; Serrano-Notivoli, R.; Hartl, C.; Weigel, R.; Klesse, S.; Resco de Dios, V.; et al. Climate-change-driven growth decline of European beech forests. Commun. Biol. 2022, 5, 163. [Google Scholar] [CrossRef] [PubMed]
  55. Buonincontri, M.P.; Bosso, L.; Smeraldo, S.; Chiusano, M.L.; Pasta, S.; Di Pasquale, G. Shedding light on the effects of climate and anthropogenic pressures on the disappearance of Fagus sylvatica in the Italian lowlands: Evidence from archaeo-anthracology and spatial analyses. Sci. Total Environ. 2023, 877, 162893. [Google Scholar] [CrossRef] [PubMed]
  56. Magri, D. Patterns of post-glacial spread and the extent of glacial refugia of European beech (Fagus sylvatica). J. Biogeogr. 2008, 35, 450–463. [Google Scholar] [CrossRef]
  57. Magri, D.; Vendramin, G.G.; Comps, B.; Dupanloup, I.; Geburek, T.; Gömöry, D.; Latałowa, M.; Litt, T.; Paule, L.; Roure, J.M.; et al. A new scenario for the Quaternary history of European beech populations: Palaeobotanical evidence and genetic consequences, A new scenario for the Quaternary history of European beech populations: Palaeobotanical evidence and genetic consequences. New Phytol. 2006, 171, 199–221. [Google Scholar] [CrossRef] [PubMed]
  58. Čufar, K.; Prislan, P.; De Luis, M.; Gričar, J. Tree-ring variation, wood formation and phenology of beech (Fagus sylvatica) from a representative site in Slovenia, SE Central Europe. Trees-Struct. Funct. 2008, 22, 749–758. [Google Scholar] [CrossRef]
  59. D’Andrea, E.; Rezaie, N.; Prislan, P.; Gričar, J.; Collalti, A.; Muhr, J.; Matteucci, G. Frost and drought: Effects of extreme weather events on stem carbon dynamics in a Mediterranean beech forest. Plant Cell Environ. 2020, 43, 2365–2379. [Google Scholar] [CrossRef] [PubMed]
  60. Scartazza, A.; Sbrana, C.; D’Andrea, E.; Matteucci, G.; Rezaie, N.; Lauteri, M. Above-and belowground interplay: Canopy CO2 uptake, carbon and nitrogen allocation and isotope fractionation along the plant-ectomycorrhiza continuum. Plant Cell Environ. 2023, 46, 889–900. [Google Scholar] [CrossRef] [PubMed]
  61. Zwieniecki, M.A.; Tixier, A.; Sperling, O. Temperature-assisted redistribution of carbohydrates in trees. Am. J. Bot. 2015, 102, 1216–1218. [Google Scholar] [CrossRef] [PubMed]
  62. Móricz, N.; Mészáros, I.; Illés, G.Z.; Garamszegi, B.; Eötvös, C.B.; Kern, A.; Hirka, A.; Berki, I.; Borovics, A.; Hollós, R.; et al. Radial growth projections reveal site-specific futures of different oak species with contrasting water availability in SW Hungary. Front. For. Glob. Chang. 2025, 8, 1581222. [Google Scholar] [CrossRef]
  63. Zweifel, R.; Zimmermann, L.; Zeugin, F.; Newbery, D.M. Intra-annual radial growth and water relations of trees: Implications towards a growth mechanism. J. Exp. Bot. 2006, 57, 1445–1459. [Google Scholar] [CrossRef] [PubMed]
  64. Sass-Klaassen, U.; Sabajo, C.R.; den Ouden, J. Vessel formation in relation to leaf phenology in pedunculate oak and European ash. Dendrochronologia 2011, 29, 171–175. [Google Scholar] [CrossRef]
  65. Michelot, A.; Simard, S.; Rathgeber, C.; Dufrêne, E.; Damesin, C. Comparing the intra-annual wood formation of three European species (Fagus sylvatica, Quercus petraea and Pinus sylvestris) as related to leaf phenology and non-structural carbohydrate dynamics. Tree Physiol. 2012, 32, 1033–1045. [Google Scholar] [CrossRef] [PubMed]
  66. Walde, M.G.; Lehmann, M.M.; Gessler, A.; Vitasse, Y.; Diao, H. Stable Isotope Labelling Reveals Water and Carbon Fluxes in Temperate Tree Saplings Before Budbreak. Plant Cell Environ. 2024, 48, 805–817. [Google Scholar] [CrossRef] [PubMed]
  67. Trumbore, S.; Czimczik, C.I.; Sierra, C.A.; Muhr, J.; Xu, X. Non-structural carbon dynamics and allocation relate to growth rate and leaf habit in California oaks. Tree Physiol. 2015, 35, 1206–1222. [Google Scholar] [CrossRef] [PubMed]
  68. D’Andrea, E.; Rezaie, N.; Battistelli, A.; Gavrichkova, O.; Kuhlmann, I.; Matteucci, G.; Moscatello, S.; Proietti, S.; Scartazza, A.; Trumbore, S.; et al. Winter’s bite: Beech trees survive complete defoliation due to spring late-frost damage by mobilizing old C reserves. New Phytol. 2019, 224, 625–631. [Google Scholar] [CrossRef] [PubMed]
  69. Bose, A.K.; Scherrer, D.; Camarero, J.J.; Ziche, D.; Babst, F.; Bigler, C.; Bolte, A.; Dorado-Liñán, I.; Etzold, S.; Fonti, P.; et al. Climate sensitivity and drought seasonality determine post-drought growth recovery of Quercus petraea and Quercus robur in Europe. Sci. Total Environ. 2021, 784, 147222. [Google Scholar] [CrossRef] [PubMed]
  70. Silvestro, R.; Deslauriers, A.; Prislan, P.; Rademacher, T.; Rezaie, N.; Richardson, A.D.; Vitasse, Y.; Rossi, S. From Roots to Leaves: Tree Growth Phenology in Forest Ecosystems. Curr. For. Rep. 2025, 11, 12. [Google Scholar] [CrossRef]
  71. Belmecheri, S.; Lavergne, A. Compiled records of atmospheric CO2 concentrations and stable carbon isotopes to reconstruct climate and derive plant ecophysiological indices from tree rings. Dendrochronologia 2020, 63, 125748. [Google Scholar] [CrossRef]
  72. Duquesnay, A.; Bréda, N.; Stievenard, M.; Dupouey, J.L. Changes of tree-ring δ13C and water-use efficiency of beech (Fagus sylvatica L.) in north-eastern France during the past century. Plant Cell Environ. 1998, 21, 565–572. [Google Scholar] [CrossRef]
  73. Raffalli-Delerce, G.; Masson-Delmotte, V.; Dupouey, J.L.; Stievenard, M.; Breda, N.; Moisselin, J.M. Reconstruction of summer droughts using tree-ring cellulose isotopes: A calibration study with living oaks from Brittany (western France). Tellus B Chem. Phys. Meteorol. 2004, 56, 160–174. [Google Scholar] [CrossRef]
  74. Treydte, K.S.; Frank, D.C.; Saurer, M.; Helle, G.; Schleser, G.H.; Esper, J. Impact of climate and CO2 on a millennium-long tree-ring carbon isotope record. Geochim. Cosmochim. Acta 2009, 73, 4635–4647. [Google Scholar] [CrossRef]
  75. Saurer, M.; Spahni, R.; Frank, D.C.; Joos, F.; Leuenberger, M.; Loader, N.J.; Mccarroll, D.; Gagen, M.; Poulter, B.E.N.; Siegwolf, R.T.W.; et al. Spatial variability and temporal trends in water-use efficiency of European forests. Glob. Change Biol. 2014, 20, 3700–3712. [Google Scholar] [CrossRef] [PubMed]
  76. Adams, M.A.; Buckley, T.N.; Turnbull, T.L. Diminishing CO2-driven gains in water-use efficiency of global forests. Nat. Clim. Chang. 2020, 10, 466–471. [Google Scholar] [CrossRef]
  77. Giammarchi, F.; Cherubini, P.; Pretzsch, H.; Tonon, G. The increase of atmospheric CO2 affects growth potential and intrinsic water-use efficiency of Norway spruce forests: Insights from a multi-stable isotope analysis in tree rings of two Alpine chronosequences. Trees-Struct. Funct. 2017, 31, 503–515. [Google Scholar] [CrossRef]
  78. Tognetti, R.; Lombardi, F.; Lasserre, B.; Cherubini, P.; Marchetti, M. Tree-Ring Stable Isotopes Reveal Twentieth-Century Increases in Water-Use Efficiency of Fagus sylvatica and Nothofagus spp. in Italian and Chilean Mountains. PLoS ONE 2014, 9, e113136. [Google Scholar] [CrossRef] [PubMed]
  79. Soh, W.K.; Yiotis, C.; Murray, M.; Parnell, A.; Wright, I.J.; Spicer, R.A.; Lawson, T.; Caballero, R.; McElwain, J.C. Rising CO2 drives divergence in water use efficiency of evergreen and deciduous plants. Sci. Adv. 2019, 5, eaax7906. [Google Scholar] [CrossRef] [PubMed]
  80. Dorado-Liñán, I.; Valbuena-Carabaña, M.; Cañellas, I.; Gil, L.; Gea-Izquierdo, G. Climate Change Synchronizes Growth and iWUE Across Species in a Temperate-Submediterranean Mixed Oak Forest. Front. Plant Sci. 2020, 11, 706. [Google Scholar] [CrossRef] [PubMed]
  81. Shestakova, T.A.; Voltas, J.; Saurer, M.; Berninger, F.; Esper, J.; Andreu-Hayles, L.; Daux, V.; Helle, G.; Leuenberger, M.; Loader, N.J.; et al. Spatio-temporal patterns of tree growth as related to carbon isotope fractionation in European forests under changing climate. Glob. Ecol. Biogeogr. 2019, 28, 1295–1309. [Google Scholar] [CrossRef]
  82. Santruckova, H.; Šantrůček, J.; Šetlík, J.; Svoboda, M.; Kopáček, J. Carbon isotopes in tree rings of Norway spruce exposed to atmospheric pollution. Environ. Sci. Technol. 2007, 41, 5778–5782. [Google Scholar] [CrossRef] [PubMed]
  83. Michelot-Antalik, A.; Granda, E.; Fresneau, C.; Damesin, C. Evidence of a seasonal trade-off between growth and starch storage in declining beeches: Assessment through stem radial increment, non-structural carbohydrates and intra-ring δ13C. Tree Physiol. 2019, 39, 831–844. [Google Scholar] [CrossRef] [PubMed]
  84. Mariotti, B.; Alberti, G.; Maltoni, A.; Tani, A.; Piussi, P. Beech coppice conversion to high forest: Results from a 31-year experiment in Eastern Pre-Alps. Ann. For. Sci. 2017, 74, 44. [Google Scholar] [CrossRef]
  85. Notarangelo, M.; La Marca, O. Growth analysis of an aged Turkey oak coppice under conversion into high forest. Ann. Silvic. Res. 2021, 46, 84–92. [Google Scholar] [CrossRef]
  86. Merlin, M.; Perot, T.; Perret, S.; Korboulewsky, N.; Vallet, P. Effects of stand composition and tree size on resistance and resilience to drought in sessile oak and Scots pine. For. Ecol. Manag. 2015, 339, 22–33. [Google Scholar] [CrossRef]
  87. Bayer, D.; Pretzsch, H. Reactions to gap emergence: Norway spruce increases growth while european beech features horizontal space occupation–evidence by repeated 3D TLS measurements. Silva Fenn. 2017, 51, 7748. [Google Scholar] [CrossRef]
  88. Scartazza, A.; Di Baccio, D.; Bertolotto, P.; Gavrichkova, O.; Matteucci, G. Investigating the European beech (Fagus sylvatica L.) leaf characteristics along the vertical canopy profile: Leaf structure, photosynthetic capacity, light energy dissipation and photoprotection mechanisms. Tree Physiol. 2016, 36, 1060. [Google Scholar] [CrossRef] [PubMed]
  89. Niccoli, F.; Pelleri, F.; Manetti, M.C.; Sansone, D.; Battipaglia, G. Effects of thinning intensity on productivity and water use efficiency of Quercus robur L. For. Ecol. Manag. 2020, 473, 118282. [Google Scholar] [CrossRef]
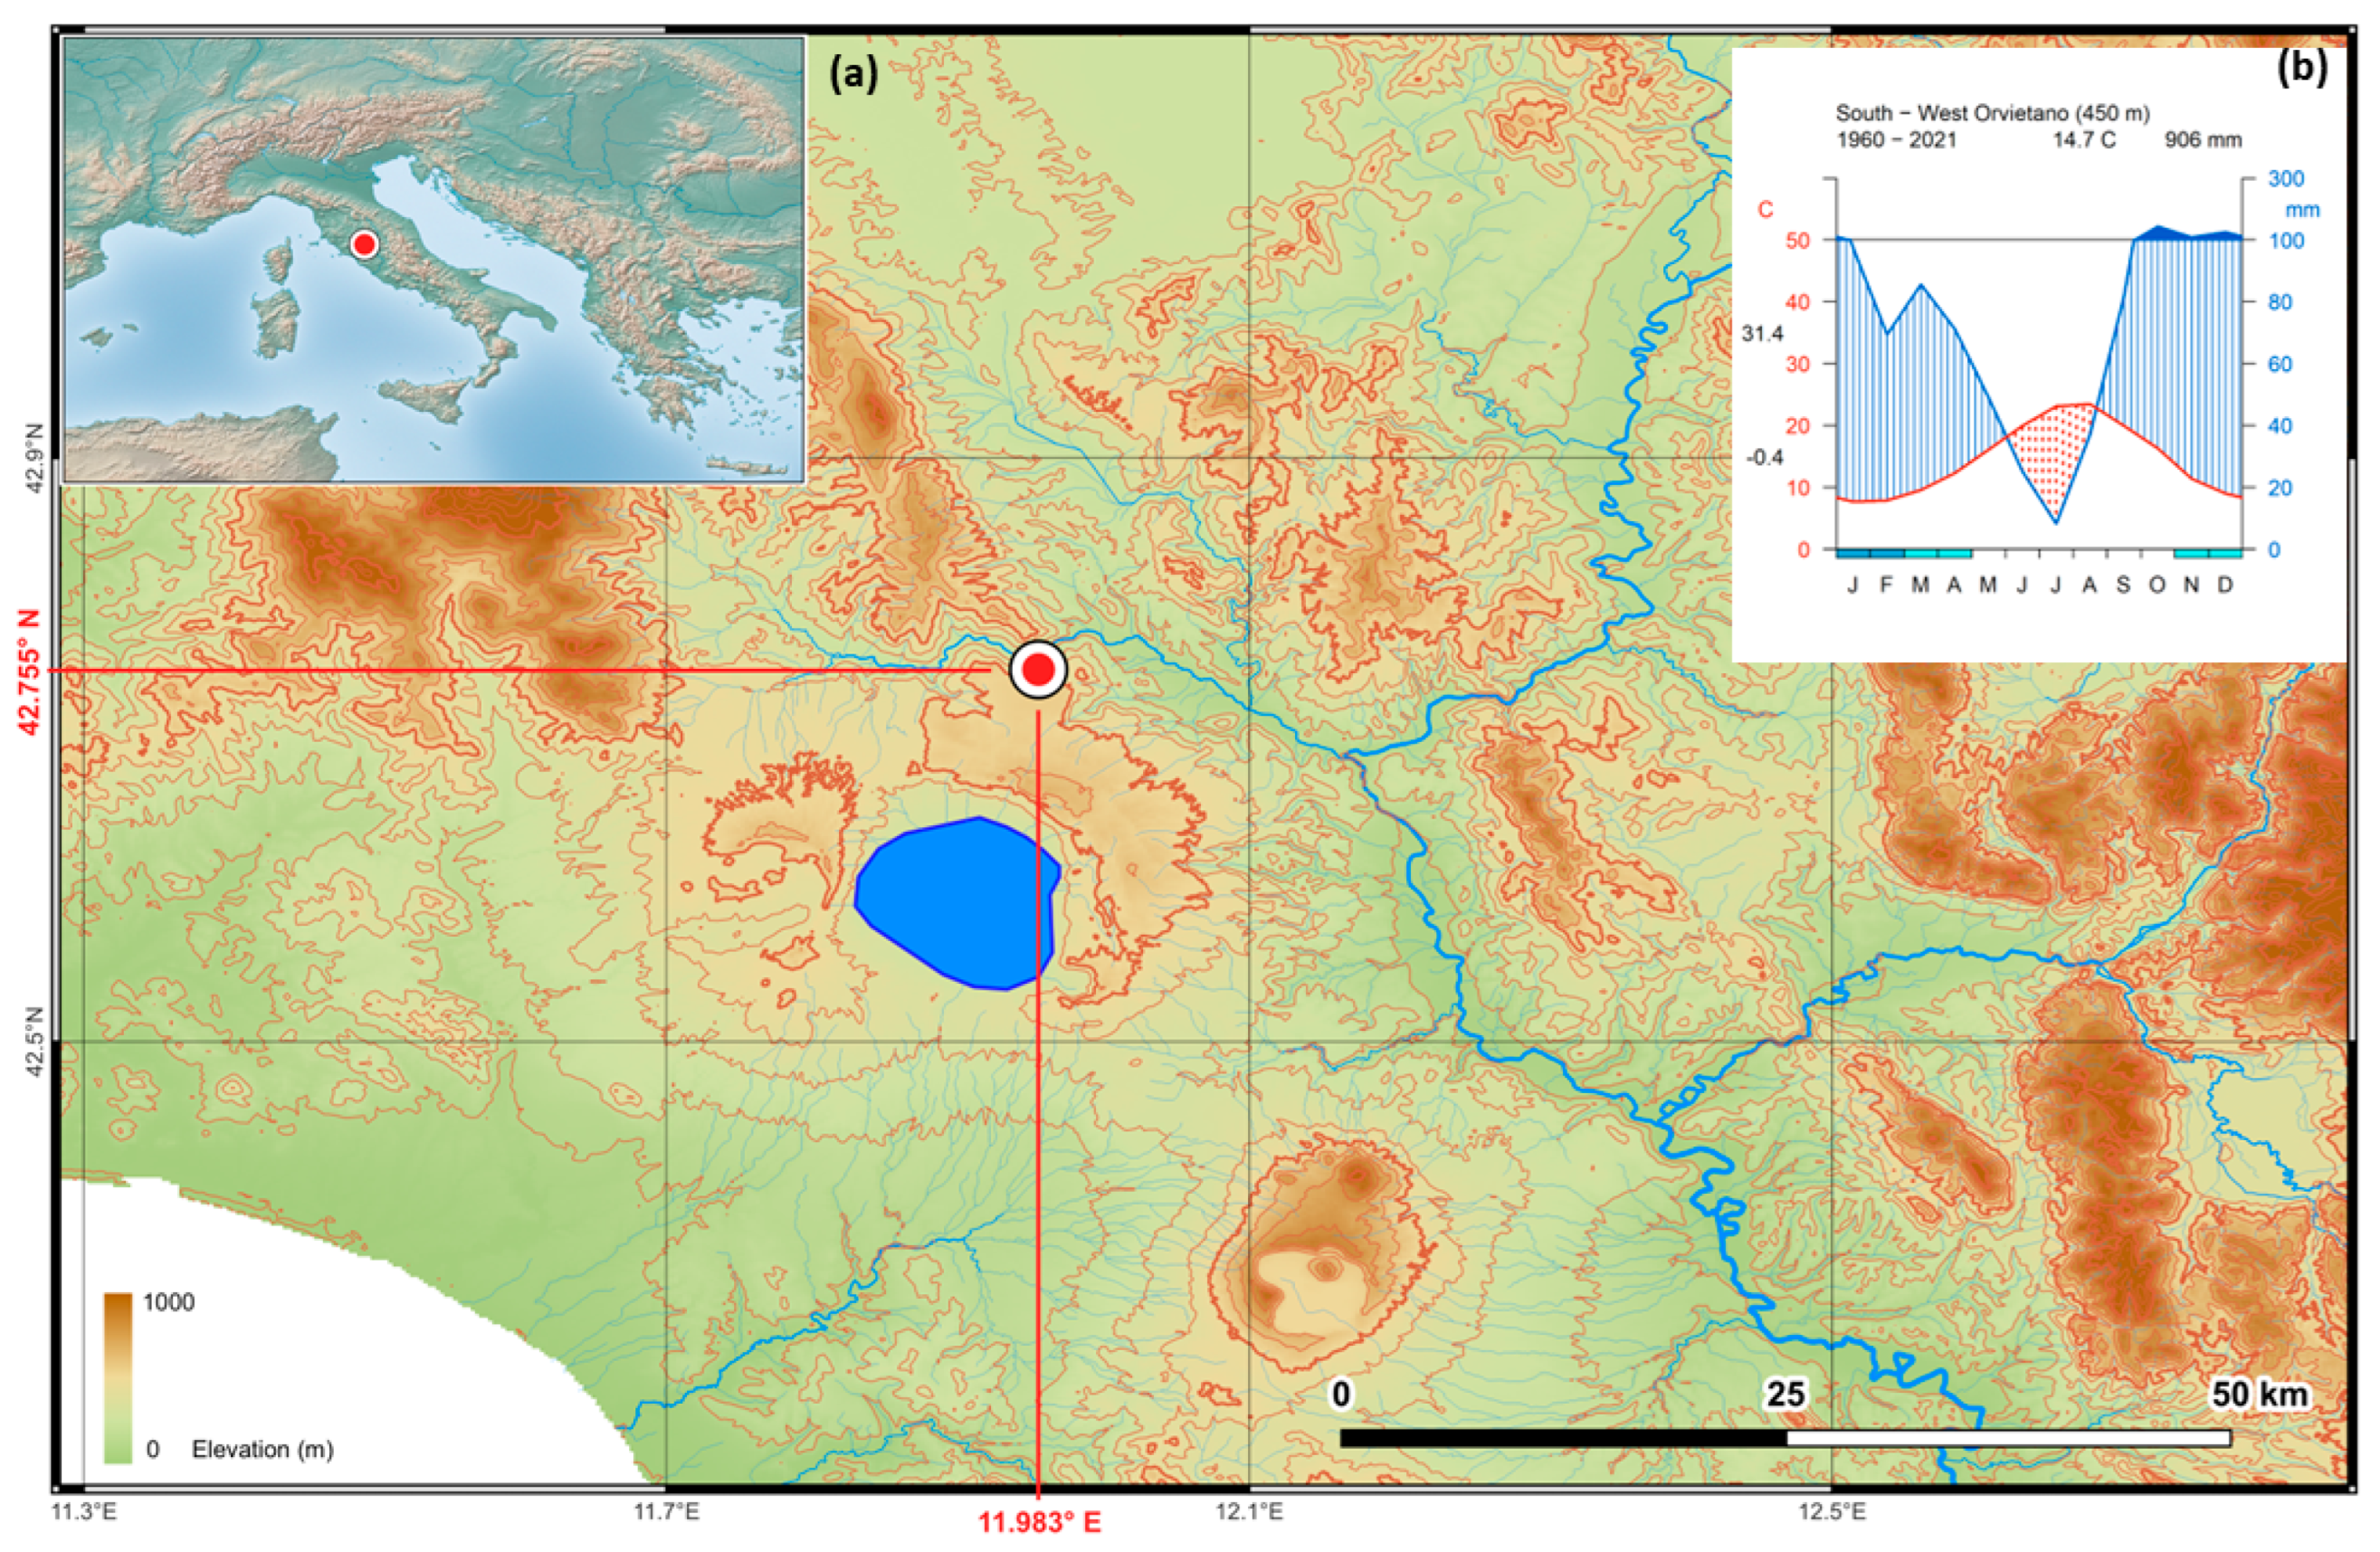
Figure 1. (a) Red dot represents the study area location in Umbria region at an elevation of 450 m a.s.l. Inset graph (b) is the Walter Lieth climate diagram of the study area. Monthly mean temperature is represented in red. Monthly precipitation is represented by the blue line. Daily maximum average temperature of the hottest month and daily minimum average temperature of the coldest month are frequently used in vegetation studies and are labeled in black at the left margin of the diagram. When the precipitation graph lies under the temperature graph (P < 2T), we have an arid period (filled in dotted red vertical lines); otherwise, the period is considered wet (filled in blue lines). The probable frost months (when absolute monthly minimums are equal or lower than 0 °C) are represented by cyan rectangles.
Forests 16 01210 g001
Figure 2. Tree ring width (TRW, (a)), Ring Width Index (RWI, (b)) and basal area increment (BAI, (c)) of Turkey oak (QUCE, blue) and beech (FASY, red). Dashed lines represent the likely thinning that occurred in the site.
Forests 16 01210 g002
Figure 3. C (a), Δ13C (b), Ci (c) and iWUE (d) patterns reported for oak (QUCE, blue line) and beech (FASY, red line) for the period 1981–2020. The mean values are averaged over 5 plants per species. Bars represent the standard error for each year. The dashed line represents the likely thinning that occurred on the site.
Forests 16 01210 g003
Figure 4. Intrinsic water-use efficiency (iWUE) (black lines) for Turkey oak (QUCE) and beech (FASY) in relation to the three possible different scenarios based on the theoretical response of trees to rising atmospheric CO2/Ci constant (blue lines), Ci/Ca constant (green line), Ca/Ci constant (magenta line).
Forests 16 01210 g004
Figure 5. Correlations between climatic variables (Tmax, column and PP, point) and RWI (a,b) and Δ13C (c,d) for Turkey oak (a,c) and beech (b,d). The significant correlations (p < 0.05) were filled in grey. The months reported with lowercase letters indicate the previous growth year; the months reported with uppercase letters indicate the current year.
Forests 16 01210 g005
Figure 6. Temporal dynamics of the Pearson correlation between basal area increment (BAI) and intrinsic water-use efficiency (iWUE) for European beech (circles) and Turkey oak (triangles), based on a moving-window analysis with progressively shrinking time windows (1981–2020 to 2010–2020). Each point represents the correlation for a specific window starting year, with green point indicating the statistically significant correlations (p < 0.05).
Forests 16 01210 g006
Table 1. Basal area is the cross-sectional area of a tree stem measured at breast height (1.3 m above the ground); tree density represents the number of trees per hectare; mean tree diameter is the diameter of tree with the mean basal area.
StandsBasal Area
(m2 ha−1)
Tree Density
(n ha−1)
Mean Tree Diameter
(cm)
Quercus cerris4648034.9
Fagus sylvatica4742836.9
Table 2. Summary of the sampled tree rings and chronologies: n is the number of sampled trees; DBH is the diameter measured at 130 cm of stem height; tree age is the mean (±SE) of the sampled tree; mean TRW is the mean of the measured tree ring widths; EPS is the expressed population signal, which indicates how a chronology based on a subsample of trees is representative of the stand dynamic. GLK sel represents the range of the GLK values of the cores selected for isotopic analysis; DBH iso, mean (±SE) diameter of selected trees (cm).
SpeciesNDBH
(cm)
Tree Age
(Year)
Mean TRW
(mm)
EPSGLK SelDBH Iso
(cm)
Quercus cerris3242 ± 361 ± 33.26 ± 0.320.89166–8439.5 ± 4.1
Fagus sylvatica1345 ± 260 ± 23.33 ± 0.240.86663–8250.1 ± 3.1
Table 3. Mean, standard deviation, minimum and maximum values of δ13C, Δ13C, Ci and iWUE found for oak and beech.
Quercus cerrisFagus sylvatica
VariablesMeanSDMinMaxMeanSDMinMax
δ13C (‰)−26.20.5−27.1−25.5−26.40.8−27.3−25.7
Δ13C (‰)17.80.417.018.517.90.816.818.9
Ci (ppm)220.913.2198.8245.0223.312.7204.7250.7
iWUE (mol mol−1H2O)95.07.082.6111.793.57.577.8113.3
Disclaimer/Publisher’s Note: The statements, opinions and data contained in all publications are solely those of the individual author(s) and contributor(s) and not of MDPI and/or the editor(s). MDPI and/or the editor(s) disclaim responsibility for any injury to people or property resulting from any ideas, methods, instructions or products referred to in the content.