Article

Three-Dimensional Modeling of Soil Organic Carbon Stocks in Forest Ecosystems of Northeastern China Under Future Climate Warming Scenarios

1
College of Land and Environment, Shenyang Agricultural University, Shenyang 110866, China
2
Zhangwu County Agricultural Development Service Center, Fuxin 123200, China
*
Author to whom correspondence should be addressed.
Forests 2025, 16(8), 1209; https://doi.org/10.3390/f16081209
Submission received: 28 April 2025 / Revised: 20 July 2025 / Accepted: 21 July 2025 / Published: 23 July 2025
(This article belongs to the Special Issue Carbon Dynamics of Forest Soils Under Climate Change)

Abstract

Understanding the detailed spatiotemporal variations in soil organic carbon (SOC) stocks is essential for assessing soil carbon sequestration potential. However, most existing studies predominantly focus on topsoil SOC stocks, leaving significant knowledge gaps regarding critical zones, depth-dependent variations, and key influencing factors associated with deeper SOC stock dynamics. This study adopted a comprehensive methodology that integrates random forest modeling, equal-area soil profile analysis, and space-for-time substitution to predict depth-specific SOC stock dynamics under climate warming in Northeast China’s forest ecosystems. By combining these techniques, the approach effectively addresses existing research limitations and provides robust projections of soil carbon changes across various depth intervals. The analysis utilized 63 comprehensive soil profiles and 12 environmental predictors encompassing climatic, topographic, biological, and soil property variables. The model’s predictive accuracy was assessed using 10-fold cross-validation with four evaluation metrics: MAE, RMSE, R2, and LCCC, ensuring comprehensive performance evaluation. Validation results demonstrated the model’s robust predictive capability across all soil layers, achieving high accuracy with minimized MAE and RMSE values while maintaining elevated R2 and LCCC scores. Three-dimensional spatial projections revealed distinct SOC distribution patterns, with higher stocks concentrated in central regions and lower stocks prevalent in northern areas. Under simulated warming conditions (1.5 °C, 2 °C, and 4 °C increases), both topsoil (0–30 cm) and deep-layer (100 cm) SOC stocks exhibited consistent declining trends, with the most pronounced reductions observed under the 4 °C warming scenario. Additionally, the study identified mean annual temperature (MAT) and normalized difference vegetation index (NDVI) as dominant environmental drivers controlling three-dimensional SOC spatial variability. These findings underscore the importance of depth-resolved SOC stock assessments and suggest that precise three-dimensional mapping of SOC distribution under various climate change projections can inform more effective land management strategies, ultimately enhancing regional soil carbon storage capacity in forest ecosystems.

1. Introduction

Soil organic carbon (SOC) serves as a vital element in the global carbon cycle, functioning as Earth’s largest terrestrial carbon sink with approximately 1576 petagrams of stored carbon [1]. Due to its immense storage potential, even minor fluctuations in SOC stocks can significantly impact atmospheric CO2 concentrations, thereby establishing key feedback loops within the climate system [2,3]. Among terrestrial ecosystems, forests exhibit exceptional carbon sequestration capabilities, particularly in regions such as Northeast China, where lush vegetation and deep soil profiles promote substantial carbon accumulation [4,5,6]. Global forest SOC stocks are projected to range between 383 and 680 Pg C, with tropical, temperate, and boreal forests contributing 32%, 24%, and 44%, respectively [7]. China’s forest SOC stocks (15.4 ± 2.8 Pg C, accounting for 4%–5% of global stocks) are predominantly concentrated in the south (56%), followed by the northeast (21%) and the southwest (14%) [8,9]. However, our current understanding of SOC dynamics under climate warming remains limited, especially concerning carbon storage mechanisms in deeper soil layers [10,11]. Most prior studies have predominantly focused on topsoil (0–30 cm depth), neglecting the intricate vertical stratification of carbon storage patterns [12]. This knowledge deficit underscores the necessity for advanced methodologies capable of precisely characterizing the three-dimensional spatial distribution of SOC. The development of such techniques will be pivotal for refining climate change predictions and informing effective carbon management strategies in forest ecosystems.
To facilitate reliable comparisons across different studies, the spatial prediction of SOC stocks must adhere to standardized depth intervals. The GlobalSoilMap specifications, which partition soil profiles into six distinct layers (0–5, 5–15, 15–30, 30–60, 60–100, and 100–200 cm), have become a widely accepted framework for such analyses [13]. Researchers have developed various mathematical approaches to model SOC distribution across these depth intervals, including exponential decay functions, polynomial equations, and equal-area spline models [14,15]. Comparative studies have shown that the equal-area spline function provides superior performance in reconstructing vertical SOC profiles due to its mathematical robustness and stability across diverse soil conditions [16,17]. Empirical applications of these methods have generated valuable insights at regional scales. For instance, Adhikari et al. [18] effectively utilized the equal-area spline approach to estimate Denmark’s SOC stocks, identifying a significant carbon reservoir of 570 teragrams within the top meter of soil. Similarly, Mulder et al. [19] integrated regression tree analysis with spline functions to produce comprehensive SOC stock predictions across French territories. These case studies underscore the increasing acknowledgment that combining advanced depth functions with spatial modeling techniques can markedly enhance the accuracy of SOC stock assessments. This methodological integration is especially critical when projecting carbon storage dynamics under future climate change scenarios, as precise quantification of vertical SOC distribution will be indispensable for climate modeling and policy formulation.
Digital soil mapping (DSM) signifies a revolutionary approach to SOC assessment, addressing the limitations of traditional soil survey methods through its innovative integration of environmental covariates. By systematically incorporating critical drivers of soil formation—such as climatic variables, topographic features, vegetation indices, and geological characteristics—DSM enables precise prediction of SOC stocks, even in regions with limited field observations [20,21,22,23,24,25]. This shift from conventional soil-type-based averaging to data-driven modeling has been facilitated by advanced machine learning techniques. Contemporary DSM implementations commonly utilize sophisticated algorithms like boosted regression trees, random forests (RF), and support vector machines.
Northeast China’s forests, which extend from cold temperate to temperate zones, exhibit high sensitivity to climate warming. The Northeast Forest serves as a critical carbon sink region in China, and its SOC stocks have a significant influence on the global carbon cycle. According to Wang et al. [26], the SOC stocks of forest soils at depths of 0–20 cm in the northeast region (including the Greater Khingan Range, Lesser Khingan Range, and Changbai Mountain) have a total storage capacity of approximately 2.09–2.56 Pg C. Given the region’s substantial SOC stocks and distinct climate gradients, it renders it an optimal study area for assessing the impacts of warming on three-dimensional SOC stocks. In this study, we combine random forest modeling, equal-area spline functions, and space-for-time substitution to achieve the following objectives: (1) construct depth-resolved profiles of SOC stocks; (2) identify key drivers influencing SOC stock variations across different depths; and (3) map the distribution of SOC stocks under multiple warming scenarios (e.g., +1.5 °C, +2.0 °C, +4.0 °C). Our results will enhance the understanding of forest SOC stability in the context of climate change and offer a robust framework for regional-scale carbon management in vulnerable ecosystems.

2. Materials and Methods
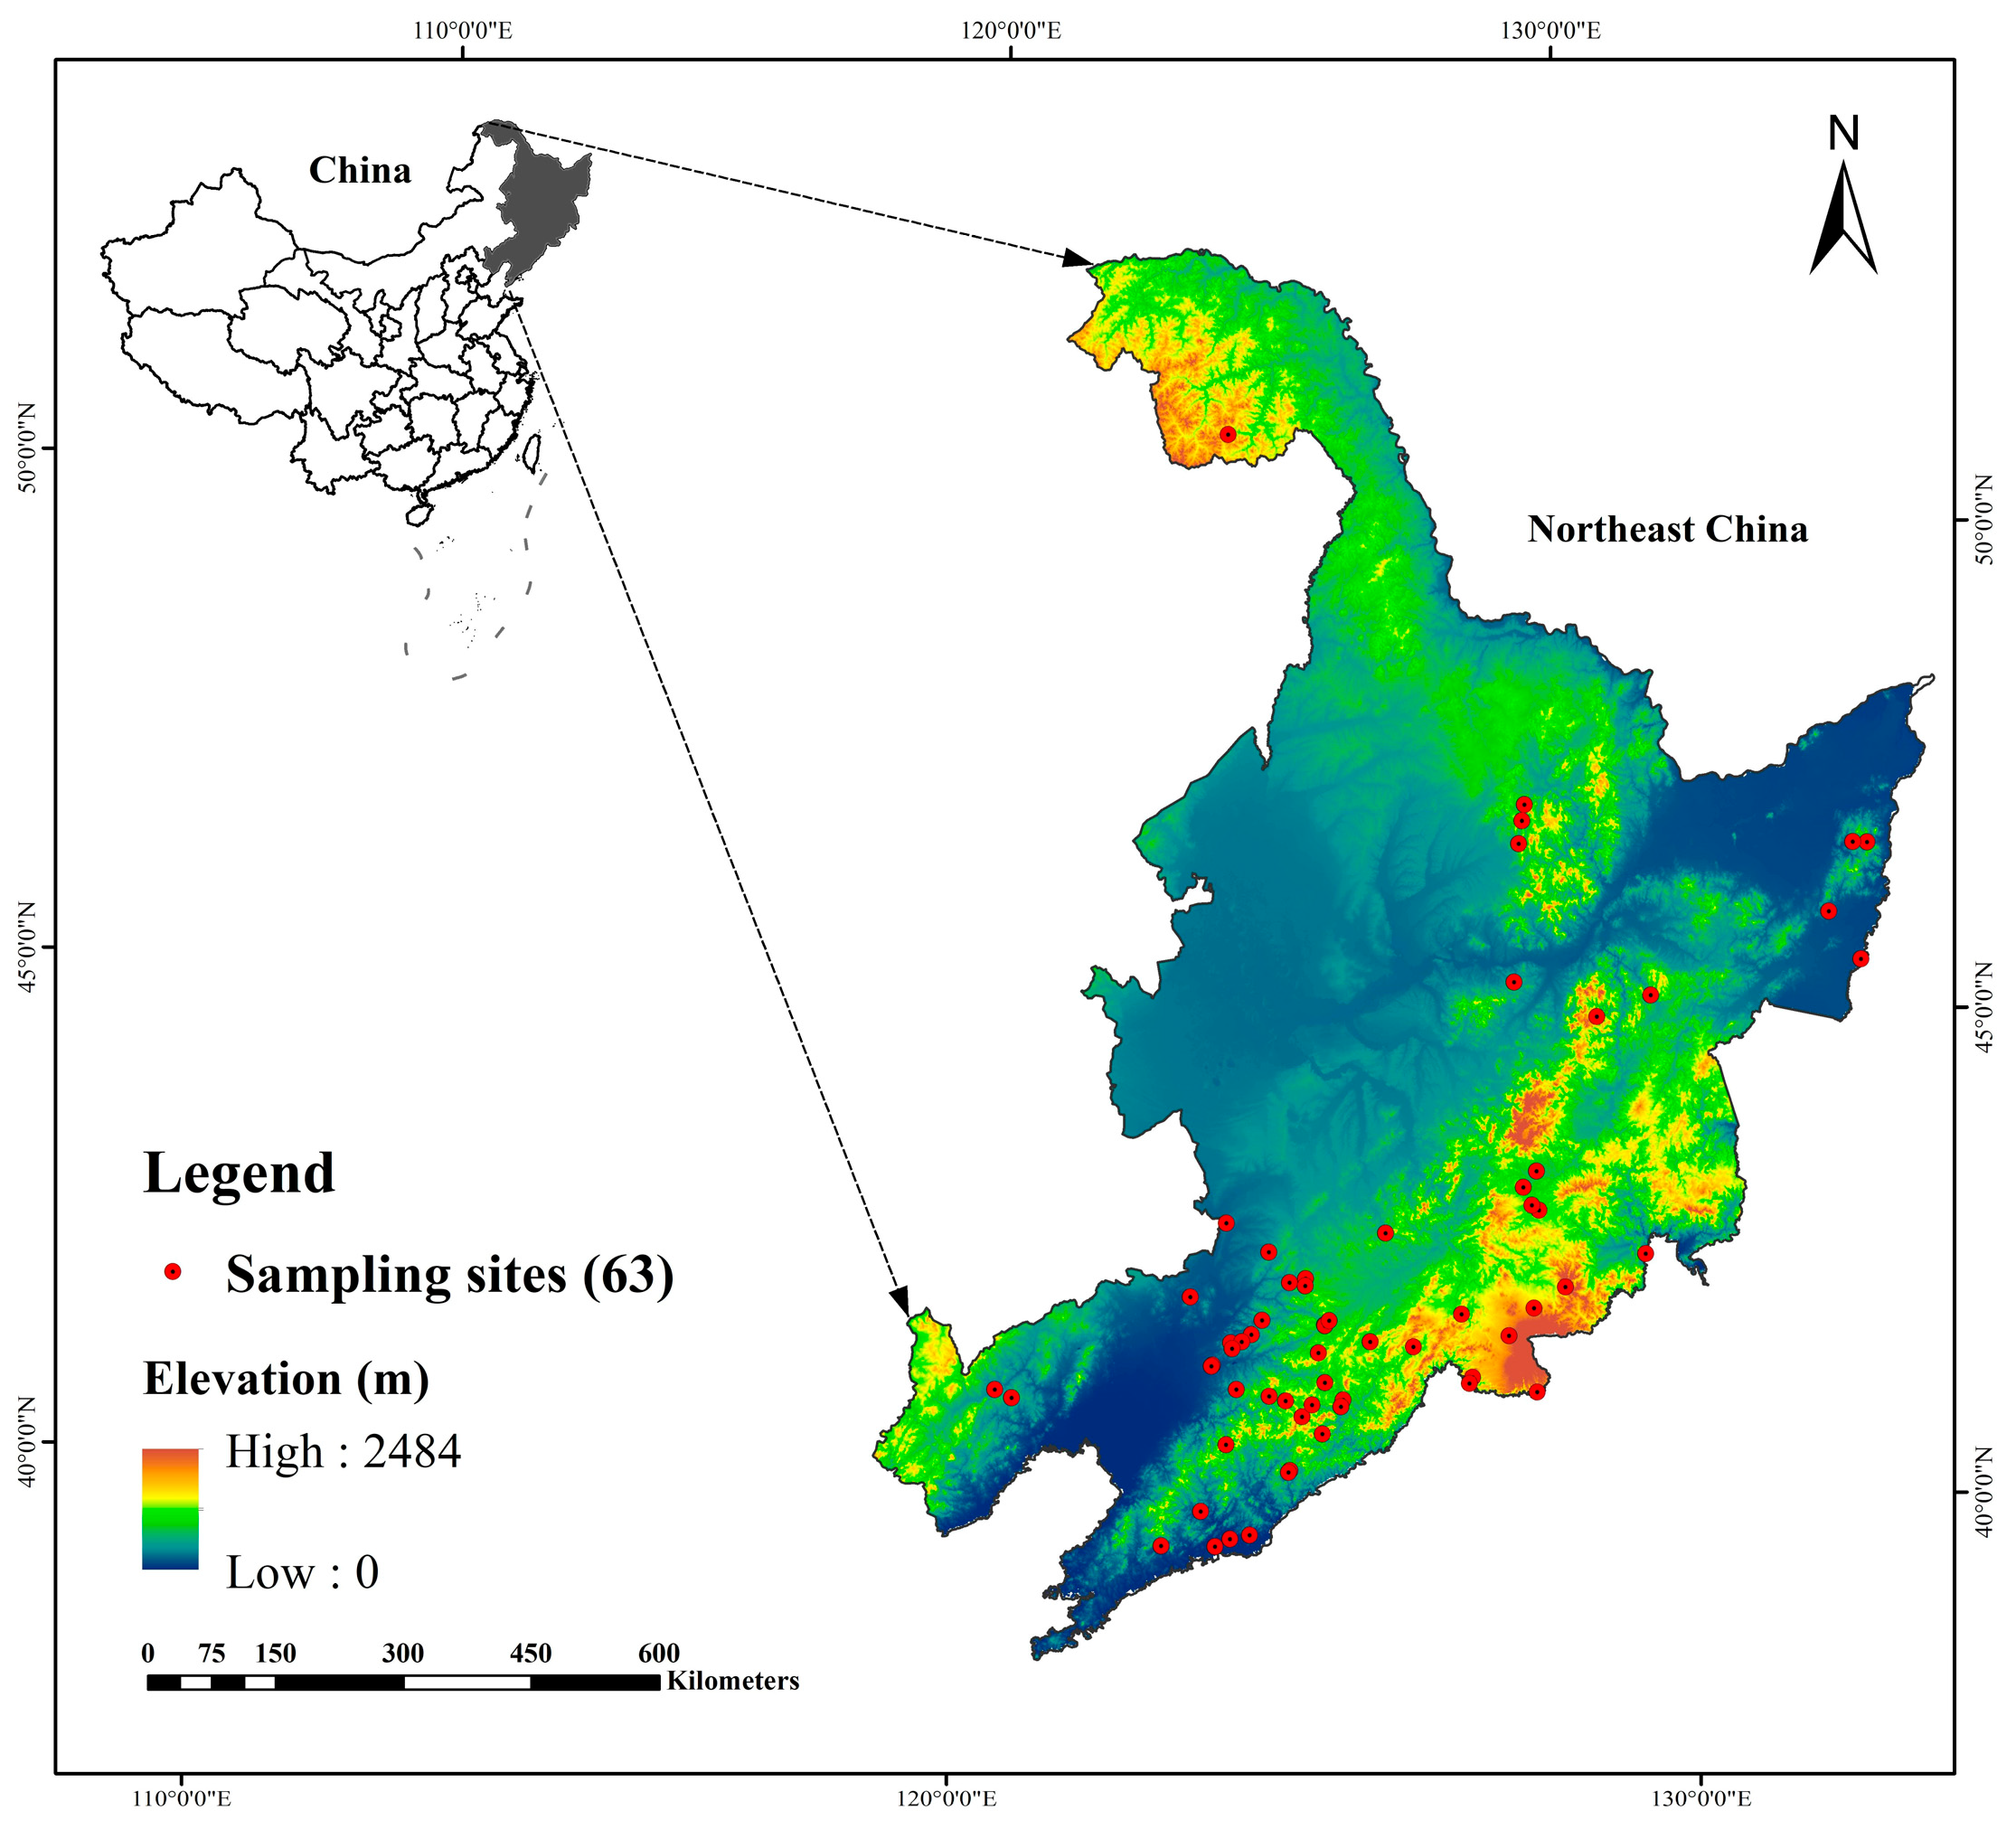
2.1. Research Area

The Northeast China forest region encompasses the Greater Khingan, Lesser Khingan, and Changbai Mountain ranges across Liaoning, Jilin, and Heilongjiang provinces (Figure 1), and constitutes China’s largest natural forest ecosystem. Ranging in elevation from 0 to 2665 m (with an average of approximately 200 m), this temperate zone supports extensive coniferous–broadleaf mixed forests. The region contains 305,000 km2 of forests (37% of China’s total) with a timber volume of 3.2 billion m3 (one-third national share) [27]. Among the provinces, Heilongjiang holds the largest share with 2.4 billion m3 (75% of the regional total), followed by Jilin with 700 million m3 and Liaoning with 100 million m3.
Climatically, the region exhibits a transition from humid to semi-arid conditions along a southeast–northwest gradient. The region shows a precipitation gradient (1000–300 mm, southeast–northwest) and temperature range (−4 °C to 11 °C). This temperate monsoon climate is characterized by distinct seasonal variations, including warm, rainy summers and cold, dry winters. The predominant soil types are Cambosols (covering 82% of the area), followed by Gleyosols (7%) and Isohumosols (6%). Minor distributions of Argosols, Primosols, and other soil classes also exist, as classified under the Chinese Soil Taxonomy. This diverse edaphic and climatic gradient supports the region’s remarkable forest productivity and biodiversity.

2.2. Soil Samples

This study investigates the spatial simulation of soil organic carbon (SOC) stocks in forest soils across Northeast China, with sampling efforts focused exclusively on forested areas to maintain methodological consistency—other land-use types, such as the predominantly agricultural western region, were intentionally excluded. In the remote, high-altitude primary forests of the northern Daxing’an Mountains, sampling was limited due to logistical constraints, resulting in fewer but strategically placed sampling points. To address the challenges of large-scale field sampling in Northeast China’s forests, this study implemented a stratified sampling strategy inspired by Zhu et al. [28]. Initially, we identified and standardized five critical environmental drivers influencing SOC variation: normalized difference vegetation index (NDVI), mean annual precipitation (MAP), mean annual temperature (MAT), topographic wetness index (TWI), and elevation. This process ensured uniformity in coordinate systems and spatial resolutions. By applying fuzzy c-means clustering, we delineated 16 distinct landscape units that represent diverse environmental combinations. In collaboration with local soil scientists, we strategically selected 3–5 accessible sampling locations within each unit to ensure representative conditions were captured. During the 2017–2018 field campaigns, our team meticulously excavated and documented 63 complete soil profiles (to a depth of 1 m or until bedrock was reached), recording precise GPS coordinates, landform characteristics, and environmental context. Standardized sampling protocols were strictly followed: after removing surface litter, both composite samples (1 kg) and undisturbed cores (100 cm3) were collected from each genetic horizon. Laboratory analyses included SOC quantification using a C/N analyzer and bulk density measurements conducted via the oven-dry method (105 °C for 48 h) on intact cores. This systematic approach effectively balanced scientific rigor with practical field constraints while maintaining high data quality across the heterogeneous forest landscape.

2.3. Calculation of SOC Stocks

This study examined the three-dimensional distribution patterns of SOC stocks under different climate warming scenarios, employing Batjes’ [29] equation to calculate layer-specific SOC density across entire soil profiles. The calculation method [29] is expressed as:
S O C s t o c k s = i = 1 k S O C c o n t e n t = i = 1 k S O C c o n c e n t r a t i o n × B D i × D i × ( 1 S i )
where SOC stocks denote soil organic carbon density (kg m−2), derived from SOC content (g kg−1) and concentration. The computation integrates four key parameters: (1) bulk density (BD, g cm−3), (2) soil layer thickness (D, m), (3) volumetric proportion of >2 mm fragments (S), with subscript i indicating specific profile layers. This comprehensive approach enables precise quantification of carbon storage at different depths while accounting for stoniness and soil compaction effects. The equation’s dimensional analysis (converting g cm−3 to t ha−1) ensures consistency in unit conversion across all measured parameters, providing reliable estimates of vertical carbon distribution patterns under varying climatic conditions.

2.4. Environmental Variables

This research integrated 12 key environmental predictors across four categories—pedological, topographic, climatic, and biological factors—to simulate the vertical and spatial distribution of SOC stocks under warming scenarios in Northeast China’s forests. The multi-source environmental datasets, which were characterized by heterogeneous formats and specifications, underwent rigorous preprocessing to ensure analytical consistency. Systematic geospatial processing was conducted in ArcGIS 10.2 (ESRI Inc., Redlands, CA, USA), where all layers were standardized to the Albers Conical Equal Area coordinate system at a uniform 90 m grid resolution. This critical data harmonization step facilitated the seamless integration of diverse environmental variables while preserving their spatial fidelity, thereby establishing an optimized foundation for subsequent machine learning analysis in R [30]. The standardized environmental layers, now featuring consistent projections, resolutions, and spatial extents, enabled robust three-dimensional SOC modeling across the study region’s diverse forest ecosystems.

2.4.1. Climatic Variables

Climate variables play a crucial role in regulating SOC stocks by influencing both carbon accumulation and decomposition processes [31]. In this study, we focused on two key climate indicators—mean annual temperature (MAT) and mean annual precipitation (MAP)—which are widely recognized for their significance in carbon cycle research. The climate datasets were obtained from the Geospatial Data Cloud (http://www.gscloud.cn, accessed on 20 July 2025), developed by the Chinese Academy of Sciences. These datasets were generated through spatial interpolation of daily observations collected from 2400 meteorological stations using the ANUSPLIN software (version 4.3). This advanced interpolation method employs thin plate smoothing splines to process multivariate climate data, providing robust statistical evaluation and spatial error assessment [32]. It is particularly effective for mapping temperature and precipitation when integrated with elevation data [33].
The original 1 km resolution climate datasets underwent a series of systematic processing steps: (1) spatial resampling to 90 m resolution using ArcGIS 10.2, ensuring alignment with other environmental layers; (2) construction of warming scenarios via grid-based temperature adjustments (+1.5 °C, +2 °C, +4 °C) utilizing ArcGIS’s raster calculator; and (3) quality control checks to ensure data consistency across all scenarios. This robust climate data processing framework facilitated the assessment of potential warming impacts on SOC dynamics while preserving spatial accuracy and methodological coherence with prior regional studies. The multi-phase approach enabled both current climate analysis and projected warming scenario evaluations within a unified analytical framework.

2.4.2. Topographic Variables

This study derived its topographic variables from a 90 m resolution digital elevation model (DEM) obtained from the Geospatial Data Cloud platform of the Chinese Academy of Sciences (http://www.gscloud.cn, accessed on 20 July 2025). Based on this foundational elevation data, six critical terrain parameters known to influence SOC stocks dynamics were calculated: (1) elevation (ELE), serving as the primary vertical reference; (2) slope gradient (SG), representing surface steepness; (3) slope aspect (SA), indicating cardinal direction exposure and solar radiation reception; (4) profile curvature (PC), characterizing the shape of the slope and influencing water flow behavior; (5) catchment area (CA), reflecting hydrological potential and runoff accumulation; and (6) topographic wetness index (TWI), which integrates both slope characteristics and upslope contributing area. These parameters were selected due to their well-documented relationships with microclimate conditions, hydrological processes, and soil formation—key factors that collectively affect SOC distribution patterns [34,35]. To ensure consistency with other environmental datasets used in this study, the 90 m spatial resolution was preserved for all derived topographic products. ELE variations influence SOC stocks by altering soil physicochemical properties (including temperature and moisture content), enzymatic activities, and microbial communities. Slope characteristics (SG and SA) impact SOC stocks through their effects on soil depth, vegetation patterns, organic matter inputs, and anthropogenic activities [33]. Profile curvature plays a role in controlling surface runoff velocity, thereby influencing erosion and deposition processes [35]. The TWI parameter integrates terrain and soil attributes to quantify soil water distribution patterns [34], while CA represents the upslope contributing area for water flow within a given catchment [33]. Collectively, ELE, TWI, and CA serve as indicators of soil moisture conditions that indirectly regulate SOC stocks dynamics. The terrain variables were processed using ArcGIS 10.2 software for basic parameters (ELE, SG, SA, PC) and SAGA GIS for advanced hydrological indices (CA and TWI).

2.4.3. Soil Property Variables

Soil texture, representing the proportional composition of mineral particles with varying sizes, constitutes a fundamental physical property of soils [33,36]. This characteristic significantly influences multiple soil attributes including water permeability, moisture retention, workability, and nutrient availability, making it a crucial indicator for assessing soil fertility and agricultural suitability [36]. The distinct agricultural properties associated with different soil textures underscore their practical importance in guiding farming practices [33]. The soil texture data utilized in this study were acquired from the Resource and Environmental Science and Data Center (https://www.resdc.cn, accessed on 20 July 2025), originating from China’s national 1:1 million scale soil mapping initiative. These comprehensive datasets integrate information from the Second National Soil Survey’s extensive profile collection, providing detailed particle size distribution (sand, silt, and clay percentages) for accurate textural classification. While the original data resolution was 1 km, the texture parameters were particularly valuable for characterizing soil physical properties that directly influence SOC stabilization mechanisms. Using ArcGIS 10.2 software, we extracted the relevant texture information (clay, silt, and sand content) for Inner Mongolia by applying the regional administrative boundary to the nationwide spatial grid dataset.

2.4.4. Biological Variables

NDVI represents a crucial biological parameter for evaluating vegetation dynamics and productivity, while minimizing atmospheric interference in remote sensing measurements [37,38]. As a proxy for photosynthetic activity and plant biomass, NDVI demonstrates significant relationships with SOC spatial patterns due to its direct connection with organic matter inputs [10]. This vegetation index has become fundamental in carbon cycle studies, particularly for modeling SOC stocks distribution through its capacity to reflect both current vegetation status and long-term accumulation of organic materials [33]. For this investigation, we obtained 16-day composite NDVI products at 250 m resolution from the Geospatial Data Cloud platform (http://www.gscloud.cn, accessed on 20 July 2025), operated by the Chinese Academy of Sciences. These datasets underwent rigorous quality control and temporal compositing to minimize cloud contamination and atmospheric effects, ensuring robust representation of vegetation conditions across the study area’s diverse forest ecosystems. The processed NDVI data were subsequently resampled to 90 m resolution to maintain consistency with other environmental variables in our analysis framework.

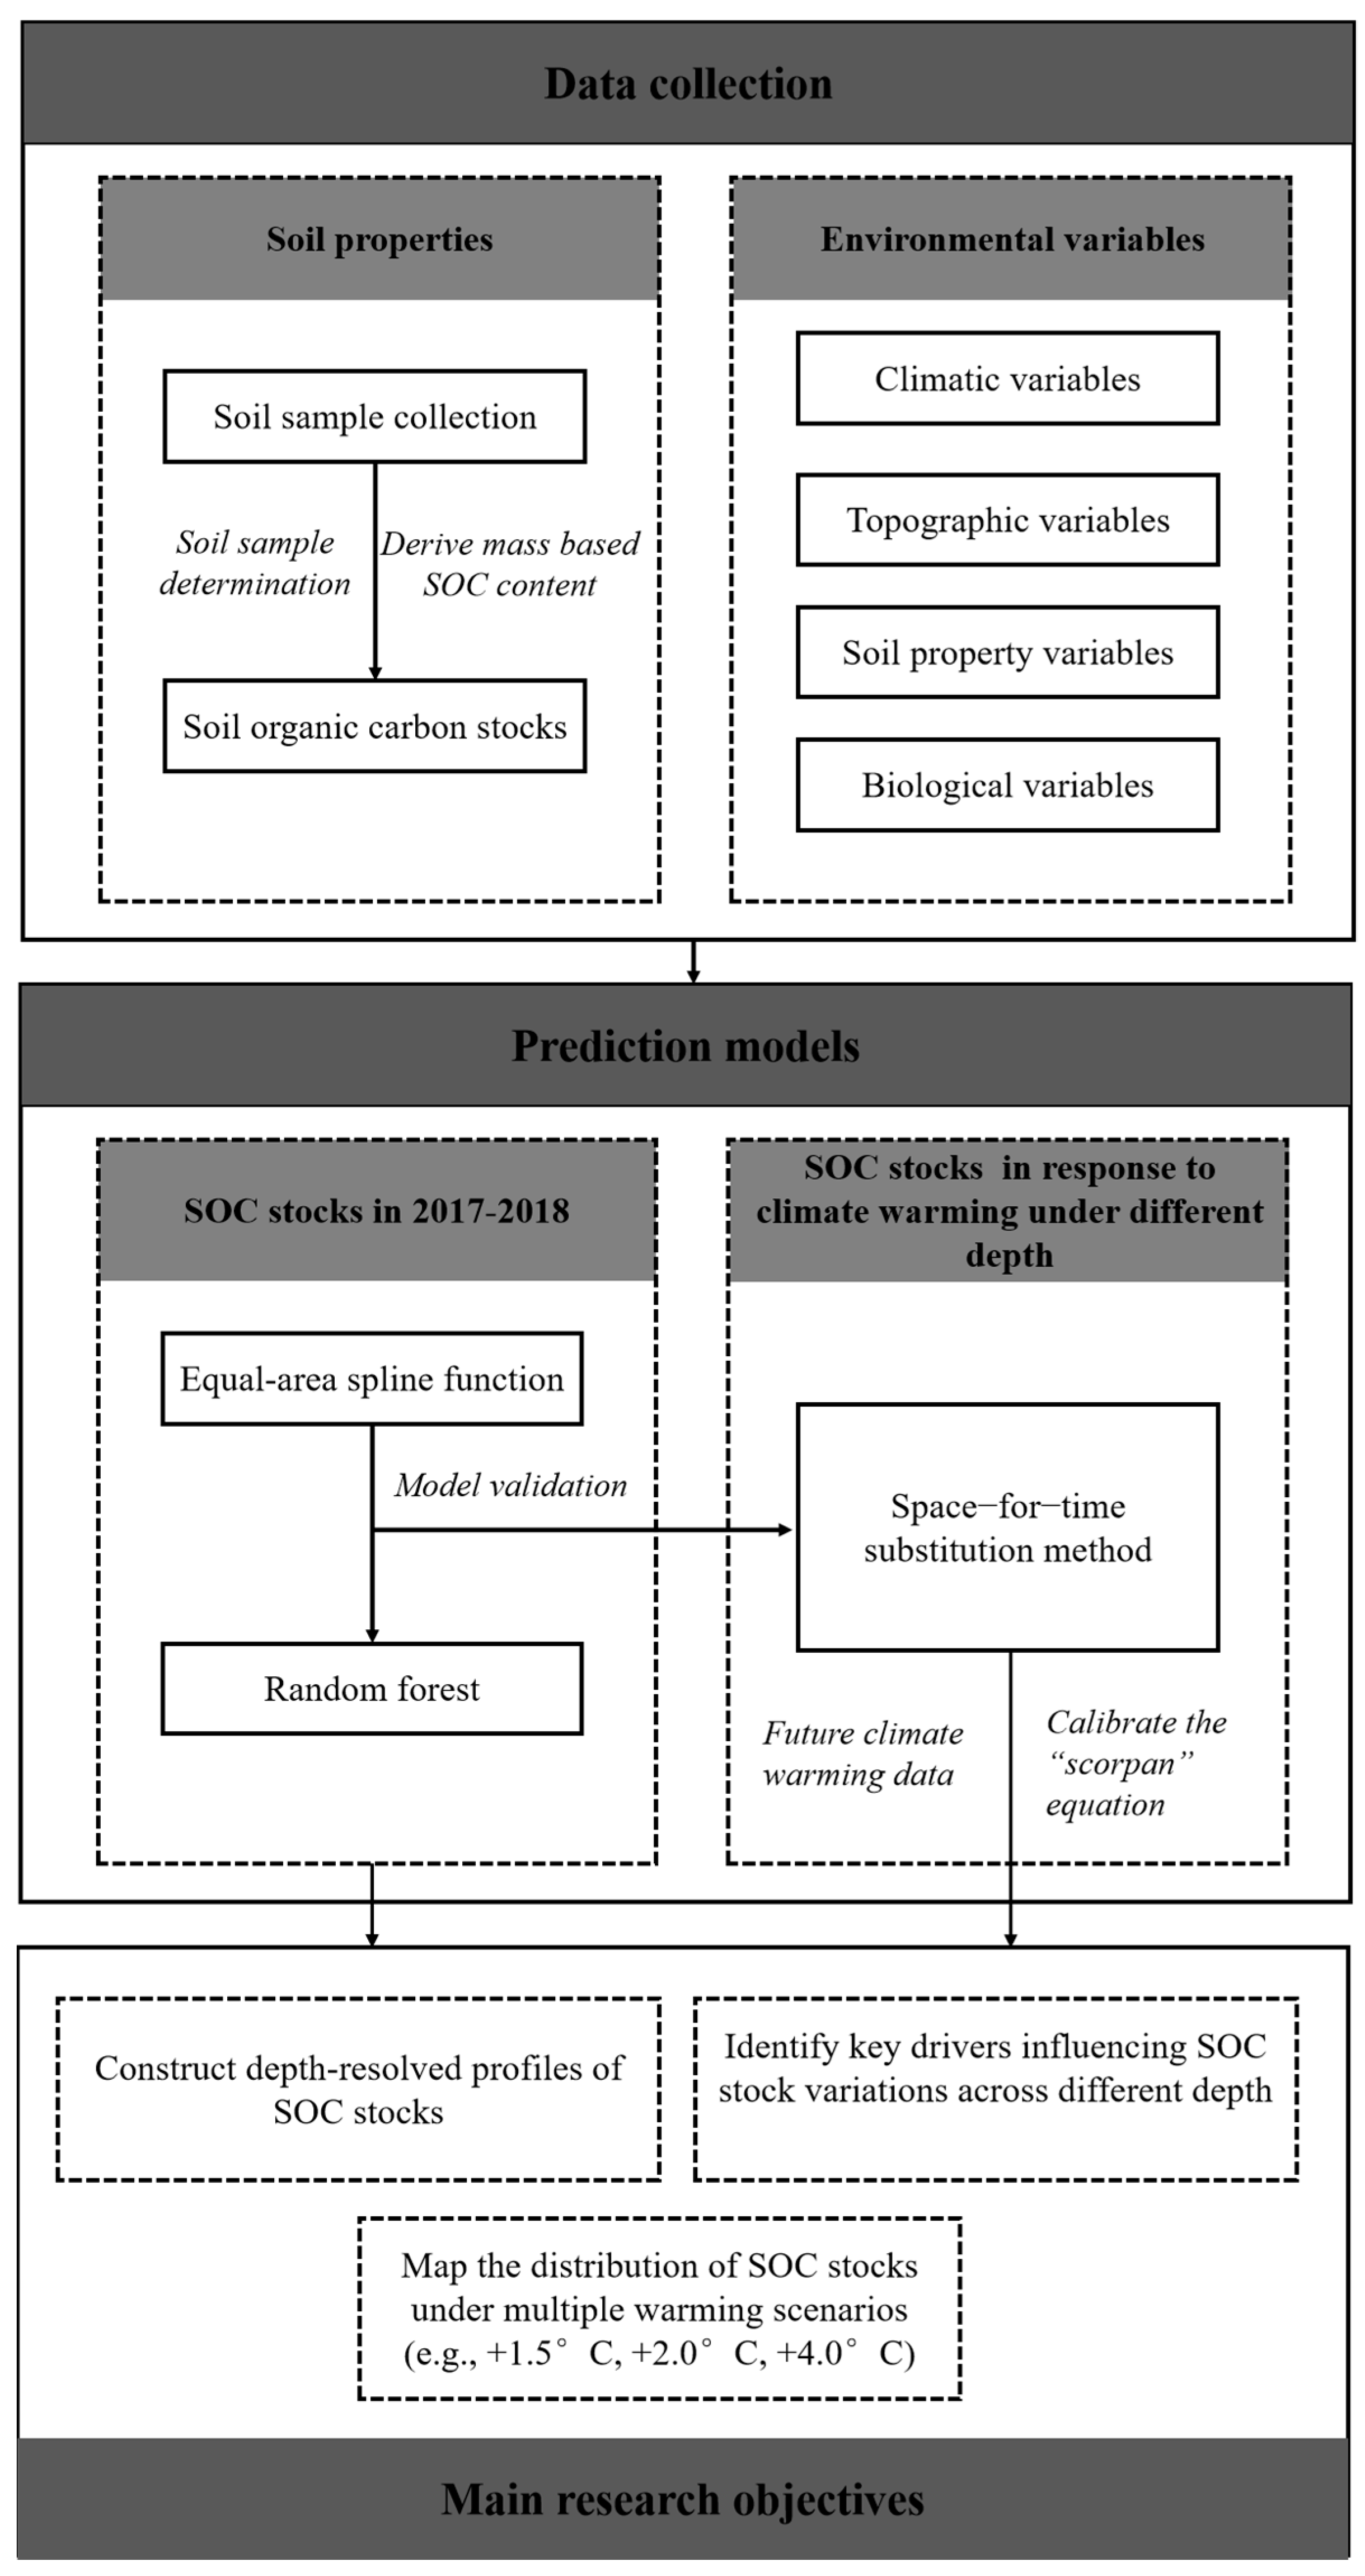
2.5. Prediction Models

To model the three-dimensional distribution of SOC stocks under climate warming scenarios in forest areas of Northeast China, this study incorporated 12 key environmental predictors spanning four categories: soil properties, topography, climate, and biological factors. Due to variations in data formats from different collection platforms and sources, all environmental datasets were standardized using ArcGIS 10.2. The preprocessing steps included unifying the coordinate system to Albers Conical Equal Area projection and resampling all layers to a consistent 90 m spatial resolution. This standardized dataset ensured compatibility for subsequent predictive modeling in the R statistical environment [30]. The harmonization of spatial data formats and resolutions was crucial for maintaining analytical consistency across the different variable types in the machine learning framework.

2.5.1. Equal-Area Spline Profile Function

In this research, an equal-area spline profile function was utilized, which was originally developed by Bishop et al. [39] as a quadratic spline model and later refined by Malone et al. [40] to enhance its accuracy and applicability for soil profile analysis. The adapted approach allowed for more precise modeling of vertical soil property distributions while maintaining mathematical consistency across different depth intervals. The model uses averaged data from continuous, non-overlapping soil depth layers, with measurements from layer i representing the mean soil attribute value plus random error. The mathematical formulation is expressed as:
y i = f i ¯ + e i
In this formulation, yi represents the actual mean value of the soil property across depth interval (xi-1, xi), while f ¯ corresponds to the observed average value. The term ei accounts for independent measurement errors, and the subscript i identifies the specific soil layer.
Under the assumption that soil properties exhibit gradual changes with increasing depth, the spline function f(x) is obtained through optimization by minimizing the objective function Di. This approach ensures a continuous representation of soil characteristics while accounting for measurement uncertainties across different soil horizons.
D d = 1 n i = 1 n ( y i f i ¯ ) + λ x 0 x n f m ( x ) 2 d x
The mathematical formulation consists of two key components: the first term guarantees close approximation to the observed data points, while the second term evaluates the smoothness of the fitted curve through integration of the squared first derivative f′(x). A crucial smoothing parameter λ regulates the trade-off between these competing objectives, determining the relative emphasis on either precise data fitting or maintaining functional smoothness in the resulting spline curve. This balancing mechanism allows for optimal representation of both measured values and expected continuous variation of soil properties with depth. Through comparative analysis of five parameter values (0.0001, 0.001, 0.01, 0.1, and 1), λ = 0.1 yielded optimal results with minimal root mean square error. All calculations were performed using CSIRO’s SplineTool (version 2).

2.5.2. Random Forest

The random forest (RF) algorithm represents an ensemble learning method that operates through the collective decision-making of multiple decision trees. Originally proposed by Breiman [41], this approach extends the principles of classification and regression trees (CART). As a robust ensemble method, RF aggregates predictions from multiple decision trees to address regression problems through a voting mechanism. The algorithm operates by having each constituent tree randomly select a subset of features from the input data, then constructing individual decision trees using bootstrap samples of the training dataset. The final prediction is obtained by averaging the outputs from all trees in the forest. One of RF’s key strengths lies in its ability to handle complex, high-dimensional regression tasks while maintaining good predictive accuracy through its ensemble approach. However, this comes at the cost of increased computational demands, particularly when dealing with large datasets or deep tree structures, which can lead to longer training times compared to simpler models.
In the current study, we implemented the RF algorithm using the “randomForest” package [42] within the R statistical environment (version 4.1.0). The model’s performance depends critically on several key hyperparameters that require careful tuning. The ntree parameter, which determines the number of trees in the forest, was increased from the default value of 500 to 1000 to enhance prediction stability and reduce variance in our results. For node size control, we specified nodesize = 5 to set the minimum number of observations in terminal nodes, allowing for more granular decision boundaries while preventing overfitting. The mtry parameter, controlling the number of randomly selected predictor variables at each split, was set to 4 based on feature space characteristics of our SOC dataset. These parameter configurations were specifically optimized for predicting SOC stocks, with mtry = 4 representing approximately one-third of the total predictor variables, following the common heuristic for regression problems. The comprehensive parameter tuning process ensured robust model performance while maintaining computational efficiency for our specific application.

2.5.3. Space-for-Time Substitution Method

The development and transformation of soil are shaped by various natural elements, such as the original rock composition, weather conditions, living organisms, landscape features, and the duration of formation [20]. The “scorpan” equation proposed by McBratney et al. [20] provides a framework for analyzing the spatial variability of soil properties over time. By modifying climatic, biological, and land-use variables within this equation, future soil conditions can be projected using a space-for-time substitution approach [37]. This method has been successfully applied in various regions, including Brazil, Australia, and the United States, to predict future SOC stocks distribution under different scenarios [43,44,45,46,47,48]. However, a key limitation of this approach is the inability to validate projections due to the absence of future observational data, introducing potential uncertainties [43,45,48].
In this study, we examined the response of SOC stocks in forest ecosystems of Northeastern China to future climate warming scenarios using soil profile data collected in 2018. The analysis was based on the relationship between SOC stocks at different soil depths and various environmental variables. Assuming that parent material, biological factors, and terrain remain relatively stable over time, we applied the space-for-time substitution method to isolate the impact of temperature changes on SOC stocks dynamics. While this assumption may not account for all possible future variations, it provides valuable insights into the potential spatiotemporal evolution of SOC stocks under different climate change scenarios. The detailed research methodology was illustrated in Figure 2.

2.6. Model Validation

To evaluate the predictive performance of the RF model in historical scenarios, a 10-fold cross-validation method was utilized [33]. Four evaluation indices were employed for the assessment: the coefficient of determination (R2), Lin’s concordance correlation coefficient (LCCC), root mean square error (RMSE), and mean absolute error (MAE). R2 quantifies the model’s ability to explain data variability, with higher values indicating better fitting performance. LCCC evaluates the degree of agreement between predictions and observations, where values closer to 1 signify superior concordance. Both RMSE and MAE measure the magnitude of prediction errors, with lower values corresponding to improved model accuracy. The mathematical expressions for these metrics were computed as follows:
M A E = 1 n i = 1 n o i p i
R M S E = 1 n i = 1 n o i p i 2
R 2 = i = 1 n o i p ¯ i 2 i = 1 n p i p ¯ i 2
L C C C = 2 r σ o σ p σ o 2 + σ p 2 + o ¯ + p ¯ 2
The formula incorporates the following variables: o i and p i denote the observed and predicted values, respectively, while o ¯ and p ¯ represent their corresponding mean values. Additionally, σ o and σ p indicate the variances of the observed and predicted datasets, n stands for the sample size, and r signifies the correlation coefficient between observed and predicted values.

3. Results

3.1. Descriptive Statistics

The spatial distribution of SOC stocks was analyzed across five depth intervals (0–5 cm, 5–15 cm, 15–30 cm, 30–60 cm, and 60–100 cm) using an equal-area spline function at the measurement points. As shown in Table 1, significant spatial heterogeneity in SOC stocks was observed, with topsoil (0–5 cm) exhibiting concentrations ranging from 3.78 to 56.81 t ha−1. In contrast, deeper soil layers (60–100 cm) displayed much greater variability, with values spanning from 0.01 to 232.86 t ha−1. On average, SOC stocks increased with depth, peaking at 30–60 cm, where concentrations were approximately double those in the topsoil. All depth intervals displayed positive skewness, most notably at 30–60 cm (4.8 t ha−1). The SOC stocks data were subjected to logarithmic transformation to satisfy normality requirements.
According to Pearson’s correlation results (Table 2), topsoil SOC stocks (0–5 cm) showed strong positive correlations with ELE, SG, MAT, and NDVI, but these associations gradually weakened in deeper soil layers. At 60–100 cm, only SG maintained a significant correlation. Notably, MAT showed significant correlations with SOC across all depths except the 30–60 cm range. Given the strong intercorrelations among variable groups (e.g., soil texture, topography, climate, and biology), multicollinearity was assessed using variance inflation factors (VIFs) in a multiple linear regression framework. All VIFs were below 10, confirming the absence of multicollinearity in the 2018 SOC stock predictions.

3.2. Model Performance and Uncertainty

The RF model was executed 100 times, with averaged outputs used to ensure robustness in predictions. Its performance was evaluated using 10-fold cross-validation. The predictive performance of the model was comprehensively evaluated using four key metrics: (1) MAE, which measures the average magnitude of prediction errors, with values approaching zero indicating higher precision; (2) RMSE, a more sensitive indicator of overall accuracy that disproportionately penalizes larger errors; (3) the R2, quantifying the proportion of variance explained by the model, where values nearer to 1 demonstrate superior goodness-of-fit; and (4) LCCC, assessing both precision and accuracy by evaluating the deviation from the ideal 1:1 relationship between predicted and observed values, with perfect agreement represented by unity. Collectively, these metrics provide a rigorous, multi-dimensional assessment of model performance.
Although the highest R2 score for the 0–5 cm level of the RF model was only 0.54, the RF model demonstrated lower MAR, lower RMSE, and higher LCCC across all five levels, which indicated its robust predictive performance. The model demonstrated strong predictive capability for SOC stocks across all soil depth intervals; however, its accuracy decreased progressively with increasing depth. Specifically, the model exhibited superior performance in the upper soil layers (0–5 cm to 30–60 cm), as evidenced by lower MAE and RMSE values alongside higher R2 and LCCC scores. Conversely, predictive accuracy was relatively lower for the deepest layer (60–100 cm), as detailed in Table 3. This reduction may stem from the diminished influence of environmental factors on SOC stocks at greater depths. In addition, we attempted to incorporate only pedological, topographic, climatic, and biological parameters that were significantly correlated with SOC stock values in the RF model. However, this approach did not lead to a significant improvement in model accuracy; instead, the accuracy decreased. Consequently, we decided not to select variables based solely on their significant correlation for model construction.

3.3. Relative Importance of Environment Factors

To evaluate the impact of environmental variables on SOC stocks at various soil depths, the RF model was executed with 100 iterations to calculate the mean relative contribution of each factor, with results standardized to 100% for comparative analysis. Results revealed that topographic variables dominated the spatial variability of SOC stocks at all depths, with climatic, biological, and soil property variables following in significance (Figure 3). Specifically, MAT, NDVI, and ELE were key drivers in the 0–5 cm and 5–15 cm layers, collectively contributing ~44% of the total relative importance, while NDVI, MAP, MAT, and SA played dominant roles at 15–30 cm. Notably, climatic factors had reduced influence in the 60–100 cm layer, where topography and vegetation became more critical. Surprisingly, soil properties exhibited consistently low importance across all depths, possibly due to overlapping effects with topographic variables (Figure 3).

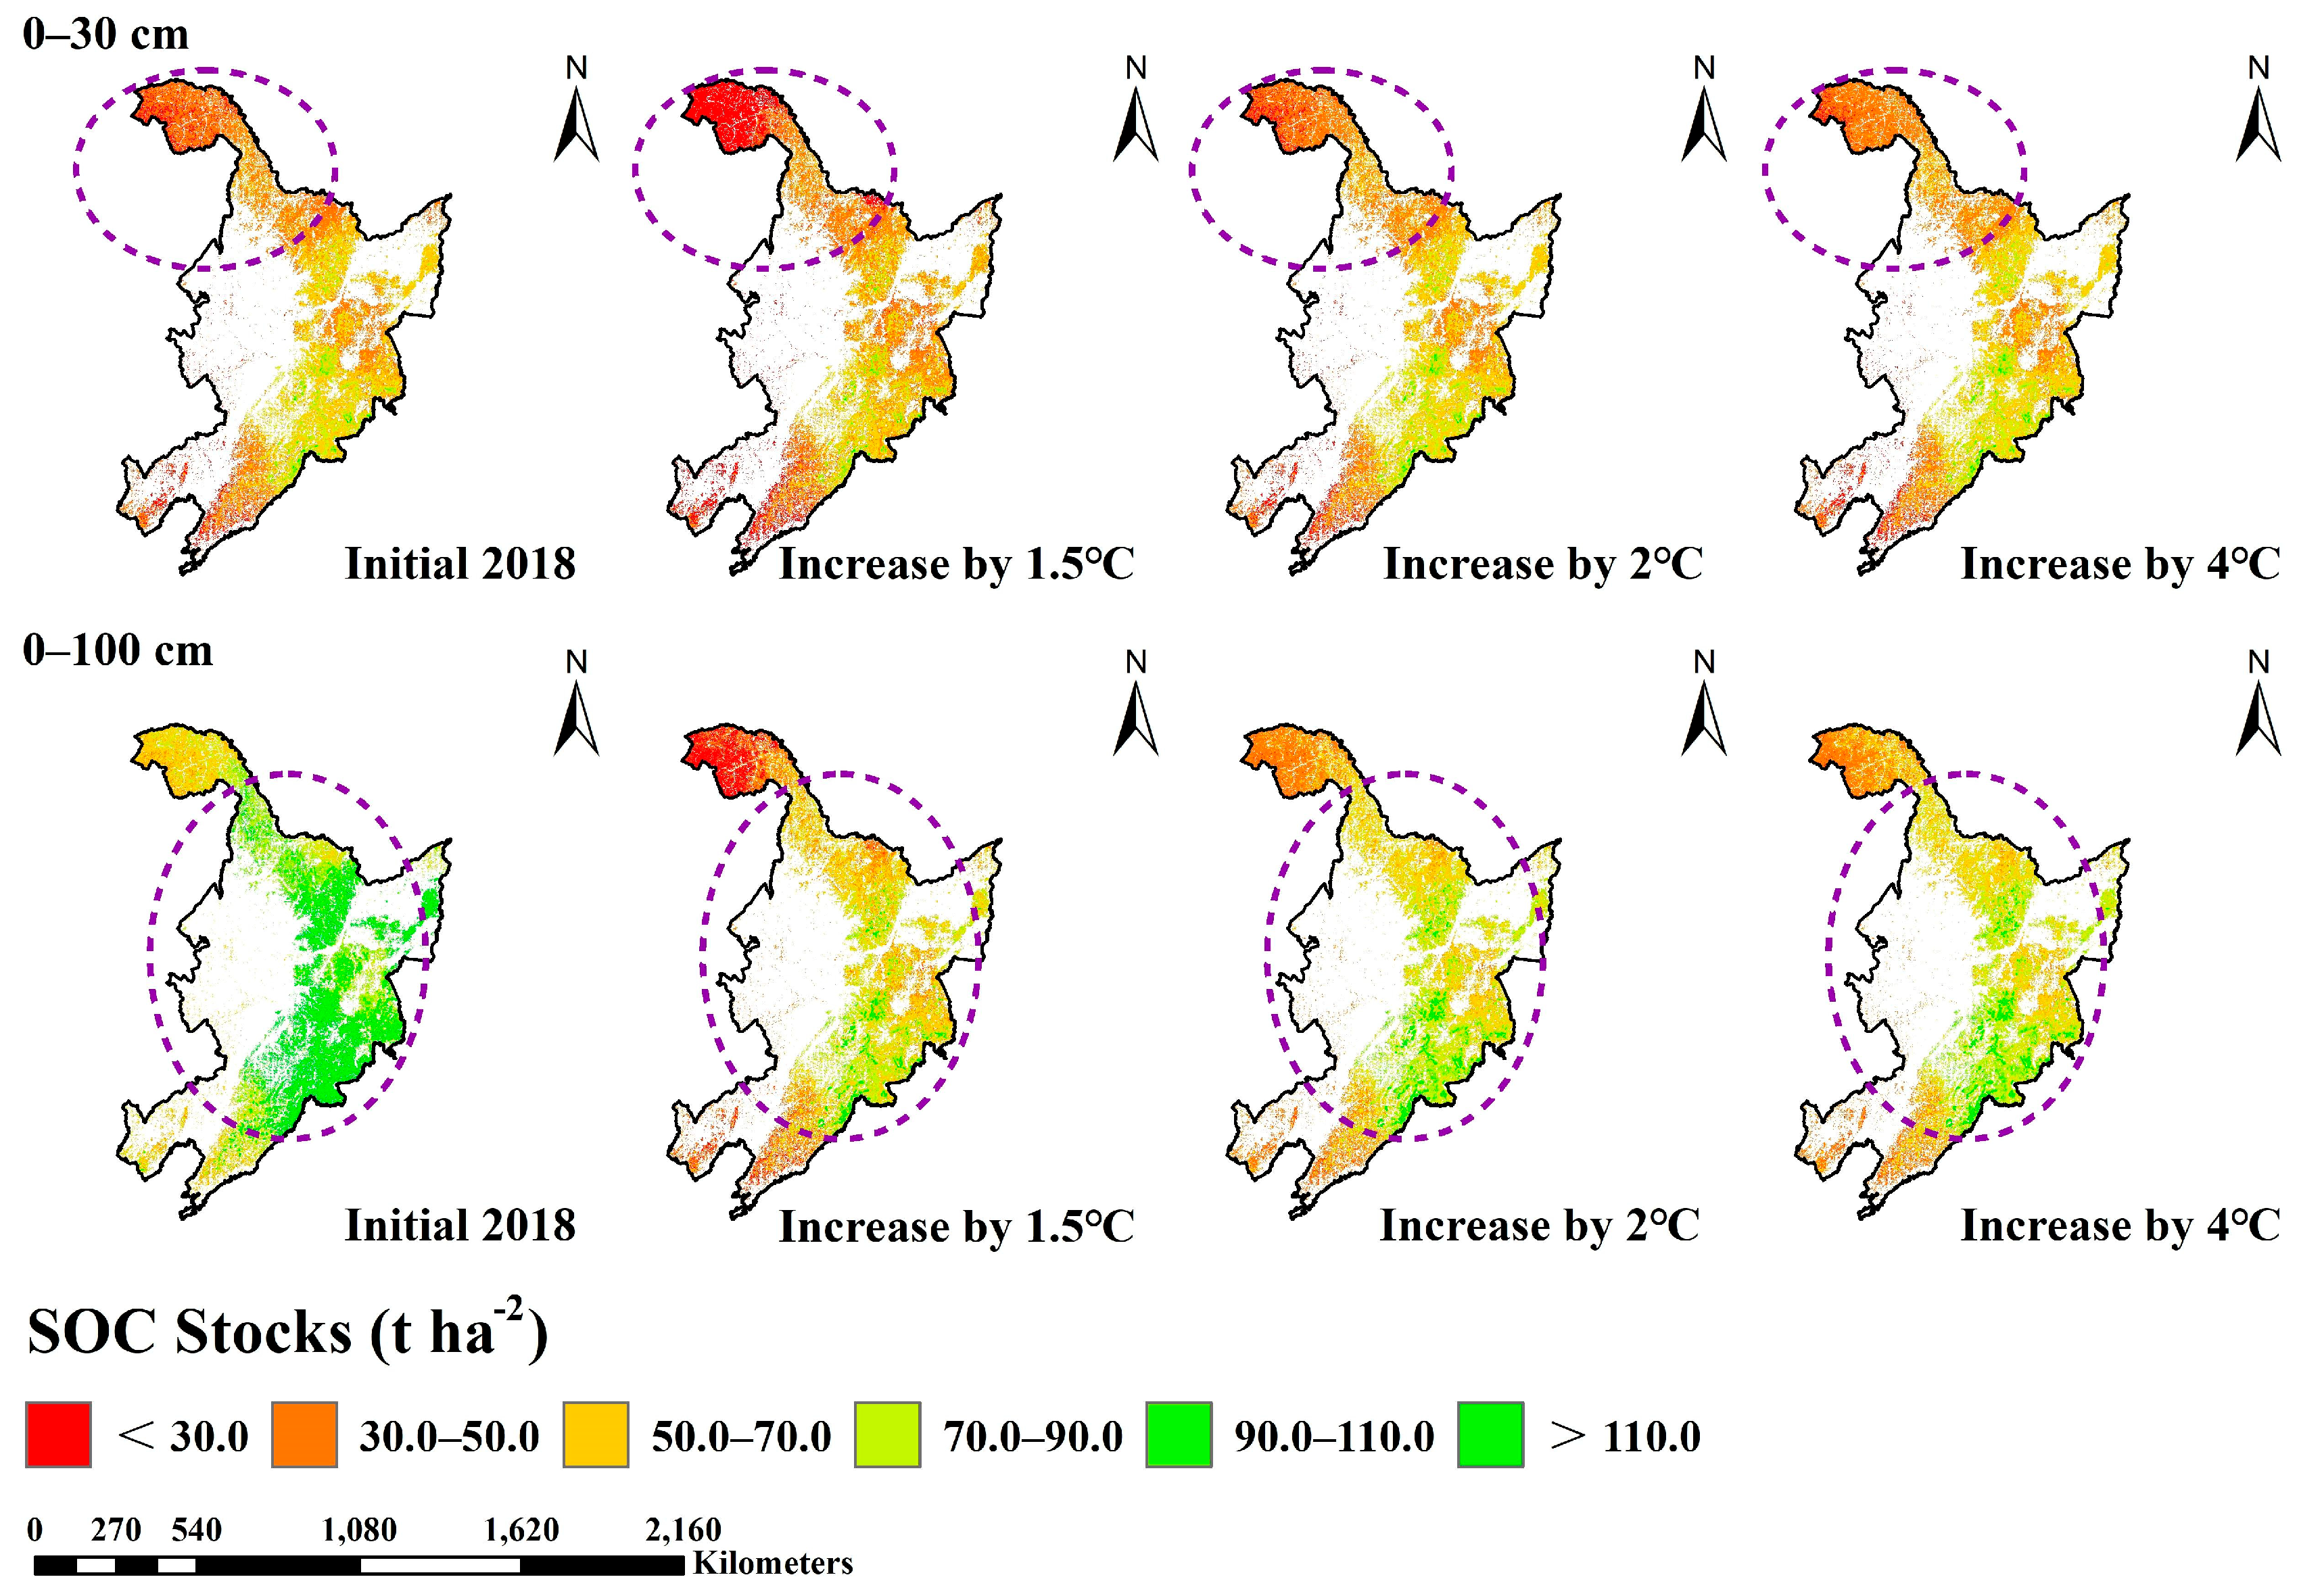
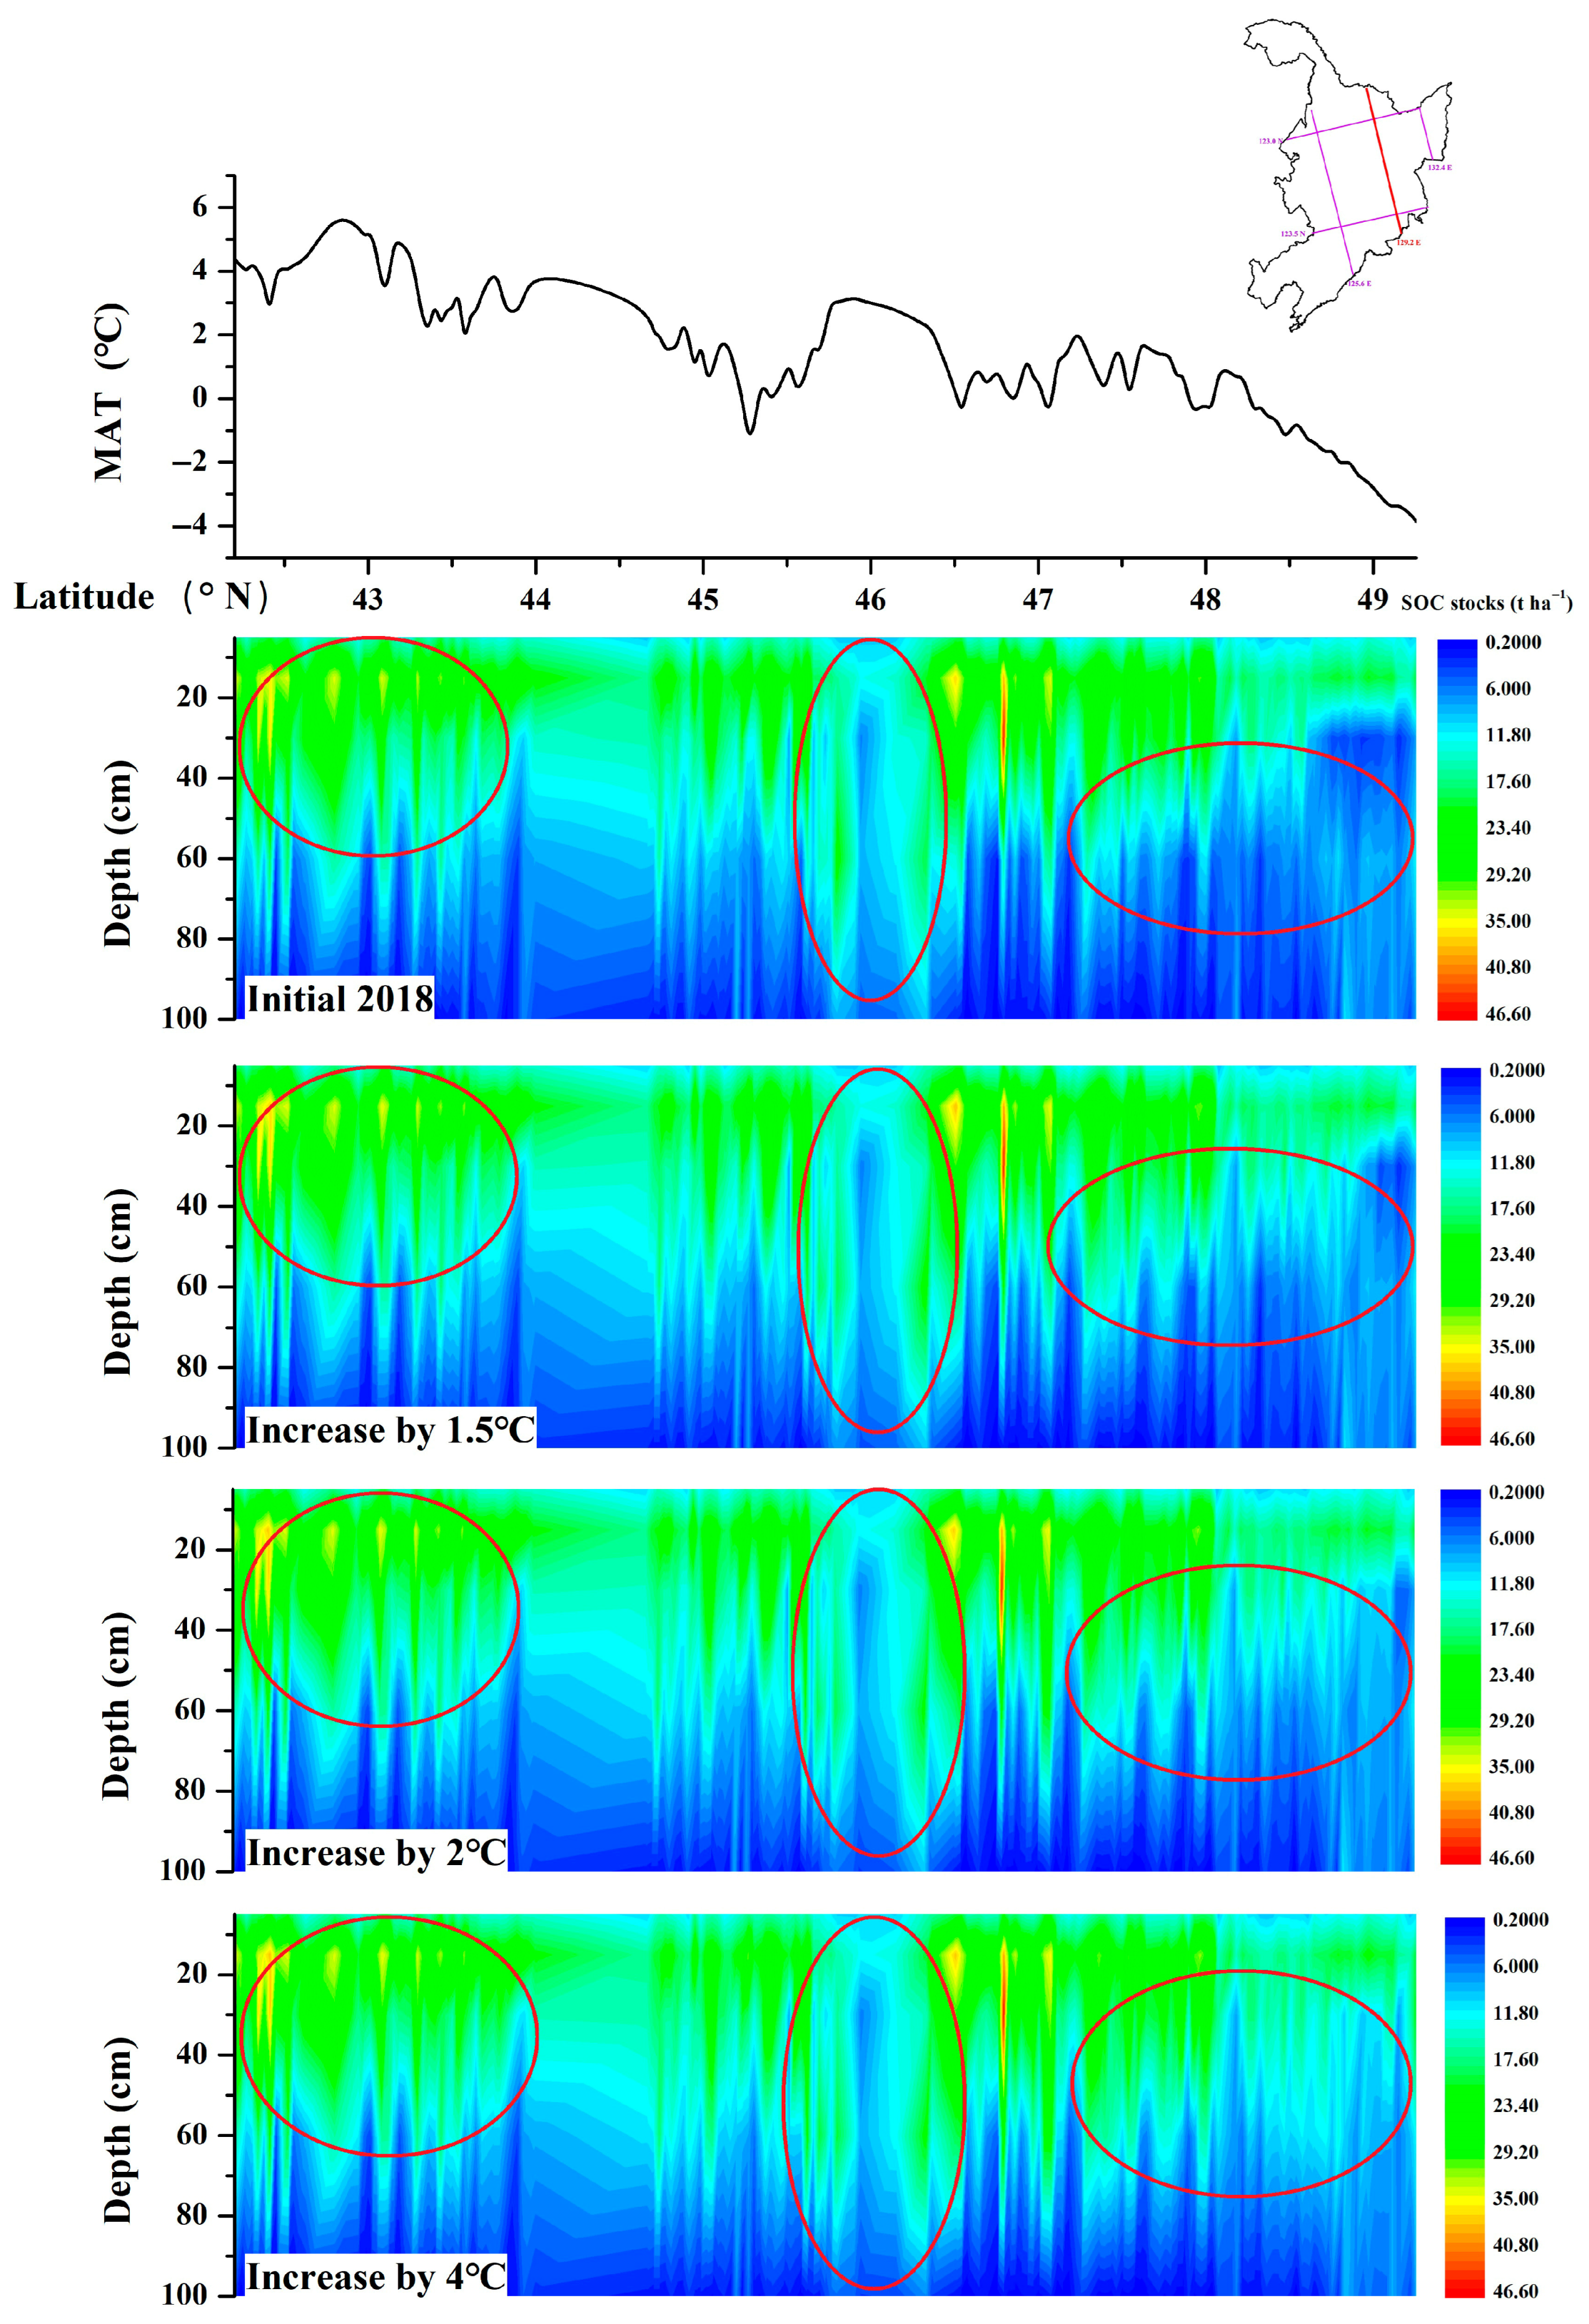
3.4. Spatial Distribution Variation of SOC Stocks

The spatial patterns of SOC stocks across five depth intervals (0–5, 5–15, 15–30, 30–60, and 60–100 cm) under the 2018 baseline conditions and three warming scenarios (1.5 °C, 2 °C, and 4 °C) are illustrated in Figure 4. Across all scenarios, the spatial distributions were consistent, showing concentric decreases in SOC stocks from central areas toward peripheral regions. Depth-specific analysis indicated that the maximum SOC accumulation occurred in the 5–15 cm stratum, followed by successively lower values in the 15–30 cm, 0–5 cm, 30–60 cm, and 60–100 cm layers. Composite depth analysis (0–30 cm and 0–100 cm) revealed temperature-dependent reductions in SOC stocks, decreasing from 52.60 to 50.24 t ha−1 (0–30 cm) and from 100.56 to 66.73 t ha−1 (0–100 cm), respectively (Figure 5). Notably, the 0–30 cm layer accounted for approximately half of the total SOC storage within the 1 m soil profile. Vertical profile analysis along 129.2° E (Figure 6) further confirmed progressive SOC depletion with increasing warming throughout the entire soil column.

4. Discussion

4.1. Controls of SOC Stocks

To quantify the influence of environmental factors on SOC stocks distribution, we performed 100 iterations of the RF model across five distinct soil depth intervals. The resulting relative importance values were standardized to 100% to enable direct comparison between different variables and depth strata (Figure 3). Our findings consistently identified topographic parameters as the primary determinants of SOC stocks spatial variability (contributing approximately 50% of the total influence), with climatic, biological, and soil property factors exhibiting progressively lesser impacts. This hierarchical pattern of variable importance has been previously documented in studies of complex terrain systems, where topographic features have proven particularly effective for SOC stock prediction [33]. The underlying mechanism involves terrain-mediated redistribution of both material and energy across landscapes [20,31]. Within the topographic variable group, ELE consistently emerged as the most influential parameter governing SOC spatial patterns, a finding that corroborates multiple independent investigations [33,43,49]. These results collectively highlight the fundamental role of landscape position in regulating SOC storage dynamics through its control over resource distribution. Research conducted in Yangmingshan National Park, China, by Tsuia et al. [50] confirmed elevation (ELE) as a reliable and straightforward indicator for predicting SOC stocks. However, our analysis revealed an unexpected pattern where curvature (CA) and profile curvature (PC) exhibited greater predictive importance than ELE, specifically in the deepest soil layer (60–100 cm). This phenomenon likely results from the progressive attenuation of surface environmental influences with increasing soil depth, coupled with the growing dominance of intrinsic soil physicochemical characteristics in governing SOC distribution patterns [37]. Slope aspect (SA) was found to indirectly modify soil properties through its regulation of microclimatic variables, including solar radiation intensity, precipitation distribution, and thermal regimes in mountainous environments [33]. These findings align with the work of Rezaei and Gilkes [51], who documented distinct SOC accumulation patterns across different slope orientations, with north-facing (shady) slopes demonstrating particularly pronounced effects on SOC stocks in deeper soil horizons. The depth-dependent variations in controlling factors underscore the complex vertical stratification of SOC stabilization mechanisms within soil profiles.
Climatic factors, particularly MAT and MAP, emerged as secondary but significant environmental variables influencing SOC stocks spatial variability across all soil depths. These climate parameters, widely employed in SOC stocks prediction models, demonstrated depth-dependent patterns of influence. Notably, MAT showed peak importance in surface layers (0–5 cm and 5–15 cm), gradually diminishing with increasing soil depth—a pattern consistent with multiple previous investigations [33,39,52,53]. Wang et al.’s [54] analysis of China’s national soil survey data revealed similar vertical trends, showing strongest SOC–MAT correlations in topsoil that weakened progressively with depth. Complementary studies by Jobbágy and Jackson [9] using global soil databases (NSCD and WISE) identified contrasting climatic controls: while SOC accumulation positively correlated with precipitation and clay content, it exhibited inverse relationships with temperature. Their work further highlighted a fundamental depth-related transition in controlling mechanisms—from climate-dominated regulation in surface layers to clay content-dominated influences in deeper horizons. This shift likely reflects the increasing proportion of slow-cycling SOC fractions at greater depths, suggesting fundamentally different stabilization mechanisms operate across the soil profile. The collective evidence underscores the complex interplay between climatic drivers and depth-stratified SOC dynamics in terrestrial ecosystems.
NDVI emerged as a crucial environmental variable influencing SOC stocks spatial patterns, demonstrating particularly strong predictive power in our study. Our results showed NDVI ranked as the second most important variable in intermediate soil layers (5–15 cm and 15–30 cm) and, surprisingly, became the dominant factor in the deepest layer (60–100 cm) (Figure 3). This finding aligns with research by Kumar et al. [55] in Himalayan chir pine forests and Mondal et al. [56], who identified NDVI as a primary controller of SOC distribution, especially in surface soils. The persistent importance of NDVI across all five depth layers was unexpected, given that deep SOC stocks are typically governed by inherent soil properties. This phenomenon may reflect NDVI’s effectiveness in capturing vegetation productivity and biomass inputs—particularly relevant in Northeast China’s forest ecosystems where abundant organic matter from vegetation (stems, leaves, roots, and litter) combines with cold winters that slow decomposition, promoting SOC accumulation across the entire soil profile.
The integration of a comprehensive set of pedological parameters has been demonstrated to significantly improve the robustness of models in predicting soil properties, particularly at greater depths where spatial heterogeneity and data limitations are more pronounced. This enhancement arises from the model’s ability to capture complex, non-linear relationships between soil-forming factors and target variables, thereby reducing prediction uncertainty in subsurface layers. Empirical studies have confirmed that incorporating a diverse array of soil covariates—such as texture, mineralogy, organic matter content, and geochemical indicators—strengthens model generalizability and accuracy across different soil horizons [44,46]. For example, the inclusion of depth-specific predictors (e.g., parent material composition and hydraulic properties) has been shown to mitigate biases in deeper soil layers, where traditional approaches often exhibit diminished performance [44,45,46,47,48]. These findings underscore the importance of leveraging multi-parameter pedological datasets to optimize RF-based predictive frameworks for stratified soil systems. Contrary to expectations, soil property variables showed limited relative importance in our RF model at all depths. This contrasts with Jobbágy and Jackson’s [10] conclusion about clay content’s dominant role in deep SOC stocks. We hypothesize that in our study area, the influence of clay content may have been masked by stronger topographic and climatic variables. Supporting this interpretation, our correlation analysis revealed significant relationships between clay content and both slope gradient (SG) and topographic wetness index (TWI) (Table 2), suggesting potential covariation between soil properties and terrain features that may have obscured individual effects in the predictive modeling. This complex interplay between vegetation inputs, climatic conditions, and terrain-mediated soil properties highlights the need for integrated approaches when modeling SOC distribution across different soil horizons.

4.2. Response of SOC Stocks in Climate Warming

Table 1 demonstrates the increase in SOC stock values with soil depth. Conversely, Figure 4 illustrates a decrease in SOC stock with increasing depth across all temperature scenarios. The observed forest soil SOC stocks in Table 1 may be attributed to unique regional soil characteristics, such as deep organic matter input, mineral protection, or historical disturbances. However, the warming simulation in Figure 4 suggests that SOC decreases with depth due to active surface carbon inputs and limited deep decomposition. This discrepancy likely arises from two primary factors: (1) field observations capturing site-specific factors (e.g., deep root distribution or mineral-organic matter interactions), while the model relies on generalized assumptions; (2) the warming simulation emphasizes temperature-driven acceleration of decomposition, whereas actual soil conditions may involve deep physical and chemical protective mechanisms that counteract temperature effects. To address these differences in future studies, it will be critical to refine the model’s parameterization by incorporating site-specific soil processes.
The spatial patterns of SOC stocks under various warming scenarios exhibited consistent distribution characteristics across all depth layers (Figure 4), with the highest concentrations predominantly located in central regions characterized by humid and semi-humid conditions. This spatial aggregation reflects Northeast China’s unique climatic conditions—warm, rainy summers coupled with cold, prolonged winters—which collectively promote the accumulation of organic matter [56,57]. The central forested areas’ elevated SOC stocks result from synergistic effects of favorable climate, vegetation characteristics, and decomposition dynamics. These regions experience temperate humid conditions with optimal hydrothermal combinations, supporting productive broadleaved and mixed forests that generate abundant, readily decomposable litter inputs. Conversely, northern areas with colder temperate climates demonstrate contrasting conditions: although low temperatures suppress microbial activity, the predominance of coniferous vegetation yields less litter containing higher proportions of resistant compounds (e.g., lignin and tannins). Permafrost further limits root growth and carbon inputs, resulting in comparatively lower SOC stocks. The central region’s superior carbon sequestration capacity also stems from its thicker organic horizons and more developed soil profiles. These findings align with Wu et al.’s [58] machine learning-based analysis of northern hemisphere permafrost zones, which identified MAT and NDVI as primary controls on SOC distribution patterns in cold region ecosystems. The consistent spatial organization across warming scenarios suggests robust biogeochemical constraints on SOC distribution that persist despite climatic changes.
The study further investigated the impact of climate warming on the spatial distribution of three-dimensional SOC stocks by analyzing a cross-sectional profile along the longitude 129.2° E at a 1 m soil depth (Figure 6). The results revealed a pronounced decreasing trend in SOC stocks as mean annual temperature (MAT) increased along this longitudinal transect. Moreover, under various climate warming scenarios, SOC stocks consistently declined, with the most substantial reduction observed under a 4 °C temperature rise. This phenomenon can be attributed to the accelerated decomposition of organic matter under warmer conditions, which facilitates the release of stored carbon into the atmosphere. These findings corroborate previous studies indicating that rising temperatures enhance microbial activity, thereby increasing SOC loss [37]. For example, Jones et al. [59] demonstrated that climate warming could reduce SOC levels by increasing decomposition rates more significantly than net primary productivity (NPP). Similarly, Zhao et al. [60] reported that future SOC depletion on the Chinese Loess Plateau would be strongly influenced by climate warming, even under scenarios of warmer and wetter conditions. Collectively, these findings highlight the vulnerability of soil carbon reservoirs to global temperature increases.
Under the warming scenarios of 1.5 °C, 2 °C, and 4 °C, the overall SOC stocks exhibited a decreasing trend in both the surface layer (0–30 cm) and the deep layer (0–100 cm), with the most significant reduction occurring under the highest warming level (4 °C). However, in the permafrost regions of Northeast China, SOC stocks were lower under a 1.5 °C temperature increase compared to increases of 2 °C or 4 °C (Figure 5). Our analysis suggests that this phenomenon is primarily due to the partial thawing of permafrost at 1.5 °C, which accelerates the decomposition of activated carbon, while vegetation productivity remains largely unaffected [37,59]. In contrast, the stronger CO2 fertilization effect under 2 °C and 4 °C warming scenarios significantly enhances vegetation carbon input—particularly for northern tree species, which exhibit more pronounced growth responses [2,16]. Additionally, the complete thawing of deep permafrost under higher warming levels may create anaerobic conditions that suppress decomposition, thereby reducing carbon loss [18,26]. This nonlinear response is especially pronounced in the forest-permafrost ecotone within the cold temperate zone of Northeast China. Across different warming projections, forested regions in Northeast China contributed to approximately half of the total SOC stock losses in both depth intervals. Climate warming influences SOC dynamics not only by altering litter input but also by significantly accelerating SOC decomposition rates, as supported by previous studies [31,32,37,59]. Zhao et al. [60] further confirmed that rising temperatures enhance the breakdown of soil carbon, releasing it into the atmosphere and intensifying global warming. A key driver of this process is the increased microbial biomass and activity stimulated by warmer conditions, which promotes faster SOC degradation [32]. Beyond reducing overall SOC stocks, climate warming also modifies the composition of soil carbon. While total SOC content may remain relatively stable under moderate warming, the proportion of labile (active) carbon fractions tends to rise [10,59]. However, as warming continues, this initial increase in labile carbon may eventually slow or stabilize, reflecting complex interactions between temperature effects and soil carbon dynamics.

4.3. Uncertainties in the Present Study

Although the combination of the RF model with the equal-area spline profile function and space-for-time substitution approach enabled reasonably accurate three-dimensional predictions of SOC stocks under climate warming, this study still contains several sources of uncertainty. First, the relatively small number of sampling sites (n = 63) across Northeast China’s vast forest ecosystems may not fully represent the region’s complex SOC spatial variability. This limited sampling density could miss important local-scale variations in soil characteristics, potentially reducing the model’s predictive accuracy when applied to unsampled areas. Notably, the insufficient number of soil sampling sites in the permafrost regions of Heilongjiang may lead to an underestimation of the spatial variability of SOC stocks. This limitation could affect the reliability of SOC stock predictions in forest soils, particularly in areas highly sensitive to permafrost thawing. Second, the environmental variables were obtained from different sources with inconsistent spatial resolutions and data formats. Despite applying data standardization procedures, this integration process may have caused some loss of critical fine-scale environmental information that affects the distribution of SOC stocks. Such technical limitations in data processing could introduce errors that propagate through the modeling framework. Third, while the equal-area spline function effectively approximated vertical SOC patterns, real-world SOC depth distributions are influenced by numerous site-specific factors not fully captured in the model, including small-scale topographic features, past land management practices, and groundwater influences. These unmodeled variables may lead to localized prediction discrepancies between simulated and actual SOC profiles. Fourth, the climate scenarios only considered fixed temperature increases (1.5 °C, 2 °C, 4 °C) while holding other climatic factors constant. In reality, warming would likely modify precipitation distribution and soil water availability—key factors controlling SOC decomposition rates. The exclusion of these interacting climate variables may affect the reliability of long-term SOC stocks projections under warming conditions. Fifth, the exclusion of vegetation growth and forest succession dynamics from our model may introduce uncertainties into soil organic carbon (SOC) projections, as these processes directly affect carbon inputs and stabilization mechanisms under climate warming. Future studies should incorporate vegetation feedbacks to enhance the accuracy of long-term SOC predictions. Finally, the predictive power of environmental variables weakens with increasing soil depth, where inherent soil properties (e.g., mineral composition, texture) play a greater role in carbon stabilization. Since the model primarily used surface-based predictors to estimate subsoil carbon stocks, it may not adequately represent the distinct preservation mechanisms operating in deeper soil layers. These limitations underscore the importance of future improvements, including more extensive soil sampling, enhanced environmental datasets, and more sophisticated climate modeling approaches to refine SOC stock predictions under global change scenarios.

5. Conclusions

This study was based on the hypothesis that climate warming would significantly influence the spatial distribution and SOC stocks in Northeast China’s forest ecosystems, with the topsoil layer being particularly vulnerable to temperature increases. The results confirmed this hypothesis, revealing consistent declines in SOC stocks across all soil depths under 1.5 °C, 2 °C, and 4 °C warming scenarios, with the most substantial losses (approximately 50%) occurring in the top 30 cm of soil. The integrated modeling framework, combining random forest algorithms with spline functions and space-for-time substitution, demonstrated strong predictive accuracy, supported by low error rates (MAE, RMSE) and high correlation coefficients (R2, LCCC). However, some aspects could be improved in future research. For instance, the study primarily relied on climate and vegetation indices (MAT, NDVI) as key predictors, while other factors such as microbial activity, soil texture, and land-use history were not fully incorporated. Additionally, long-term observational data could further validate the space-for-time substitution approach, reducing uncertainties in projections. Despite these limitations, the findings provide critical insights for regional ecosystem management, offering a scientific basis for climate adaptation strategies, forest conservation policies, and sustainable land-use planning. The methodological framework also holds promise for application in other temperate forests facing similar climate change pressures.

Author Contributions

Conceptualization, S.W.; methodology, S.W. and S.B.; software, Z.Y. and Z.W.; validation, C.L. and D.S.; investigation, Z.Y. and X.Z.; data curation, Z.Y.; writing—original draft preparation, S.W.; writing—review and editing, S.W. and H.L.; funding acquisition, H.L. All authors have read and agreed to the published version of the manuscript.

Funding

This work was funded by the National Key R&D Program of China (Grant No. 2023YFD1501300).

Data Availability Statement

The original contributions presented in this study are included in the article. Further inquiries can be directed to the corresponding author.

Conflicts of Interest

The authors declare no conflicts of interest.

References

  1. Hansen, K.; Butzeck, C.; Eschenbach, A.; Gröngröft, A.; Jensen, K.; Pfeiffer, E.M. Factors influencing the organic carbon pools in tidal marsh soils of the Elbe estuary (Germany). J. Soils Sediments 2017, 17, 47–60. [Google Scholar] [CrossRef]
  2. Lal, R. Soil carbon sequestration impacts on global climate change and food security. Science 2004, 304, 1623–1627. [Google Scholar] [CrossRef] [PubMed]
  3. Qu, Q.; Xu, H.; Xu, L.; You, C.; Tan, B.; Li, H.; Zhang, L.; Wang, L.; Liu, S.; Xu, Z.; et al. Forest thinning effects on soil carbon stocks and dynamics: Perspective of soil organic carbon sequestration rates. Catena 2025, 250, 108759. [Google Scholar] [CrossRef]
  4. Siegenthaler, U.; Wenk, T. Rapid atmospheric CO2 variations and ocean circulation. Nature 1984, 308, 624–626. [Google Scholar] [CrossRef]
  5. Qin, J.; Liu, P.; Martin, A.R.; Wang, W.; Lei, Y.; Li, H. Forest carbon storage and sink estimates under different management scenarios in China from 2020 to 2100. Sci. Total Environ. 2024, 927, 172076. [Google Scholar] [CrossRef] [PubMed]
  6. Guan, L.; Sun, Y.; Yuan, M.; Li, J.; Zhang, Y.; Tang, J. Forest Soil Organic Carbon Review. Am. J. Plant Sci. 2025, 16, 155–169. [Google Scholar] [CrossRef]
  7. Ascenzi, I.; Hilbers, J.P.; van Katwijk, M.M.; Huijbregts, M.A.; Hanssen, S.V. Increased but not pristine soil organic carbon stocks in restored ecosystems. Nat. Commun. 2025, 16, 637. [Google Scholar] [CrossRef] [PubMed]
  8. Pan, Y.; Birdsey, R.A.; Fang, J.; Houghton, R.; Kauppi, P.E.; Kurz, W.A.; Phillips, O.L.; Shvidenko, A.; Lewis, S.L.; Canadell, J.G.; et al. A large and persistent carbon sink in the world’s forests. Science 2011, 333, 988–993. [Google Scholar] [CrossRef] [PubMed]
  9. Yu, G.; Chen, Z.; Piao, S.; Peng, C.; Ciais, P.; Wang, Q.; Li, X.; Zhu, X. High carbon dioxide uptake by subtropical forest ecosystems in the East Asian monsoon region. Proc. Natl. Acad. Sci. USA 2014, 111, 4910–4915. [Google Scholar] [CrossRef] [PubMed]
  10. Jobbágy, E.G.; Jackson, R.B. The vertical distribution of soil organic carbon and its relation to climate and vegetation. Ecol. Appl. 2000, 10, 423–436. [Google Scholar] [CrossRef]
  11. Wang, M.; Guo, X.; Zhang, S.; Jiao, L.; Mishra, U.; Yang, Y.; Zhu, B.; Wang, G.; Mao, X.; Qian, T.; et al. Global soil profiles indicate depth-dependent soil carbon losses under a warmer climate. Nat. Commun. 2022, 13, 5514. [Google Scholar] [CrossRef] [PubMed]
  12. Shi, L.; Feng, W.; Xu, J.; Kuzyakov, Y. Agroforestry systems: Meta-analysis of soil carbon stocks, sequestration processes, and future potentials. Land Degrad. Dev. 2018, 29, 3886–3897. [Google Scholar] [CrossRef]
  13. Arrouays, D.; McBratney, A.B.; Minasny, B.; Hempel, J.W.; Heuvelink, G.B.M.; MacMillan, R.A.; McKenzie, N.J. The GlobalSoilMap project specifications. In GlobalSoilMap: Basis of the Global Spatial Soil Information System; CRC Press: Boca Raton, FL, USA, 2014. [Google Scholar]
  14. Bonfatti, B.R.; Hartemink, A.E.; Giasson, E. Comparing soil C stocks from soil profile data using four different methods. In Digital Soil Morphometrics; Springer International Publishing: Cham, Switzerland, 2016; pp. 315–329. [Google Scholar]
  15. Zhang, M.; Shi, W.; Ren, Y.; Wang, Z.; Ge, Y.; Guo, X.; Mao, D.; Ma, Y. Proportional allocation with soil depth improved mapping soil organic carbon stocks. Soil Tillage Res. 2022, 224, 105519. [Google Scholar] [CrossRef]
  16. Jague, E.A.; Sommer, M.; Saby, N.P.; Cornelis, J.T.; Van Wesemael, B.; Van Oost, K. High resolution characterization of the soil organic carbon depth profile in a soil landscape affected by erosion. Soil Tillage Res. 2016, 156, 185–193. [Google Scholar] [CrossRef]
  17. Wang, S.; Zhang, X.; Adhikari, K.; Wang, Z.; Shi, D.; Jin, X.; Qian, F. Impact of future climate warming on soil organic carbon stocks in Inner Mongolia, China. Ecol. Indic. 2023, 156, 111208. [Google Scholar] [CrossRef]
  18. Adhikari, K.; Hartemink, A.E.; Minasny, B.; Bou Kheir, R.; Greve, M.B.; Greve, M.H. Digital mapping of soil organic carbon contents and stocks in Denmark. PLoS ONE 2014, 9, e105519. [Google Scholar] [CrossRef] [PubMed]
  19. Mulder, V.L.; Lacoste, M.; Richer-De-Forges, A.C.; Arrouays, D. GlobalSoilMap France: High-resolution spatial modelling the soils of France up to two meter depth. Sci. Total Environ. 2016, 573, 1352–1369. [Google Scholar] [CrossRef] [PubMed]
  20. McBratney, A.B.; Santos, M.L.M.; Minasny, B. On digital soil mapping. Geoderma 2003, 117, 3–52. [Google Scholar] [CrossRef]
  21. Le Noë, J.; Manzoni, S.; Abramoff, R.; Bölscher, T.; Bruni, E.; Cardinael, R.; Ciais, P.; Chenu, C.; Clivot, H.; Derrien, D.; et al. Soil organic carbon models need independent time-series validation for reliable prediction. Commun. Earth Environ. 2023, 4, 158. [Google Scholar] [CrossRef]
  22. Yang, L.; Cai, Y.; Zhang, L.; Guo, M.; Li, A.; Zhou, C. A deep learning method to predict soil organic carbon content at a regional scale using satellite-based phenology variables. Int. J. Appl. Earth Obs. Geoinf. 2021, 102, 102428. [Google Scholar] [CrossRef]
  23. Payen, F.T.; Sykes, A.; Aitkenhead, M.; Alexander, P.; Moran, D.; MacLeod, M. Predicting the abatement rates of soil organic carbon sequestration management in Western European vineyards using random forest regression. Clean. Environ. Syst. 2021, 2, 100024. [Google Scholar] [CrossRef]
  24. Minasny, B.; McBratney, A.B.; Malone, B.P.; Wheeler, I. Digital mapping of soil carbon. In Advances in Agronomy; Academic Press: Cambridge, MA, USA, 2013; Volume 118, pp. 1–47. [Google Scholar]
  25. Xie, E.; Zhang, X.; Lu, F.; Peng, Y.; Chen, J.; Zhao, Y. Integration of a process-based model into the digital soil mapping improves the space-time soil organic carbon modelling in intensively human-impacted area. Geoderma 2022, 409, 115599. [Google Scholar] [CrossRef]
  26. Wang, S.; Roland, B.; Adhikari, K.; Zhuang, Q.; Jin, X.; Han, C.; Qian, F. Spatial-temporal variations and driving factors of soil organic carbon in forest ecosystems of Northeast China. For. Ecosyst. 2023, 10, 100101. [Google Scholar] [CrossRef]
  27. National Bureau of Statistics of China. China Statisitical Yearbook. Available online: https://www.stats.gov.cn/sj/ndsj/2024/indexch.htm (accessed on 20 July 2025).
  28. Zhu, A.X.; Yang, L.; Li, B.; Qin, C.; English, E.; Burt, J.E.; Zhou, C. Purposive sampling for digital soil mapping for areas with limited data. In Digital Soil Mapping with Limited Data; Hartemink, A.E., Ed.; Springer: Berlin/Heidelberg, Germany, 2008; pp. 33–245. [Google Scholar]
  29. Batjes, N.H. Total carbon and nitrogen in the soils of the world. Eur. J. Soil Sci. 1996, 47, 151–163. [Google Scholar] [CrossRef]
  30. R Development Core Team. R: A Language and Environment for Statistical Computing; R Foundation for Statistical Computing: Vienna, Austria, 2013; Available online: https://www.r-project.org/ (accessed on 20 July 2025).
  31. Gibson, A.J.; Hancock, G.R.; Verdon-Kidd, D.C.; Martinez, C.; Wells, T. The impact of shifting Köppen-Geiger climate zones on soil organic carbon concentrations in Australian grasslands. Glob. Planet. Change 2021, 202, 103523. [Google Scholar] [CrossRef]
  32. McKenney, D.W.; Pedlar, J.H.; Papadopol, P.; Hutchinson, M.F. The development of 1901–2000 historical monthly climate models for Canada and the United States. Agric. For. Meteorol. 2006, 138, 69–81. [Google Scholar] [CrossRef]
  33. Wang, S.; Zhou, M.; Adhikari, K.; Zhuang, Q.; Bian, Z.; Wang, Y.; Jin, X. Anthropogenic controls over soil organic carbon distribution from the cultivated lands in Northeast China. Catena 2022, 210, 105897. [Google Scholar] [CrossRef]
  34. Román-Sánchez, A.; Vanwalleghem, T.; Peña, A.; Laguna, A.; Giráldez, J.V. Controls on soil carbon storage from topography and vegetation in a rocky, semi-arid landscapes. Geoderma 2018, 311, 159–166. [Google Scholar] [CrossRef]
  35. Blackburn, K.W.; Libohova, Z.; Adhikari, K.; Kome, C.; Maness, X.; Silman, M.R. Influence of land use and topographic factors on soil organic carbon stocks and their Spatial and vertical distribution. Remote Sens. 2022, 14, 2846. [Google Scholar] [CrossRef]
  36. Dharumarajan, S.; Hegde, R. Digital mapping of soil texture classes using Random Forest classification algorithm. Soil Use Manag. 2022, 38, 135–149. [Google Scholar] [CrossRef]
  37. Adhikari, K.; Owens, P.R.; Libohova, Z.; Miller, D.M.; Wills, S.A.; Nemecek, J. Assessing soil organic carbon stock of Wisconsin, USA and its fate under future land use and climate change. Sci. Total Environ. 2019, 667, 833–845. [Google Scholar] [CrossRef] [PubMed]
  38. Shafizadeh-Moghadam, H.; Minaei, F.; Talebi-khiyavi, H.; Xu, T.; Homaee, M. Synergetic use of multi-temporal Sentinel-1, Sentinel-2, NDVI, and topographic factors for estimating soil organic carbon. Catena 2022, 212, 106077. [Google Scholar] [CrossRef]
  39. Bishop, T.F.A.; McBratney, A.B.; Laslett, G.M. Modelling soil attribute depth functions with equal-area quadratic smoothing splines. Geoderma 1999, 91, 27–45. [Google Scholar] [CrossRef]
  40. Malone, B.P.; McBratney, A.B.; Minasny, B.; Laslett, G.M. Mapping continuous depth functions of soil carbon storage and available water capacity. Geoderma 2009, 154, 138–152. [Google Scholar] [CrossRef]
  41. Breiman, L. Random forests. Mach. Learn. 2001, 45, 5–32. [Google Scholar] [CrossRef]
  42. Liaw, A.; Wiener, M. Classification and regression by random Forest. R News 2022, 2, 18–22. [Google Scholar]
  43. Strey, S.; Boy, J.; Strey, R.; Weber, O.; Guggenberger, G. Response of soil organic carbon to land-use change in central Brazil: A large-scale comparison of Ferralsols and Acrisols. Plant Soil 2016, 408, 327–342. [Google Scholar] [CrossRef]
  44. Yang, R.M.; Zhu, C.M.; Zhang, X.; Huang, L.M. A preliminary assessment of the space-for-time substitution method in soil carbon change prediction. Soil Sci. Soc. Am. J. 2022, 86, 423–434. [Google Scholar] [CrossRef]
  45. Bonfatti, B.R.; Hartemink, A.E.; Giasson, E.; Tornquist, C.G.; Adhikari, K. Digital mapping of soil carbon in a viticultural region of Southern Brazil. Geoderma 2016, 261, 204–221. [Google Scholar] [CrossRef]
  46. Waring, C.; Stockmann, U.; Malone, B.P.; Whelan, B.; McBratney, A.B. Is percent ‘projected natural vegetation soil carbon’ a useful indicator of soil condition? In Soil Carbon; Springer: Cham, Swizerland, 2014; pp. 219–227. [Google Scholar]
  47. Adhikari, K.; Hartemink, A.E. Digital mapping of topsoil carbon content and changes in the Driftless Area of Wisconsin, USA. Soil Sci. Soc. Am. J. 2015, 79, 155–164. [Google Scholar] [CrossRef]
  48. Zhou, M.; Zhou, C.; Peng, Y.; Jia, R.; Zhao, W.; Liang, S.; Xu, X.; Terada, A.; Wang, G. Space-for-time substitution leads to carbon emission overestimation in eutrophic lakes. Environ. Res. 2023, 219, 115175. [Google Scholar] [CrossRef] [PubMed]
  49. Gomes, L.C.; Faria, R.M.; de Souza, E.; Veloso, G.V.; Schaefer, C.E.G.; Fernandes Filho, E.I. Modelling and mapping soil organic carbon stocks in Brazil. Geoderma 2019, 340, 337–350. [Google Scholar] [CrossRef]
  50. Tsui, C.C.; Tsai, C.C.; Chen, Z.S. Soil organic carbon stocks in relation to elevation gradients in volcanic ash soils of Taiwan. Geoderma 2013, 209, 119–127. [Google Scholar] [CrossRef]
  51. Rezaei, S.A.; Gilkes, R.J. The effects of landscape attributes and plant community on soil chemical properties in rangelands. Geoderma 2005, 125, 167–176. [Google Scholar] [CrossRef]
  52. San Román, A.X.; Srikanthan, N.; Hamid, A.A.; Muratore, T.J.; Knorr, M.A.; Frey, S.D.; Simpson, M.J. Long-term warming in a temperate forest accelerates soil organic matter decomposition despite increased plant-derived inputs. Biogeochemistry 2024, 167, 1159–1174. [Google Scholar] [CrossRef]
  53. Li, J.; Pei, J.; Pendall, E.; Reich, P.B.; Noh, N.J.; Li, B.; Fang, C.; Nie, M. Rising Temperature May Trigger Deep Soil Carbon Loss Across Forest Ecosystems. Adv. Sci. 2020, 7, 2001242. [Google Scholar] [CrossRef] [PubMed]
  54. Wang, S.; Huang, M.; Shao, X.; Mickler, R.A.; Li, K.; Ji, J. Vertical distribution of soil organic carbon in China. Environ. Manag. 2004, 33, S200–S209. [Google Scholar] [CrossRef]
  55. Kumar, M.; Kumar, A.; Thakur, T.K.; Sahoo, U.K.; Kumar, R.; Konsam, B.; Pandey, R. Soil organic carbon estimation along an altitudinal gradient of chir pine forests in the Garhwal Himalaya, India: A field inventory to remote sensing approach. Land Degrad. Dev. 2022, 33, 3387–3400. [Google Scholar] [CrossRef]
  56. Mondal, A.; Khare, D.; Kundu, S.; Mondal, S.; Mukherjee, S.; Mukhopadhyay, A. Spatial soil organic carbon (SOC) prediction by regression kriging using remote sensing data. Egypt. J. Remote Sens. Space Sci. 2017, 20, 61–70. [Google Scholar] [CrossRef]
  57. Ma, H.; Peng, M.; Yang, Z.; Yang, K.; Zhao, C.; Li, K.; Guo, F.; Yang, Z.; Cheng, H. Spatial distribution and driving factors of soil organic carbon in the Northeast China Plain: Insights from latest monitoring data. Sci. Total Environ. 2024, 911, 168602. [Google Scholar] [CrossRef] [PubMed]
  58. Wu, T.; Wang, D.; Mu, C.; Zhang, W.; Zhu, X.; Zhao, L.; Wu, X. Storage, patterns, and environmental controls of soil organic carbon stocks in the permafrost regions of the Northern Hemisphere. Sci. Total Environ. 2022, 828, 154464. [Google Scholar] [CrossRef] [PubMed]
  59. Jones, C.; McConnell, C.; Coleman, K.; Cox, P.; Falloon, P.; Jenkinson, D.; Powlson, D. Global climate change and soil carbon stocks; predictions from two contrasting models for the turnover of organic carbon in soil. Glob. Change Biol. 2005, 11, 154–166. [Google Scholar] [CrossRef]
  60. Zhao, F.; Wu, Y.; Hui, J.; Sivakumar, B.; Meng, X.; Liu, S. Projected soil organic carbon loss in response to climate warming and soil water content in a loess watershed. Carbon Balance Manag. 2021, 16, 24. [Google Scholar] [CrossRef] [PubMed]
Figure 1. Spatial distribution of soil sampling sites across the study area with topographic representation (90 m digital elevation model).
Forests 16 01209 g001
Figure 2. Flowchart of the methodology.
Forests 16 01209 g002
Figure 3. Variable importance analysis of environmental predictors for SOC estimation using random forest modeling (n = 100 iterations).
Forests 16 01209 g003
Figure 4. Depth-resolved SOC stock patterns under climate warming, where the area within the circle (highlighted in red) indicates a significant change in SOC stocks.
Forests 16 01209 g004
Figure 5. Depth-dependent SOC stock distribution (0–30 cm and 0–100 cm) under climate warming, where the area within the circle (highlighted in purple) indicates a significant change in SOC stocks.
Forests 16 01209 g005
Figure 6. Longitudinal variation in SOC stocks vertical distribution (0–1 m depth) under climate warming along 129.2° E, where the area within the circle (highlighted in red) indicates a significant change in SOC stocks.
Forests 16 01209 g006
Table 1. Summary statistics of SOC stocks and environmental variables by depth (n = 63).
PropertyUnitMin.Max.MeanSDSke.Kur.
BD0–5g cm−30.51 1.61 1.10 0.27 −0.25 −0.78
BD5–15g cm−30.61 1.80 1.13 0.26 −0.10 −0.30
BD15–30g cm−30.02 1.70 1.15 0.38 −1.64 2.14
BD30–60g cm−30.02 1.83 1.12 0.52 −1.15 −0.14
BD60–100g cm−30.01 1.86 1.15 0.56 −1.19 −0.18
SOC0–5g kg−16.70 142.82 33.22 29.61 1.86 3.83
SOC5–15g kg−15.21 147.80 27.72 25.88 2.31 7.10
SOC15–30g kg−11.30 235.30 17.82 29.94 6.34 45.66
SOC30–60g kg−10.20 202.00 10.57 25.86 6.74 49.47
SOC60–100g kg−10.80 126.60 6.42 16.41 6.57 47.35
SOC stocks0–5t ha−13.7856.8114.6711.021.864.29
SOC stocks5–15t ha−12.65106.9825.6321.052.205.63
SOC stocks15–30t ha−10.13170.3324.0829.433.5515.04
SOC stocks30–60t ha−10.01352.2826.4855.774.8024.69
SOC stocks60–100t ha−10.01232.8619.7138.924.6322.78
ELEm36.281266.74394.49251.661.171.81
SGDegree0.089.052.211.581.765.29
SADegree7.80355.30217.9592.42−0.49−0.75
CAm2 m−14,523,550.001,214,630,000.00126,385,146.51199,643,814.283.5815.19
PCIndex−0.020.010.000.01−0.711.20
TWIIndex7.9014.0010.381.130.851.73
MATCelsius degree−2.715.932.581.53−0.281.38
MAPmm214.171290.23652.24286.010.51−0.35
NDVIIndex0.650.920.840.05−1.693.54
ClayPercentage12.0035.0022.514.380.481.25
SiltPercentage24.0041.0029.483.471.963.53
SandPercentage24.0062.0048.067.13−1.453.36
Table 2. Correlations between SOC stocks and environmental factors in soil profiles (n = 63).
PropertyELESGSACAPCTWIMATMAPNDVIClaySiltSand
SOC stocks0–50.40 **0.27 *0.01−0.160.04−0.190.37 **0.120.27 *0.060.05−0.06
SOC stocks5–150.36 **0.26 *0.12−0.140.06−0.160.35 **0.090.28 *0.080.05−0.07
SOC stocks15–300.26 *0.32 *0.12−0.110.07−0.160.27 *0.080.2−0.04−0.020.03
SOC stocks30–600.240.32 *0.11−0.080.12−0.140.170.050.11−0.050.040.01
SOC stocks60–1000.230.30 *0.04−0.060.17−0.120.06−0.080.05−0.060.070.01
Note: * p < 0.05 and ** p < 0.01.
Table 3. Performance comparison of RF models for 2015 SOC stock prediction.
Depth (cm)MAERMSER2LCCC
0–51.21 1.31 0.54 0.89
5–151.20 1.38 0.48 0.87
15–301.49 2.06 0.30 0.72
30–601.80 2.62 0.37 0.80
60–1002.76 4.06 0.36 0.83
Disclaimer/Publisher’s Note: The statements, opinions and data contained in all publications are solely those of the individual author(s) and contributor(s) and not of MDPI and/or the editor(s). MDPI and/or the editor(s) disclaim responsibility for any injury to people or property resulting from any ideas, methods, instructions or products referred to in the content.

