

Diversity and Micromorphology of Organic Matter in Riparian Forests on Carbonate-Rich Substrate (Switzerland)

Abstract
1. Introduction
2. Materials and Methods
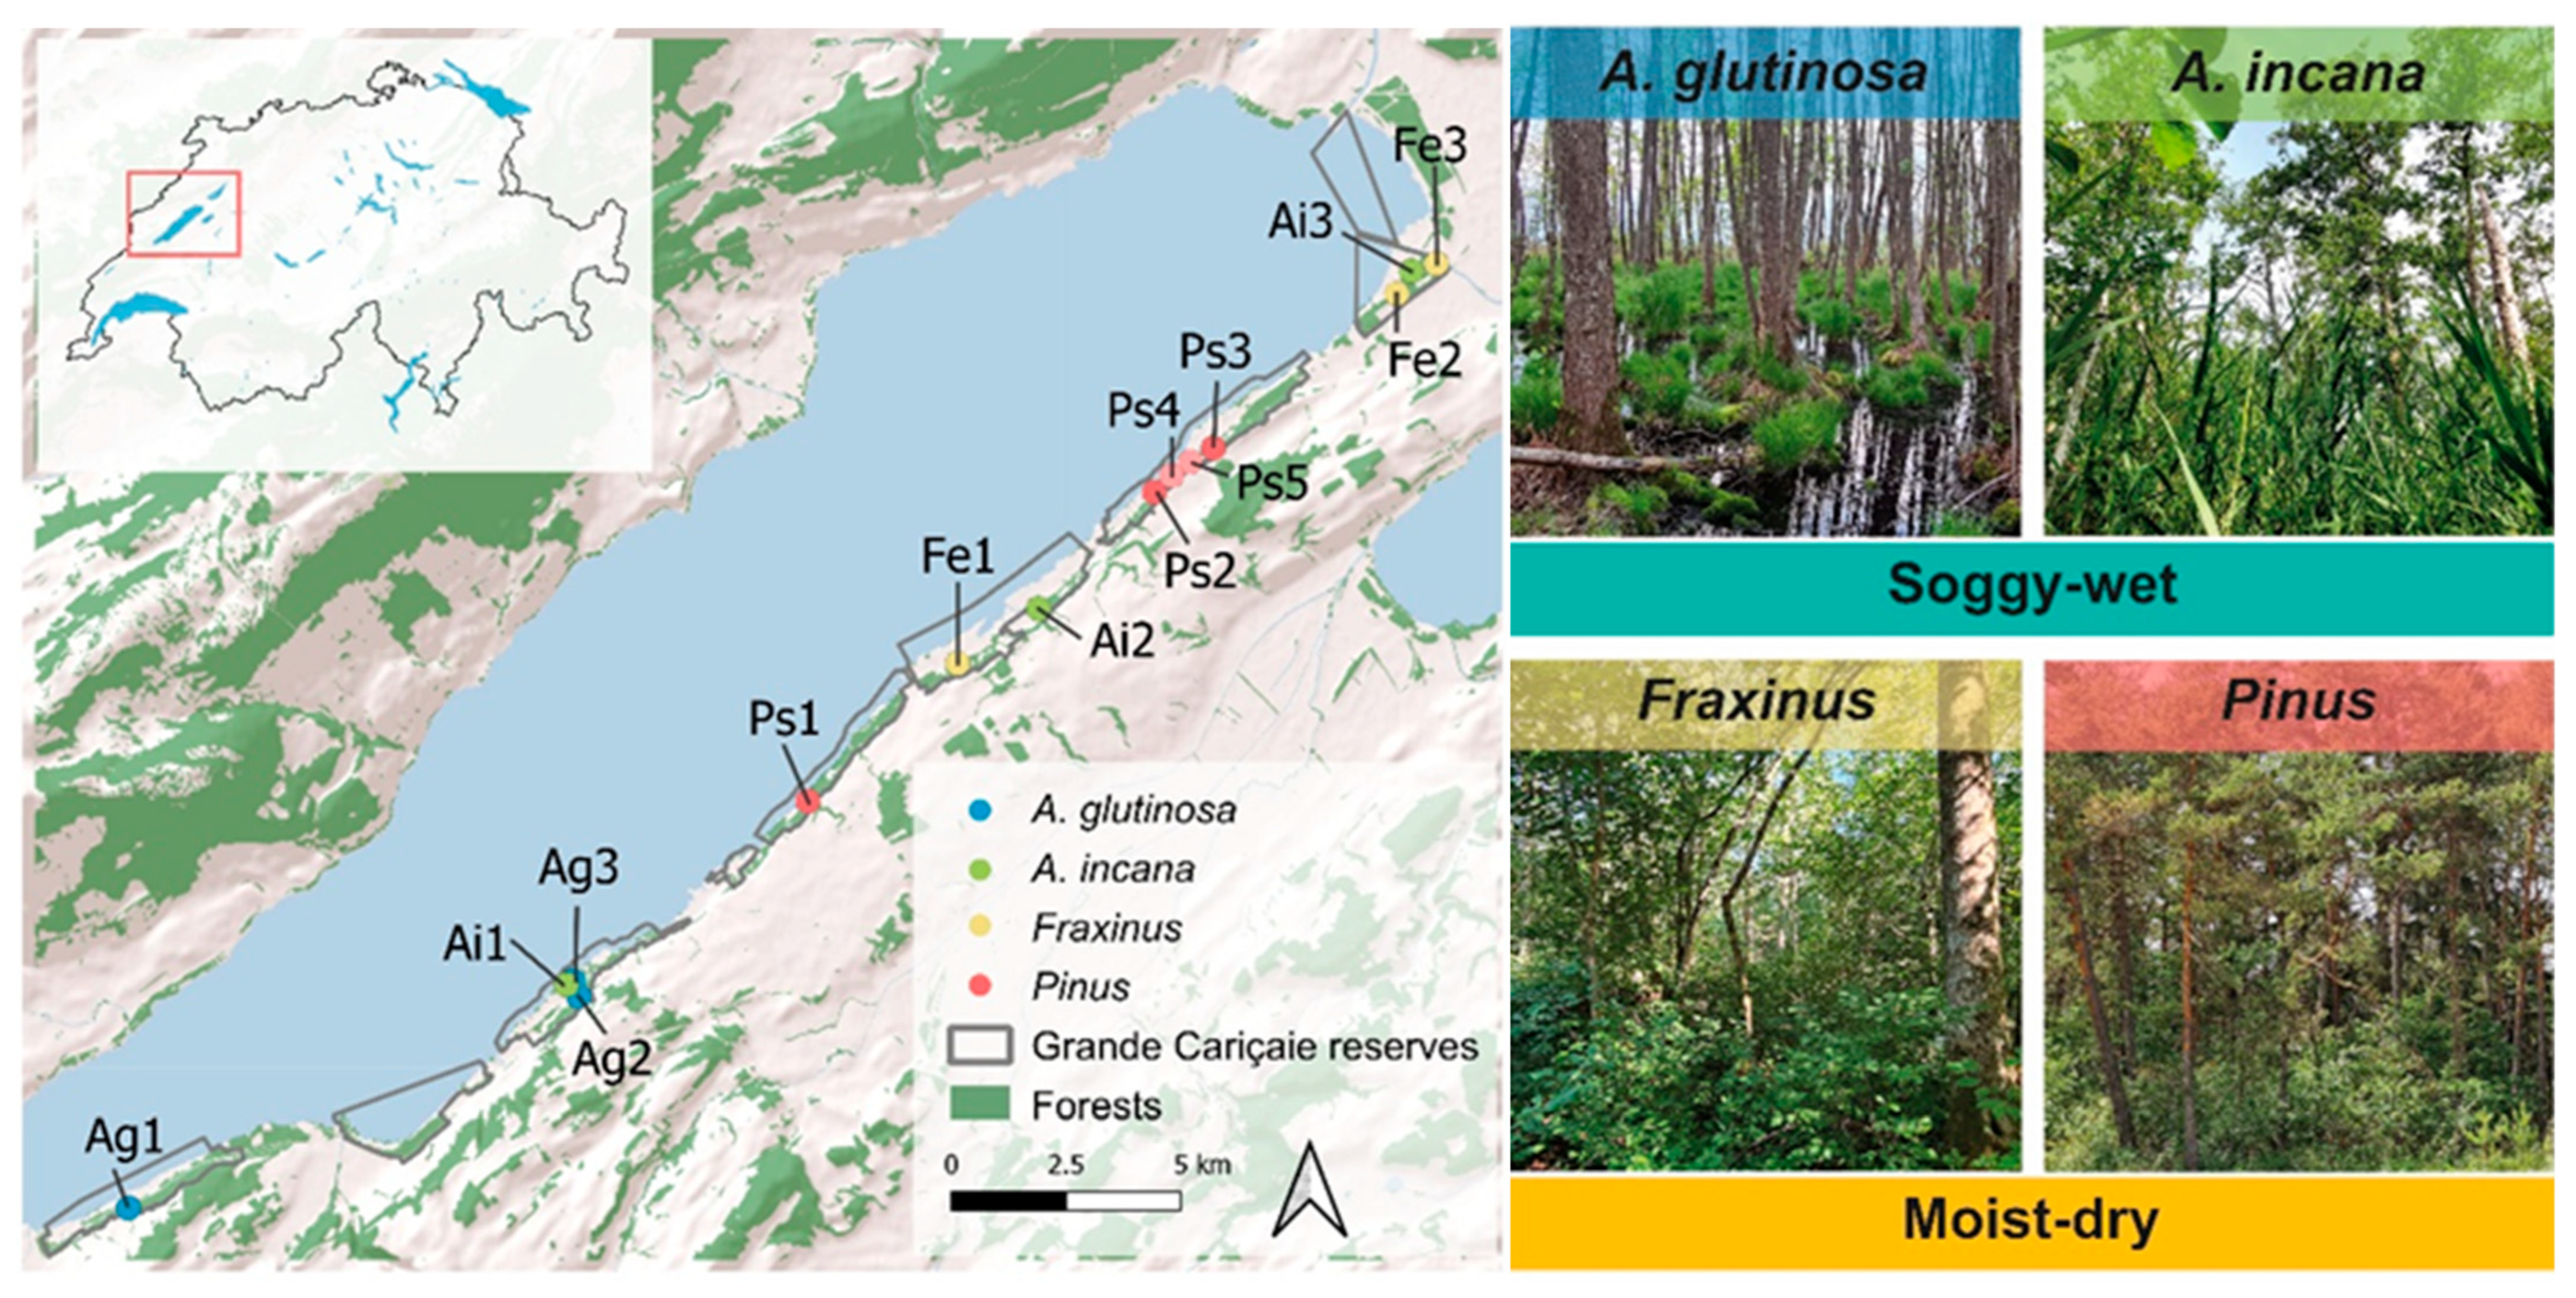
2.1. Study Site
2.2. Sampling Design, Forest Stand Conditions, and Soil Description
2.3. Physicochemical Analyses
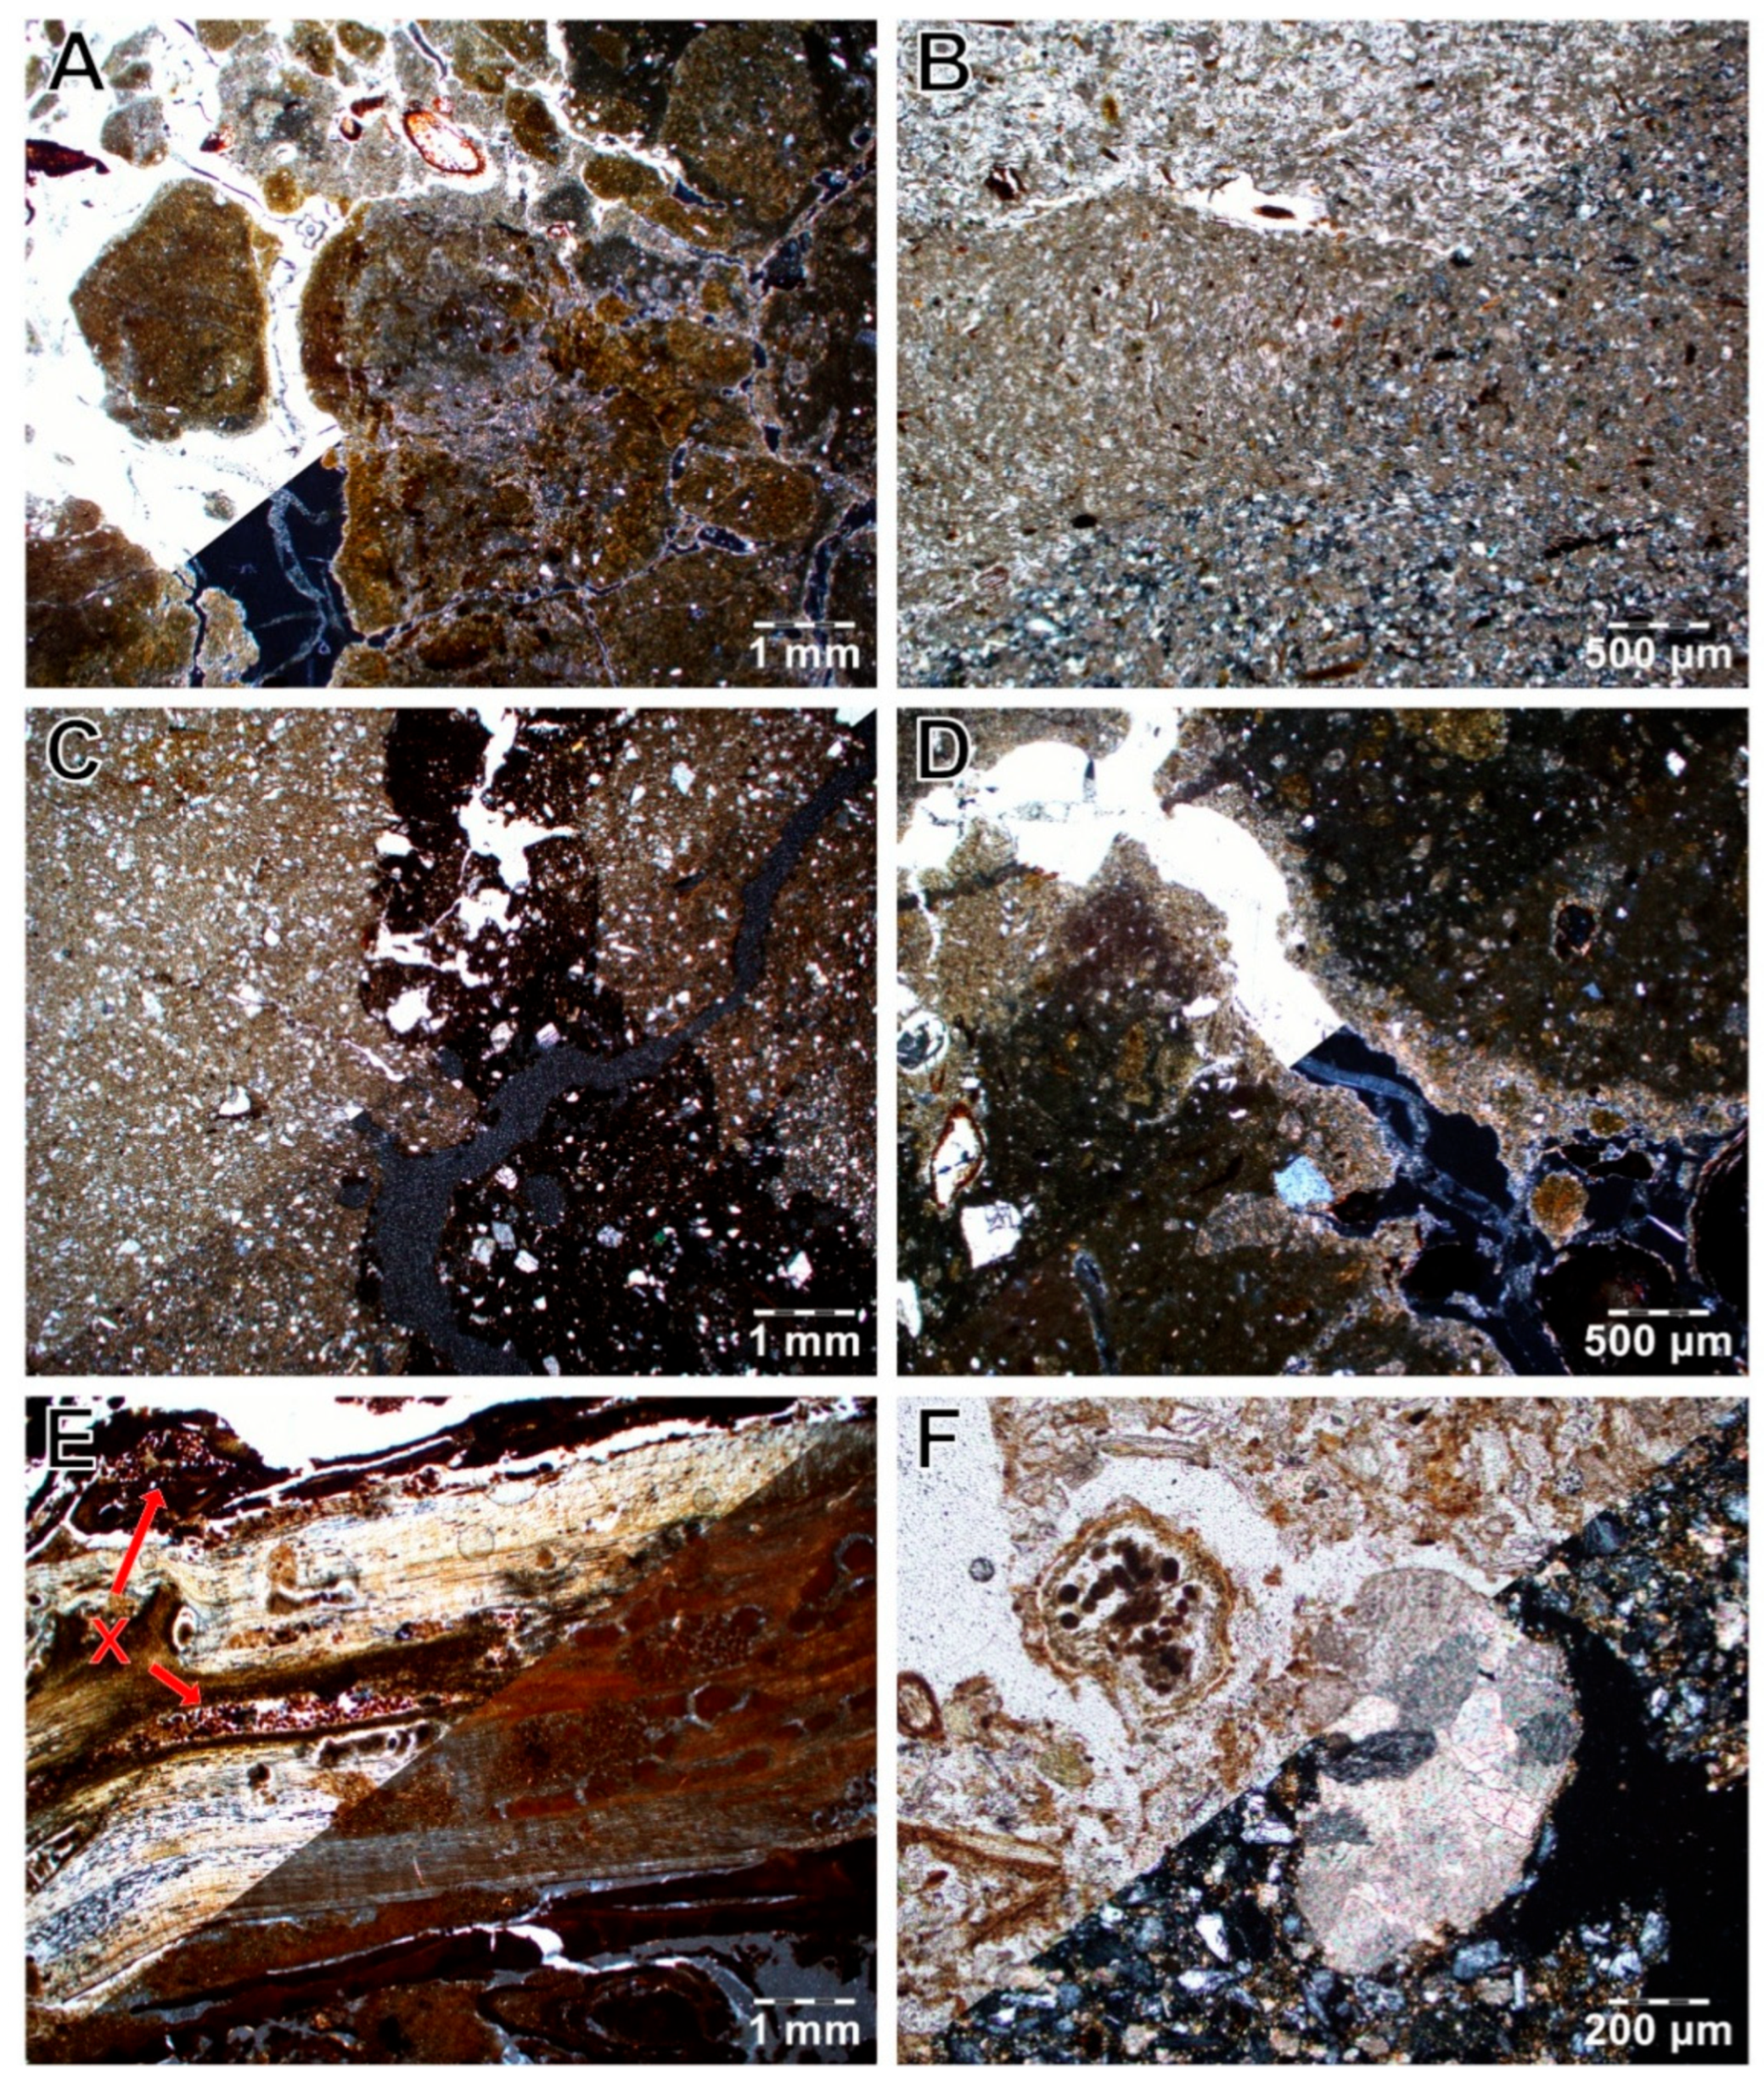
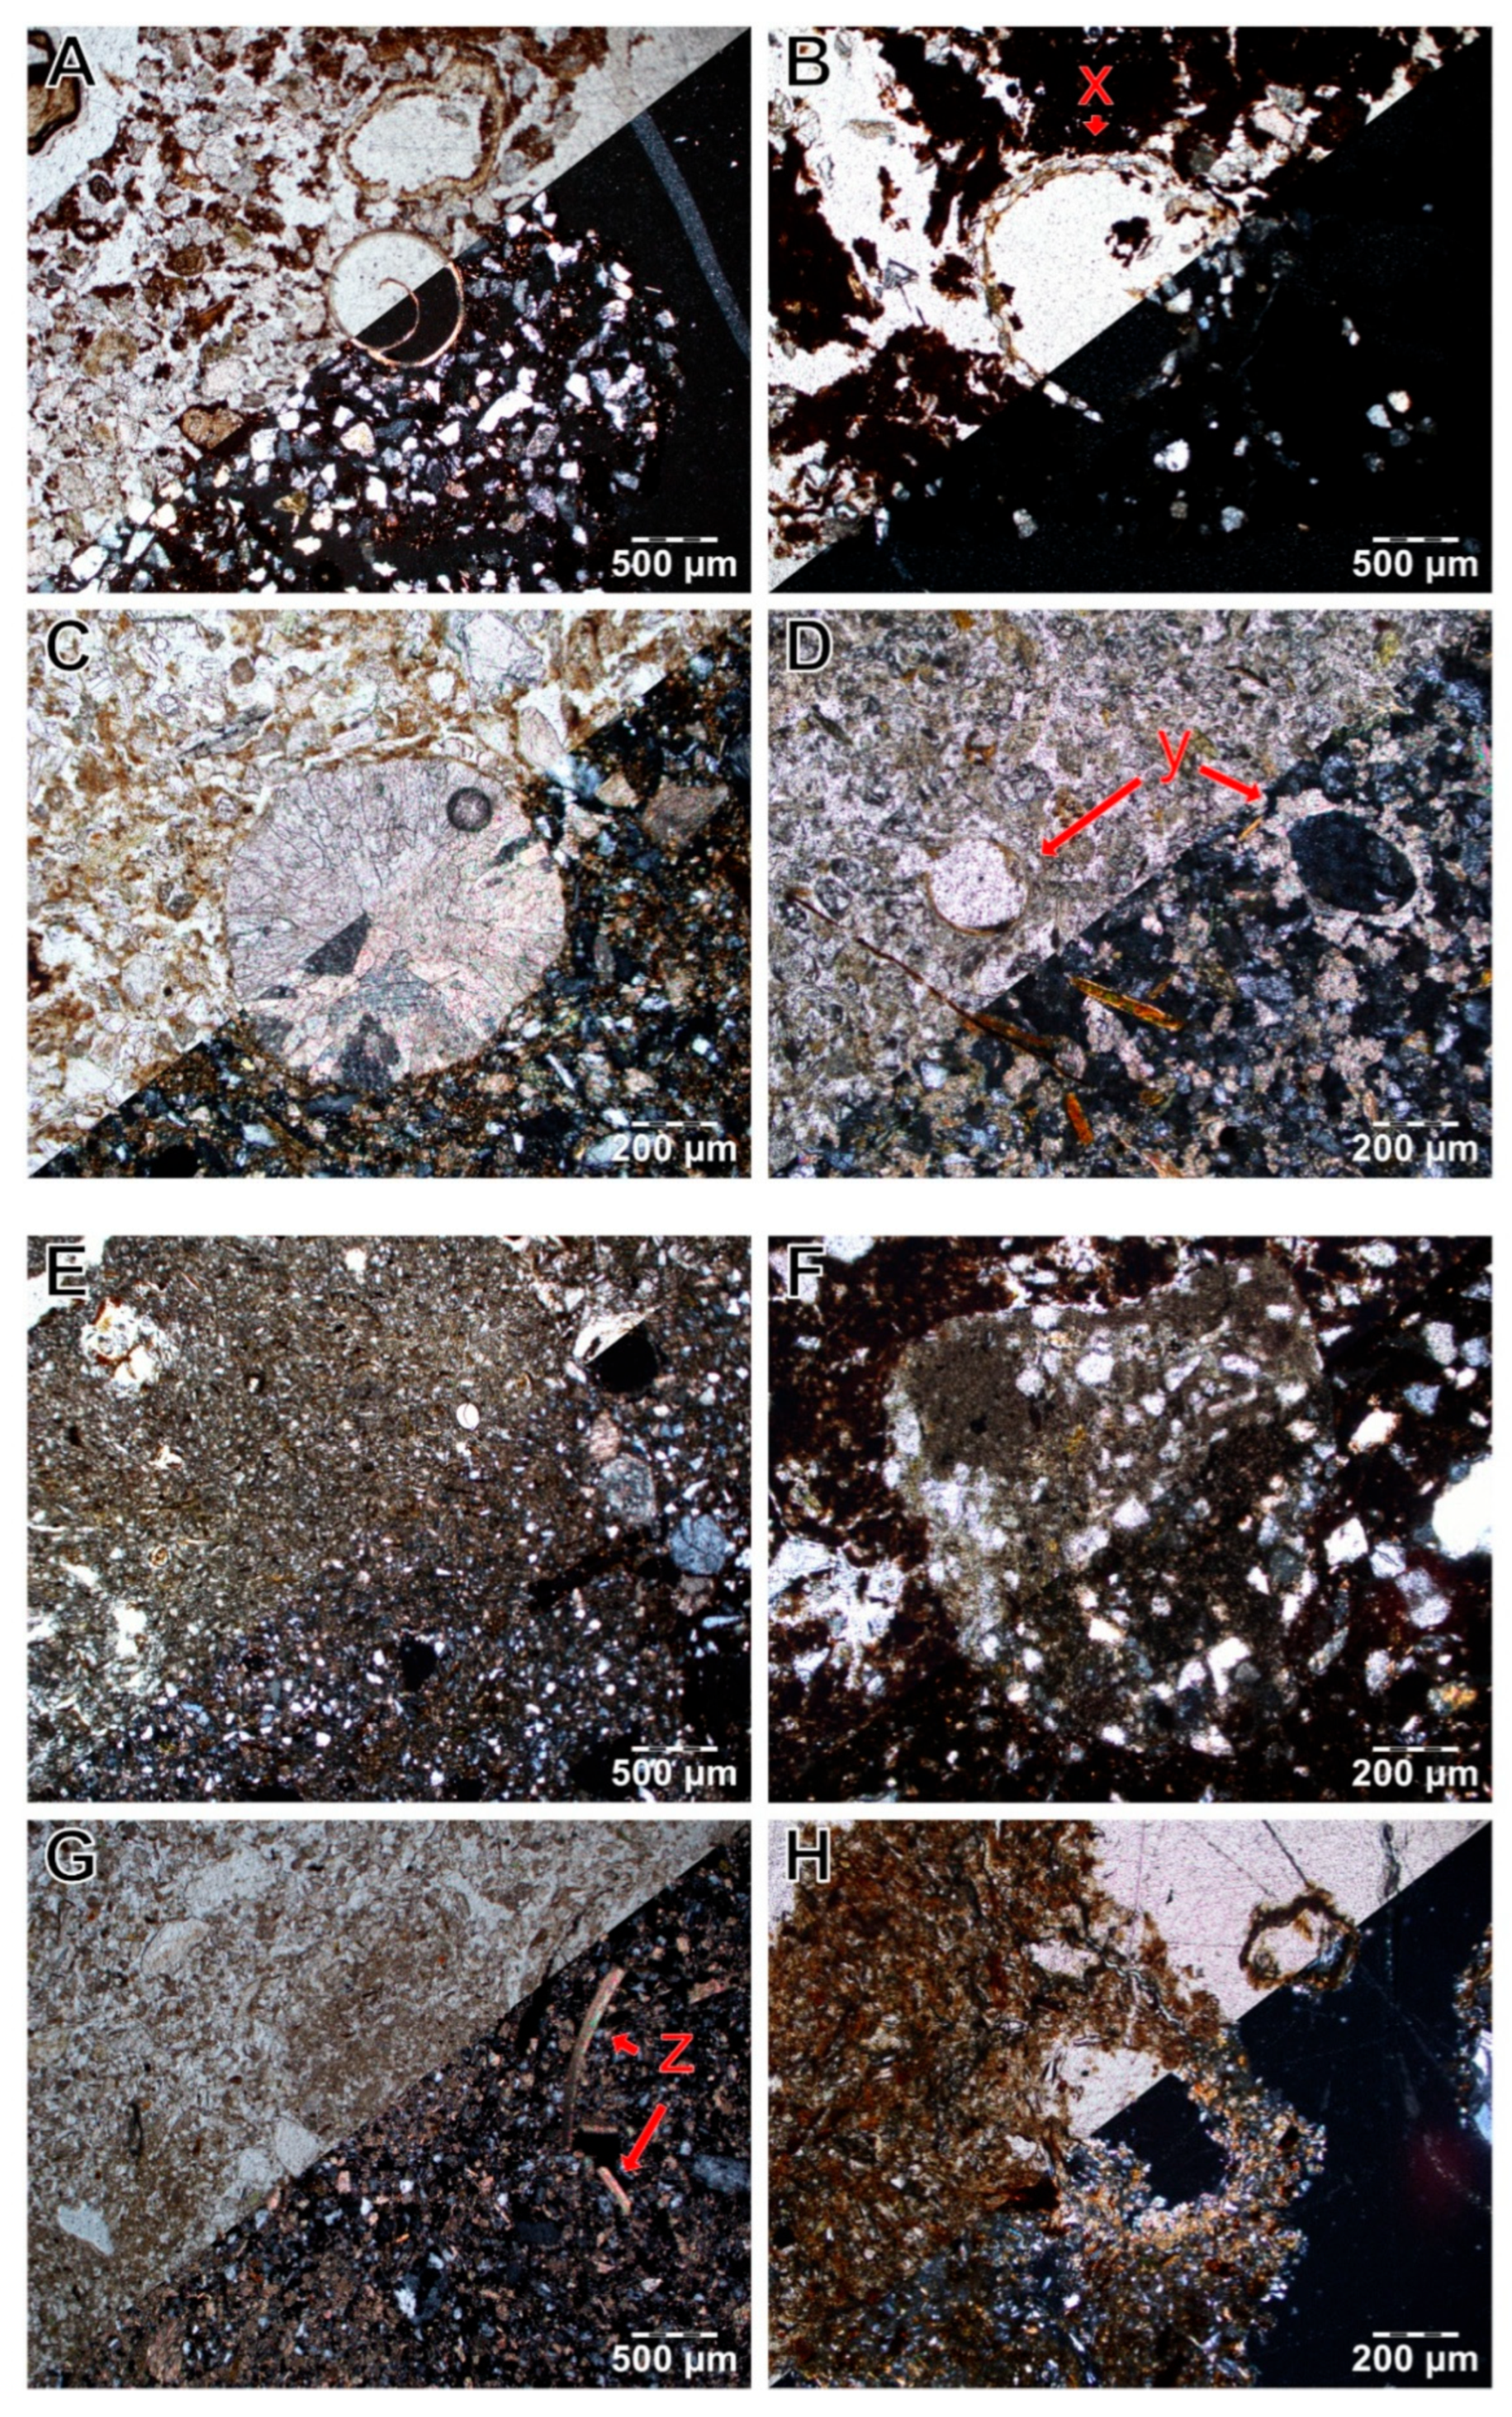
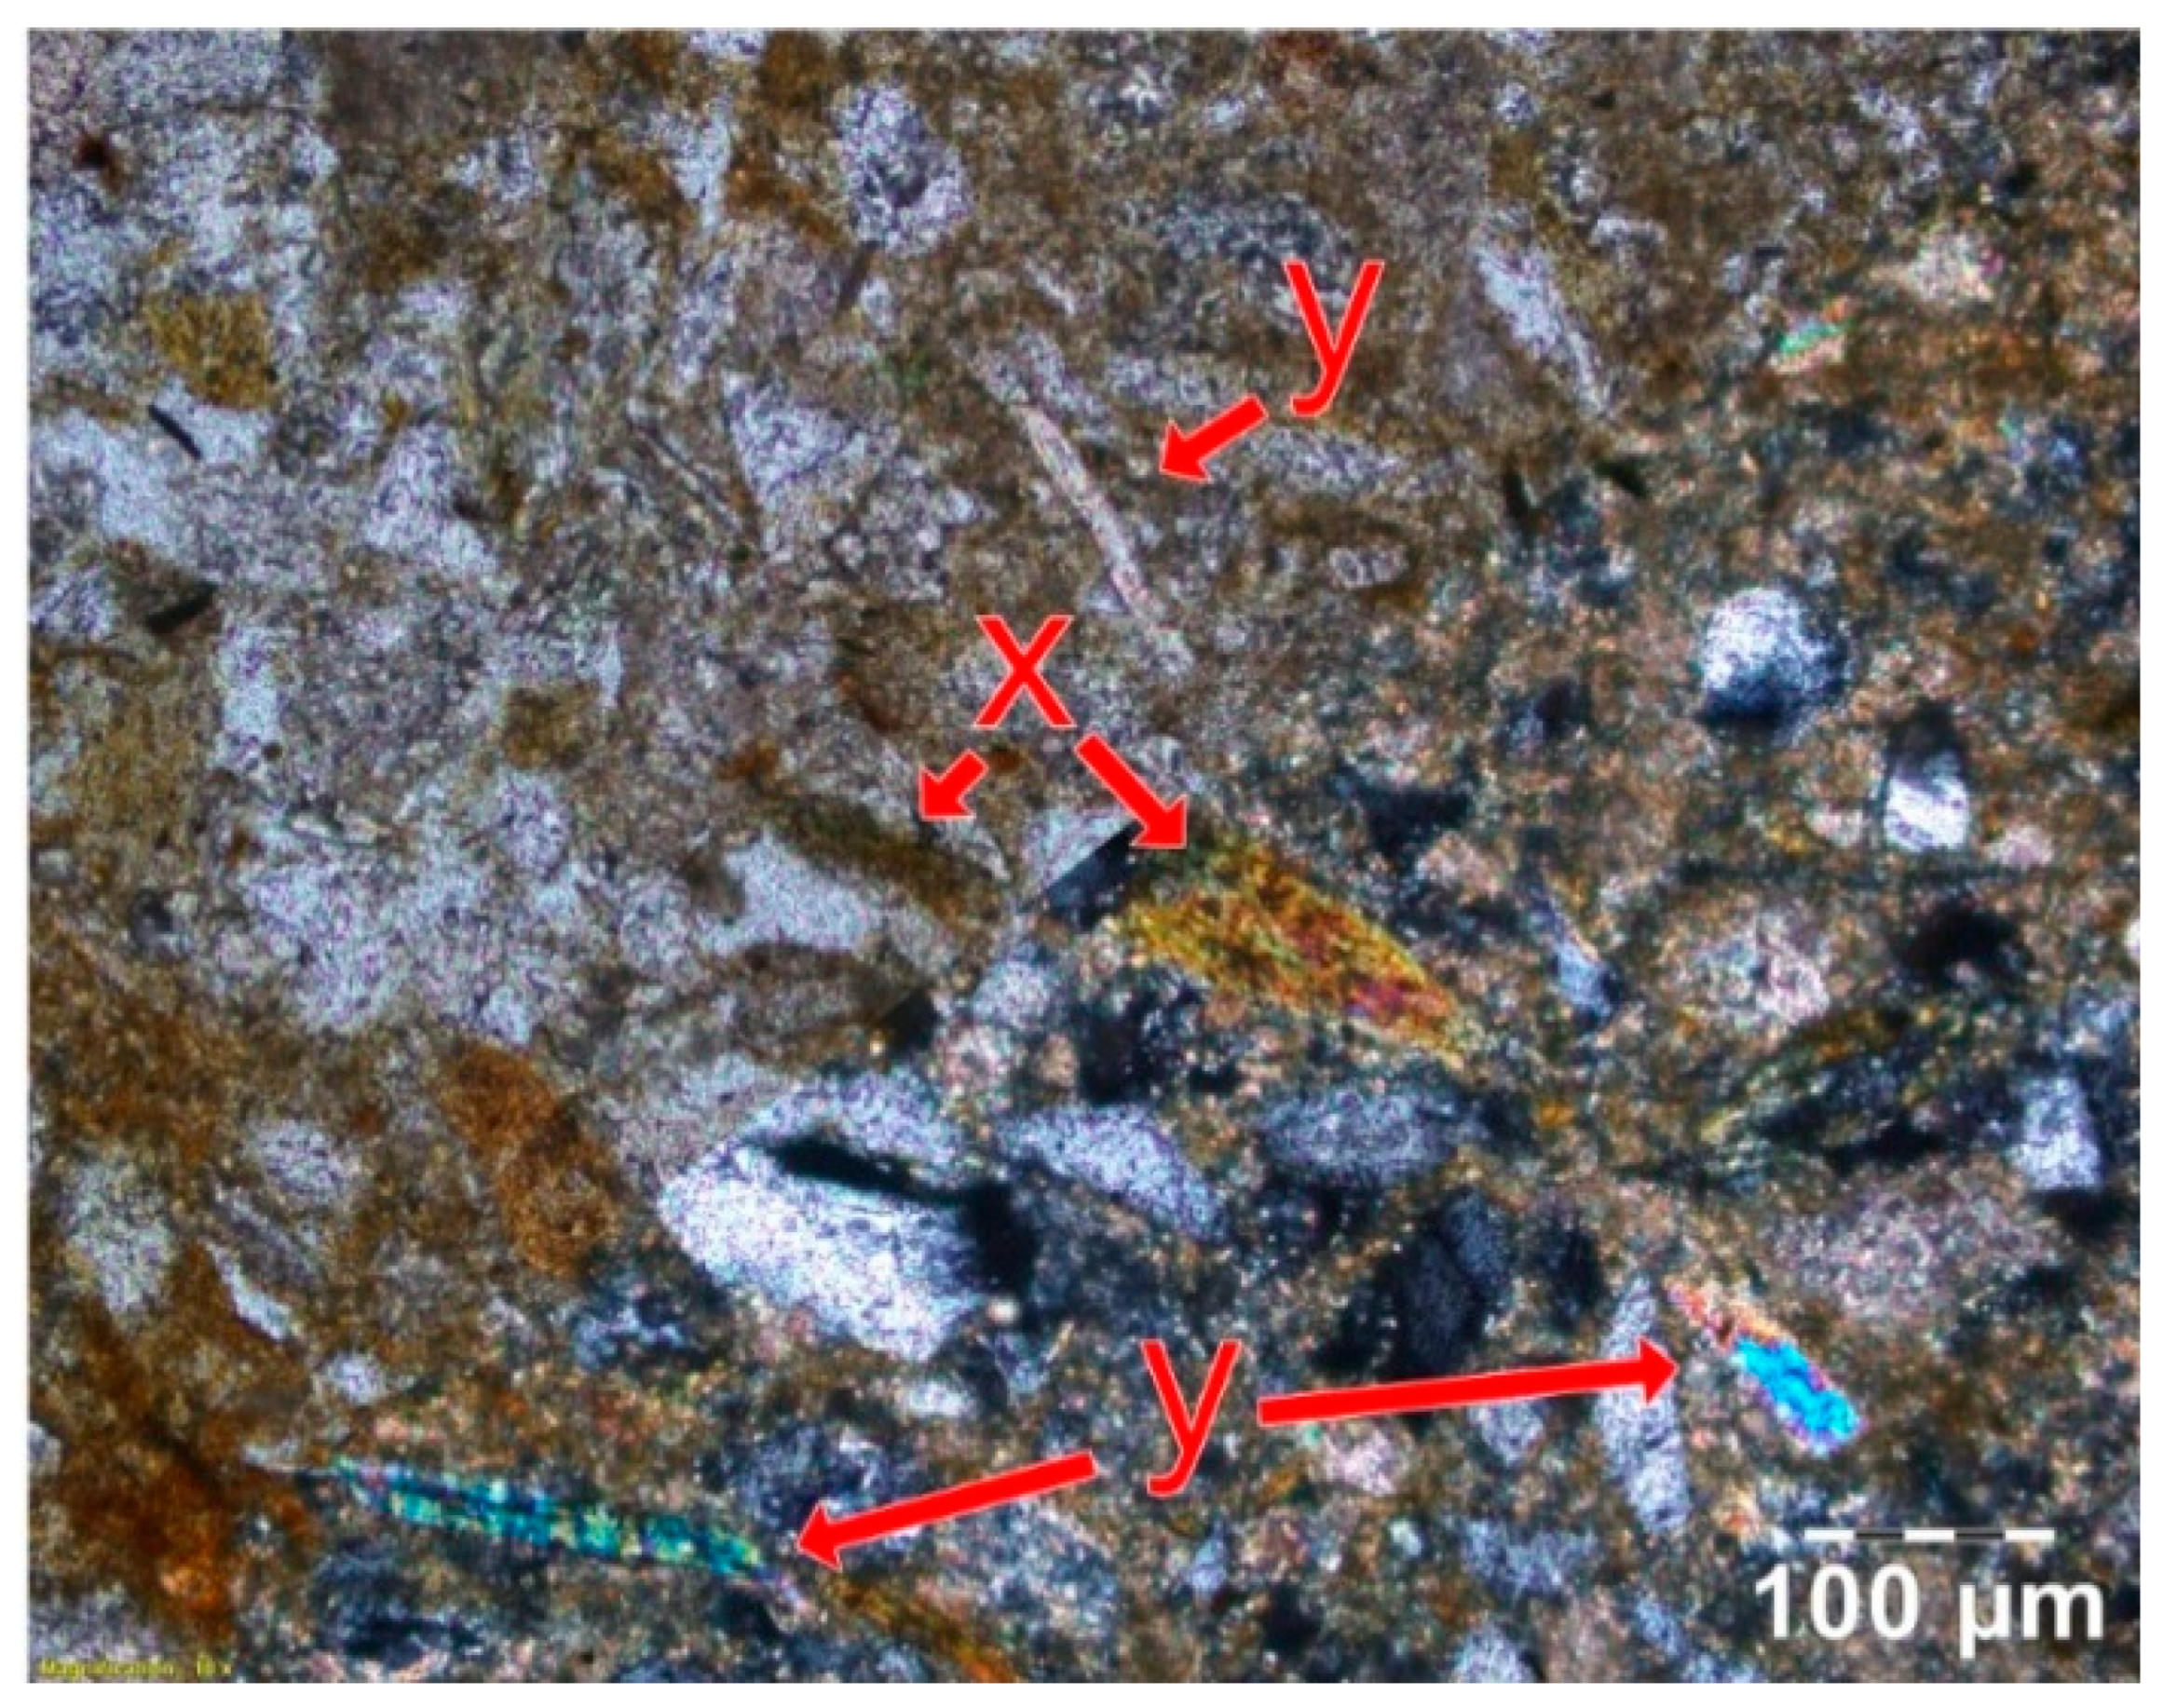
2.4. Soil Micromorphology
2.5. Data Processing
3. Results
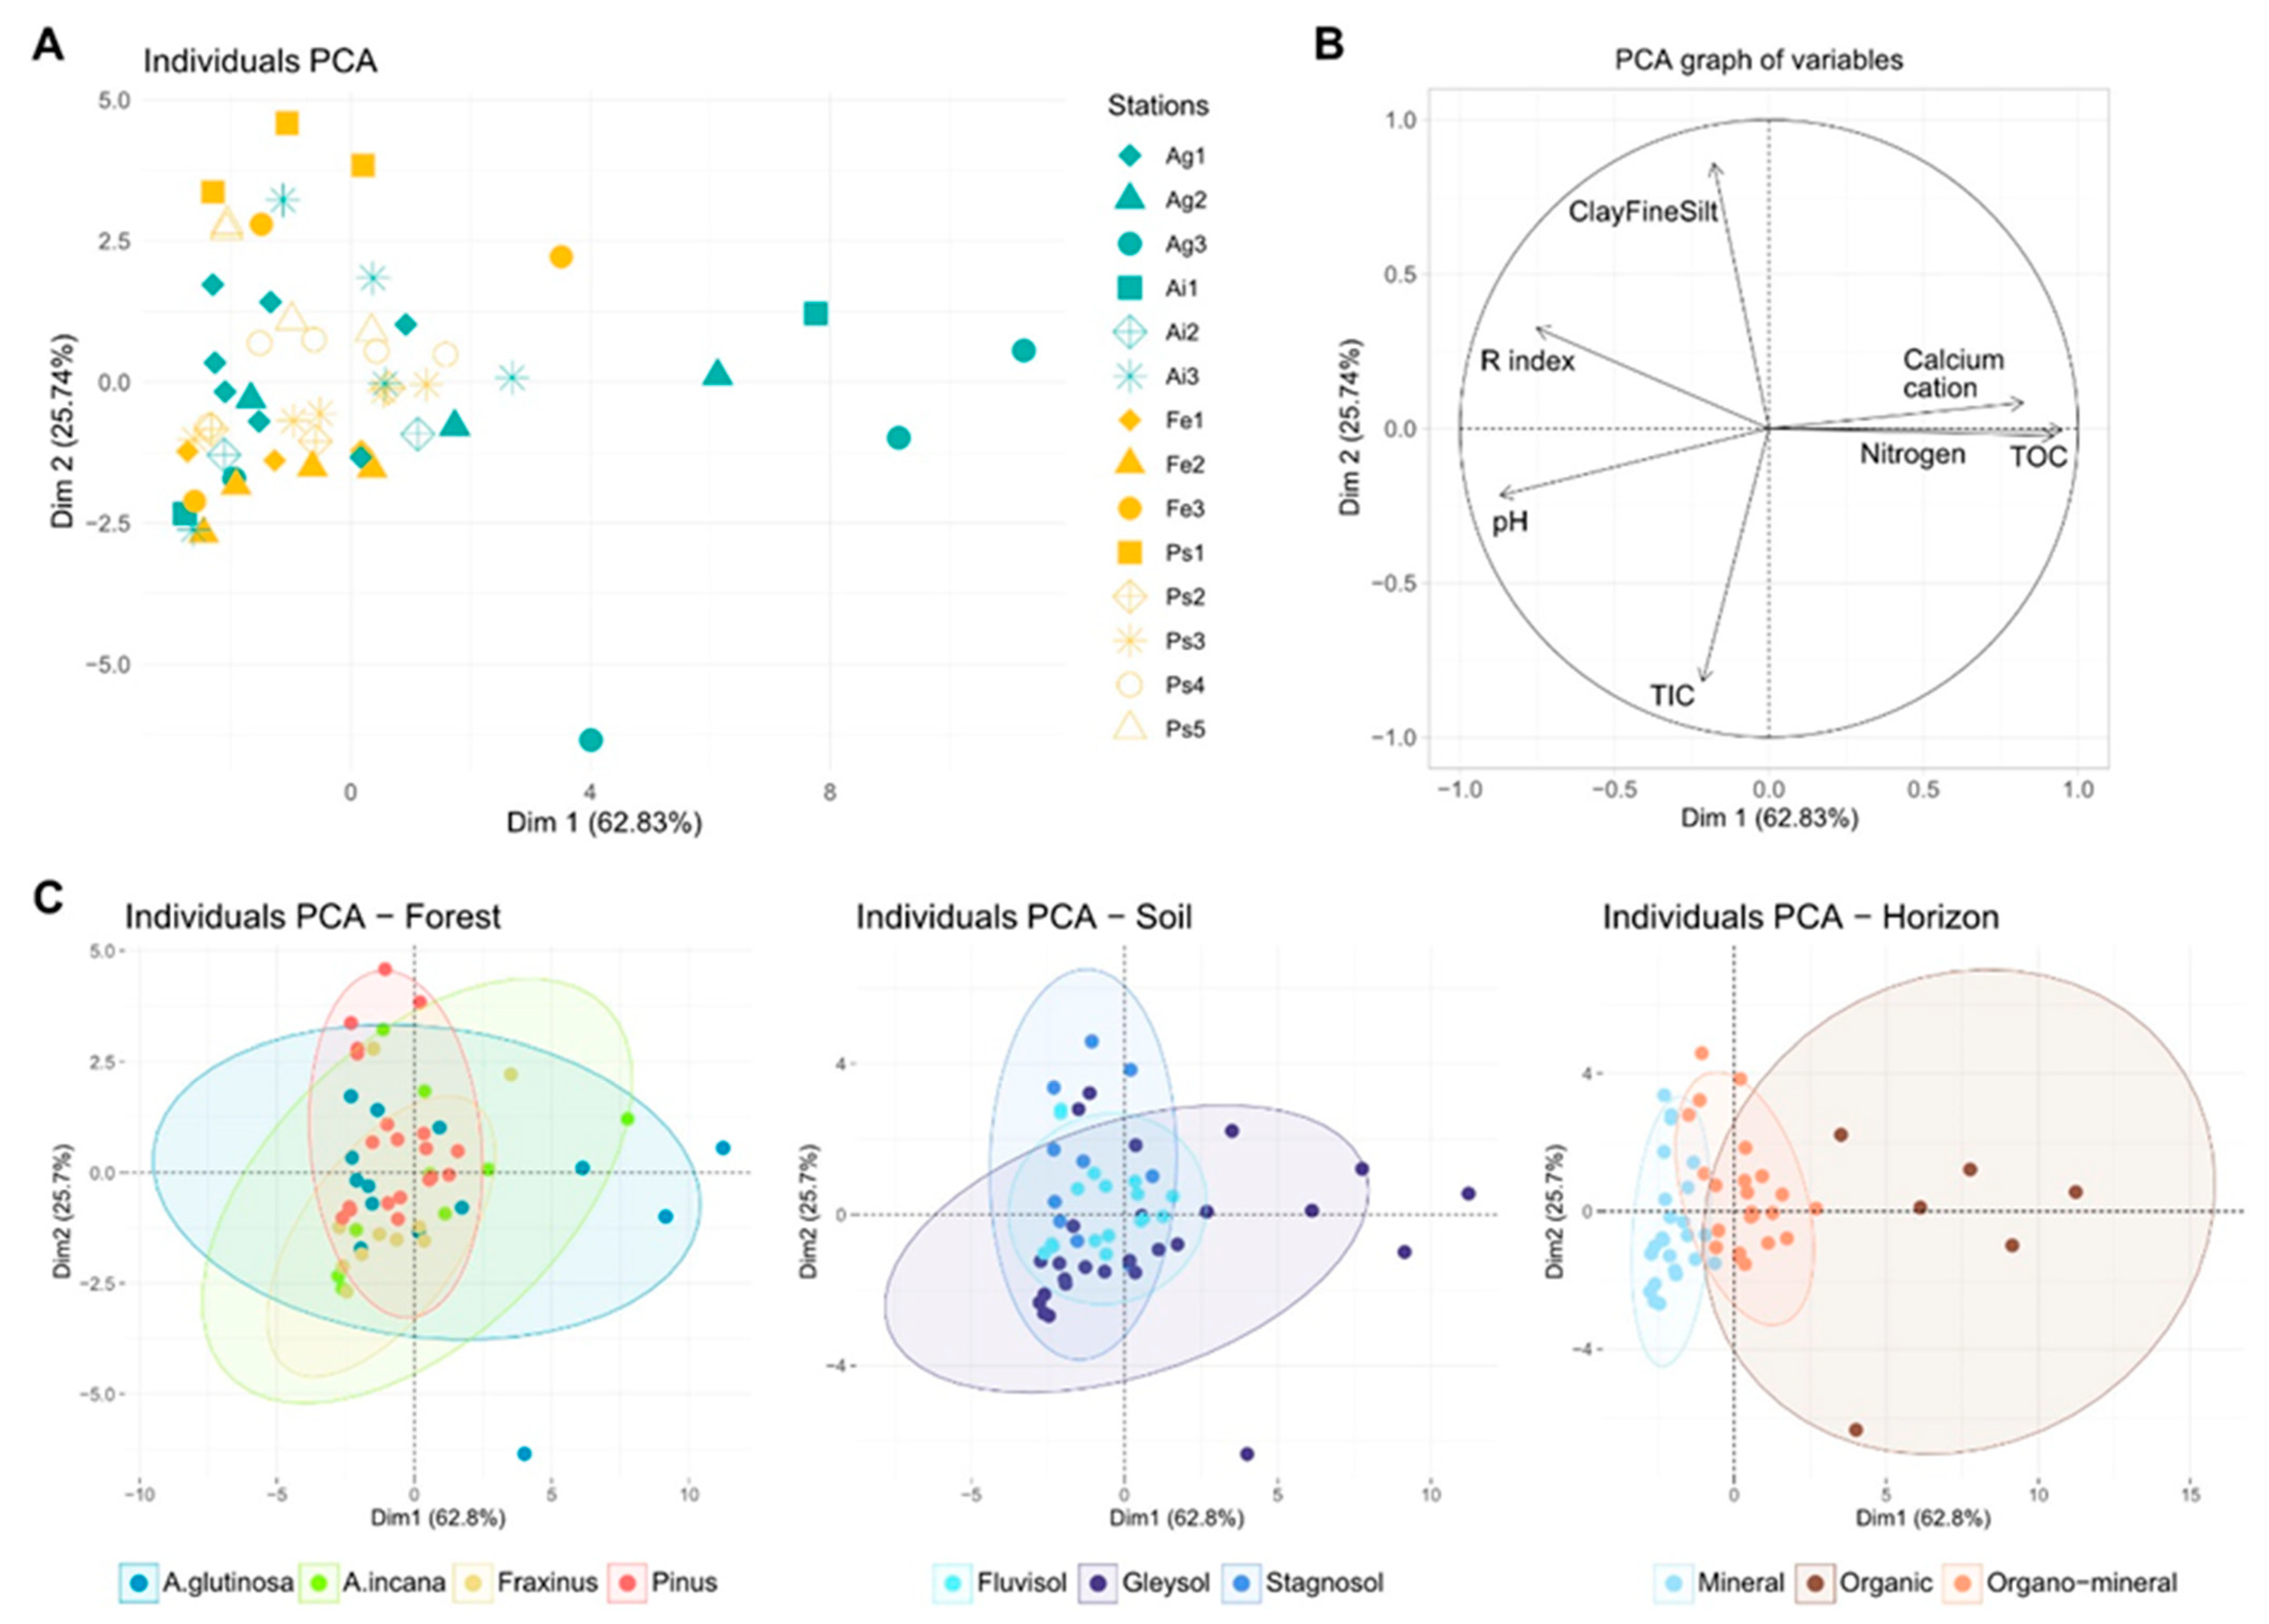
3.1. Soil Diversity
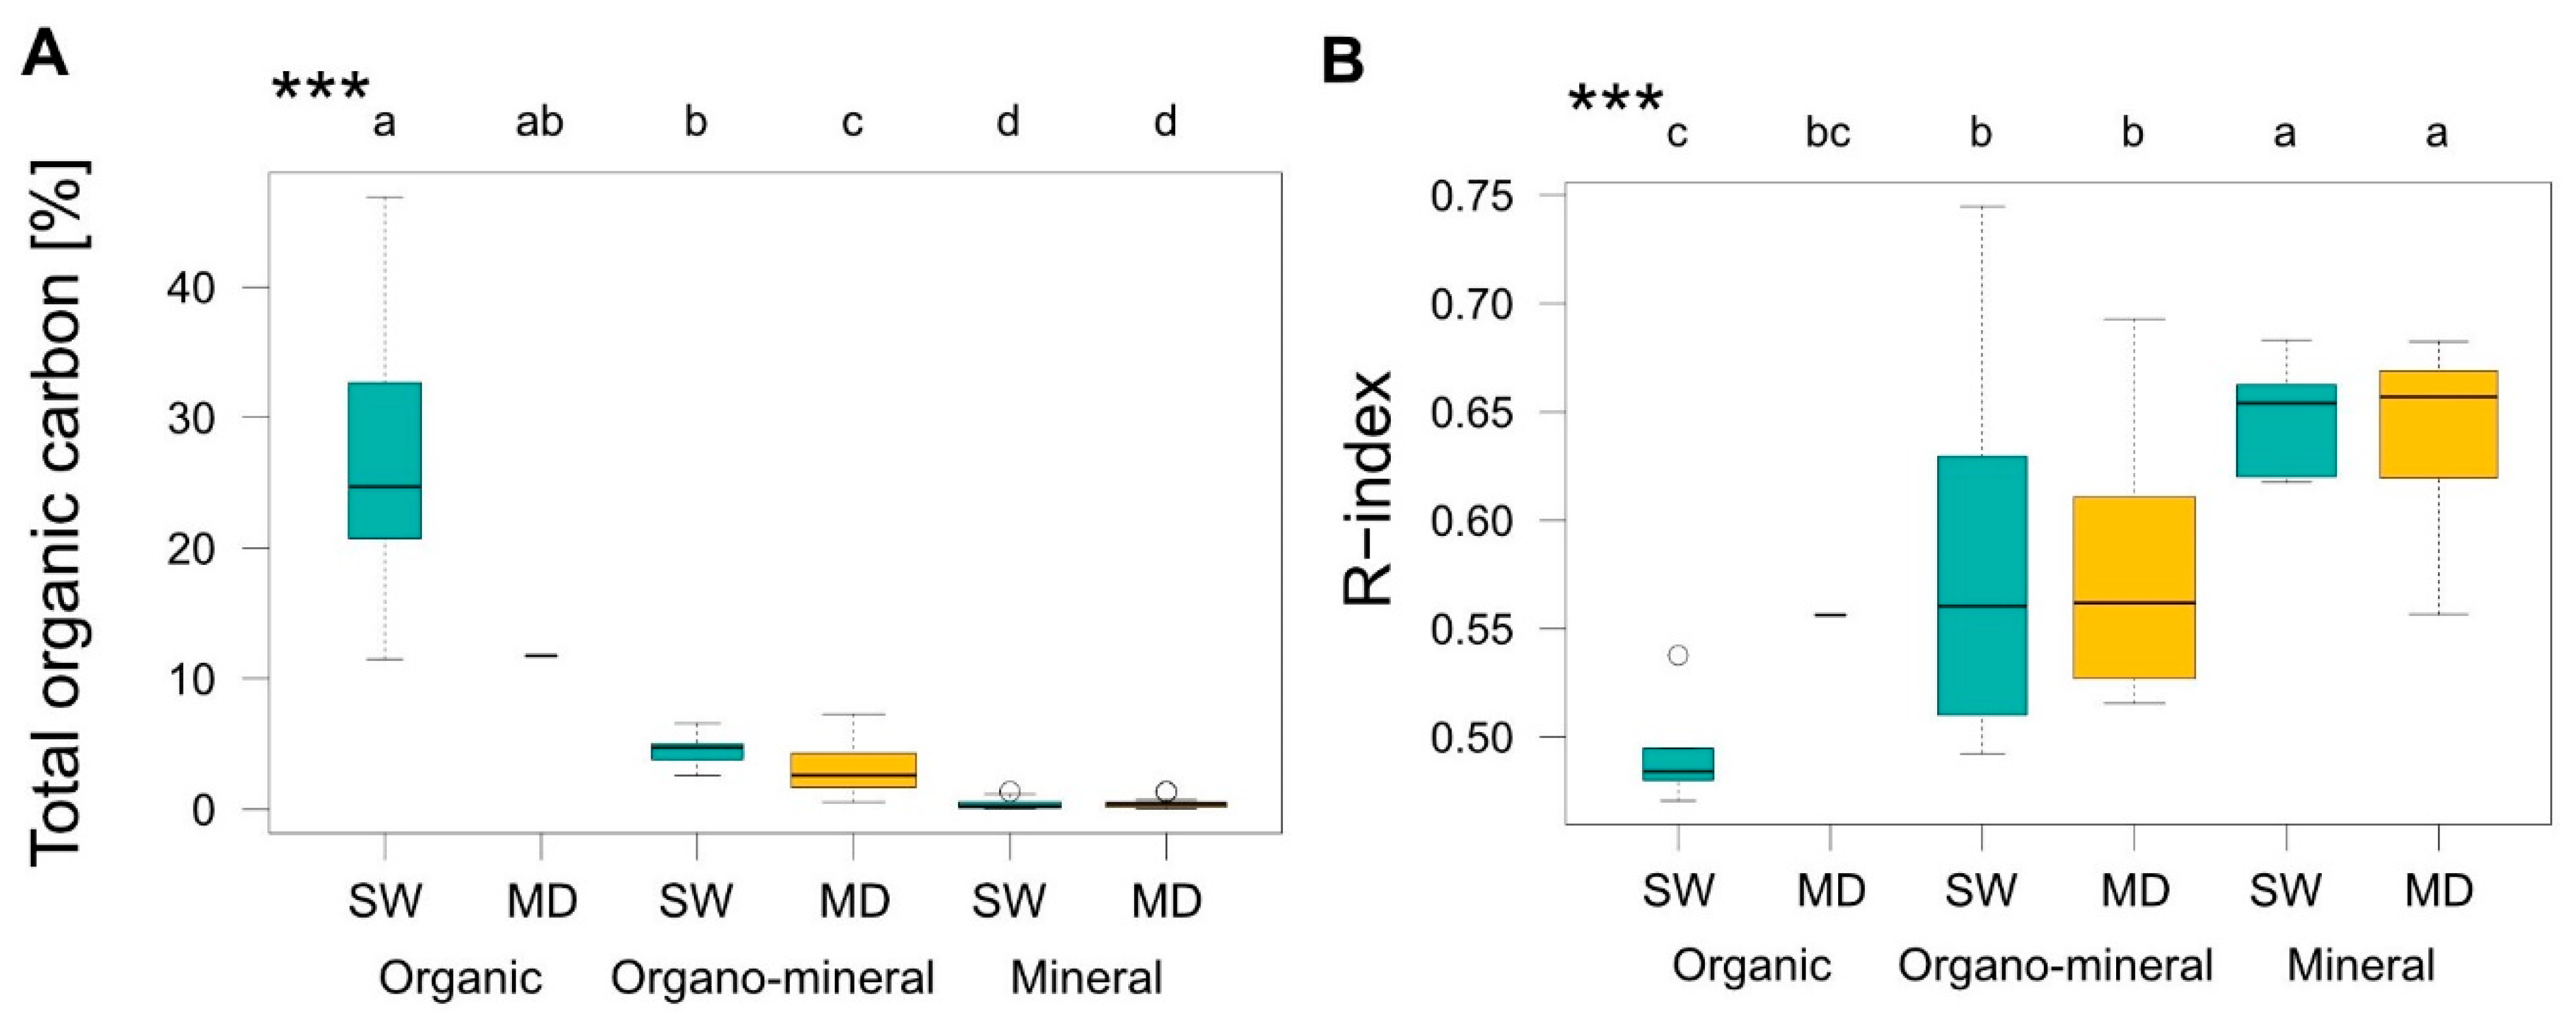
3.2. Soil Organic Matter
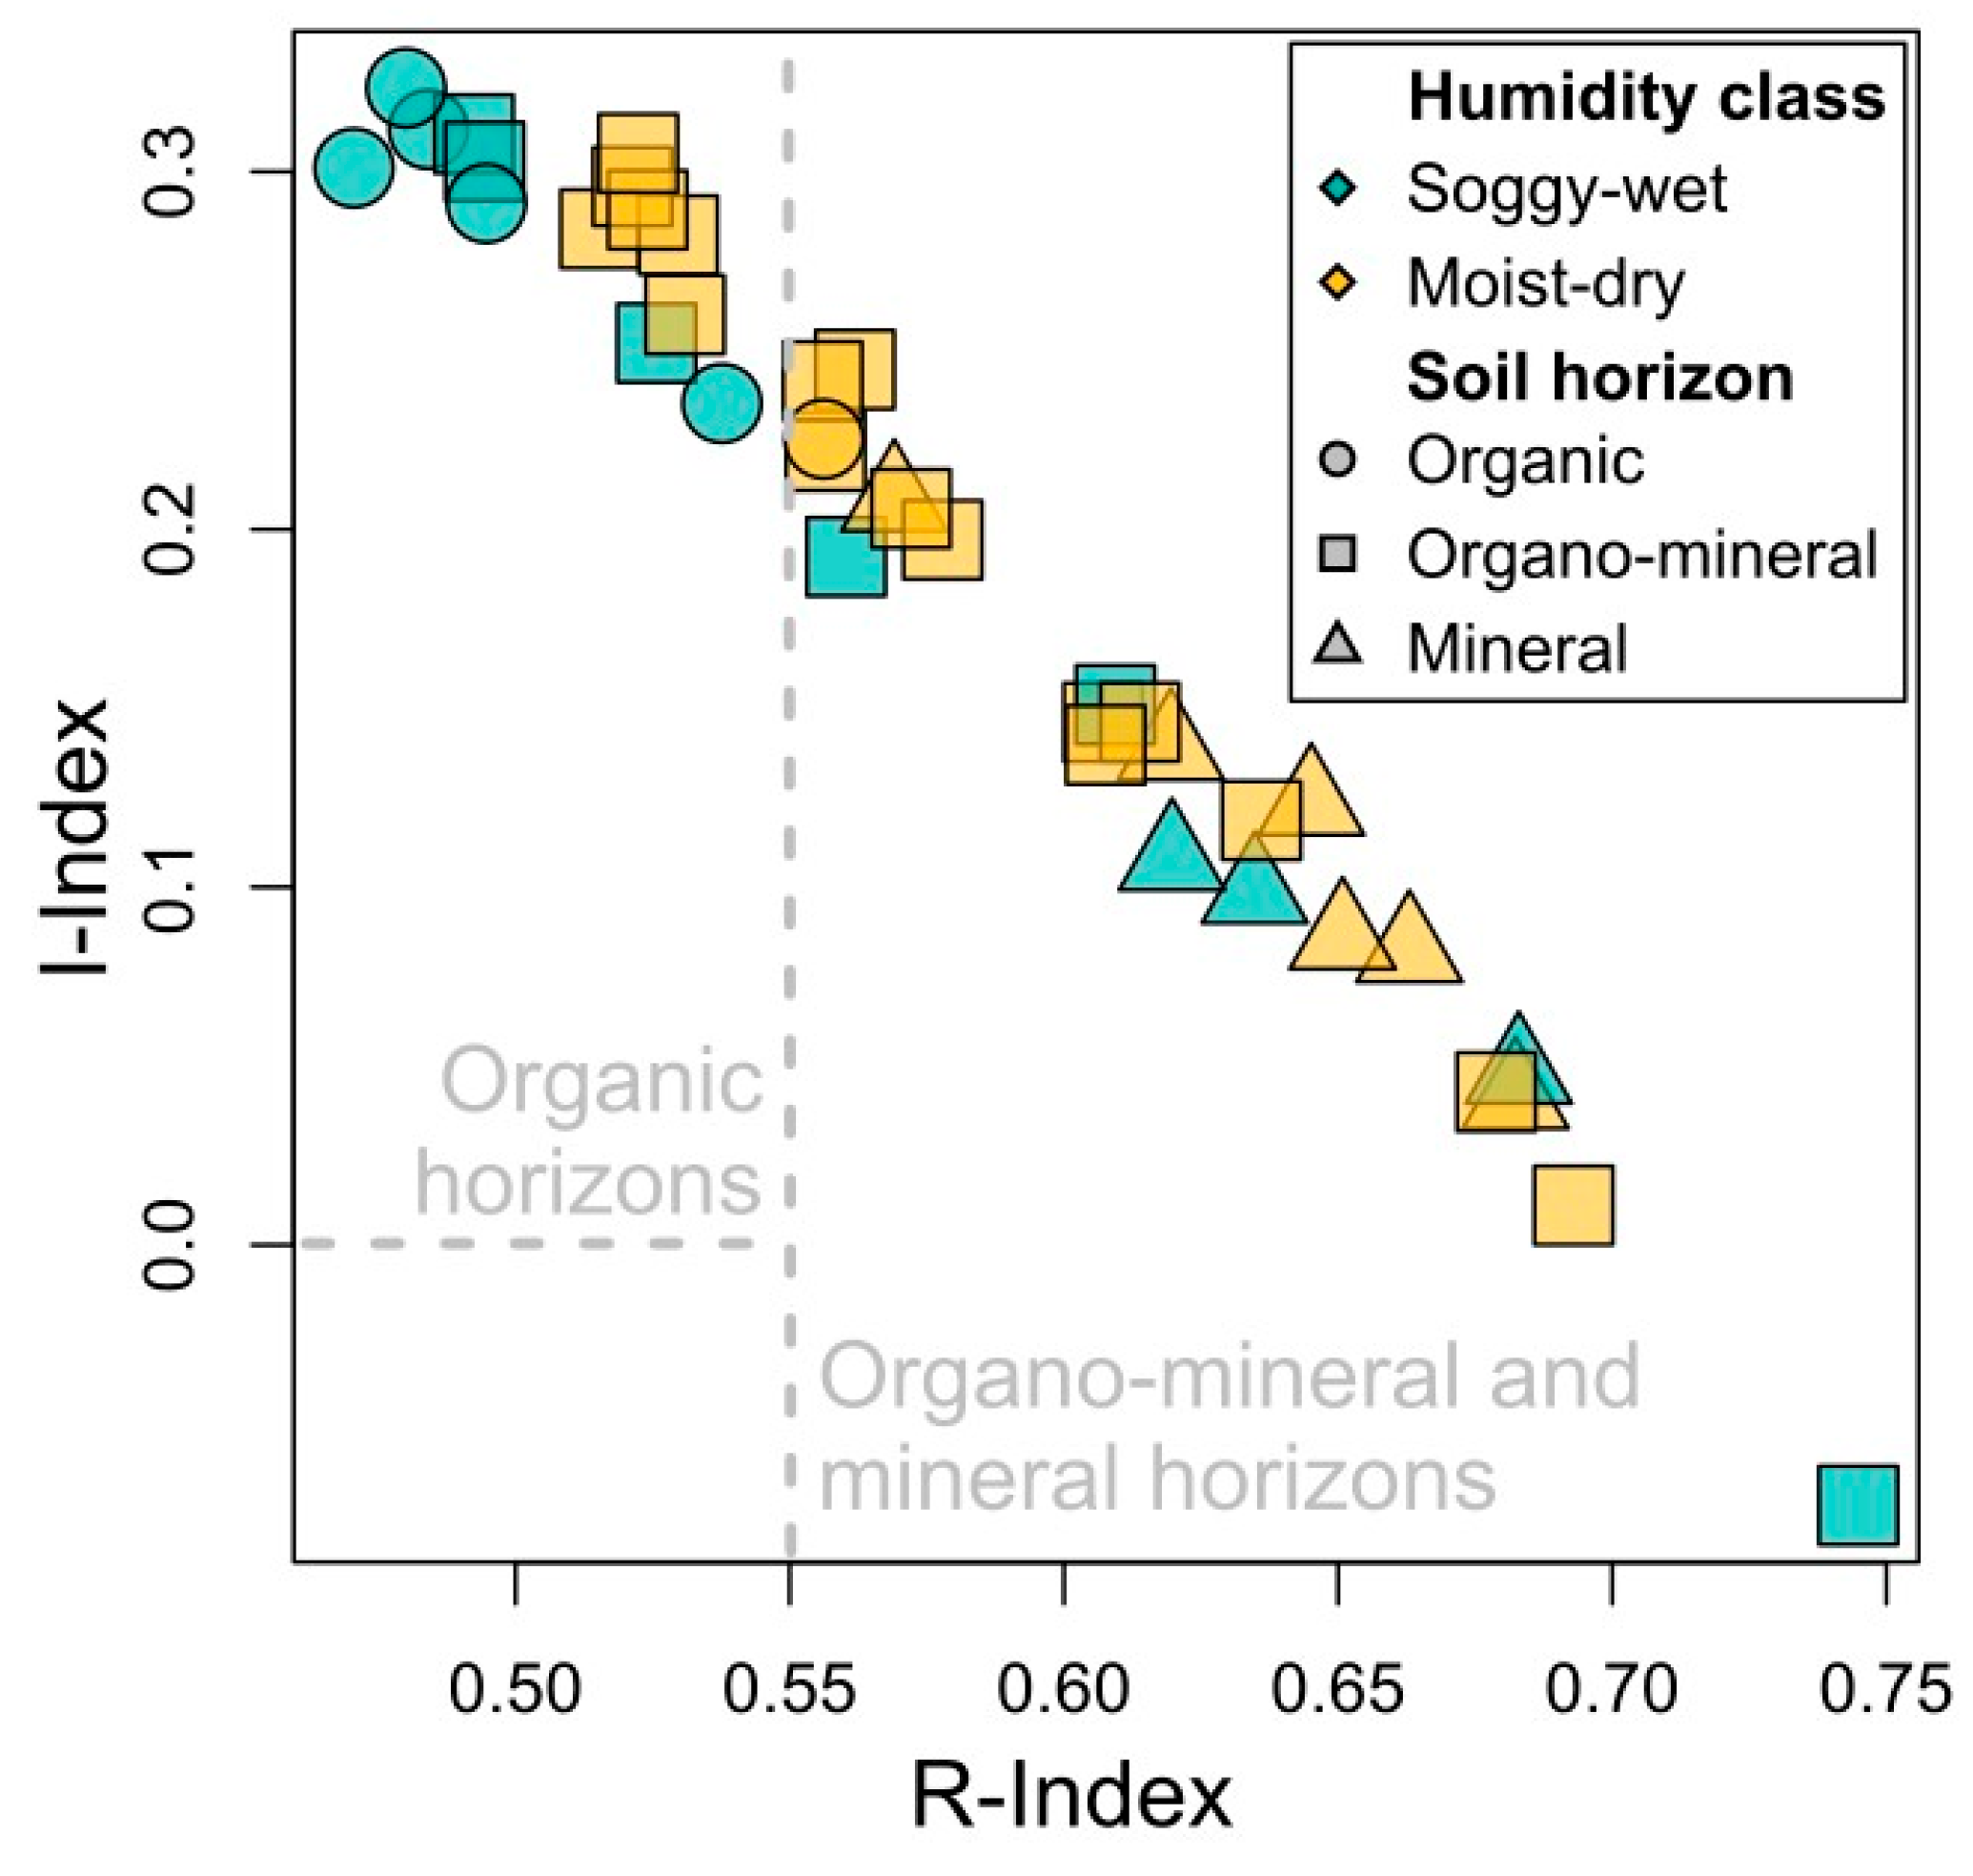
3.3. Integration of Organic Matter into the Soil
4. Discussion
4.1. Evolving Patterns of Soil Diversity
4.2. Organic Matter Accumulation
4.3. Organic Matter Integration
4.4. Organic Matter Stability
4.5. Importance of Time and Parental Material on Pedogenesis
4.6. Study Limitations
5. Conclusions
Supplementary Materials
Author Contributions
Funding
Data Availability Statement
Acknowledgments
Conflicts of Interest
References
- Mitsch, W.J.; Bernal, B.; Nahlik, A.M.; Mander, Ü.; Zhang, L.; Anderson, C.J.; Jørgensen, S.E.; Brix, H. Wetlands, carbon, and climate change. Landsc. Ecol. 2013, 28, 583–597. [Google Scholar] [CrossRef]
- Gallagher, J.B.; Zhang, K.; Chuan, C.H. A Re-evaluation of Wetland Carbon Sink Mitigation Concepts and Measurements: A Diagenetic Solution. Wetlands 2022, 42, 23. [Google Scholar] [CrossRef]
- Mitsch, W.J.; Gosselink, J.G. Wetlands, 5th ed.; Wiley: Hoboken, NJ, USA, 2015. [Google Scholar]
- Zhang, D.; Hui, D.; Luo, Y.; Zhou, G. Rates of litter decomposition in terrestrial ecosystems: Global patterns and controlling factors. J. Plant Ecol. 2008, 1, 85–93. [Google Scholar] [CrossRef]
- Wang, J.; Bai, J.; Zhao, Q.; Lu, Q.; Xia, Z. Five-year changes in soil organic carbon and total nitrogen in coastal wetlands affected by flow-sediment regulation in a Chinese delta. Sci. Rep. 2016, 6, 21137. [Google Scholar] [CrossRef] [PubMed]
- Nakamura, F. Green Infrastructure and Climate Change Adaptation: Function, Implementation and Governance; Springer Nature: Singapore, 2022; p. 506. [Google Scholar]
- Riis, T.; Kelly-Quinn, M.; Aguiar, F.C.; Manolaki, P.; Bruno, D.; Bejarano, M.D.; Clerici, N.; Fernandes, M.R.; Franco, J.; Pettit, N.; et al. Global overview of ecosystem services provided by riparian vegetation. BioScience 2020, 70, 501–514. [Google Scholar] [CrossRef]
- Siegfried, L.; Beuvier, S.; Vittoz, P. Decadal riparian forest evolution beside a regulated lake: A case study in the Swiss lowlands. Folia Geobotanica 2024, 59, 111–128. [Google Scholar] [CrossRef]
- Grillakis, M.G. Increase in severe and extreme soil moisture droughts for Europe under climate change. Sci. Total Environ. 2019, 660, 1245–1255. [Google Scholar] [CrossRef] [PubMed]
- Ballut-Dajud, G.A.; Sandoval Herazo, L.C.; Fernández-Lambert, G.; Marín-Muñiz, J.L.; López Méndez, M.C.; Betanzo-Torres, E.A. Factors affecting wetland loss: A review. Land 2022, 11, 434. [Google Scholar] [CrossRef]
- Finlayson, C.; Everard, M.; Irvine, K.; McInnes, R.J.; Middleton, B.A.; van Dam, A.; Davidson, N. The Wetland Book I: Structure and Function, Management and Methods; Springer: Dordrecht, The Netherlands, 2018. [Google Scholar]
- Samaritani, E.; Shrestha, J.; Fournier, B.; Frossard, E.; Gillet, F.; Guenat, C.; Niklaus, P.A.; Pasquale, N.; Tockner, A.; Mitchell, E.A.D.; et al. Heterogeneity of soil carbon pools and fluxes in a channelized and a restored floodplain section (Thur River, Switzerland). Hydrol. Earth Syst. Sci. 2011, 15, 1757–1769. [Google Scholar] [CrossRef]
- Hill, A.R.; Cardaci, M. Denitrification and organic carbon availability in riparian wetland soils and subsurface sediments. Soil Sci. Soc. Am. J. 2004, 68, 320–325. [Google Scholar] [CrossRef]
- Stockmann, U.; Adams, M.A.; Crawford, J.W.; Field, D.J.; Henakaarchchi, N.; Jenkins, M.; Minasny, B.; McBratney, A.B.; de Remy de Courcelles, V.; Singh, K.; et al. The knowns, known unknowns and unknowns of sequestration of soil organic carbon. Agric. Ecosyst. Environ. 2013, 164, 80–99. [Google Scholar] [CrossRef]
- Trettin, C.C. Existing Soil Carbon Models Do Not Apply to Forested Wetlands; Southern Research Station: Asheville, NC, USA, 2001; Volume 46.
- Minderman, G. Addition, decomposition and accumulation of organic matter in forests. J. Ecol. 1968, 56, 355–362. [Google Scholar] [CrossRef]
- Sahrawat, K.L. Organic matter accumulation in submerged soils. Adv. Agron. 2004, 81, 169–201. [Google Scholar]
- Trettin, C.C.; Jurgensen, M.F. Carbon cycling in wetland forest soils. In The Potential of US Forest Soils to Sequester Carbon and Mitigate the Greenhouse Effect; CRC Press: Boca Raton, FL, USA, 2002; pp. 311–331. [Google Scholar]
- Pouyat, R.V.; Day, S.D.; Brown, S.; Schwarz, K.; Shaw, R.E.; Szlavecz, K.; Trammel, T.L.E.; Yesilonis, I. Urban Soils. In Forest and Rangeland Soils of the United States Under Changing Conditions; Pouyat, D.R., Page-Dumroese, D., Patel-Weynand, T., Geiser, L., Eds.; Springer: Cham, Switzerland, 2020. [Google Scholar]
- Cierjacks, A.; Kleinschmit, B.; Kowarik, I.; Graf, M.; Lang, F. Organic matter distribution in floodplains can be predicted using spatial and vegetation structure data. River Res. Appl. 2011, 27, 1048–1057. [Google Scholar] [CrossRef]
- Siegfried, L.; Le Bayon, C.; Verrecchia, E.; Vittoz, P. From leaf to topsoil, a semi-quantitative assessment of the organic matter variations in riparian forests on a lake shore. Wetlands, Submitted.
- Zhang, Y.; Zou, J.; Meng, D.; Dang, S.; Zhou, J.; Osborne, B.; Ren, B.; Liang, T.; Yu, K. Effect of soil microorganisms and labile C availability on soil respiration in response to litter inputs in forest ecosystems: A meta-analysis. Ecol. Evol. 2020, 10, 13602–13612. [Google Scholar] [CrossRef] [PubMed]
- Weil, R.R.; Brady, N.C. The Nature and Properties of Soils, 15th ed.; Pearson: London, UK, 2017; Volume 1105. [Google Scholar]
- Sutfin, N.A.; Wohl, E.E.; Dwire, K.A. Banking carbon: A review of organic carbon storage and physical factors influencing retention in floodplains and riparian ecosystems. Earth Surf. Process. Landf. 2016, 41, 38–60. [Google Scholar] [CrossRef]
- Luo, Y.; Zhou, X. Soil Respiration and the Environment; Elsevier Academic Press: Amsterdam, The Netherlands, 2006. [Google Scholar]
- Lehmann, J.; Hansel, C.M.; Kaiser, C.; Kleber, M.; Maher, K.; Manzoni, S.; Nunan, N.; Reichstein, M.; Schimel, J.P.; Torn, M.S.; et al. Persistence of soil organic carbon caused by functional complexity. Nat. Geosci. 2020, 13, 529–534. [Google Scholar] [CrossRef]
- Liu, X.; Wan, S.; Su, B.; Hui, D.; Luo, Y. Response of soil CO2 efflux to water manipulation in a tallgrass prairie ecosystem. Plant Soil 2002, 240, 213–223. [Google Scholar] [CrossRef]
- Rieger, I.; Lang, F.; Kowarik, I.; Cierjacks, A. The interplay of sedimentation and carbon accretion in riparian forests. Geomorphology 2014, 214, 157–167. [Google Scholar] [CrossRef]
- Bronick, C.J.; Lal, R. Soil structure and management: A review. Geoderma 2005, 124, 3–22. [Google Scholar] [CrossRef]
- Schmidt, M.W.I.; Torn, M.S.; Abiven, S.; Dittmar, T.; Guggenberger, G.; Janssens, I.A.; Kleber, M.; Kögel-Knabner, I.; Lehmann, J.; Manning, D.A.C.; et al. Persistence of soil organic matter as an ecosystem property. Nature 2011, 478, 49–56. [Google Scholar] [CrossRef] [PubMed]
- Carson, J.K.; Gonzalez-Quiñones, V.; Murphy, D.V.; Hinz, C.; Shaw, J.A.; Gleeson, D.B. Low Pore Connectivity Increases Bacterial Diversity in Soil. Appl. Environ. Microbiol. 2010, 76, 3936–3942. [Google Scholar] [CrossRef] [PubMed]
- Bullinger-Weber, G.; Le Bayon, R.C.; Guenat, C.; Gobat, J.M. Influence of some physicochemical and biological parameters on soil structure formation in alluvial soils. Eur. J. Soil Biol. 2007, 43, 57–70. [Google Scholar] [CrossRef]
- Rowley, M.C.; Grand, S.; Verrecchia, É.P. Calcium-mediated stabilisation of soil organic carbon. Biogeochemistry 2018, 137, 27–49. [Google Scholar] [CrossRef]
- Morgan, J.J.; Stumm, W. Aquatic Chemistry-Chemical Equilibria and Rates in Natural Waters; Wiley: Hoboken, NJ, USA, 1995. [Google Scholar]
- Skinner, H.C.W. Biominerals. Mineral. Mag. 2005, 69, 621–641. [Google Scholar] [CrossRef]
- Dhami, N.K.; Reddy, M.S.; Sudhakara, M. Biomineralization of calcium carbonates and their engineered applications: A review. Front. Microbiol. 2013, 4, 314. [Google Scholar] [CrossRef] [PubMed]
- Muxart, T. Thème II. Processus de précipitation et mesures (Process of precipitation and measures). Bull. L’association Géographes Français 1981, 58, 189–196. [Google Scholar] [CrossRef]
- Bindschedler, S.; Cailleau, G.; Verrecchia, E. Role of Fungi in the Biomineralization of Calcite. Minerals 2016, 6, 41. [Google Scholar] [CrossRef]
- Lowenstam, H.A. Minerals Formed by Organisms. Sci. (Am. Assoc. Adv. Sci.) 1981, 211, 1126–1131. [Google Scholar] [CrossRef] [PubMed]
- Canti, M.G. Biospheroids Produced by Earthworms. In Archaeological Soil and Sediment Micromorphology, Nicosia, C., Stoops, G., Eds.; Wiley Blackwell: Hoboken, NJ, USA, 2017; pp. 47–49. [Google Scholar]
- Jaillard, B.; Guyon, A.; Maurin, A. Structure and composition of calcified roots, and their identification in calcareous soils. Geoderma 1991, 50, 197–210. [Google Scholar] [CrossRef]
- Baize, D.; Girard, C.-M. Référentiel Pédologique 2008; Éditions Quæ: Versailles, France, 2009. [Google Scholar]
- Liu, S.h.a.o.; Wang, Y.-Q. Estimating Soil Organic Carbon Across a LargeScale Region: A State-Space Modeling Approach. Soil Sci. 2012, 177, 607–618. [Google Scholar] [CrossRef]
- Bradford, M.A.; Wood, S.A.; Addicott, E.T.; Fenichel, E.P.; Fields, N.; González-Rivero, J.; Jevon, F.V.; Maynard, D.S.; Oldfield, E.E.; Polussa, A.; et al. Quantifying microbial control of soil organic matter dynamics at macrosystem scales. Biogeochemistry 2021, 156, 19–40. [Google Scholar] [CrossRef]
- Verrecchia, E.P.; Trombino, L. A Visual Atlas for Soil Micromorphologists; Springer Nature: Cham, Switzerland, 2021. [Google Scholar]
- Cunha-Santino, M.B.D.; Bianchini, I. Reviewing the organic matter processing by wetlands. Acta Limnol. Bras. 2023, 35, e19. [Google Scholar] [CrossRef]
- Schomburg, A.; Sebag, D.; Turberg, P.; Verrecchia, E.; Guenat, C.; Brunner, P.; Adatte, T.; Schlaepfer, R.; Le Bayon, R.C. Composition and superposition of alluvial deposits drive macro-biological soil engineering and organic matter dynamics in floodplains. Geoderma 2019, 355, 113899. [Google Scholar] [CrossRef]
- Buttler, A.; Comali, P.; Bueche, M. Study of the Effects of Sub-Jurassic Lake Regulation on Vegetation and the Environment (French); Laboratoire d’écologie végétale et de phytosociologie de l’Université de Neuchâtel: Neuchâtel, Switzerland, 1995. [Google Scholar]
- Vischer, D.L. History of flood protection in Switzerland (French). In Rapports de l’Office Fédéral des Eaux et de la Géologie, Série Eaux, 5; Office fédéral des eaux et de la géologie: Bienne, Switzerland, 2003. [Google Scholar]
- Guenat, C.; Bureau, F.; Weber, G.; Toutain, F. Initial stages of soil formation in a riparian zone: Importance of biological agents and lithogenic inheritance in the development of the soil structure. Eur. J. Soil Biol. 1999, 35, 153–161. [Google Scholar] [CrossRef]
- Kubiëna, W.L. Micropedology. Soil Sci. 1939, 47, 163. [Google Scholar] [CrossRef]
- International Union of Soil Sciences Working Group World Reference Base (IUSS WRB). World Reference Base for Soil Resources 2014, Update 2015 International Soil Classification System for Naming Soils and Creating Legends for Soil Maps; World Soil Resources. Reports No. 106; FAO: Rome, Italy, 2015; 203p. [Google Scholar]
- Pansu, M.; Gautheyrou, J. Handbook of Soil Analysis; Springer: Berlin/Heidelberg, Germany, 2006. [Google Scholar]
- Dohrmann, R.; Genske, D.; Karnland, O.; Kaufhold, S.; Kiviranta, L.; Olsson, S.; Plötze, M.; Sandén, T.; Sellin, P.; Svensson, D.; et al. Interlaboratory CEC and exchangeable cation study of bentonite buffer materials: II. Alternative methods. Clays Clay Miner. 2012, 60, 176–185. [Google Scholar] [CrossRef]
- Sebag, D.; Disnar, J.R.; Guillet, B.; Di Giovanni, C.; Verrecchia, E.P.; Durand, A. Monitoring organic matter dynamics in soil profiles by ‘Rock-Eval pyrolysis’: Bulk characterization and quantification of degradation. Eur. J. Soil Sci. 2006, 57, 344–355. [Google Scholar] [CrossRef]
- Stoops, G. Guidelines for Analysis and Description of Soil and Regolith Thin Sections; John Wiley & Sons: Hoboken, NJ, USA, 2003; Volume 184. [Google Scholar]
- Stoops, G.; Marcelino, V.; Mees, F. Interpretation of Micromorphological Features of Soils and Regoliths; Elsevier: Amsterdam, The Netherlands, 2018. [Google Scholar]
- Monger, H.C.; Kraimer, R.A.; Khresat, S.E.; Cole, D.R.; Wang, X.; Wang, J. Sequestration of inorganic carbon in soil and groundwater. Geology 2015, 43, 375–378. [Google Scholar] [CrossRef]
- Sebag, D.; Verrecchia, E.P.; Cécillon, L.; Adatte, T.; Albrecht, R.; Aubert, M.; Bureau, F.; Cailleau, G.; Copard, Y.; Decaens, T.; et al. Dynamics of soil organic matter based on new Rock-Eval indices. Geoderma 2016, 284, 185–203. [Google Scholar] [CrossRef]
- Borcard, D.; Gillet, F.; Legendre, P. Numerical Ecology with R (Use R!), 2nd ed.; Springer: New York, NY, USA, 2018; p. 435. [Google Scholar]
- Waite, R.; Marty, D.; Strasser, A.; Wetzel, A. The lost paleosols: Masked evidence for emergence and soil formation on the Kimmeridgian Jura platform (NW Switzerland). Palaeogeogr. Palaeoclimatol. Palaeoecol. 2013, 376, 73–90. [Google Scholar] [CrossRef]
- Tabor, N.J.; Myers, T.S. Paleosols as indicators of paleoenvironment and paleoclimate. Annu. Rev. Earth Planet. Sci. 2015, 43, 333–361. [Google Scholar] [CrossRef]
- Wiesmeier, M.; Spörlein, P.; Geuß, U.; Hangen, E.; Haug, S.; Reischl, A.; Schilling, B.; von Lützow, M.; Kögel-Knabner, I. Soil organic carbon stocks in southeast Germany (Bavaria) as affected by land use, soil type and sampling depth. Glob. Change Biol. 2012, 18, 2233–2245. [Google Scholar] [CrossRef]
- Bingham, A.H.; Cotrufo, M.F. Organic nitrogen storage in mineral soil: Implications for policy and management. Sci. Total Environ. 2016, 551, 116–126. [Google Scholar] [CrossRef] [PubMed]
- Weber, A.; Sarsa, M.L.; Sundman, V. Frankia-Alnus incana symbiosis: Effect of endophyte on nitrogen fixation and biomass production. Plant Soil 1989, 120, 291–297. [Google Scholar] [CrossRef]
- Chen, H.; Li, D.; Feng, W.; Niu, S.; Plante, A.; Luo, Y.; Wang, K. Different responses of soil organic carbon fractions to additions of nitrogen. Eur. J. Soil Sci. 2018, 69, 1098–1104. [Google Scholar] [CrossRef]
- Kowalenko, C.G.; Ivarson, K.C.; Cameron, D.R. Effect of moisture content, temperature and nitrogen fertilization on carbon dioxide evolution from field soils. Soil Biol. Biochem. 1978, 10, 417–423. [Google Scholar] [CrossRef]
- Ritchie, G.S.P.; Dolling, P.J. The role of organic matter in soil acidification. Soil Res. 1985, 23, 569–576. [Google Scholar] [CrossRef]
- Kaiser, M.; Ellerbrock, R.; Wulf, M.; Dultz, S.; Hierath, C.; Sommer, M. The influence of mineral characteristics on organic matter content, composition, and stability of topsoils under long-term arable and forest land use. J. Geophys. Res. Biogeosciences 2012, 117, G02018. [Google Scholar] [CrossRef]
- Muller, S.D.; Miramont, C.; Bruneton, H.; Carré, M.; Sottocornola, M.; Court-Picon, M.; de Beaulieu, J.-L.; Nakagawa, T.; Schevin, P. A palaeoecological perspective for the conservation and restoration of wetland plant communities in the central French Alps, with particular emphasis on alder carr vegetation. Rev. Palaeobot. Palynol. 2012, 171, 124–139. [Google Scholar] [CrossRef]
- Graf-Rosenfellner, M.; Cierjacks, A.; Kleinschmit, B.; Lang, F. Soil formation and its implications for stabilization of soil organic matter in the riparian zone. Catena 2016, 139, 9–18. [Google Scholar] [CrossRef]
- Perreault, J.M.; Whalen, J.K. Earthworm burrowing in laboratory microcosms as influenced by soil temperature and moisture. Pedobiologia 2006, 50, 397–403. [Google Scholar] [CrossRef]
- Six, J.; Elliott, E.T.; Paustian, K.; Doran, J.W. Aggregation and Soil Organic Matter Accumulation in Cultivated and Native Grassland Soils. Soil Sci. Soc. Am. J. 1998, 62, 1367–1377. [Google Scholar] [CrossRef]
- Kleber, M.; Eusterhues, K.; Keiluweit, M.; Mikutta, C.; Mikutta, R.; Nico, P.S. Mineral–organic associations: Formation, properties, and relevance in soil environments. Adv. Agron. 2015, 130, 1–140. [Google Scholar]
- Lin, H. Three principles of soil change and pedogenesis in time and space. Soil Sci. Soc. Am. J. 2011, 75, 2049–2070. [Google Scholar] [CrossRef]
- Bullinger-Weber, G.; Guenat, C.; Salomé, C.; Gobat, J.M.; Le Bayon, R.C. Impact of flood deposits on earthworm communities in alder forests from a subalpine floodplain (Kandersteg, Switzerland). Eur. J. Soil Biol. 2012, 49, 5–11. [Google Scholar] [CrossRef]
- Jenny, H. Factors of Soil Formation: A System of Quantitative Pedology; McGraw Hill Book Company: New York, NY, USA, 1941. [Google Scholar]
- Verrecchia, E.P. Lacustrine and palustrine geochemical sediments. In Geochemical Sediments & Landscapes, Nash, D.J., McLaren, S.J., Eds.; Blackwell Publishing: Oxford, UK, 2007; pp. 298–329. [Google Scholar]
- Rhoades, J.D. Cation exchange capacity. In Methods of Soil Analysis. Part 2: Chemical and Microbiological Properties; Page, A.L., Ed.; Agronomy Series, 9, Second edition, ASA and SSSA Editions; Scientific Research: Madison, WI, USA, 1982; pp. 149–158. [Google Scholar]
- Wada, S.I. Mechanism of apparent salt absorption in ando soils. Soil Sc. Plant Nutr. 1984, 30, 77–83. [Google Scholar] [CrossRef]
- Shuman, L.M.; Duncan, R.R. Soil exchangeable cations and aluminum measured by ammonium chloride, potassium chloride, and ammonium acetate. Commun. Soil Sci. Plant Anal. 1990, 21, 1217–1228. [Google Scholar] [CrossRef]
- Baize, D.; Jabiol, B. Guide Pour la Description des Sols; Editions Quae: Versailles, France, 2011. [Google Scholar]
- Zanella, A.; Ponge, J.-F.; Jabiol, B.; Sartori, G.; Kolb, E.; Le Bayon, R.C.; Gobat, J.M. Humusica 1: Terrestrial humus systems and forms—Specific terms and diagnostic horizons. Applied Soil Ecol. 2018, 122, 56–74. [Google Scholar] [CrossRef]


| Quantitative Range of Soil Values by Horizon Type | ||||||||||||||
|---|---|---|---|---|---|---|---|---|---|---|---|---|---|---|
| n | Gleysol | Stagnosol | Fluvisol | Horizon | pH | TOC | R Index | Nitrogen | Calcium Cation | TIC | Clay and Fine Silt | Sand | ||
| Soggy-wet | A. glutinosa | 3 | 2 | 1 | Organic | 5.11–7.65 | 11.5–46.9 | 0.47–0.495 | 0.96–3.03 | 27.9–56 | 1–5.8 | - | - | |
| Organo-mineral | 7.68–9.15 | 4.6–5.2 | 0.526–0.56 | 0.32–1.01 | 29.7–31.1 | 1.2–2.2 | 17–71 | 8–77 | ||||||
| Mineral | 8.11–9.12 | 0.1–1.3 | 0.617–0.665 | 0.01–0.48 | 9.2–17.7 | 1.7–2.8 | 25–95 | 1–67 | ||||||
| A. incana | 3 | 3 | Organic | 6.17 | 24.7 | 0.538 | 1.9 | 54.1 | 1.1 | - | - | |||
| Organo-mineral | 7.57–8.16 | 2.6–6.6 | 0.492–0.745 | 0.17–0.43 | 21.9–36.6 | 0.3–1.1 | 19–64 | 22–76 | ||||||
| Mineral | 8.38–8.92 | 0.1–0.5 | 0.659–0.683 | 0–0.03 | 7.5–17.7 | 2.6–4.2 | 5–26 | 56–92 | ||||||
| Moist-dry | Fraxinus | 3 | 3 | Organic | 7.48 | 11.7 | 0.556 | 0.78 | 46.1 | 0.3 | - | - | ||
| Organo-mineral | 8.09–8.34 | 1.3–2.7 | 0.515–0.693 | 0.14–0.27 | 19.5–22.7 | 0.3–2.6 | 30–65 | 21–48 | ||||||
| Mineral | 8.33–8.83 | 0.1–1.9 | 0.569–0.669 | 0–0.16 | 10.2–20.4 | 2.6–4.4 | 29–32 | 49–52 | ||||||
| Pinus | 5 | 1 | 4 | Organo-mineral | 6.92–8.3 | 0.5–7.3 | 0.521–0.679 | 0.06–0.85 | 16.4–27 | 0.2–3 | 41–99 | 0–39 | ||
| Mineral | 8.46–9.09 | 0–1.3 | 0.557–0.682 | 0.04–0.31 | 7.8–19.5 | 0.7–2.7 | 26–96 | 0–56 | ||||||
| Station | Soil Type | Horizon Type | N° | Organic Matter | Carbonate | Bioturbation | ||||||||
|---|---|---|---|---|---|---|---|---|---|---|---|---|---|---|
| Recognizable | Amorphous | Pedogenic | Inherited | Earthworm Burrow | Root Passage | Faecal Pellets | MO Integration | |||||||
| Biospheroids | Microsparite | Micrite | Rock | Shell | ||||||||||
| Ag1 | Stagnosol | Organo-mineral | Ag1.1 | 3 | 4 | NO | NO | 4 | 5 | 2 | NO | 2 | 2 | Integrated |
| Ag2 | Gleysol | Organo-mineral | Ag2.2 | 5 | 4 | NO | NO | 1 | 1 | NO | NO | 3 | 1 | Side-be-side and Integrated |
| Ag3 | Gleysol | Organic | Ag3.1 | 5 | 4 | NO | NO | NO | NO | 1 | NO | 2 | 3 | No Mineral |
| Ai1 | Gleysol | Organic | Ai1.1 | 4 | 5 | NO | 1 | NO | 2 | NO | NO | 3 | 2 | Side-by-side |
| Mineral | Ai1.2 | 1 | NO | NO | NO | NO | 4 | NO | NO | 1 | NO | Mostly Mineral | ||
| Ai2 | Gleysol | Organo-mineral | Ai2.1 | 2 | 3 | 2 | 1 | 1 | 3 | 2 | 2 | 3 | NO | Integrated |
| Ai3 | Gleysol | Organo-mineral | Ai3.1 | 3 | 3 | 1 | 1 | NO | 2 | 3 | NO | 4 | 1 | Side-by-side |
| Organo-mineral | Ai3.2 | 2 | 3 | 1 | 1 | NO | 4 | 1 | 1 | 2 | NO | Side-by-side | ||
| Fe1 | Gleysol | Organo-mineral | Fe1.1 | 2 | 2 | 2 | 2 | 5 | 4 | 2 | 5 | 2 | 1 | Integrated |
| Organo-mineral | Fe1.2 | 1 | 2 | 2 | 2 | 5 | 4 | 1 | 3 | 2 | NO | Integrated | ||
| Mineral | Fe1.3 | 1 | 1 | NO | 3 | 4 | 4 | 1 | 4 | 2 | NO | Mostly Mineral | ||
| Fe2 | Gleysol | Organo-mineral | Fe2.1 | 2 | 2 | 3 | 3 | 5 | 3 | 2 | 4 | 2 | 1 | Integrated |
| Mineral | Fe2.2 | 2 | 1 | 3 | 2 | 5 | 3 | 2 | 5 | 3 | 1 | Mostly Mineral | ||
| Mineral | Fe2.3 | 1 | 1 | 2 | 3 | 5 | 3 | 2 | 4 | 2 | NO | Mostly Mineral | ||
| Mineral | Fe2.4 | 2 | 1 | 2 | 3 | 5 | 4 | 2 | 5 | 1 | NO | Mostly Mineral | ||
| Fe3 | Gleysol | Organic | Fe3.1 | 2 | 5 | NO | NO | 2 | 1 | NO | 3 | 3 | 1 | Side-by-side and Integrated |
| Organo-mineral | Fe3.2 | 1 | 2 | NO | NO | 5 | 2 | NO | 3 | 2 | NO | Integrated | ||
| Mineral | Fe3.3 | 2 | 2 | NO | NO | 5 | 4 | NO | 4 | 1 | NO | Integrated | ||
| Ps1 | Stagnosol | Organic-mineral | Ps1.1 | 3 | 3 | NO | 1 | 3 | 1 | 1 | 5 | 3 | 2 | Integrated |
| Organo-mineral | Ps1.2 | 2 | 2 | NO | 1 | 3 | 2 | 2 | 4 | 4 | 1 | Integrated | ||
| Ps2 | Fluvisol | Organo-mineral | Ps2.1 | 2 | 2 | NO | NO | 3 | 2 | 2 | 3 | 2 | 1 | Integrated |
| Mineral | Ps2.3 | 1 | 1 | NO | NO | 4 | 1 | NO | 2 | NO | NO | Mostly Mineral | ||
| Ps3 | Fluvisol | Organo-mineral | Ps3.1 | 4 | 2 | 2 | 1 | 3 | 3 | 1 | 4 | 2 | 2 | Integrated |
| Organo-mineral | Ps3.3 | 2 | 2 | 2 | 1 | 3 | 2 | 1 | 3 | 2 | 2 | Integrated | ||
Disclaimer/Publisher’s Note: The statements, opinions and data contained in all publications are solely those of the individual author(s) and contributor(s) and not of MDPI and/or the editor(s). MDPI and/or the editor(s) disclaim responsibility for any injury to people or property resulting from any ideas, methods, instructions or products referred to in the content. |
© 2025 by the authors. Licensee MDPI, Basel, Switzerland. This article is an open access article distributed under the terms and conditions of the Creative Commons Attribution (CC BY) license (https://creativecommons.org/licenses/by/4.0/).
Share and Cite
Siegfried, L.; Verrecchia, E.; Vittoz, P. Diversity and Micromorphology of Organic Matter in Riparian Forests on Carbonate-Rich Substrate (Switzerland). Forests 2025, 16, 1203. https://doi.org/10.3390/f16081203
Siegfried L, Verrecchia E, Vittoz P. Diversity and Micromorphology of Organic Matter in Riparian Forests on Carbonate-Rich Substrate (Switzerland). Forests. 2025; 16(8):1203. https://doi.org/10.3390/f16081203
Chicago/Turabian StyleSiegfried, Lila, Eric Verrecchia, and Pascal Vittoz. 2025. "Diversity and Micromorphology of Organic Matter in Riparian Forests on Carbonate-Rich Substrate (Switzerland)" Forests 16, no. 8: 1203. https://doi.org/10.3390/f16081203
APA StyleSiegfried, L., Verrecchia, E., & Vittoz, P. (2025). Diversity and Micromorphology of Organic Matter in Riparian Forests on Carbonate-Rich Substrate (Switzerland). Forests, 16(8), 1203. https://doi.org/10.3390/f16081203