Article

Comparing Pre- and Post-Fire Strategies to Mitigate Wildfire-Induced Soil Erosion in Two Mediterranean Watersheds

1
Centro de Estudos Florestais e Laboratório Associado TERRA, Instituto Superior de Agronomia, Universidade de Lisboa, Tapada da Ajuda, 1349-017 Lisboa, Portugal
2
Department of Forest Ecosystems and Society, College of Forestry, Oregon State University, Corvallis, OR 97331, USA
3
Department of Environment and Planning and GeoBioTec, University of Aveiro, 3810-193 Aveiro, Portugal
4
USDA Forest Service, Rocky Mountain Research Station, Missoula Fire Sciences Laboratory, 5775 US Highway 10W, Missoula, MT 59808, USA
*
Author to whom correspondence should be addressed.
Forests 2025, 16(8), 1202; https://doi.org/10.3390/f16081202
Submission received: 23 May 2025 / Revised: 10 July 2025 / Accepted: 16 July 2025 / Published: 22 July 2025
(This article belongs to the Special Issue Forest Fire Detection, Prevention and Management)

Abstract

Wildfires accelerate soil erosion. Preventive fuel management and post-fire control measures are two distinct strategies that can be used to mitigate wildfire-induced soil loss with varying effectiveness and costs. Here, we quantified the impacts and effectiveness of pre- versus post-fire treatment strategies on soil loss mitigation. We coupled fire simulations with soil erosion modelling to estimate annual wildfire-induced soil loss for two watersheds in Portugal. We identified optimal treatment locations with the aim of maximizing the reduction in soil loss, and estimated treatment effectiveness using treatment leverage and cost-effectiveness. Both mitigation strategies were predicted to reduce post-fire soil loss, with effects increasing with treatment extent. Treatments had a strong mitigation effect particularly in extreme fire years. Results indicated that there was no single mitigation strategy that fits all watersheds, and the choice was largely influenced by wildfire and treatment frequency. For the most fire-prone watershed, Castelo de Bode, fuel treatments were the most effective strategy, being approximately 2-fold cheaper and more effective than post-fire treatments. Treatments were more effective and exhibited lower variability in years with higher soil loss. Our results show that the most cost-effective combinations of treatment strategies vary with the soil loss reduction objective. Relevant treatment synergies were identified that can help land managers to maximize the attainment of soil loss mitigation goals ensuring the best use of resources. This work contributes to a better understanding of how post-fire soil loss can be mitigated, contributing for better resource allocation while maximizing specific management goals.

1. Introduction

Accelerated soil erosion is widely considered to constitute one of the most important threats to soils in Europe, not only endangering sustainable land use but also potentiating important off-site impacts such as damage to infrastructures, contamination of surface water bodies and silting-up of reservoirs [1,2,3]. In southern Europe, wildfires have long been recognized as a key factor in accelerating soil erosion by water, in particular from shrublands and (planted) woodlands [4,5]. The strong and sometimes extreme hydrological and erosion responses that have frequently been observed in recently burnt areas result from direct wildfire effects on vegetation and soil, in combination with intense post-fire rainfall events during the window of disturbance [6,7,8]. As such, the degree and duration of the wildfire-enhanced runoff and erosion response depend strongly on vegetation and soil burn severity, as well as on the resilience of the ecosystem to recover from these direct impacts [7,9,10].
Preventive fuel management can mitigate wildfire impacts by reducing fire likelihood and intensity and consequently burn severity and post-fire erosion risk [11,12,13]. Fuel treatments substantially reduce fuel load using a range of techniques such as thinning, mechanical cutting of the undergrowth vegetation, herbicide application and prescribed burning [13,14]. Although fuel treatments can also negatively impact protective ground cover and soil erodibility and thus increase soil erosion risk, these effects are substantially lower than a severe wildfire [15,16]. Several studies have evaluated the impacts of fuel treatments on post-fire erosion risk by coupling wildfire spread and erosion models and then comparing post-fire erosion for scenarios with and without fuel treatments [15,17,18,19,20]. Overall, these studies found that the effectiveness of fuel treatments to reduce post-fire soil losses depends on multiple factors such as treatment type and intensity, burn severity, vegetation and soil resilience, terrain and both wildfire and rainfall regimes.
A wide range of measures have been used to mitigate soil erosion after wildfires using well organized post-fire emergency stabilization, especially in the USA [21,22] and Spain (Galicia) [23]. The extensive review by Girona-García et al. [24] divided the measures in four main categories according to their principles of operation: (i) protective ground cover; (ii) barriers; (iii) seeding; and (iv) chemical. The authors’ meta-analysis showed that all four main categories had a significant mean soil loss reduction effect, but the benefits from the treatment types decreased in the order listed. Furthermore, the 95% confidence interval was markedly smaller for cover-based treatments compared to both barrier- and seeding-based treatments. The meta-analysis contained six studies including one conducted in the same region as the present study, i.e., central Portugal [25]. All six studies tested cover-based treatments and were included in the follow-up study of Girona-Garcia et al. [26] that reviewed the cost-effectiveness of post-fire erosion mitigation measures.
Despite these and other studies, the recent shift in fire management in Europe [27,28], and specifically in the Mediterranean basin [29,30], towards prevention sets the stage for more research towards optimizing investments in both pre- and post-fire mitigation strategies at the watershed scale. Clearly, a robust decision framework for erosion mitigation needs to adopt a risk-based approach given the stochastic nature of both high-severity wildfire and post-fire extreme rainfall events. Furthermore, there is also the need to better understand what types of treatments, either alone or in combination, are most cost-effective in terms of mitigating post-fire soil loss, and how treatment locations can be spatially optimized at watershed scales to maximize soil loss mitigation and improve cost-effectiveness.
In this study, we examined the relative benefits of preventive fuel treatments and post-fire control measures in mitigating wildfire-induced soil loss. We use a risk-based framework and integrate effectiveness metrics to provide additional useful information for land managers. The main objectives of the work were to: (i) quantify the potential impacts of preventive (pre-fire) and reactive (post-fire) treatment strategies on soil loss mitigation; (ii) quantify the effectiveness of both strategies; and (iii) evaluate the combined effect of both strategies to achieve watershed-level targets and identify potential synergies. We performed the analysis on two distinct watersheds in Portugal that have important differences in terms of extent, land cover and fire regime. The results contribute to an improved understanding of how specific watershed characteristics can affect the optimal choice of post-fire soil loss mitigation strategies.

2. Materials and Methods

2.1. Overview

We implemented a simulation-based framework to evaluate soil erosion mitigation strategies in two fire-prone watersheds in Portugal that are described in Section 2.2. The framework had the following main steps:
  • Fire behavior simulation: Thousands of hypothetical wildfires were simulated to capture variability in fire spread and intensity across different conditions (fire ensemble; Section 2.3);
  • Fire-level soil loss estimation: Wildfire-induced soil loss was estimated for each simulated fire (soil loss ensemble; Section 2.4);
  • Pre-fire fuel treatments: Optimal locations for fuel treatments were identified based on their potential to reduce wildfire-induced soil loss. Fire spread simulations and associated soil loss were estimated assuming fuel treatments were implemented (complementing the fire and soil loss ensemble; Section 2.5.1).
  • Annual soil loss estimation: Expected annual wildfire-induced soil erosion was derived by integrating soil loss estimates across the full ensemble of simulated fires (Section 2.5.2);
  • Post-fire treatments: Optimal post-fire intervention areas were determined to maximize wildfire-induced soil loss reduction (Section 2.5.2);
  • Treatment evaluation: The effect and effectiveness of both pre- and post-fire treatments were quantified using performance metrics such as soil loss reduction, leverage, and cost-effectiveness (Section 2.5.3).
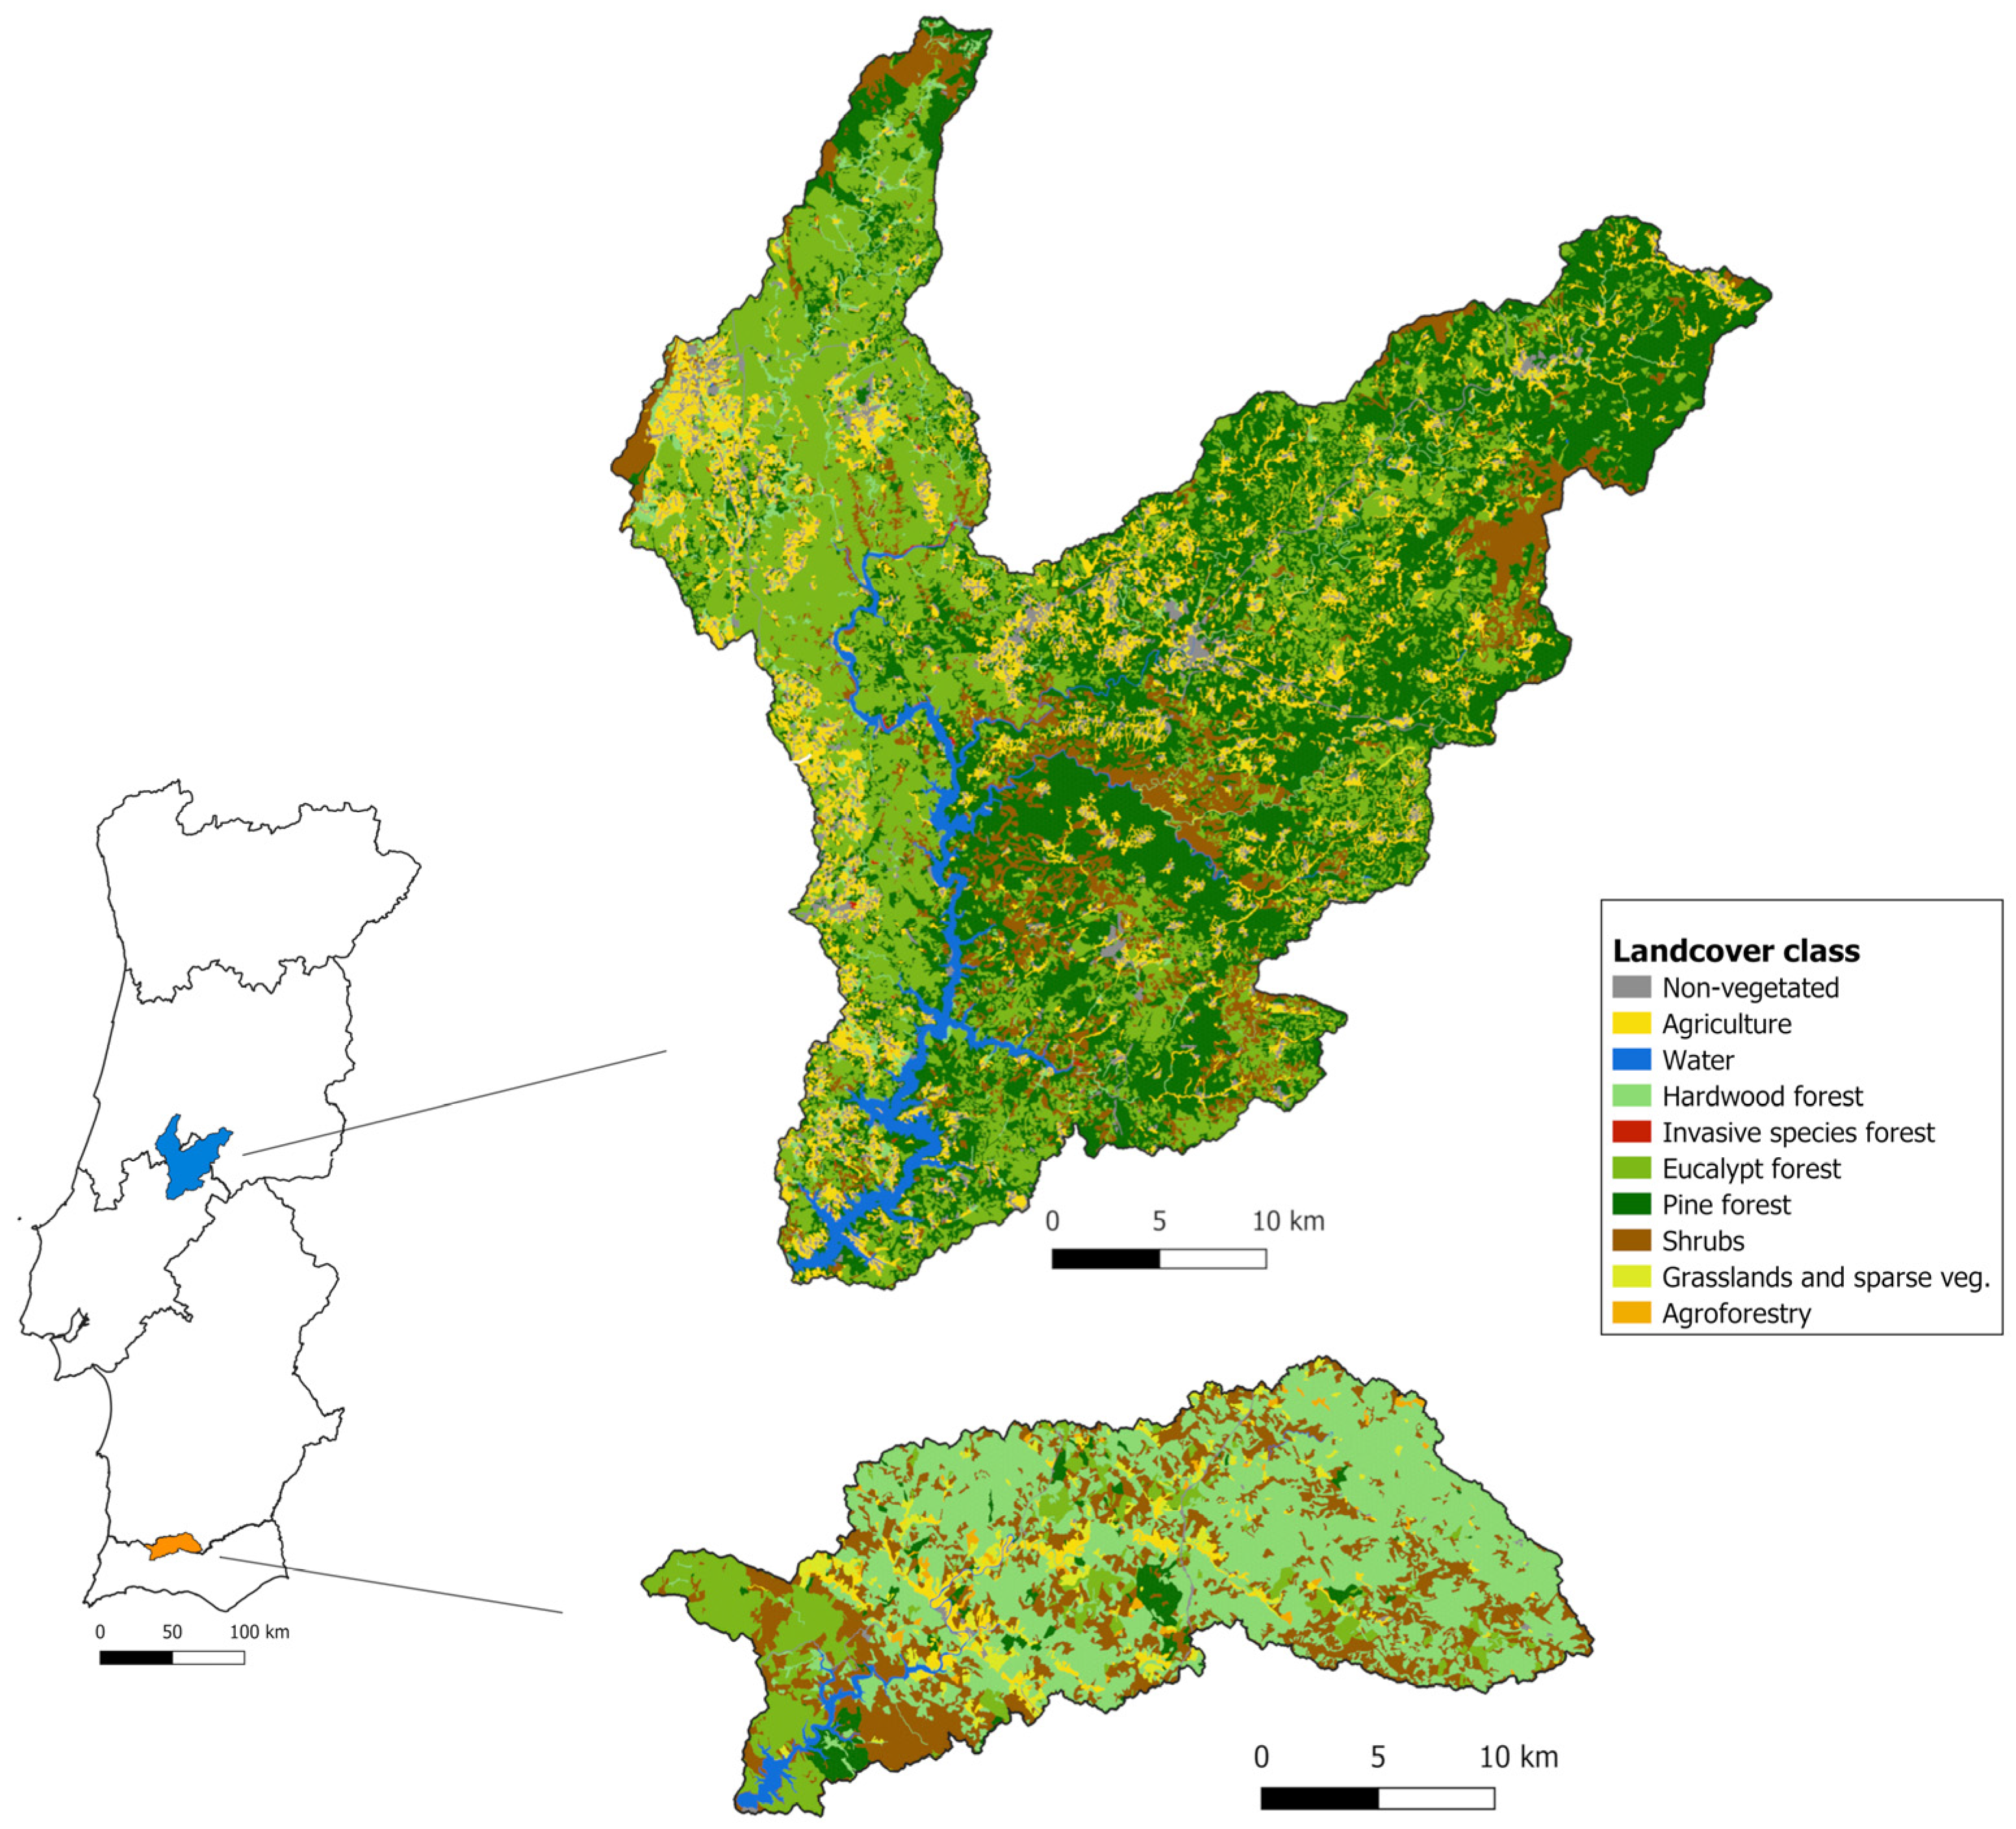
We combined six pre-fire and six post-fire treatment extents (management scenarios) and considered two fuel scenarios, one representing current conditions and the other representing medium-term fuel build-up.

2.2. Study Areas

This study was conducted on two watersheds (Figure 1): (1) Castelo de Bode, located in central Portugal, responsible for providing drinking water to approximately three million people, including the country’s capital Lisboa [31]; and (2) Odelouca, located in southern Portugal, the main source of drinking and irrigation water in the Algarve region and crucial to address the recurrent drought in southern Portugal [32].
The Castelo de Bode watershed has an extent of 1363 km2 and is dominated by forest (76%), mainly plantations of pine (44%) and eucalypt (30%), and shrublands (10%). Approximately half of the watershed has gentle slopes ranging from 4 to 10%, and most of the watershed (~90%) has slopes below 15%. According to the aridity index, the area is “humid” (data for 2000–2010; [34]). The predominant soils are Regosols and Podzols [35].
The Odelouca watershed has an extent of 396 km2, and is thus about approximately 3.5-fold smaller than the Castelo de Bode watershed. It is dominated by hardwood forest (especially cork-oak, 50%), followed by shrublands (25%) and eucalypt plantations (11%). The slope distribution is very similar to that of Castelo de Bode. According to the aridity index, the watershed comprises both “semi-arid” and “sub-humid” dry areas [34]. The predominant soils are Regosols [35].
Both watersheds have wildfire regimes associated with large and intense wildfires, with varying wildfire frequencies and total burned extent [36,37]. For Castelo de Bode, the cumulative burned area over the last 20 years was equivalent to the watershed extent, burning at an average of 4.5% per year. For Odelouca, it was equivalent to 60% of its extent, burning at an average of 2.7% per year. The wildfire recurrence was very high in Castelo de Bode, with a substantial extent of areas burned more than 3 fold times in the last five decades [37] (Figure A1a). The wildfire recurrence was much lower for Odelouca, with a relevant extent that never burned and parts that burned once or twice in the last five decades (Figure A1b).

2.3. Wildfire Modeling

To simulate wildfire spread and behavior across the study areas, we used the minimum travel time (MTT) spread algorithm [38], as implemented in FConstMTT, a command line version of FlamMap [39]. MTT is a mechanistic wildfire spread modeling system that calculates two-dimensional fire growth using Rothermel’s equation [40] and estimates fire intensity using Byram’s equation [41]. MTT and FConstMTT have been widely used to model fire spread and behavior in Mediterranean areas [42,43,44], including the estimation of post-fire soil loss [20], and can accurately reproduce large-scale fire patterns [45].
FConstMTT requires data representing the landscape, ignitions, and weather conditions. Temperature, relative humidity, wind speed and direction data were obtained from ERA5-Land [46], using the MTTfireCAL R package v.1.1 [47]. Weather data were obtained for the dates of large wildfires (here define as larger than 100 ha) that occurred between 2001 and 2022 [48]. The hourly weather data were extracted for the diurnal period between 14h and 22h, typically associated with higher fire activity. Relative humidity was derived from the August–Roche–Magnus formula [49]. Further details of the weather data processing are thoroughly described in the work of Aparício et al. [47].
The landscape was represented by elevation, slope, aspect, surface fuel models and tree cover density maps. Elevation data were obtained from the 30 m Space Shuttle Radar Topography Mission (SRTM) [50] and used to derive slope and aspect. Tree cover density was obtained from the Copernicus Land Monitoring Service [51]. The ignition probability surface was produced by applying a kernel density function to historical ignitions of large wildfires that occurred between 2001 and 2022 [48]. The Portuguese surface fuel model maps [52] were derived following the methodology of Sá et al. [53]. For each study area, two fuel scenarios were defined: (1) fuel conditions associated with the year of 2023, representing the current fuel scenario; (2) potential fuel conditions for the year 2030, assuming fuel build-up due to the absence of wildfires, representing the worst-case scenario. All results and analysis are shown for the 2023 fuel scenario, unless stated otherwise. All FConstMTT input layers were produced at a 100 m resolution.
FConstMTT requires calibration to produce accurate simulated spatial wildfire patterns. Calibration was performed using the MTTfireCAL package in R [47]. Ignition points were randomly generated based on the ignition probability surface. MTT was run iteratively to find the optimal durations that reproduced the historical fire patterns, fire size distribution and fire frequency, in the two study areas [47].
Once calibrated, FConstMTT was run for each study area to simulate thousands of hypothetical wildfires, representing a burnable area equivalent to 10,000 fire seasons. Fuel models were changed according to the fuel scenario chosen (2023 or 2030) while all other parameters remained constant. The outputs generated included flame length (m), with a spatial resolution of 100 m, and the final burned perimeter of each simulated wildfire. These composed a wildfire ensemble for each study area and each fuel scenario.

2.4. Soil Loss Modeling

We used a modified version of the RUSLE model [54] to compute soil loss, using the following equation:
A = R × K × LS × C × P
where A is the average annual soil loss (t ha−1 yr−1), R is the rainfall erosivity factor (MJ mm ha−1 h−1 yr−1), K is the soil erodibility factor (t ha h ha−1 MJ−1 mm−1), LS is the slope length-gradient factor (dimensionless), C is the cover-management factor (dimensionless) and P is the support practice factor (dimensionless).
Maps of the R, K and LS factors were downloaded from the Joint Research Center (JRC) soil database repository [55,56,57], while maps of the C and P factors were produced by reclassifying the 2018 Portuguese land-cover map [33] according to Table A1 and Table A2, respectively. All maps were created at a 100 m resolution.
The effect of wildfires on soil loss was estimated by modifying the values of the C-factor values depending on three burn severity levels (Table A1; [58,59,60]). In turn, burn severity was derived from simulated flame length (Table 1; [12,61]). The C-factor was modified assuming that under higher burn severity, a large fraction of the surface cover was removed. The wildfire-induced soil loss was then obtained for each simulated fire by subtracting the soil loss with the original C-factor values from the soil loss with the modified C-factor values. The RUSLE was used in this study to estimate average annual soil erosion and not time series of annual erosion, thus the effect of wildfires on the C-factor and, hence, on soil loss was assumed to be limited to the first post-fire year. This assumption seemed reasonable, since various field studies in central Portugal have reported a major decrease in soil loss from the first to the second post-fire year [25,62,63].
Soil loss maps were computed for each simulated wildfire at a 100 m resolution. These composed an ensemble of hypothetical wildfire-induced soil loss for each study area and each fuel scenario. Hereafter, we refer to wildfire-induced soil erosion as just “soil loss”.

2.5. Modelling Soil Loss Mitigation Strategies

2.5.1. Preventive Fuel Treatments (Pre-Fire)

The application of preventive fuel treatments reduces fine fuel load before the occurrence of a wildfire. In turn, the treatments decrease fire likelihood, but most importantly, decrease flame length and hence burn severity [11,12]. Hereafter, we refer to pre-fire fuel treatments as the actions that comprise fuel load reduction in the landscape, regardless of the techniques used.
To estimate the impact of pre-fire treatments on soil loss, it was necessary to define their hypothetical location and extent in each watershed. We identified the optimal treatment locations using ForSys [64]. ForSys evaluates existing treatment units in the landscape and locates the ones that maximize the attainment given one or multiple objectives (that can have different priority levels). In doing so, ForSys groups multiple treatment units into a single project to simulate management strategies that are more realistic from an operational perspective. ForSys uses an algorithm that follows a greedy search approach, evaluating each treatment unit as a seed to create treatment projects in the landscape. The search continues by incorporating adjacent treatment units until the maximum project area extent is reached. ForSys has been found to perform well for single objective scenarios [65], and has been applied in several contexts [42], including for similar purposes as the present one [20].
To apply ForSys, both study watersheds were divided into potential treatment units (or stands), each of which comprising a single land-cover type and having an average extent of approximately 5 ha. Six land-cover types were considered here as potentially suitable for pre-fire fuel treatments: forest, shrubland, grassland, agroforestry and mixed agricultural-natural areas. A maximum project area of 50 ha was considered.
The total number of potentially suitable treatment units was 27,440 and 8597 for Castelo de Bode and Odelouca, respectively. For each treatment unit, we calculated the average soil loss from the ensemble (Section 2.4). ForSys was then applied with the aim of maximizing the reduction in soil loss for the two different fuel scenarios (Section 2.3) together, giving a weight of 2/3 to the 2023 scenario and 1/3 to the 2030 scenario. These weights were chosen to mimic that short-term management goals often take prevalence over medium-term goals. Finally, ForSys was applied for six management scenarios that contrasted in the extent of the pre-fire fuel treatments, covering 0%, 5%, 10%, 20%, 30% and 40% of the landscape. As a result, the total extent of the fuel treatment differed markedly between the two study watersheds and, within each watershed, between the six scenarios (Table A3).
We assumed that pre-fire fuel treatments would need to be repeated, on average, every five years. This was based on the current management practices in planted forests in Portugal [66], and on the intervals typically referred in prescribed burning plans in Portugal. For simplicity, we assumed that in the treatment areas the original fuel models were changed to reflect average fuel conditions representative of the five-year period (Table A4). The fire spread simulations (Section 2.3) were run with the same exact inputs, except for the modified fuel model map, and soil loss was estimated. These simulations were added to the wildfire and soil loss simulation ensembles described in Section 2.3 and Section 2.4.
Fuel treatment costs were defined based on published reference values for 2022 [67], which cover a range of techniques such as prescribed burning, manual cutting and the use of heavy machinery. The cost values only distinguished two slope classes (<5%, >25%), so the average values were used here for the intermediate slope class (5%–25%). The final costs for a specific treatment scenario were then estimated as the weighted average across the different techniques for each slope class (Table A5). It is worth stressing that the cost values suffer from considerable uncertainty, therefore, the costs presented here should be considered as merely indicative.

2.5.2. Reactive Soil Loss Treatments (Post-Fire)

To reproduce the impact of post-fire erosion control treatments on soil loss, we simulated 500 independent fire seasons (equivalent to 500 years). This step was necessary to mimic the operational application of post-fire treatments following the occurrence of wildfires. For each fire season, a value for the annual burned area was randomly sampled from the historical values of the study catchment over the 2000–2022 period. Soil loss estimates for each simulated wildfire were then randomly sampled from the ensemble until the sum of their burnt areas equaled the afore-said annual burnt area. This sampling was constrained to avoid “new” simulated fires overlapping with previously selected burned areas within the same fire season. Finally, the soil loss for a specific fire season was estimated by aggregating the soil losses of all of the season’s individual simulated fires.
In line with the guidelines of the Portuguese Wildfire National Action Plan [29], only burnt areas exceeding 500 ha were considered as candidates for post-fire treatment. ForSys was again used to identify the optimal treatment locations that maximized soil loss reduction, using 50 ha as maximum area for the individual projects. The same treatment units and the same six management scenarios (i.e., treatment extents) were considered as for the pre-fire treatments. The treatment extents referred to the percentage of annual burned area treated, thus the total area treated depended on the burned area of each specific post-fire season (see example in Table A6).
Two of the main types of erosion mitigation treatments were considered in this study, i.e., cover- and barrier-based treatments since the meta-analysis of Girona-García et al. [24] showed these are more effective than seeding- and chemical-based treatments. More specifically, wood mulching and contour log felling were considered for the forest land-cover types, thereby giving preference to ecosystem-specific or local materials. Straw mulching was considered for the other, non-forest land-cover types, because of the reduced availability of ecosystem-specific or local materials on the one hand, and the widespread use of straw mulch in operational emergency stabilization in the USA [21,22] and Spain (Galicia) [23]. The effectiveness of the treatments in reducing post-fire soil loss was derived from Girona-García et al. [24], while the associated costs were extracted from Girona-García et al. [26] (Table 2).

2.5.3. Quantifying the Impact of Pre- and Post-Fire Treatments

To quantify the impacts of pre- and post-fire mitigation strategies, soil loss was estimated for a total of 36 scenarios. Each scenario comprises one of the six pre-fire fuel treatment extents (Section 2.5.1) and one of the six post-fire treatment extents (Section 2.5.2). These include the no-treatment scenario. The annual soil loss for each scenario was then computed as the sum of the soil loss across all treatment units of the watershed (t ha−1 yr−1), for each fire season. Considering all 500 fire seasons, we calculated the average annual soil loss, as well as the annual soil loss for extreme years defined as those exceeding the percentile 95. Note that, the average annual soil loss corresponds to an average in space, considering the entire watershed area, and in time, considering all fire seasons. Exceedance probabilities were computed and plotted to estimate the probability of a certain annual soil loss value being exceeded in the future [68].
The effect of treatments in soil loss reduction was defined as the difference between soil loss estimates for a given treatment scenario and the no-treatment scenario. To allow comparisons between watersheds and fuel scenarios (i.e., 2023 vs. 2030, see Section 2.3), we normalized soil loss reduction dividing it by the total treatable soil loss in the watershed and expressed it in %. For indicative purposes, we also estimated the reduction in annual soil loss (t yr−1) across the entire treatable watershed area.
Finally, we estimated the effectiveness of the two treatment strategies to reduce post-fire soil loss using two metrics: leverage and cost-effectiveness. Leverage was estimated as the soil loss reduction attained (i.e., the impact) per unit of treatment (i.e., the effort), expressed in t ha−1 yr−1 [24]. On the other hand, treatment cost-effectiveness refers to the cost per ton of soil prevented from being lost through erosion, expressed in EUR t−1 [26]. Besides analyzing the effectiveness of each mitigation strategy, we also identified the most cost-effective combinations of pre- and post-fire treatments that lead to the attainment of specific soil loss reduction targets at the watershed-level. Possible treatment synergies were identified when the combination of pre- and post-fire treatments lead to an amplified outcome that exceeded what would be expected from independent contributions.

3. Results

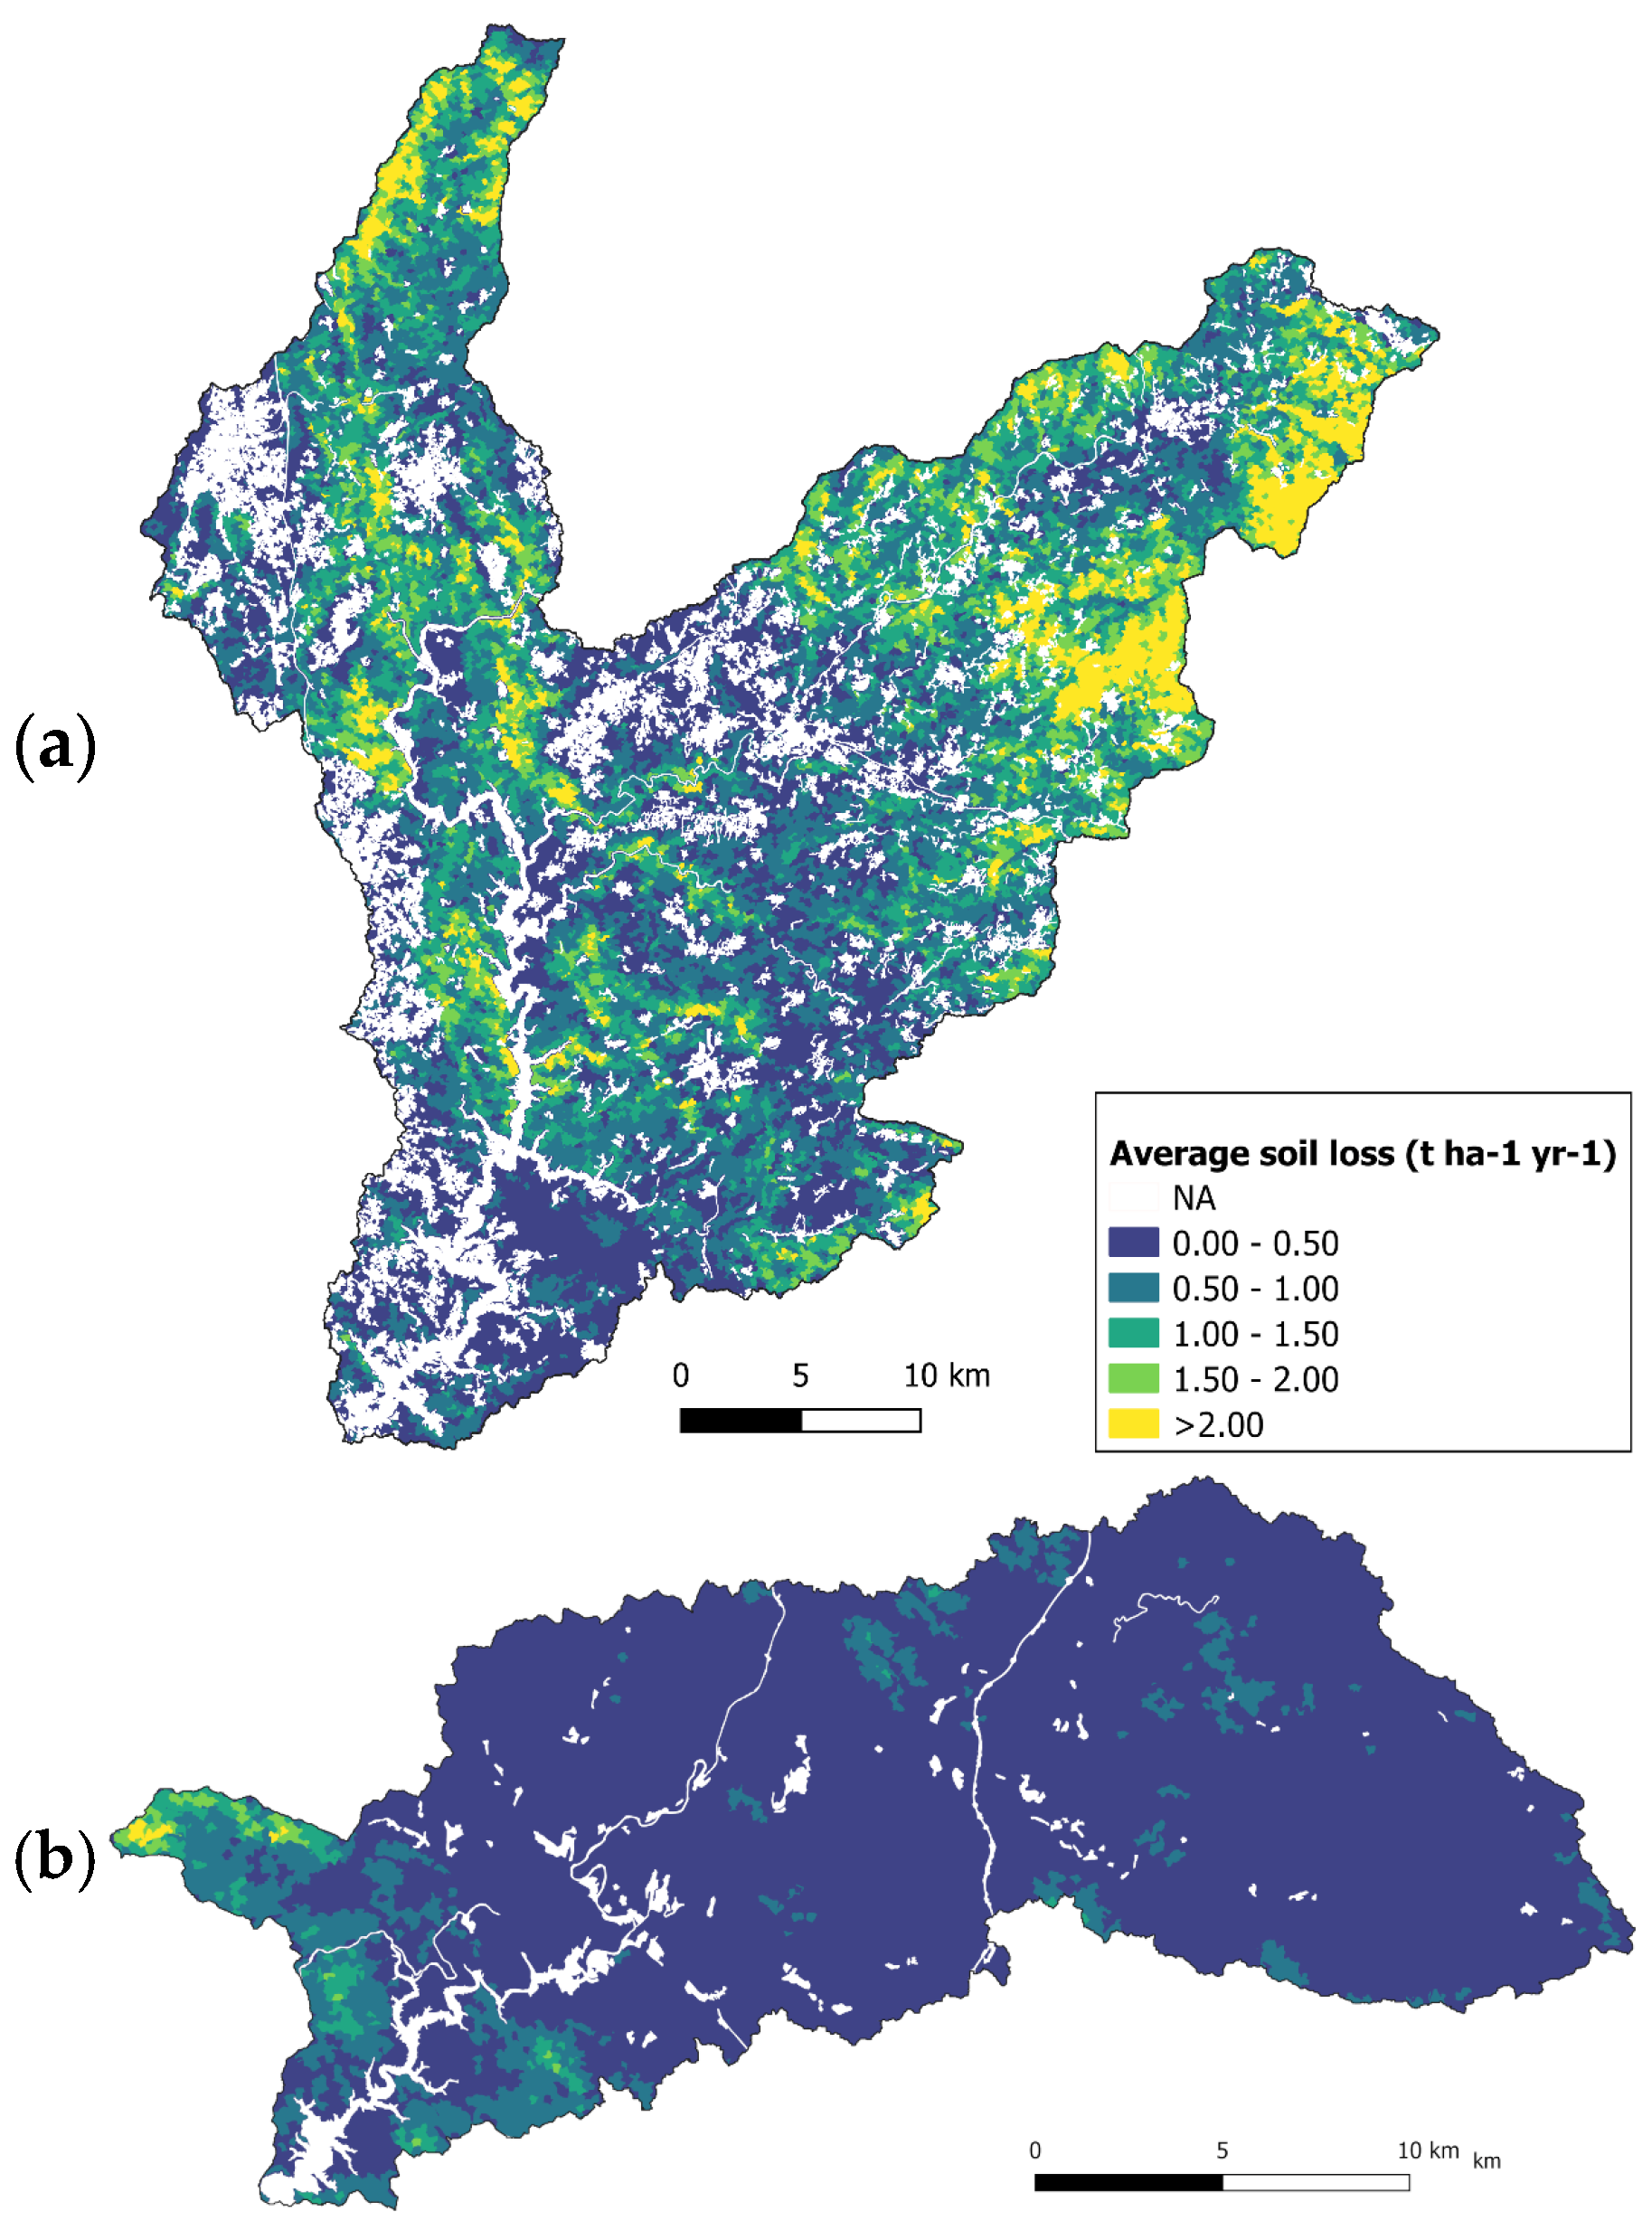
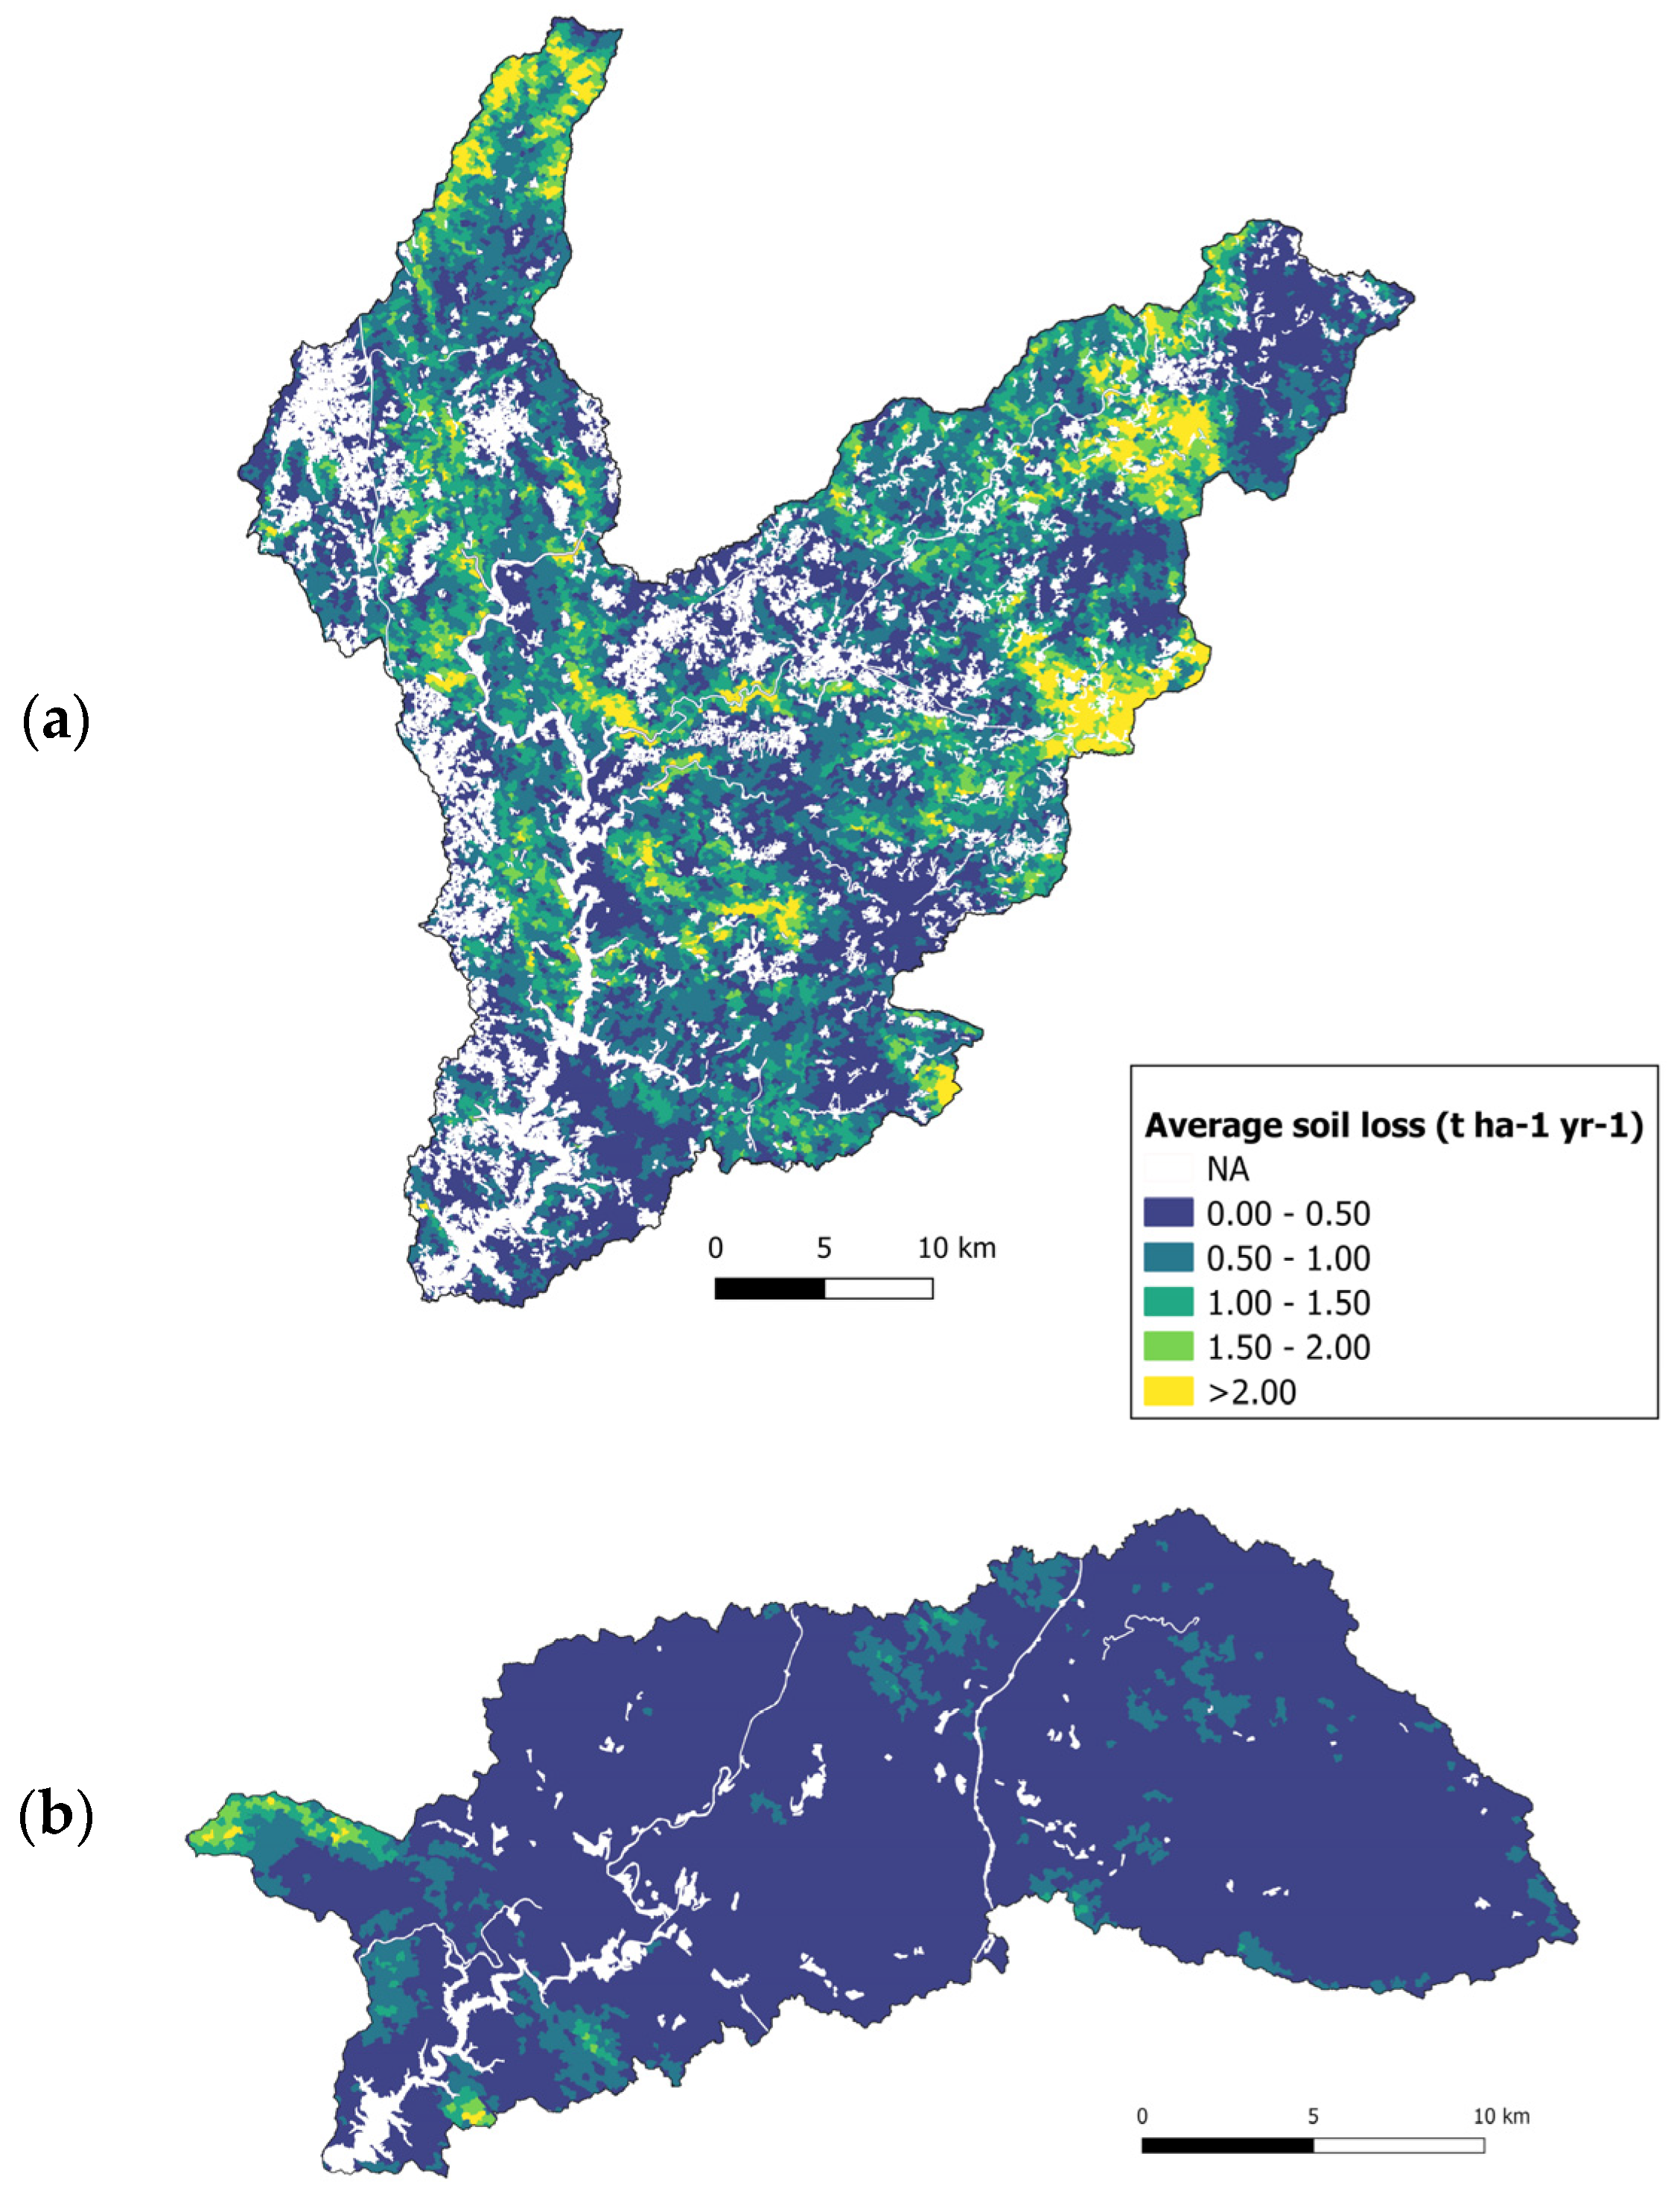
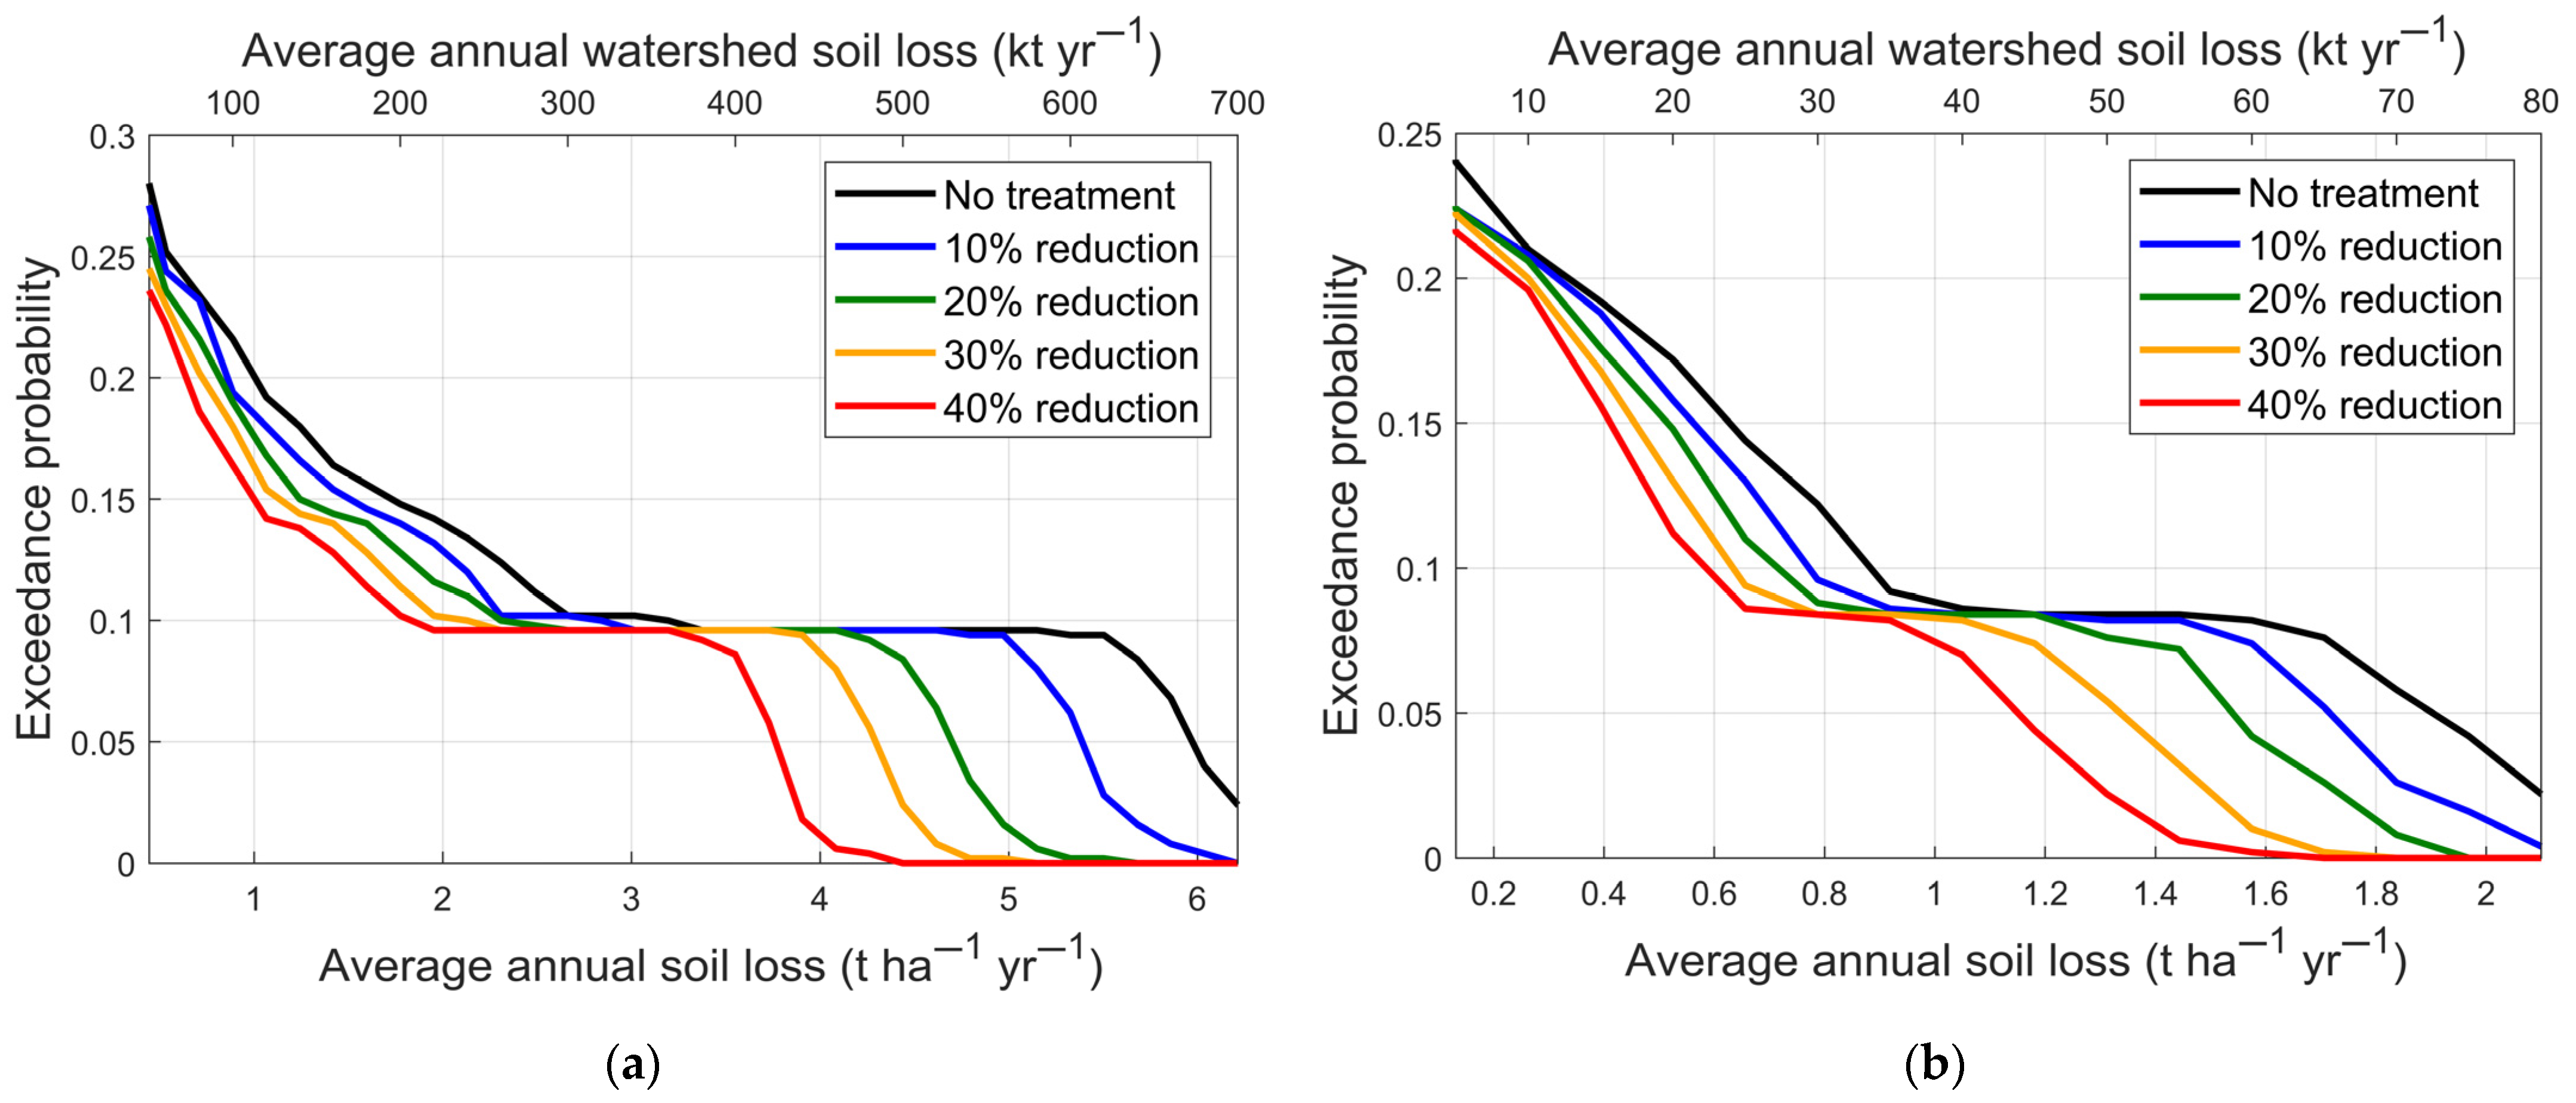
3.1. Effects of Wildfires on Soil Loss Without Treatments

The simulated average annual soil loss without pre- and/or post-fire treatments under the 2023 fuel scenario amounted to 0.86 t ha−1 yr−1, and 0.26 t ha−1 yr−1 for the Castelo de Bode and Odelouca watersheds, respectively. Under the 2030 fuel scenario, these figures increased by 13% and 5% for Castelo de Bode (0.98 t ha−1 yr−1) and Odelouca (0.27 t ha−1 yr−1), respectively. Average annual soil loss was approximately 3-fold larger for Castelo de Bode, when compared with Odelouca.
The annual soil loss was notably larger for the 5% most extreme fire seasons than the average across all fire seasons, for both watersheds and both fuel scenarios. Under the 2023 fuel scenario, for example, the 95% percentile of soil loss corresponded to 5.88 t ha−1 yr−1 for Castelo de Bode and to 1.95 t ha−1 yr−1 for Odelouca, values 7-fold larger than average.
Under the 2023 fuel scenario, Castelo de Bode had several erosion hotspots (i.e., >2 t ha−1 yr−1) that were dispersed across various parts of the watershed (Figure 2a). Considering the 2030 fuel scenario, additional hotspots were estimated in the north-eastern part of the watershed, reflecting fuel load accumulation in areas that were recently affected by very large wildfires (Figure A2a). Odelouca had comparatively few erosion hotspots under both fuel scenarios, and these were limited to the western part of the watershed (Figure 2b). Results were similar for the 2030 fuel scenario (Figure A2b). In both watersheds, the erosion hotspots coincided with eucalypt and/or pine forest or shrublands that were located on moderate to steep slopes (>10%) and, at the same time, were exposed to a moderate/high wildfire recurrence.

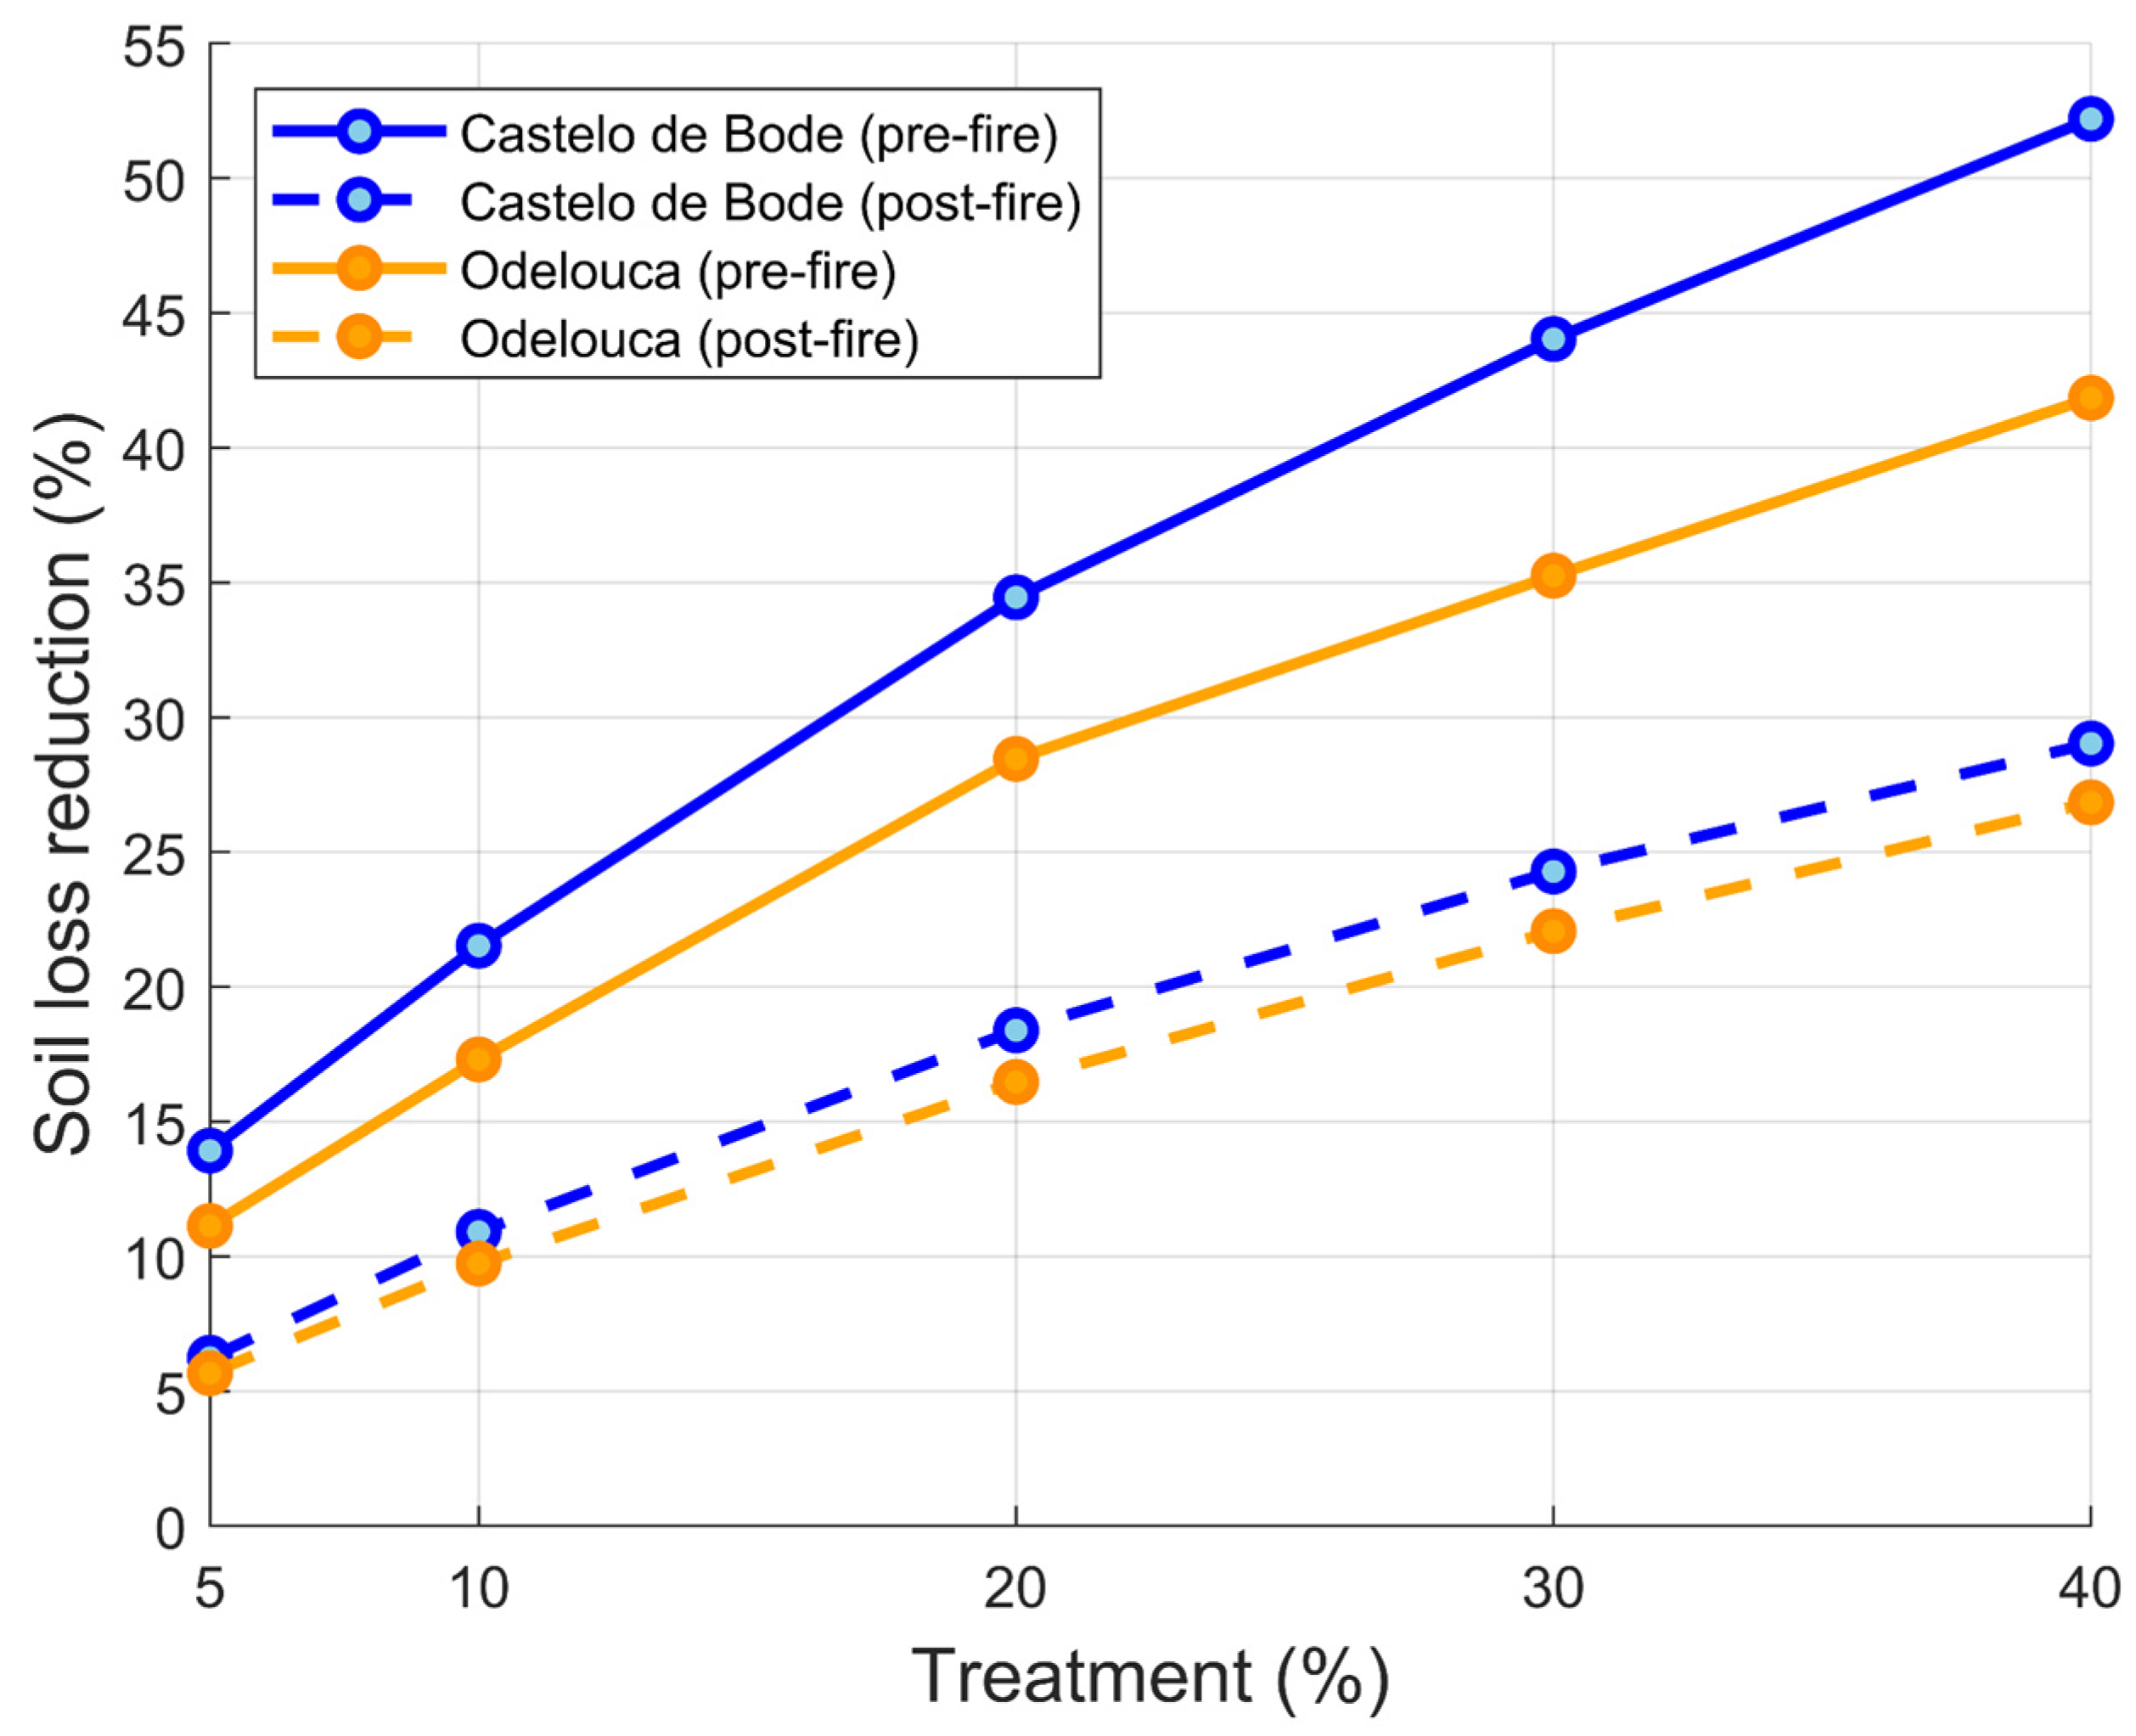
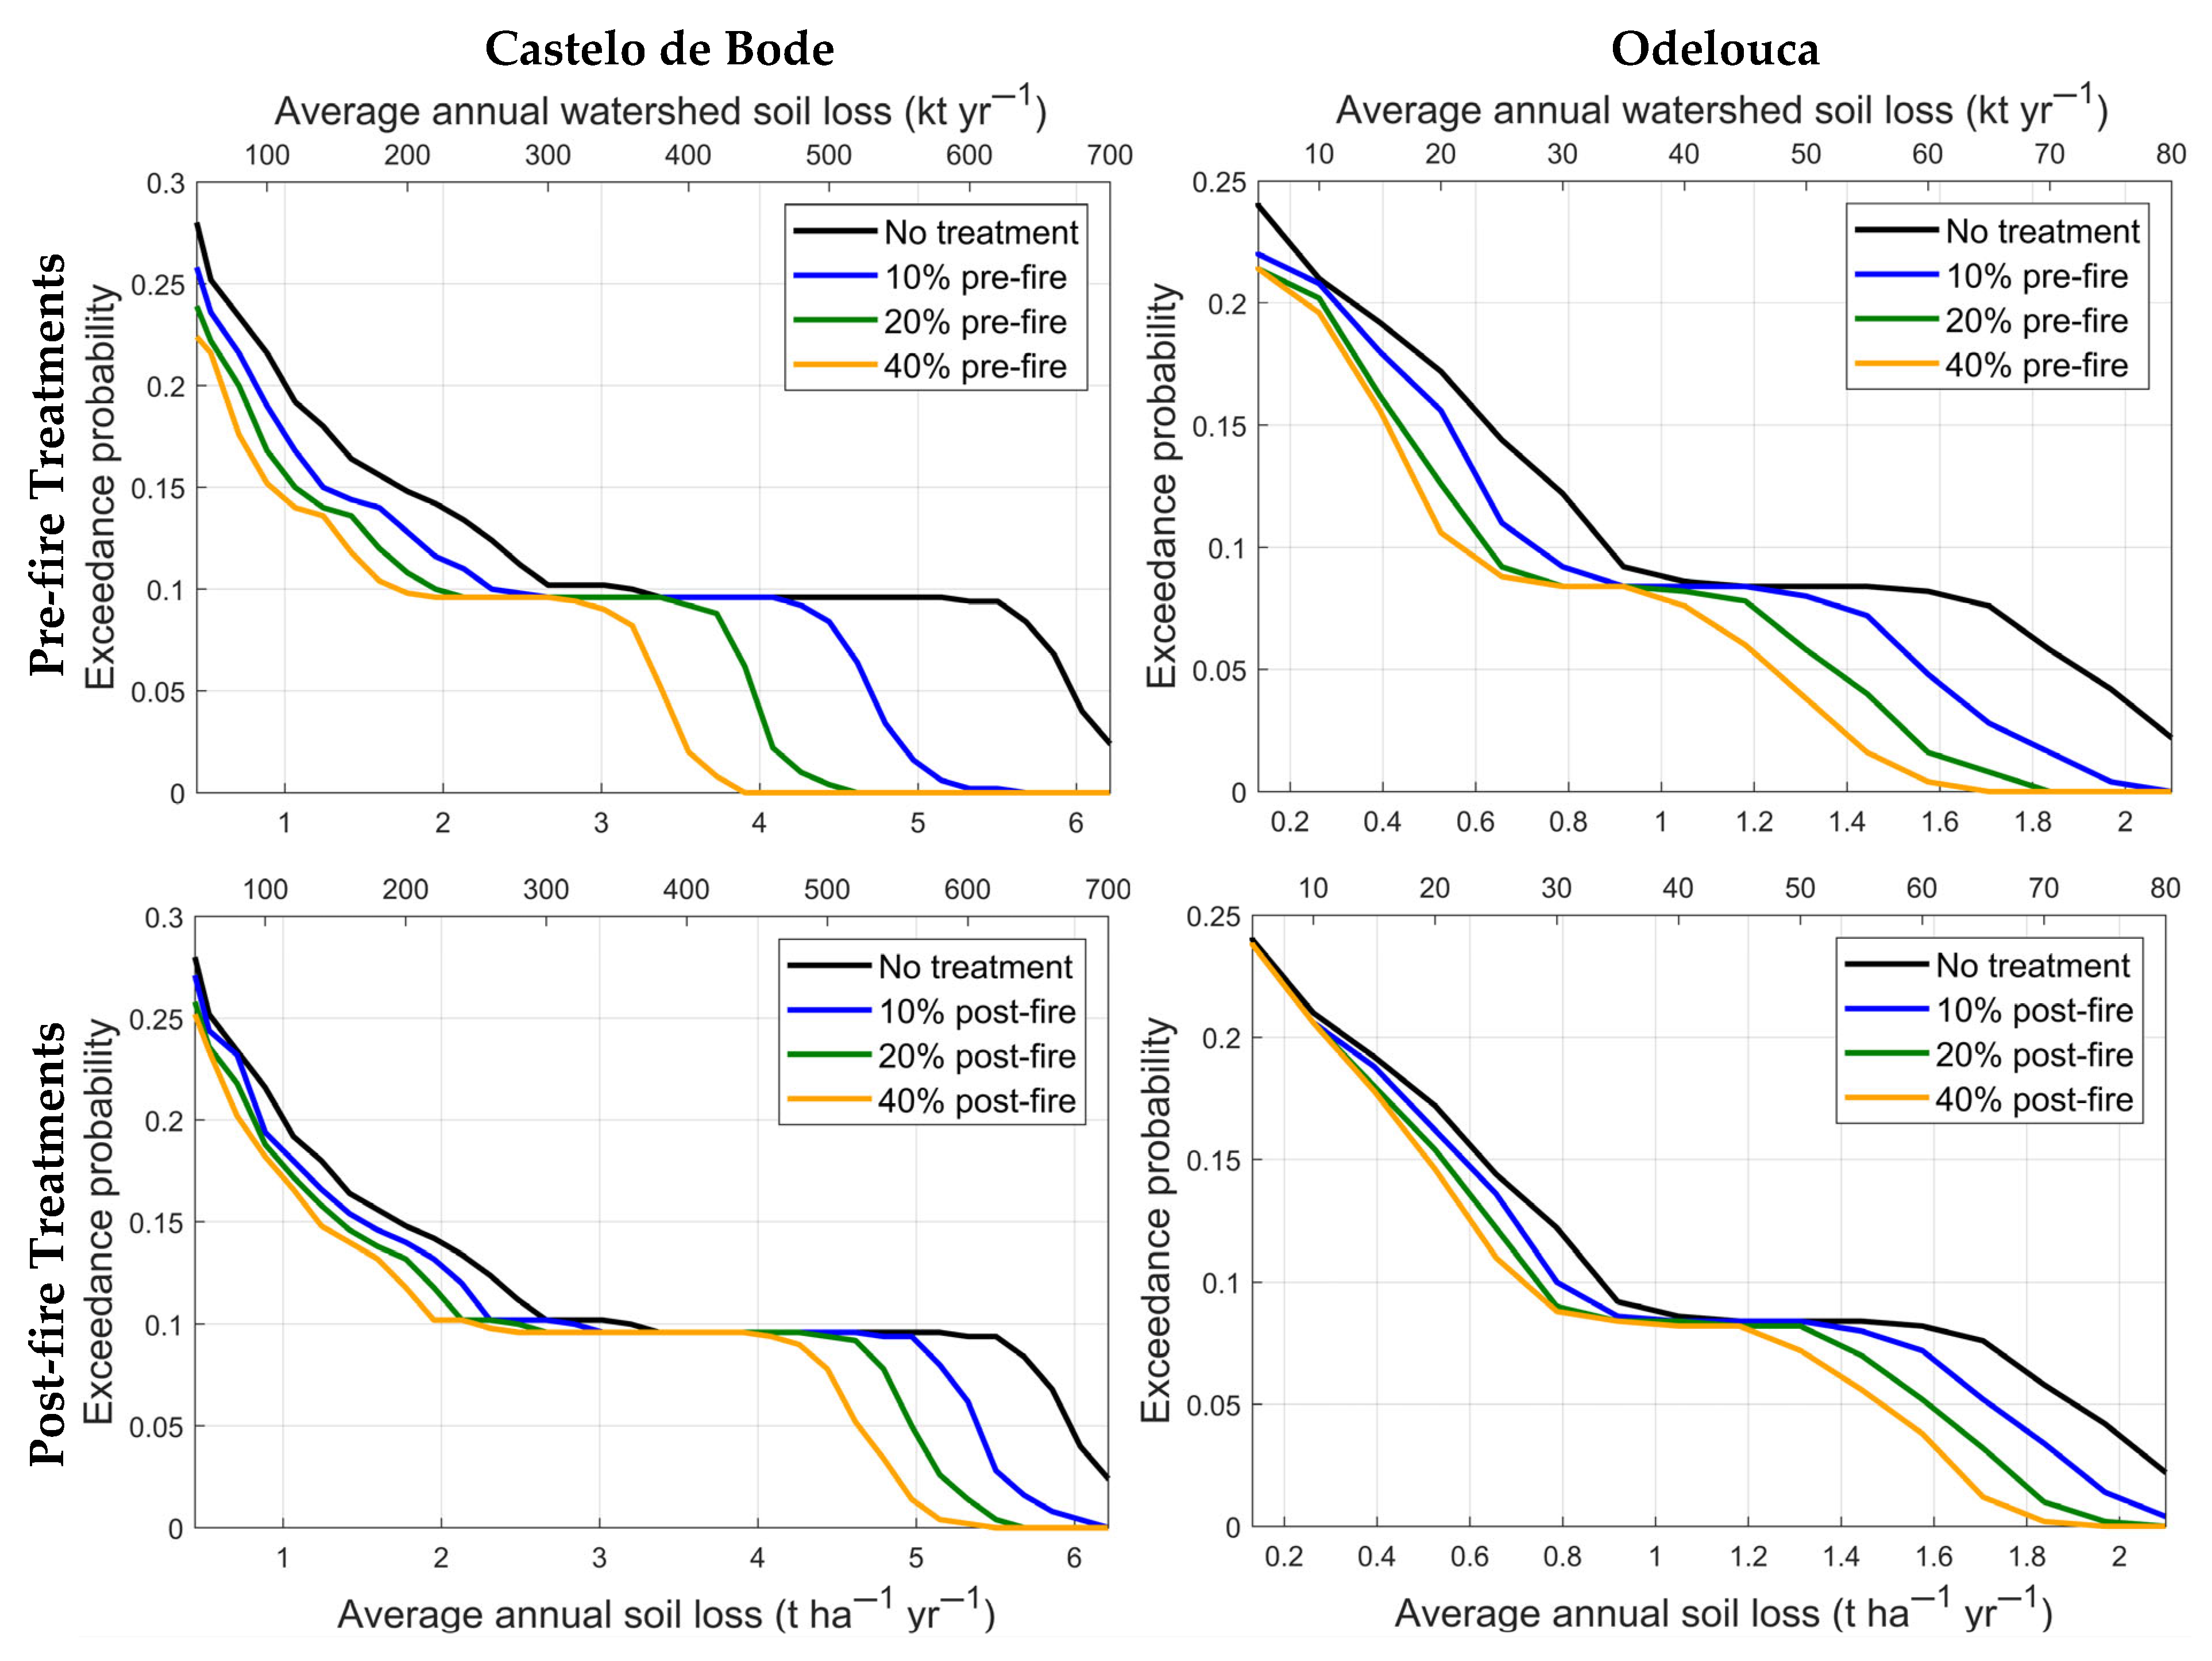
3.2. Effects of Treatments on Soil Loss Mitigation

In both watersheds, the two mitigation strategies increasingly reduced the average annual soil loss with increasing treatment extent. This was true for both fuel scenarios, as shown for the 2023 scenario in Figure 3 and for the 2030 scenario in Figure A3. In the case of the 2023 scenario, for example, the soil loss reduction in the pre-fire treatments was 3-4-fold higher at the 40% treatment extent than at the 5% treatment extent (Castelo de Bode: 52% vs. 14%; Odelouca: 42% vs. 11%). However, the marginal increase in soil loss reduction decreased with increasing treatment extent.
When comparing pre- and post-fire strategies, fuel treatments lead to the largest reduction in soil loss in both watersheds, ranging between 15% and 52% for Castelo de Bode and 11% and 42% in Odelouca, for 5% and 40% treatment extent, respectively. It is important to note that the annual treated area was higher for the pre-fire treatments when compared with the post-fire treatments (see Section 3.3, Table A3 and Table A6). Considering absolute values, a 20% pre-fire treatment extent lead to an average soil reduction of 20,251 t yr−1 in Castelo de Bode and 1655 t yr−1 in Odelouca. Fuel treatments also had indirect benefits of reducing burned area in- and outside the treated area. For example, a 20% of fuel treatment extent lead to 18% and 12% of burned area reduction in Castelo de Bode and Odelouca, respectively. Post-fire treatments reduced approximately 5% to 30% soil loss in both watersheds. Results for the 2030 fuel scenario were similar although with lower soil loss reductions for smaller treatment extents and larger reductions for larger treatment extents, particularly for Castelo de Bode (Figure A3).
The probability of exceeding extreme annual soil losses (defined as the 95th percentile—Section 2.5.3) decreased considerably when implementing pre-fire fuel treatments (Figure 4—top panel).
For Castelo de Bode, the probability of exceeding the 95% percentile of soil loss (i.e., 5.8 t ha−1 yr−1) decreased from 0.07 to 0 when treating 10% of the watershed. Considering lower soil loss thresholds, the probability of exceeding a soil loss larger than 2 t ha−1 yr−1 decreased by 0.02 and 0.04 for 10 and 20% pre-fire treatment extent, respectively. With larger treatment extents, this decrease in exceedance probability shifted to lower annual soil loss values.
For Odelouca, the patterns were similar but with smoother patterns due to the fire regime. The probability of exceeding the 95% percentile of soil loss (i.e., 1.95 t ha−1 yr−1) decreased from 0.045 to 0.005 when treating 10% of the watershed. The probability of exceeding a 1.6 t ha−1 yr−1 average soil loss decreased by half when 10% of the watershed was treated, and to values close to 0 for larger treatment extents. The impact of post-fire treatments on the exceedance probability was similar to pre-fire treatments, but with smaller decreases in probability (Figure 4—bottom panel). For example, for Castelo de Bode, the pronounced reduction in probability of exceedance started at values approximately 4 t ha−1 yr−1 for post-fire treatments, contrasting with values approximately 3 t ha−1 yr−1 regarding the pre-fire treatments.

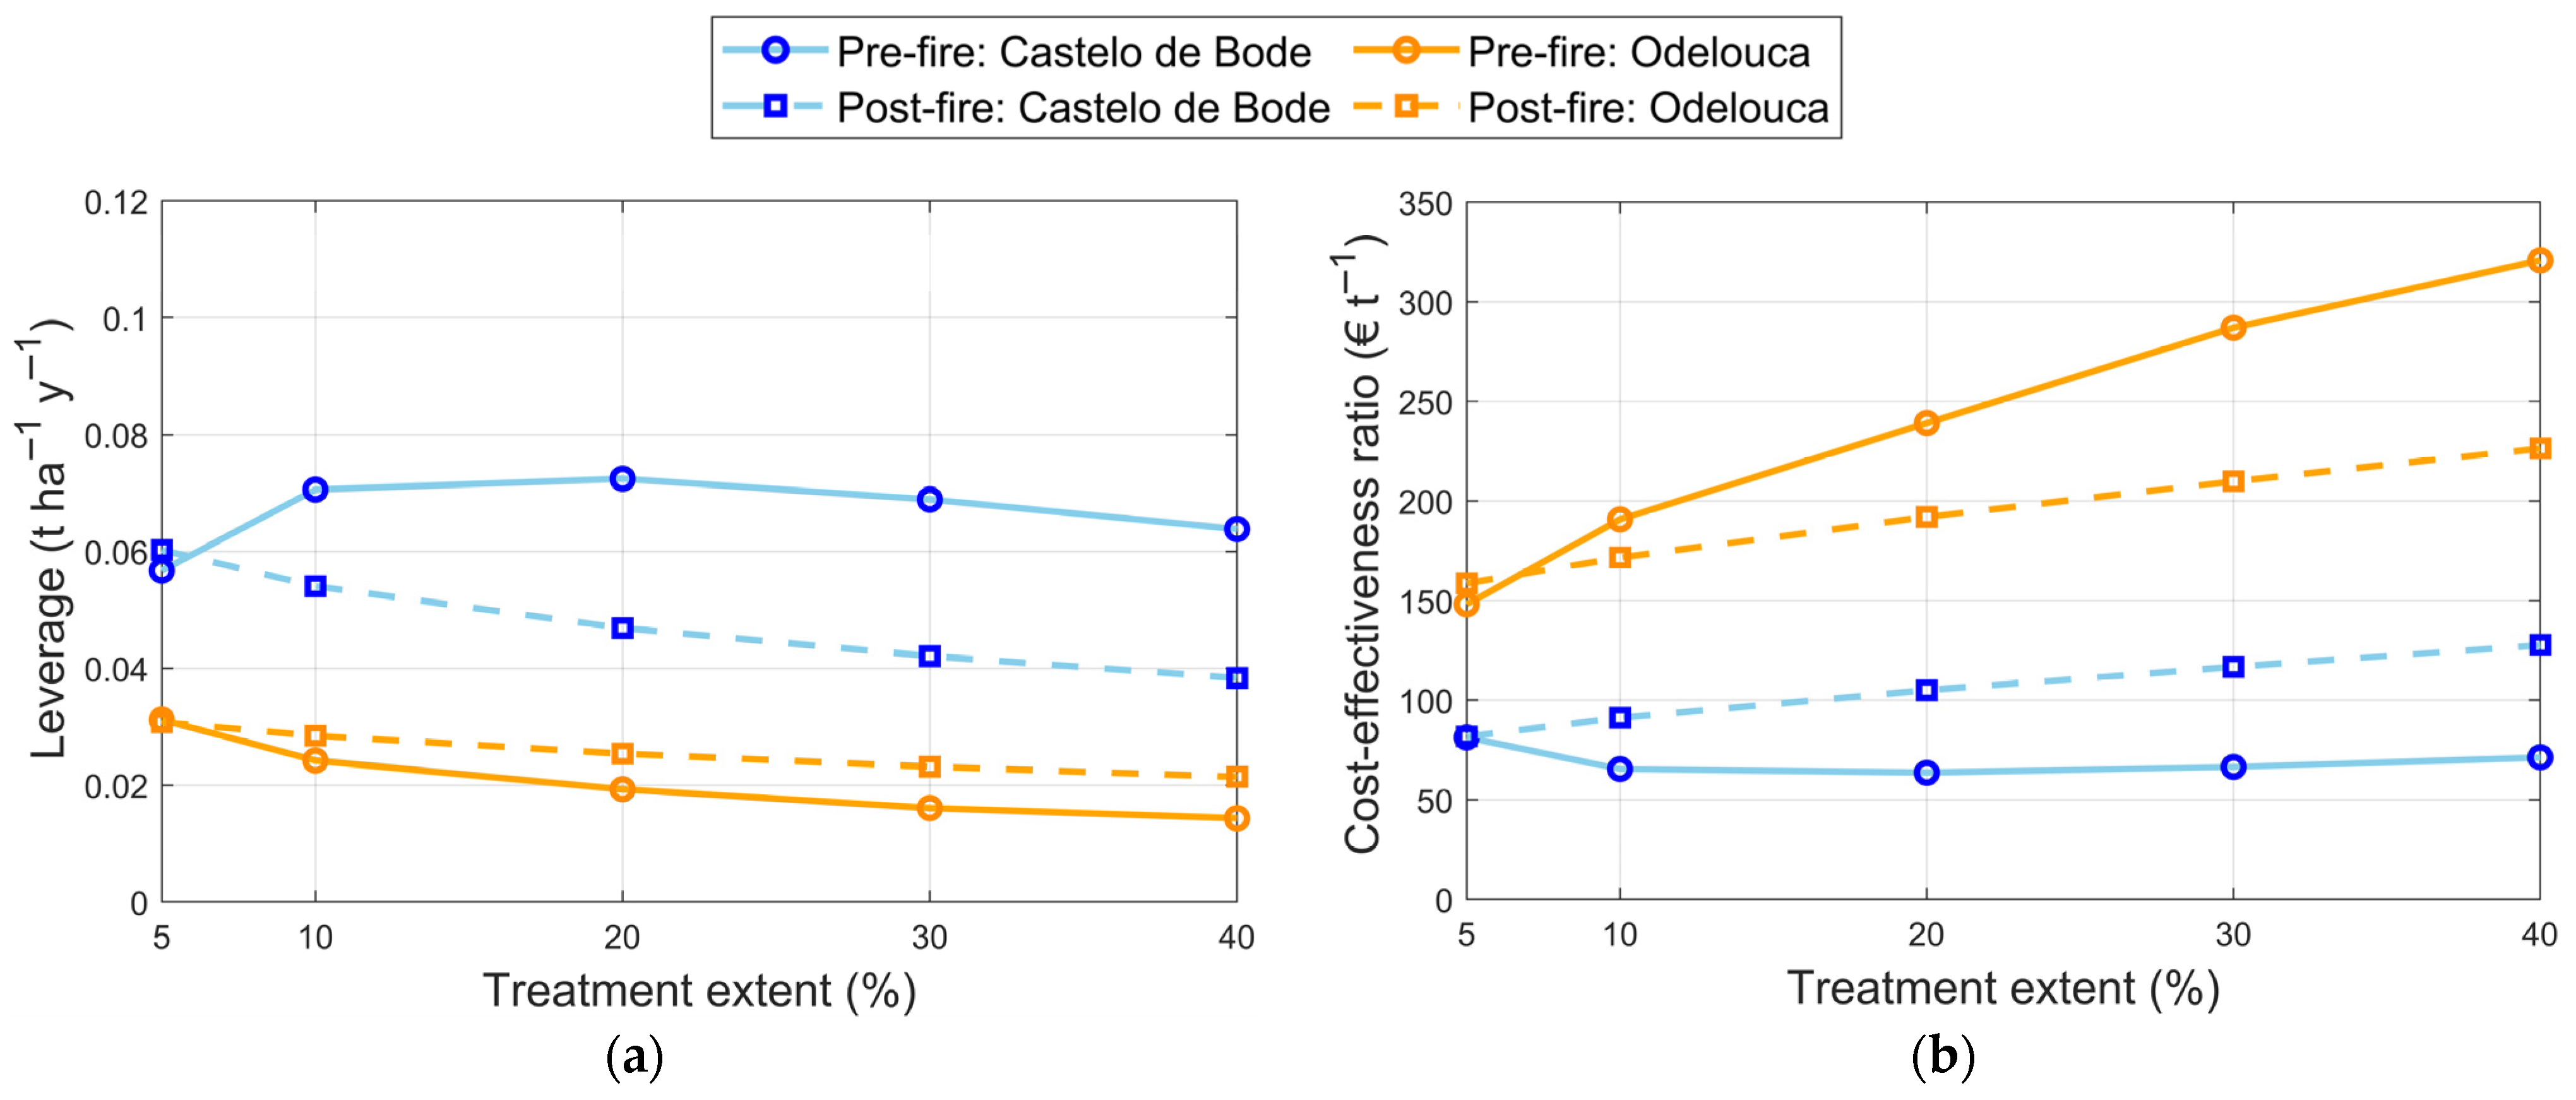
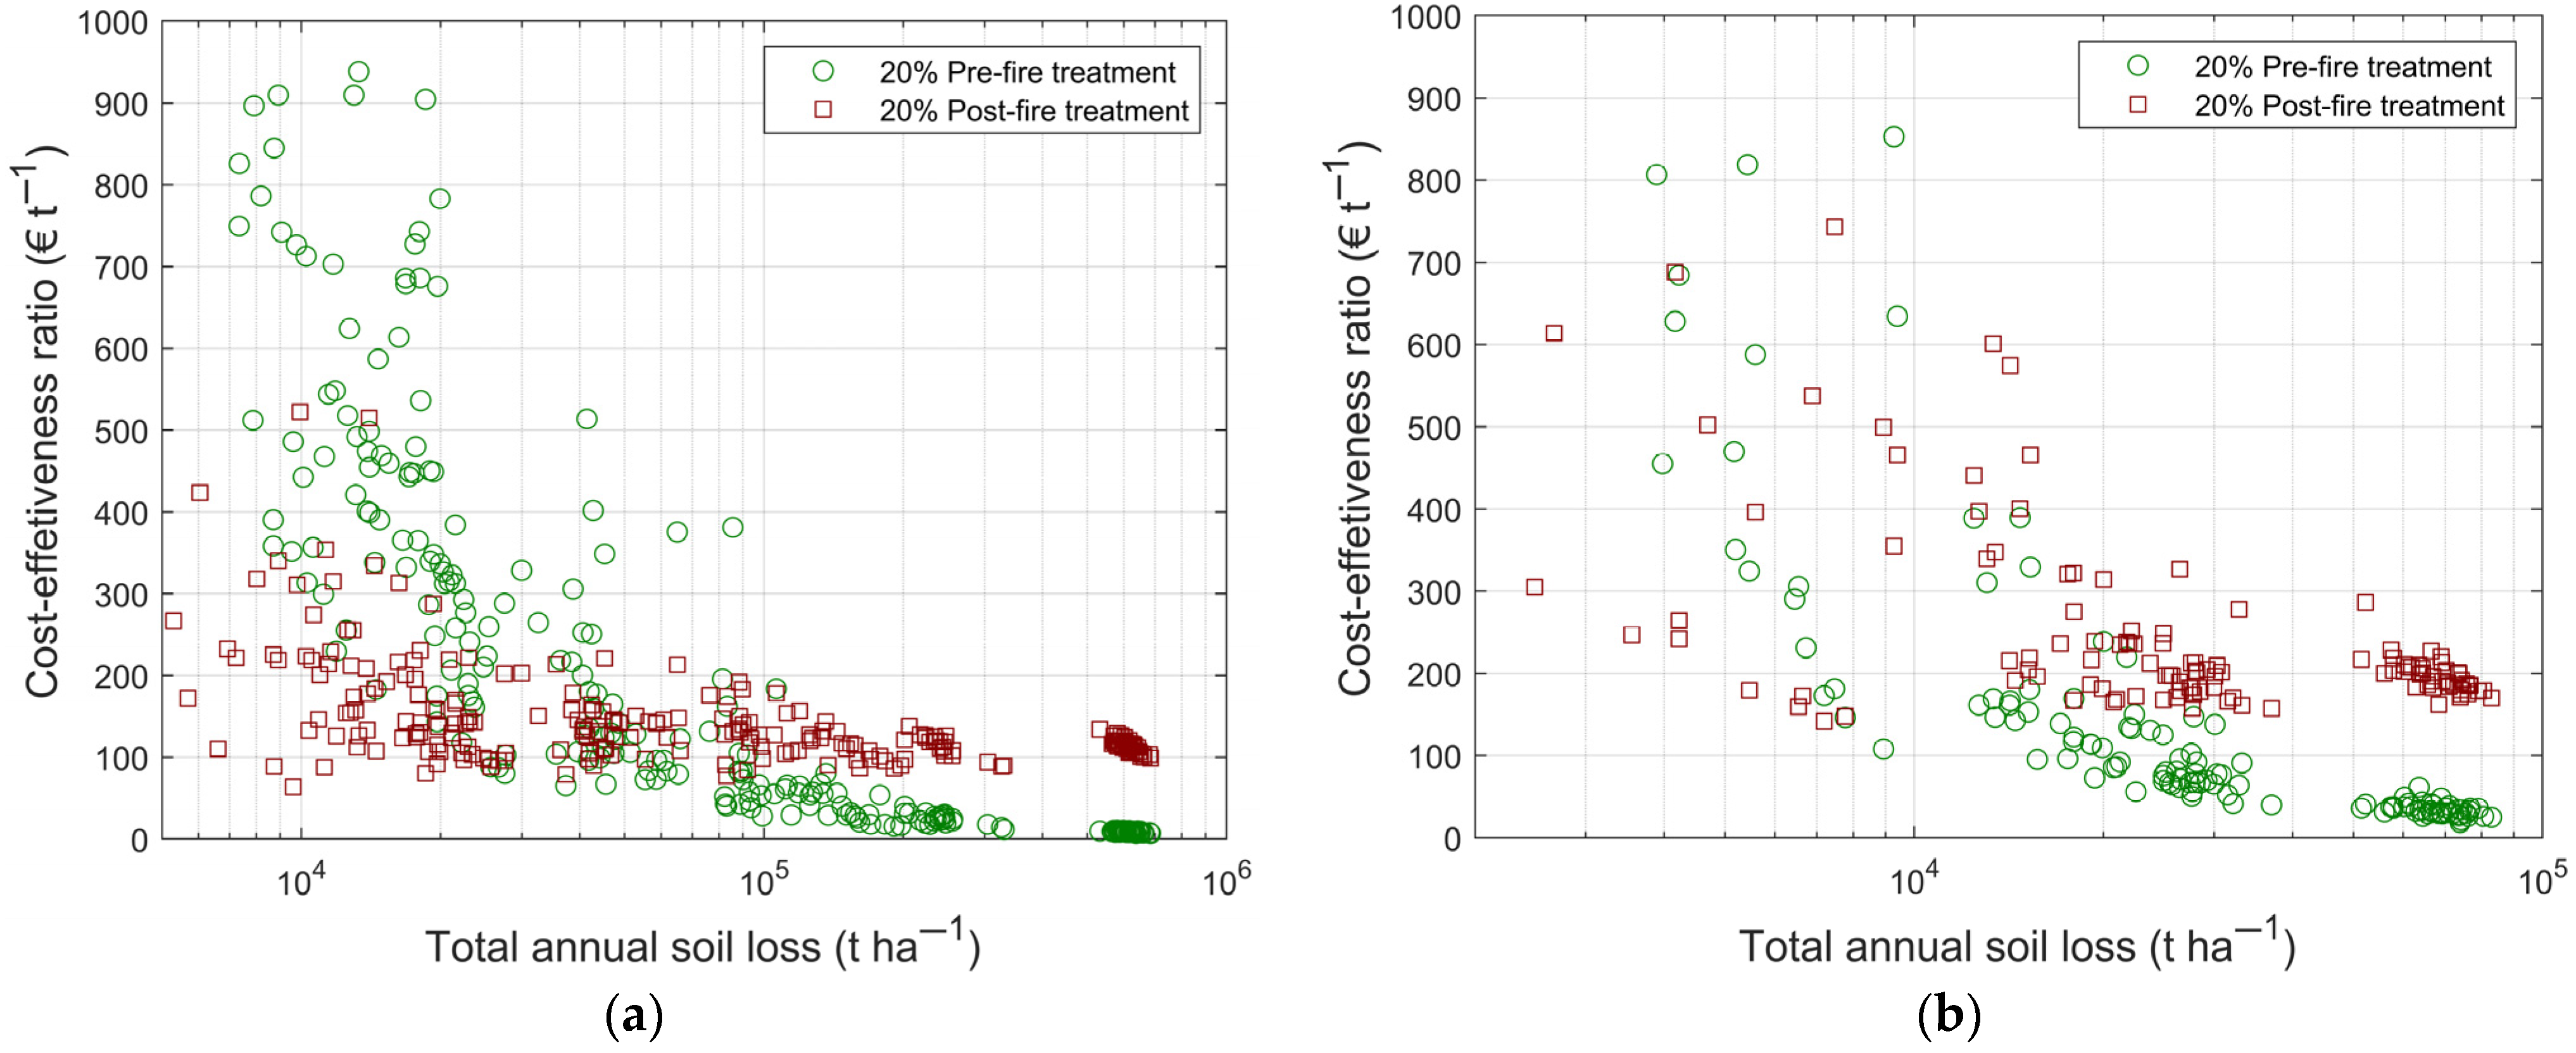
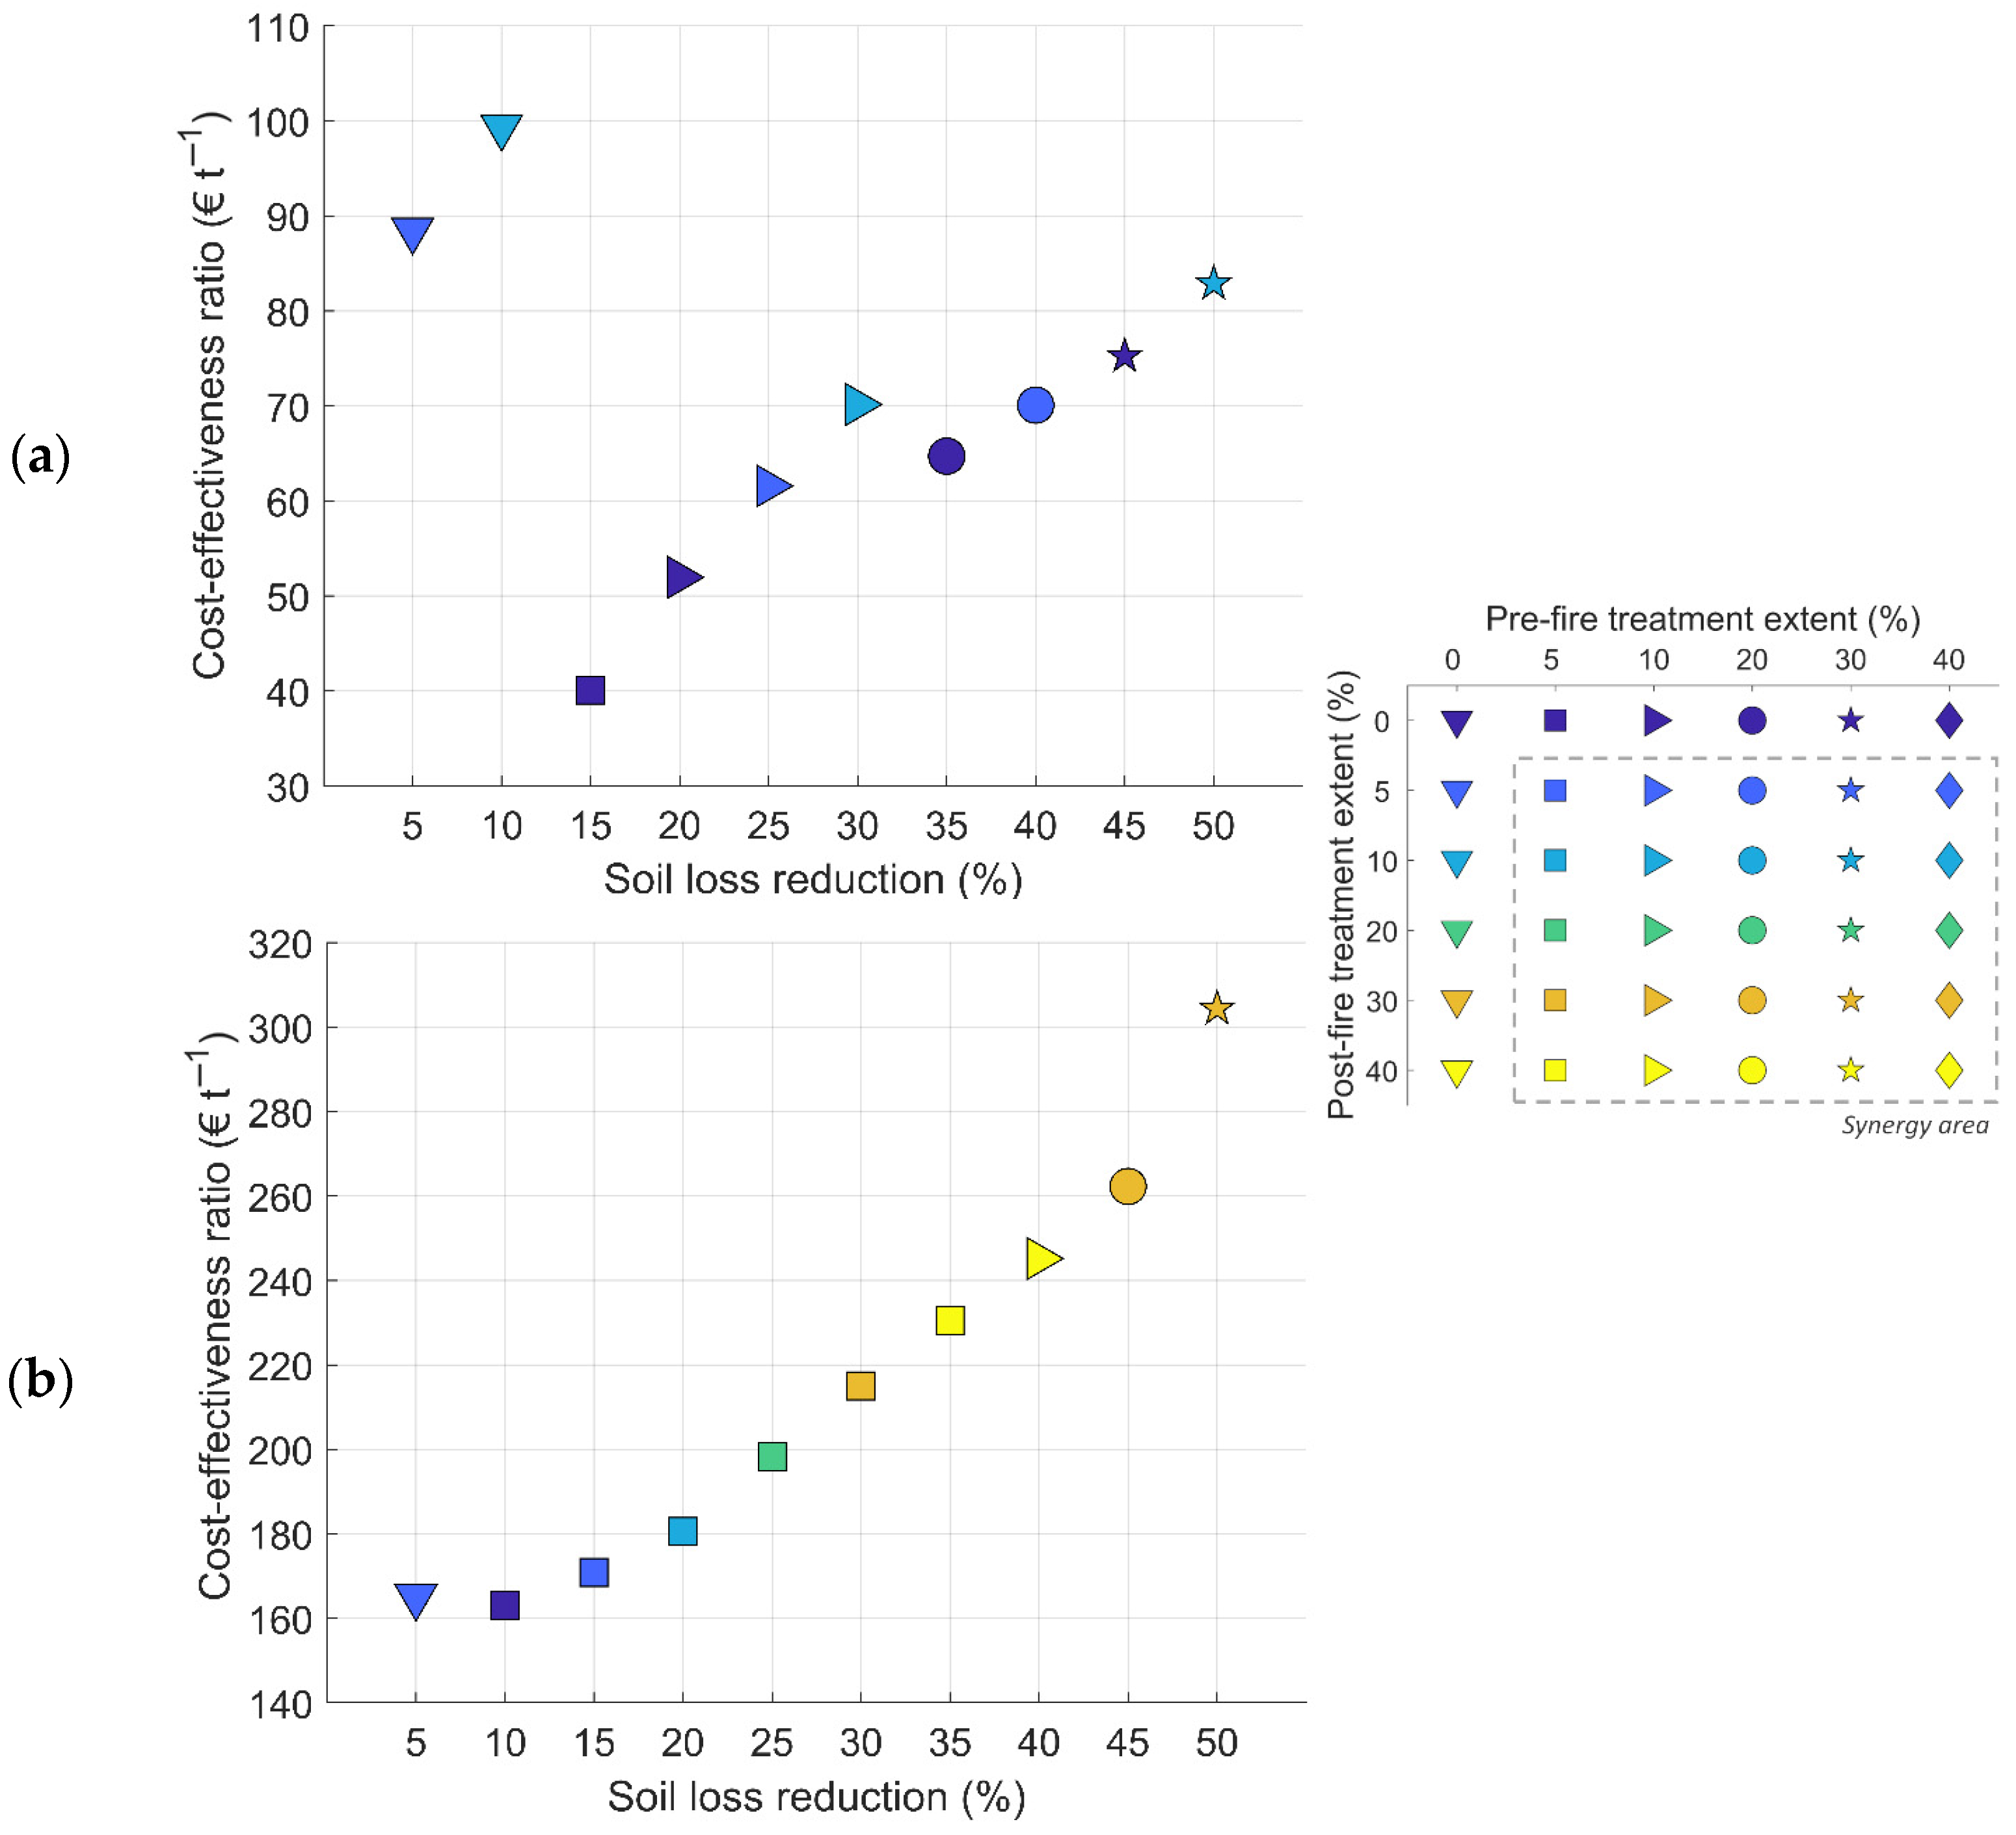
3.3. Effectiveness of Soil Loss Mitigation Treatments

The treatment strategy with highest leverage varied among the two watersheds (Figure 5a). Leverage decreased with treatment extent. For Castelo de Bode, pre-fire treatments of a specific extent were 1.5- to 2-fold times more effective than post-fire treatments of the same extent. The maximum leverage was attained for 5% pre-fire treatment extent reaching ~0.12 t ha−1 yr−1. Results were similar for the 2030 fuel scenario with slightly lower leverage for the smaller pre-fire treatment extents (Figure A4a).
For Odelouca, treatment leverage was 2- to -fold smaller than for Castelo de Bode and was similar for both treatment strategies, although slightly higher for post-fire treatments. For example, a 10% pre- or post-fire treatment had a leverage of 0.2−0.3 t ha−1 yr−1. Results were similar for the 2030 fuel scenario (Figure A4a).
Regarding cost-effectiveness ratio, the cost per ton of reduced soil loss increased with treatment extent for both watersheds. The most cost-effective strategy depended on the watershed (Figure 5b). The cost-effectiveness ratio was 2- to 3-fold lower in Castelo de Bode when compared with Odelouca. For Castelo de Bode, the most cost-effective strategy was pre-fire fuel treatments, whereas post-fire treatments had an additional cost of ~50 EUR t−1, regardless of treatment extent. On the other hand, for Odelouca the most cost-effective strategy was post-fire treatments for extents larger than 10%. The cost difference between pre- and post-fire treatment increased with treatment extent, varying from 0 EUR t−1 for the 5% treatment extent (i.e., the same cost-effectiveness) to almost 100 EUR t−1 for the 40% treatment extent. Results for both watersheds were similar for the 2030 fuel scenario (Figure A4b), except for the lower treatment extents (5 and 10%).
Figure 6 shows that the annual variation in the treatment cost-effectiveness ratio was considerably large, contrasting with the average values presented in the analysis above (Figure 5b). For both study areas, variability was much higher for years with lower annual soil loss and decreased significantly with increasing annual soil loss, that in turn was driven by the increase in annual burned area. Pre-fire treatments had cost-effectiveness ratios higher than post-fire treatments for lower annual soil loss, especially for Castelo de Bode (Figure 6a). With increasing annual soil loss, the cost-effectiveness ratio of pre-fire treatments decreased and reached values lower than the ones for post-fire treatments. The annual soil loss value where this “cross-over” occurs depended on the study area.

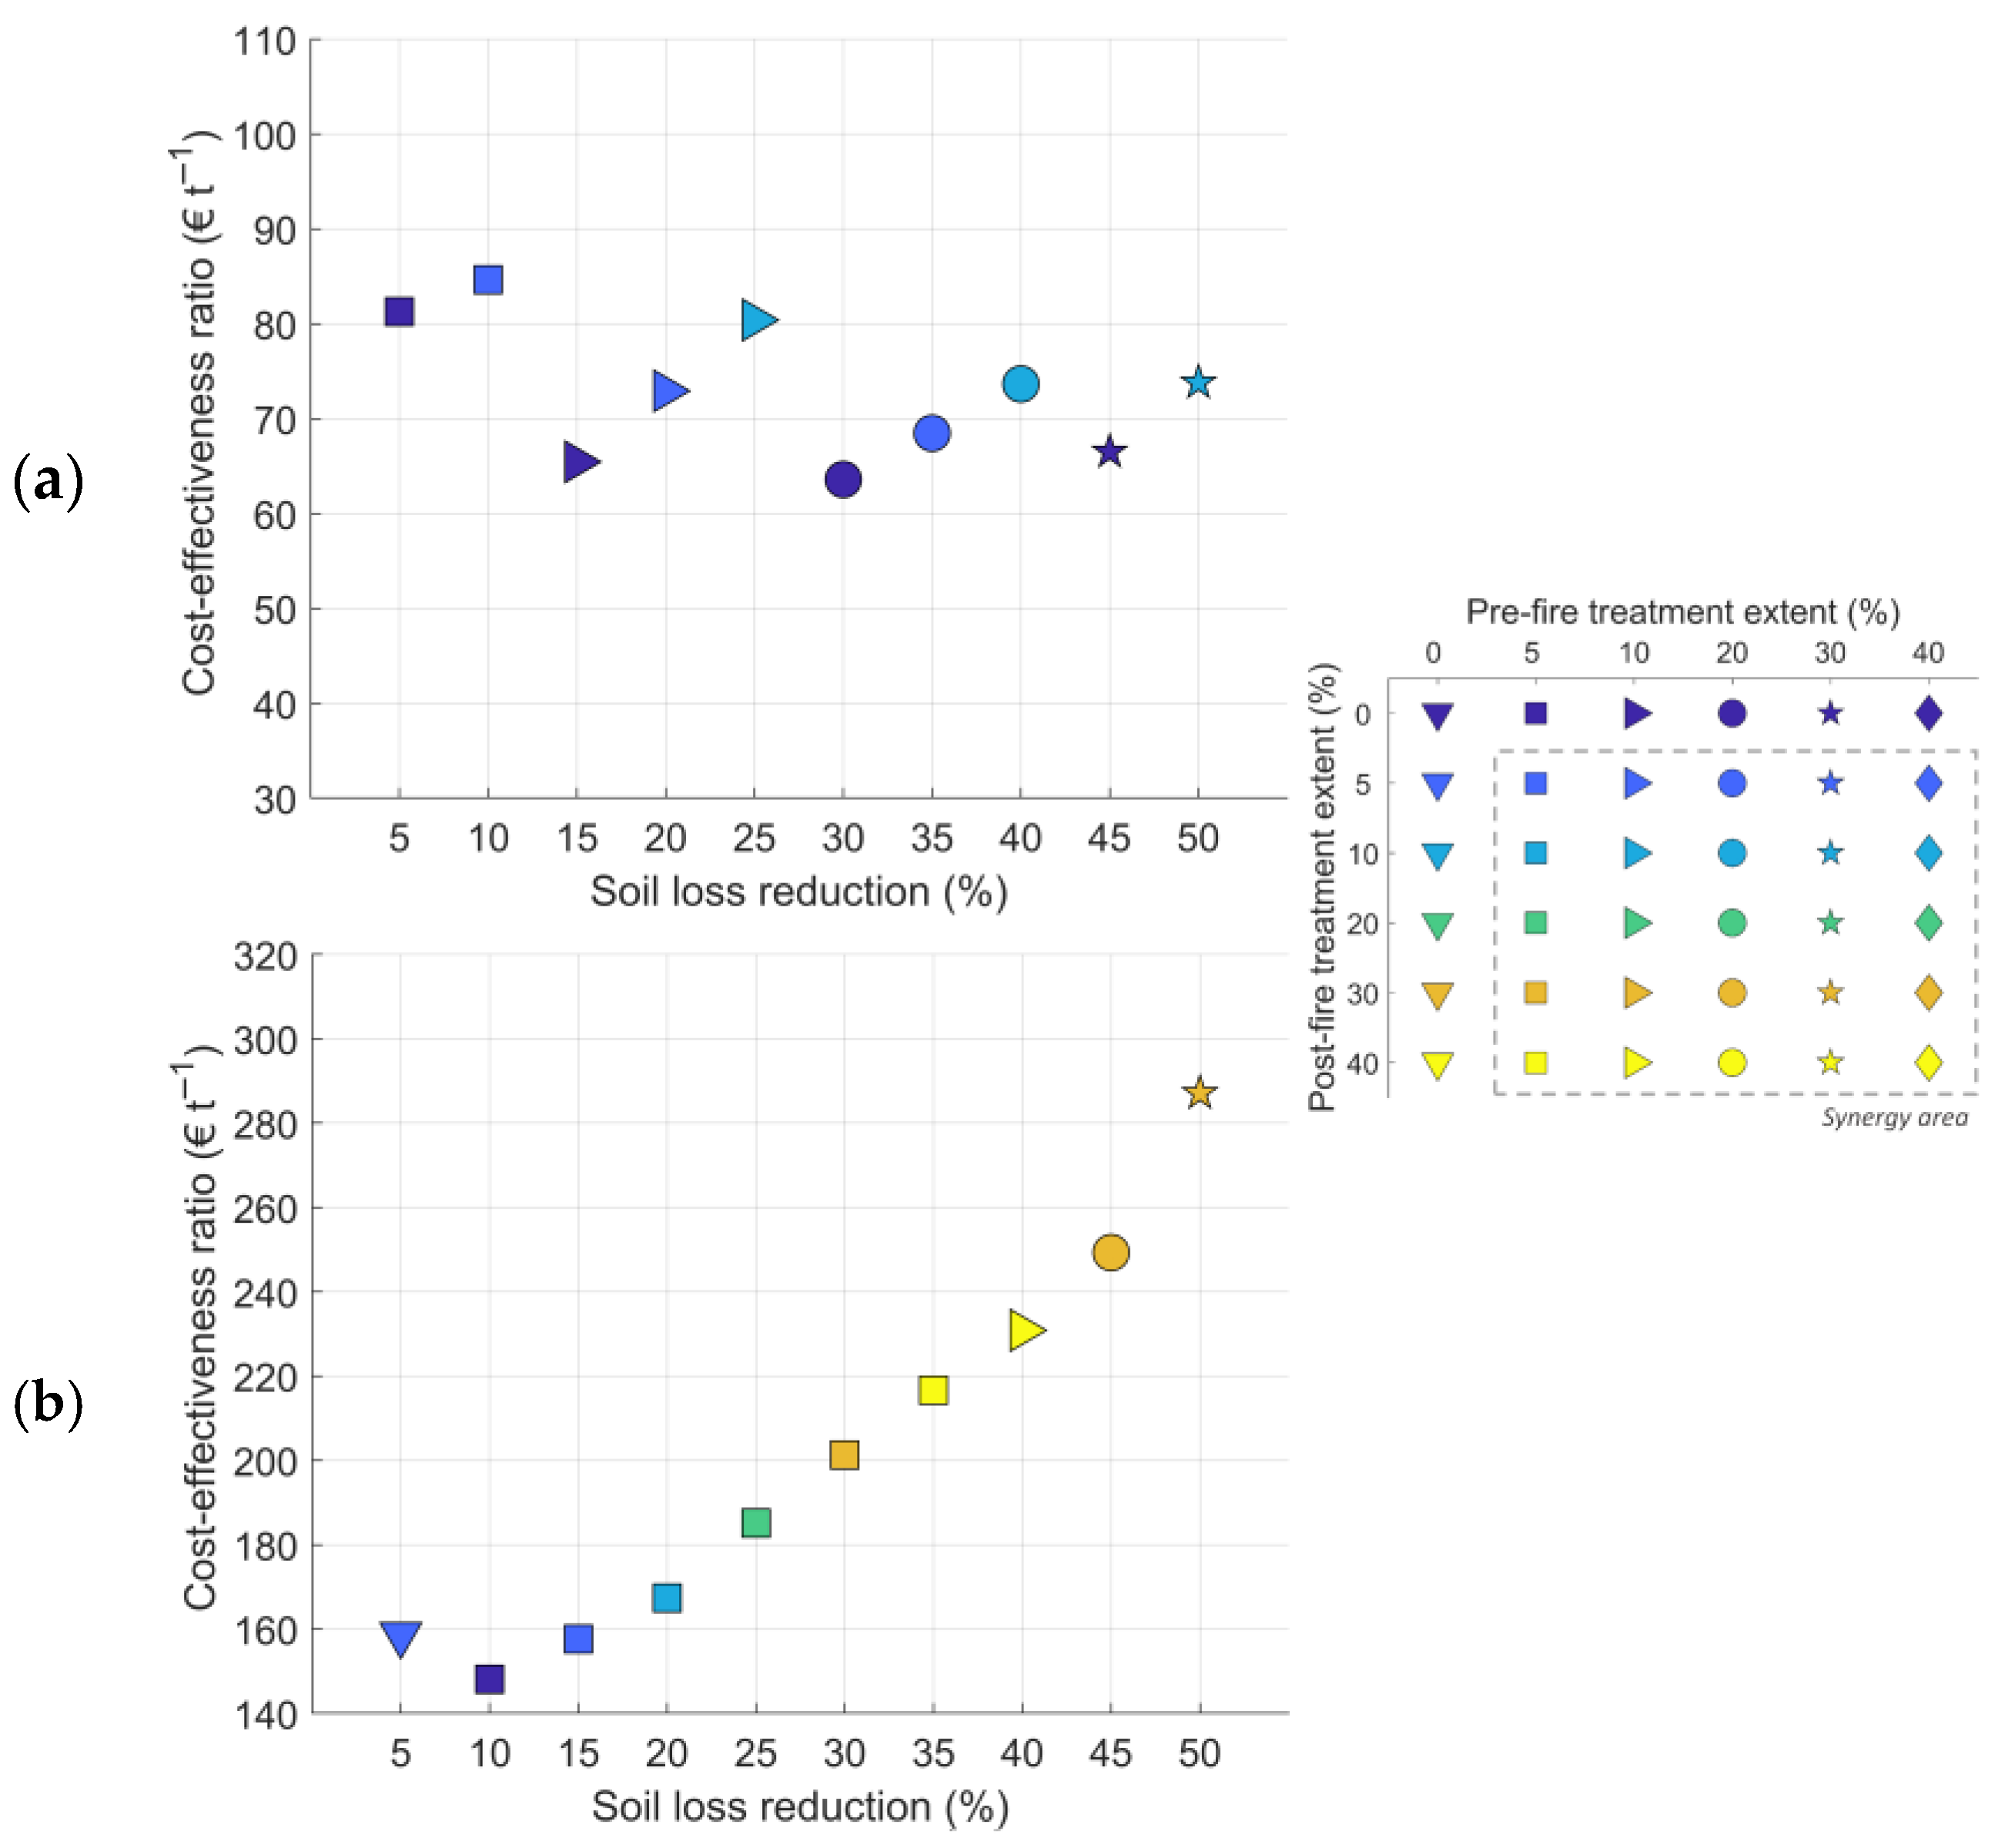
3.4. Potential Synergies Among Different Treatment Strategies

The most cost-effective combination of pre- and post-fire treatment extents varied with the soil loss reduction target and the watershed (Figure 7). For Castelo de Bode, the most cost-effective solutions included combinations of low post-fire treatment extents (up to 10% of treated burned area) with increasing pre-fire treatment extents that ranged from 0 to 30% (Figure 7). For example, to reduce 30% of post-fire soil loss at the watershed level, the most cost-effective solution (70 EUR t−1) resulted from combining 10% pre- and 10% post-fire treatment extent. Achieving higher reductions in a cost-effective way required higher pre-fire treatment extents. Cost-effectiveness ratios ranged from 40 to 100 EUR t−1, increasing moderately with increasing reduction targets. There were two notable exceptions for the 5 and 10% reduction goals, which result from caveats due to the small number of treatment extents considered. The results regarding the 2030 fuel scenario show a different pattern as the cost-effectiveness ratios tended to generally decrease with increasing soil reduction objectives, due to the increase in soil loss compared with the 2023 fuel scenario (Figure A5a).
For Odelouca, the most cost-effective combinations resulted from relatively low pre-fire treatment extents (mostly between 0 and 10%) and high post-fire treatment extents that increase with soil loss reduction goals (Figure 7b). The most ambitious reduction targets are all associated with post-fire treatment extents larger than 30%. Cost-effectiveness ratios range from 160 to 300 EUR t−1, increasing sharply with increasing soil reduction objectives. Compared with Castelo Bode, not only is the increase significantly steeper, as well as the cost-effectiveness ratios are considerably higher (2 to 3 fold). The results regarding the 2030 fuel scenario are similar; however, the cost-effectiveness ratios are slightly smaller due to the slight increase in soil loss (Figure A5b).
A synergistic effect occurs when the combination of pre- and post-fire treatments leads to an amplified outcome that exceeds what would be expected from their independent contributions. Thus, the most cost-effective solutions shown in Figure 7 that are not associated with a 0% pre- (i.e., down-pointing triangles) or post-fire (dark blue) treatment extent, represent a synergy. For Castelo de Bode, the synergist effect was low as most reduction targets were attained for 0% pre or post-fire treatment extent. However, the 30% reduction target was best achieved by combining 10% pre- and post-fire treatment extents, for example. For Odelouca, the synergistic effect was considerably higher than Castelo de Bode. The attainment of soil loss reduction targets larger than 10% was always best achieved by combining varying extents of both pre- and post-fire treatment strategies.
Figure 8 compares the exceedance probability curves of the no-treatment scenario with the most cost-effective combination of pre- and post-fire treatments that lead to the attainment of specific soil reduction targets at the watershed level. For Castelo de Bode, the combinations of treatments allowed up to a 0.04 reduction in the probability of exceeding a 2 t ha−1 yr−1 soil loss (Figure 8a). Effects were more significant for the highest annual soil loss values. For example, in the no-treatment scenario, the 0.05 exceedance probability was associated with an average loss of ~6 t ha−1 yr−1, that decreased progressively to less than 4 t ha−1 yr−1 with increasing reduction objectives. For Odelouca, the combinations of treatments allowed up to a 0.06 reduction in the probability of exceeding a 0.6 t ha−1 yr−1 soil loss (Figure 8b). Similar to Castelo de Bode, effects were more pronounced for the highest annual soil loss values. For example, the 0.05 exceedance probability was associated with an annual loss of 1.9 t ha−1 yr−1 (no-treatment scenario) that decreased progressively to approximately 1.1 t ha−1 yr−1 with increasing reduction objectives.

4. Discussion

4.1. Effects of Wildfires on Soil Loss

We estimated the annual wildfire-induced soil loss for two watersheds in Portugal with different landscape and fire regime characteristics. Results showed that average annual soil loss was approximately 3-fold higher in Castelo de Bode when compared with Odelouca owing to the much higher frequency of large and severe wildfires in the former watershed. For example, in the last 20 years 10 wildfires larger than 1000 ha affected the Castelo de Bode watershed, while only 3 affected Odelouca in the same period [37]. Following the occurrence of recent large wildfires, fuel load is expected to increase in the next years. We estimate this will increase the average annual soil loss by 13% and 5% for Castelo de Bode (0.98 t ha−1 yr−1) and Odelouca (0.27 t ha−1 yr−1), respectively. The increase is expected to be larger in Castelo de Bode due to the occurrence of very large wildfires in 2019 and 2020 [37]. While the average annual soil loss estimate provides a useful summary metric, it may mask the influence of extreme years (defined as the percentile 95) where annual soil loss could be as much as 7-fold higher than average. These large differences were determined by fire regime, in particular the occurrence of a few years with very large burned extent. Consequently, reliance on mean values alone can lead to oversimplified interpretations, and results should be interpreted with caution. These nuances need to be carefully considered by managers when making watershed-level decisions.
Our average annual post-fire soil loss estimates were within [7,69,70] and/or below [71,72] the values reported for Mediterranean areas. The work of Parente et al. [72] implemented a different soil erosion model and highlighted the uncertainties caused by rainfall datasets. Vieira et al. [71] used satellite-derived data, including burn severity indices, to estimate post-fire erosion following the 2017 fire season. Both works suggest much higher soil loss values for central Portugal than the ones estimated here, especially for extreme years.

4.2. Impact of Soil Loss Mitigation Strategies

Our results showed that, separately, both pre- and post-fire strategies can significantly reduce post-fire soil loss, with effects increasing with treatment extent. Considering a benchmark of 20% pre-fire treatment extent [73], average annual soil loss would be reduced by 28%–35%, depending on the watershed. Thus, implementing pre-fire fuel treatments can have a strong soil loss mitigation effect particularly in extreme years, significantly reducing the probability of exceeding very high average annual soil losses. Considering that a small number of fire seasons account for a very large fraction of total soil loss, our results show that land managers should consider targeted fuel treatments as an important tool to prevent extreme post-fire soil loss.
The most effective soil loss mitigation strategy varied among the two watersheds. Results clearly indicated that there is no single mitigation strategy that fits all watersheds, and the choice is largely influenced by fire regime. For Castelo de Bode, pre-fire fuel treatments were the most effective strategy, and pre-fire treatment leverage was about approximately 2-fold higher than post-fire treatments. Fuel treatments were also the most cost-effective strategy, being approximately 2-fold less expensive than post-fire treatments. For Odelouca, leverage was similar for both strategies, but post-fire treatments were in general more cost-effective than fuel treatments. Differences in treatment effectiveness between watersheds depended on the frequency of large and severe wildfires, which was significantly higher in Castelo de Bode. One important observation was that soil loss mitigation, in general, was more effective for Castelo de Bode than Odelouca, particularly in the case of pre-fire fuel treatments. This was mainly due to the afore-mentioned fire regime and its impact on soil loss. Furthermore, effectiveness depends on the balance between treatment frequency and the frequency of large severe wildfires. In practice, fuel treatment frequency can be adjusted for each watershed depending on fire frequency and treatment objectives, potentially increasing treatment effectiveness, although this topic warrants further investigation.
Decomposing the analysis into an annual scale showed a considerably large variability of the cost-effectiveness ratio for years with low soil loss and burned area. This variability decreased significantly with increasing annual soil loss. This can be partially explained by the fuel treatment location, optimized to reduce multi-year soil loss hotspots, and by the minimum fire size of 500 ha for post-fire treatments. The higher cost-effectiveness ratio for pre-fire treatments for lower annual soil loss can be explained by the lower probability of wildfires overlapping fuel treatments in milder years. Nevertheless, it is interesting to note that pre-fire treatments can be the most cost-effective solution to mitigate soil loss in extreme years, even in cases where it is not the most cost-effective strategy at an average-level. The differences between the analyses performed at average and annual levels are mostly due to the probability of occurrence large and severe wildfires, thus fire regime.
Treatment strategies can be combined in varying configurations and spatial extents to achieve targeted soil loss reduction goals while adhering to budgetary constraints. Our results show that the most cost-effective combinations of treatment strategies vary with the soil loss reduction objective and the frequency of large and severe wildfires in the watershed. For Castelo de Bode, fuel treatments were in general more relevant to achieve watershed-level targets in the most cost-effective way. In contrast, for Odelouca the post-fire treatments were generally more cost-effective. The synergistic effects from combining strategies were much higher for Odelouca than Castelo de Bode, particularly for soil loss reduction targets larger than 10%. In addition to the synergistic effects, implementing fuel treatments had co-benefits that include the decrease in burned area, further contributing to reduce the threat of ecosystem service provision [12]. For example, a 20% of fuel treatment extent can reduce 18% and 12% of burned area in Castelo de Bode and Odelouca, respectively. Land managers can combine different strategies to maximize the attainment of soil loss mitigation goals and different methods/techniques to modulate intervention cost and effectiveness, ensuring the best use of resources. Coupling fire and erosion modelling, along with optimization procedures based on clear management goals can support better planning at the watershed levels following the good examples presented by Buckley et al. [74].

4.3. Limitations

We applied the RUSLE that assumes long-term average conditions, which may not apply to short-term extreme post-fire erosion dynamics [6]. Although there are more sophisticated models that could be applied [75,76,77], the RUSLE has proven to be reasonably accurate and suitable for risk analysis in Mediterranean areas [58,59]. We acknowledge that improvements need to be made to better model burn severity. We used a very simple relation between flame length and burn severity with known limitations [12], that could for example underestimate the effect of extremely intense wildfires on soil burn severity, and thereby, soil loss.
We acknowledge several important limitations in this study related to the assumed effect of fuel treatments on soil loss. If performed under correct technical conditions, the increase in wildfire-induced soil loss can be considered negligible when compared with wildfires [12,15]. More importantly, the approach used here to sample annual burned area for each fire season has important limitations. The samples corresponded to a short period (2000–2022), so that the variability in total simulated annual burned extent was small. Nevertheless, this period included the years with highest annual burned area extent ever recorded in Portugal (2003, 2005 and 2017). Furthermore, it did not include any link with, for example, weather conditions. As a result, the occurrence of an unprecedented fire season cannot be simulated and future work should aim to improve this limitation, for example to include potential climate change impacts.
We attempted to replicate real-world implementation of preventive and post-fire treatments at the watershed level. Nevertheless, uncertainties are large and can potentially affect the main results and key messages for land managers. Operational constraints (e.g., funding, availability of residues for mulching) can significantly alter the frequency and extent of treatments. The uncertainties regarding treatment costs are very large and can hamper the cost-effectiveness analysis. We used fuel treatments costs that are published regularly by a dedicated national commission, but have clear limitations. Treatment cost variability is very high. For example, the cost of fuel treatments in areas with steep slopes (>25%) is on average 657 EUR ha−1, but varies between 378 and 1334 EUR ha−1 [67]. Regarding post-fire interventions, the costs in operational settings are poorly defined for Portugal. We assumed that the treatment costs in forested areas ranged between 1034 and 4888 EUR ha−1, following Girona-García et al. [24]. Overall, these large uncertainties highlight the extreme importance of gathering and recording reliable information about not only the costs of treatments but also their impacts on soil loss, especially in the case of Portugal. One important aspect is that we did not analyze if fuel treatment costs are justified by the benefits of decreasing burn probability and/or lower severity. Further work is needed to provide this important piece of information to land managers [74].

5. Conclusions

Watersheds that are highly exposed to large and severe wildfires have significant risks of increased surface runoff, erosion and soil loss. Pre-fire fuel treatments and post-fire control measures are two complementary strategies that land managers can use to mitigate post-fire soil loss. Here, we showed that both strategies can significantly contribute to the reduction in post-fire soil and that their effect depends on treatment type and extent. Especially relevant was that the probability of exceeding very large annual soil losses, due to extreme fire years, decreased considerably when implementing pre-fire fuel treatments. The results showed that there is no single mitigation strategy that fits all watersheds, and the choice is largely influenced by fire regime. Preventive fuel treatments were more effective in Castelo de Bode, while post-fire treatments were more effective in Odelouca due to differences in fire regime and treatment frequency. Effectiveness had a large interannual variability and results suggested that pre-fire treatments were more cost-effective in years with very high soil loss. Combinations of treatment strategies with variable spatial coverage can be optimized, exploiting synergies to meet specific soil erosion reduction targets within predefined budgetary limitations. Finally, it is important to mention that the relation between fire regime and the effectiveness of different mitigation strategies on soil loss needs further investigation to support generalizations. Further work is necessary to quantify treatment effectiveness in watersheds with different characteristics regarding land cover, slope and fuel type/load, and also in terms of fire regime.

Author Contributions

Conceptualization, A.B. and B.A.; methodology, A.B., Y.B., B.A., S.T. and J.K.; formal analysis, A.B.; writing—original draft preparation, A.B.; writing—review and editing, A.B., Y.B., B.A., S.T., J.K. and A.A. All authors have read and agreed to the published version of the manuscript.

Funding

This research was funded by project FRISCO: Managing Fire-induced Risks of Water Quality Contamination (PCIF/MPG/0044/2018), which was funded by Fundação para a Ciência e a Tecnologia I.P. (FCT). The Forest Research Centre, a research unit, was funded by FCT (UIDB/00239/2020). AB was funded by FCT through a CEEC contract (CEECIND/03799/2018/CP1563/CT0003). BA was supported by the Ph.D. fellowship funded by FCT (UI/BD/150755/2020). S.T. was supported by an Erasmus Mundus Scholarship under the MEDfOR program (EMJMD Grant Number: 619817).

Institutional Review Board Statement

Not applicable.

Informed Consent Statement

Not applicable.

Data Availability Statement

Data are available upon request.

Acknowledgments

We acknowledge Joana Parente for help with RUSLE implementation. We thank Ana Catarina Cunha and Marta Coelho for relevant information regarding the typology and cost of fuel treatment operations.

Conflicts of Interest

The authors declare no conflicts of interest.

Abbreviations

The following abbreviations are used in this manuscript:
AGIFAgency for the Integrated Management of Rural Fires
ICNFForest and Conservation Institute
RUSLERevised Universal Soil Loss Equation
USAUnited States of America
SRTMSpace Shuttle Radar Topography Mission
MTTMinimum Travel Time
JRCJoint Research Center

Appendix A

This appendix presents additional elements associated with Section 2.
Table A1. C-factor values according to each land cover compiled from several works [58,59,60,78].
Land CoverBurn SeverityC-Factor
Agroforestry, agriculture and forestsUnburned0.002
Low0.066
Medium0.135
High0.224
Shrubs and humid areasUnburned0.001
Low0.066
Medium0.135
High0.224
Sparse vegetationUnburned0.286
Low0.314
Medium0.707
High2.653
Pastures and grasslandsUnburned0.103
Low0.232
Medium0.521
High1.953
UrbanUnburned0.000
WaterUnburned0.001
Table A2. P-factor values according to each land-cover class according to Panagos et al. [79,80].
Land CoverP-Factor
Agriculture, agroforestry and pastures0.5
Forest, humid areas and shrubs1
Sparse vegetation0.8
Bare soil and urban areas0
Table A3. Total fuel treatment extent (ha) and average annual fuel treatment extent (in brackets) per pre-fire scenario and study area.
Extent (ha)
% of the Watershed TreatedCastelo de BodeOdelouca
55750 (1150)1900 (380)
1011,500 (2300)3750 (750)
2023,000 (4600)7500 (1500)
3034,400 (6880)11,300 (2260)
4045,850 (9170)15,000 (3000)
Table A4. Fuel assignments for main land-cover classes: prior and posterior to fuel treatments. Fuel models typology defined by Fernandes et al. [52].
Fuel Model
Land CoverPrior to Fuel TreatmentPosterior to Fuel Treatment
Pine forest Litter from medium- to long-needle conifers with a shrub understory (M-PIN, 227) or medium- to long-needle conifer litter (F-PIN)Pine forest litter (F-PIN, 213)
Eucalypt forestEucalypt litter and a shrub understory (M-EUC, 223), or eucalypt litter (F-EUC, 211) Harrowed eucalypt stands with litter (M-EUCd, 224)
Other broadleaf forestEvergreen sclerophyllous hardwood litter and understory shrubs (M-ESC, 222), deciduous litter and a shrub understory (M-CAD, 221)Litter of deciduous or evergreen hardwoods (F-FOL, 212)
Other needleleaf forestLitter from medium- to long-needle conifers with a shrub understory (M-PIN, 227) or medium- to long-needle conifer litter (F-PIN)Medium- to long-needle conifer litter (F-PIN)
ShrublandsShort or tall Mediterranean/Atlantic shrub vegetation (V-MAa, 233; V-MAb, 234; V-MMa, 236); V-MMb, 237); Sparse herbs and shrubs (V-MH, 235)Sparse herbs and shrubs (V-MH, 235)
GrasslandsTall (V-Ha, 231) or short herbs (V-Hb, 232)Sparse herbs and shrubs (V-MH, 235)
AgroforestryEvergreen sclerophyllous hardwood litter and understory shrubs (M-ESC, 222)Sparse herbs and shrubs (V-MH, 235)
Table A5. Fuel treatment costs (EUR ha−1) for three slope classes [67].Average costs are shown, along with minimum and maximum values (inside brackets).
SlopeCost (EUR ha−1)
<5%253 (143–445)
5%–25%455 (260–890)
>25%657 (378–1334)
Table A6. Average annual post-fire treatment extent (ha) per post-fire scenario and study area. The values are associated with the no pre-fire treatment scenario.
Extent (ha)
% of the Burned Area TreatedCastelo de BodeOdelouca
521137
1041468
20815130
301209192
401596252
Figure A1. Fire frequency (1975–2023) for the (a) Castelo de Bode and (b) Odelouca watersheds.
Forests 16 01202 g0a1

Appendix B

This appendix presents additional elements associated with Section 3.
Figure A2. Maps of the average annual soil loss for the no-treatment scenario for (a) Castelo de Bode and (b) Odelouca watersheds, using the 2030 fuel scenario.
Forests 16 01202 g0a2
Figure A3. The impact of pre- and post-fire treatments on soil loss reduction (%) for Castelo de Bode and Odelouca watersheds under the 2030 fuel scenario. The soil loss reduction compared the soil loss attained for a given treatment scenario and the no-treatment scenario.
Forests 16 01202 g0a3
Figure A4. Effectiveness of pre- and post-fire treatments on soil loss mitigation for Castelo de Bode and Odelouca: (a) treatment leverage (t ha−1 yr−1) and (b) treatment cost-effectiveness (€ t−1). Results are shown for the 2030 fuel scenario.
Forests 16 01202 g0a4
Figure A5. The cost-effectiveness ratio (EUR t−1) for each soil loss reduction (%) target considering the most cost-effective combinations of treatment strategies under the 2030 fuel scenario: (a) Castelo de Bode and (b) Odelouca. The different marker shapes represent different pre-fire treatment extents. The different marker colors represent different post-fire treatment extents.
Forests 16 01202 g0a5

References

  1. Almansa, C.; Calatrava, J.; Martínez-Paz, J.M. Extending the Framework of the Economic Evaluation of Erosion Control Actions in Mediterranean Basins. Land Use Policy 2012, 29, 294–308. [Google Scholar] [CrossRef]
  2. Arias-Navarro, C.; Baritz, R.; Jones, A. The State of Soils in Europe; JRC137600; Arias-Navarro, C., Baritz, R., Jones, A., Eds.; Publications Office of the European Union: Luxembourg, 2024. [Google Scholar] [CrossRef]
  3. Panagos, P.; Matthews, F.; Patault, E.; De Michele, C.; Quaranta, E.; Bezak, N.; Kaffas, K.; Patro, E.R.; Auel, C.; Schleiss, A.J.; et al. Understanding the Cost of Soil Erosion: An Assessment of the Sediment Removal Costs from the Reservoirs of the European Union. J. Clean. Prod. 2024, 434, 140183. [Google Scholar] [CrossRef]
  4. Vega, J.A.; Diaz-Ferreiros, F. Wildfire Effects on Soil Erosion. Ecol. Mediterr. 1987, 13, 110–125. [Google Scholar]
  5. Shakesby, R.; Coelho, C.; Ferreira, A.; Terry, J.; Walsh, R. Wildfire Impacts on Soil-Erosion and Hydrology in Wet Mediterranean Forest, Portugal. Int. J. Wildland Fire 1993, 3, 95. [Google Scholar] [CrossRef]
  6. Shakesby, R.; Doerr, S. Wildfire as a Hydrological and Geomorphological Agent. Earth-Sci. Rev. 2006, 74, 269–307. [Google Scholar] [CrossRef]
  7. Shakesby, R.A. Post-Wildfire Soil Erosion in the Mediterranean: Review and Future Research Directions. Earth-Sci. Rev. 2011, 105, 71–100. [Google Scholar] [CrossRef]
  8. Moody, J.A.; Shakesby, R.A.; Robichaud, P.R.; Cannon, S.H.; Martin, D.A. Current Research Issues Related to Post-Wildfire Runoff and Erosion Processes. Earth-Sci. Rev. 2013, 122, 10–37. [Google Scholar] [CrossRef]
  9. Vega, J.A.; Fontúrbel, T.; Merino, A.; Fernández, C.; Ferreiro, A.; Jiménez, E. Testing the Ability of Visual Indicators of Soil Burn Severity to Reflect Changes in Soil Chemical and Microbial Properties in Pine Forests and Shrubland. Plant Soil 2013, 369, 73–91. [Google Scholar] [CrossRef]
  10. Robichaud, P.R.; Ashmun, L.E. Tools to Aid Post-Wildfire Assessment and Erosion-Mitigation Treatment Decisions. Int. J. Wildland Fire 2012, 22, 95–105. [Google Scholar] [CrossRef]
  11. Boer, M.M.; Sadler, R.J.; Wittkuhn, R.S.; McCaw, L.; Grierson, P.F. Long-Term Impacts of Prescribed Burning on Regional Extent and Incidence of Wildfires-Evidence from 50 Years of Active Fire Management in SW Australian Forests. For. Ecol. Manag. 2009, 259, 132–142. [Google Scholar] [CrossRef]
  12. Elliot, W.J.; Miller, M.E.; Enstice, N. Targeting Forest Management through Fire and Erosion Modelling. Int. J. Wildland Fire 2016, 25, 876–887. [Google Scholar] [CrossRef]
  13. Fernandes, P.M.; Davies, G.M.; Ascoli, D.; Fernández, C.; Moreira, F.; Rigolot, E.; Stoof, C.R.; Vega, J.A.; Molina, D. Prescribed Burning in Southern Europe: Developing Fire Management in a Dynamic Landscape. Front. Ecol. Environ. 2013, 11, e4–e14. [Google Scholar] [CrossRef]
  14. Fernández, C.; Vega, J.A.; Fonturbel, T. Shrub Resprouting Response after Fuel Reduction Treatments: Comparison of Prescribed Burning, Clearing and Mastication. J. Environ. Manag. 2013, 117, 235–241. [Google Scholar] [CrossRef] [PubMed]
  15. Fernández, C.; Vega, J.A.; Fonturbel, T. The Effects of Fuel Reduction Treatments on Runoff, Infiltration and Erosion in Two Shrubland Areas in the North of Spain. J. Environ. Manag. 2012, 105, 96–102. [Google Scholar] [CrossRef] [PubMed]
  16. Harrison, N.M.; Stubblefield, A.P.; Varner, J.M.; Knapp, E.E. Finding Balance between Fire Hazard Reduction and Erosion Control in the Lake Tahoe Basin, California-Nevada. For. Ecol. Manag. 2016, 360, 40–51. [Google Scholar] [CrossRef]
  17. Scott, J.; Helmbrecht, D.; Thompson, M.P.; Calkin, D.E.; Marcille, K. Probabilistic Assessment of Wildfire Hazard and Municipal Watershed Exposure. Nat. Hazards 2012, 64, 707–728. [Google Scholar] [CrossRef]
  18. Thompson, M.; Scott, J.; Langowski, P.; Gilbertson-Day, J.; Haas, J.; Bowne, E. Assessing Watershed-Wildfire Risks on National Forest System Lands in the Rocky Mountain Region of the United States. Water 2013, 5, 945–971. [Google Scholar] [CrossRef]
  19. Sidman, G.; Guertin, D.P.; Goodrich, D.C.; Thoma, D.; Falk, D.; Burns, I.S. A Coupled Modelling Approach to Assess the Effect of Fuel Treatments on Post-Wildfire Runoff and Erosion. Int. J. Wildland Fire 2016, 25, 351. [Google Scholar] [CrossRef]
  20. Salis, M.; Del Giudice, L.; Robichaud, P.R.; Ager, A.A.; Canu, A.; Duce, P.; Pellizzaro, G.; Ventura, A.; Alcasena-Urdiroz, F.; Spano, D.; et al. Coupling Wildfire Spread and Erosion Models to Quantify Post-Fire Erosion before and after Fuel Treatments. Int. J. Wildland Fire 2019, 28, 687–703. [Google Scholar] [CrossRef]
  21. Robichaud, P.R.; Beyers, J.L.; Neary, D.G. Evaluating the Effectiveness of Postfire Rehabilitation Treatments; Gen. Tech. Rep. RMRS-GTR-63; U.S. Department of Agriculture, Forest Service, Rocky Mountain Research Station: Fort Collins, CO, USA, 2000. [CrossRef]
  22. Robichaud, P.R.; Ashmun, L.E.; Sims, B.D. Post-Fire Treatment Effectiveness for Hillslope Stabilization; Gen. Tech. Rep. RMRS-GTR-240; Department of Agriculture, Forest Service, Rocky Mountain Research Station: Fort Collins, CO, USA, 2010; p. 62.
  23. Vega, J.A.; Fontúrbel, M.T.; Fernández, C.; Arellano, A.; Díaz-Raviña, M.; Carballas, T.; Martín, A.; González-Prieto, S.; Merino, A.; Benito, E. Acciones Urgentes Contra la Erosión en Áreas Forestales Quemadas: Guía Para su Planificación en Galicia; Universidad de Santiago de Compostela: Santiago de Compostela, Spain, 2013. [Google Scholar]
  24. Girona-García, A.; Vieira, D.C.S.; Silva, J.; Fernández, C.; Robichaud, P.R.; Keizer, J.J. Effectiveness of Post-Fire Soil Erosion Mitigation Treatments: A Systematic Review and Meta-Analysis. Earth-Sci. Rev. 2021, 217, 103611. [Google Scholar] [CrossRef]
  25. Prats, S.A.; Wagenbrenner, J.W.; Martins, M.A.S.; Malvar, M.C.; Keizer, J.J. Mid-Term and Scaling Effects of Forest Residue Mulching on Post-Fire Runoff and Soil Erosion. Sci. Total Environ. 2016, 573, 1242–1254. [Google Scholar] [CrossRef] [PubMed]
  26. Girona-García, A.; Cretella, C.; Fernández, C.; Robichaud, P.R.; Vieira, D.C.S.; Keizer, J.J. How Much Does It Cost to Mitigate Soil Erosion after Wildfires? J. Environ. Manag. 2023, 334, 117478. [Google Scholar] [CrossRef] [PubMed]
  27. European Commission—New EU Forest Strategy for 2030. Available online: https://eur-lex.europa.eu/resource.html?uri=cellar:0d918e07-e610-11eb-a1a5-01aa75ed71a1.0001.02/DOC_1&format=PDF (accessed on 24 April 2025).
  28. Mauri, E.; Paredes, E.H.; Blanco, I.N.; Feced, C.G. Key Recommendations on Wildfire Prevention in the Mediterranean: New Governance for a Comprehensive Approach to Mitigating Wildfire Risks. European Forest Institute. 2023. Available online: https://efi.int/sites/default/files/files/publication-bank/2023/Recommendations%20on%20Wildfire%20Prevention%20in%20Mediterranean%202023.pdf (accessed on 24 April 2025).
  29. AGIF—National Action Plan. Available online: https://www.agif.pt/en/national-action-plan (accessed on 5 May 2024).
  30. Pais, S.; Aquilué, N.; Honrado, J.P.; Fernandes, P.M.; Regos, A. Optimizing Wildfire Prevention through the Integration of Prescribed Burning into ‘Fire-Smart’ Land-Use Policies. Fire 2023, 6, 457. [Google Scholar] [CrossRef]
  31. EPAL—Water Production and Transport in Castelo de Bode Water Dam. Available online: https://www.epal.pt/EPAL/menu/%C3%A1gua/sistema-de-abastecimento/sistema-de-produ%C3%A7%C3%A3o-e-transporte (accessed on 24 April 2025).
  32. ADP—The Odelouca Water Dam. Available online: https://www.aguasdoalgarve.pt/content/barragem-de-odelouca-0 (accessed on 24 April 2025).
  33. DGT—Portuguese Land Cover and Land Use Map for 2018. Available online: https://www.dgterritorio.gov.pt/Carta-de-Uso-e-Ocupacao-do-Solo-para-2018 (accessed on 24 April 2025).
  34. ICNF—Aridity Index for Portugal. Available online: https://sig.icnf.pt/portal/home/item.html?id=0b30c87b509440e88968387a9a494046 (accessed on 24 April 2025).
  35. FAO. IIASA Harmonized World Soil Database Version 2.0; FAO: Rome, Italy; Laxenburg, Austria, 2023. [Google Scholar] [CrossRef]
  36. Pereira, J.M.C.; Silva, P.C.; Melo, I.; Oom, D.; Baldassarre, G.; Pereira, M.G. Cartografia de Regimes de Fogo à Escala Da Freguesia (1980–2017). 2022. Available online: https://www.agif.pt/app/uploads/2022/05/Relat%C3%B3rio-Regimes-do-Fogo-%C3%A0-escala-da-freguesia-1980_2017_FW_vs_final.pdf (accessed on 24 April 2025).
  37. ICNF—The Portuguese Fire Atlas (1975–2023). Available online: https://geocatalogo.icnf.pt/catalogo_tema5.html (accessed on 24 April 2025).
  38. Finney, M.A. Fire Growth Using Minimum Travel Time Methods. Can. J. For. Res. 2002, 32, 1420–1424. [Google Scholar] [CrossRef]
  39. Finney, M.A. An Overview of FlamMap Fire Modeling Capabilities. Fuels Manag. Meas. Success Conf. Proc. 2006, 41, 213–220. [Google Scholar]
  40. Rothermel, R.C. A Mathematical Model for Predicting Fire Spread in Wildland Fuels; Intermountain Forest & Range Experiment Station, Forest Service, US Department of Agriculture: Washington, DC, USA, 1972; p. 115.
  41. Byram, G.M. Combustion of forest fuels. In Forest Fire: Control and Use; Davis, K.P., Ed.; McGraw-Hill: New York, NY, USA, 1959; pp. 61–89. [Google Scholar]
  42. Alcasena, F.J.; Ager, A.A.; Salis, M.; Day, M.A.; Vega-Garcia, C. Optimizing Prescribed Fire Allocation for Managing Fire Risk in Central Catalonia. Sci. Total Environ. 2018, 621, 872–885. [Google Scholar] [CrossRef]
  43. Kalabokidis, K.; Palaiologou, P.; Finney, M. Fire Behavior Simulation in Mediterranean Forests Using the Minimum Travel Time Algorithm. In Proceedings of the Fourth Fire Behavior and Fuels Conference Proceedings—At the Crossroads: Looking Toward the Future in a Changing Environment, St. Petersburg, Russia, 1–4 July 2013; International Association of Wildland Fire: Missoula, MT, USA, 2013; pp. 468–492. [Google Scholar]
  44. Salis, M.; Del Giudice, L.; Jahdi, R.; Alcasena-Urdiroz, F.; Scarpa, C.; Pellizzaro, G.; Bacciu, V.; Schirru, M.; Ventura, A.; Casula, M.; et al. Spatial Patterns and Intensity of Land Abandonment Drive Wildfire Hazard and Likelihood in Mediterranean Agropastoral Areas. Land 2022, 11, 1942. [Google Scholar] [CrossRef]
  45. Carlson, A.R.; Hawbaker, T.J.; Bair, L.S.; Hoffman, C.M.; Meldrum, J.R.; Baggett, L.S.; Steblein, P.F. Evaluating a Simulation-Based Wildfire Burn Probability Map for the Conterminous US. Int. J. Wildland Fire 2024, 34, 1–16. [Google Scholar] [CrossRef]
  46. Muñoz-Sabater, J.; Dutra, E.; Agustí-Panareda, A.; Albergel, C.; Arduini, G.; Balsamo, G.; Boussetta, S.; Choulga, M.; Harrigan, S.; Hersbach, H.; et al. ERA5-Land: A State-of-the-Art Global Reanalysis Dataset for Land Applications. Earth Syst. Sci. Data 2021, 13, 4349–4383. [Google Scholar] [CrossRef]
  47. Aparício, B.A.; Benali, A.; Pereira, J.M.C.; Sá, A.C.L. MTTfireCAL Package for R—An Innovative, Comprehensive, and Fast Procedure to Calibrate the MTT Fire Spread Modelling System. Fire 2023, 6, 219. [Google Scholar] [CrossRef]
  48. ICNF. Sistema de Gestão de Informação de Incêndios Florestais (Versão1.1 2015). Available online: https://fogos.icnf.pt/sgif2010/ (accessed on 24 April 2025).
  49. Lawrence, M.G. The Relationship between Relative Humidity and the Dewpoint Temperature in Moist Air: A Simple Conversion and Applications. Bull. Am. Meteorol. Soc. 2005, 86, 225–233. [Google Scholar] [CrossRef]
  50. Farr, T.G.; Rosen, P.A.; Caro, E.; Crippen, R.; Duren, R.; Hensley, S.; Kobrick, M.; Paller, M.; Rodriguez, E.; Roth, L.; et al. The Shuttle Radar Topography Mission. Rev. Geophys. 2007, 45. [Google Scholar] [CrossRef]
  51. Copernicus Land Monitoring Service—High-resolution layer: Tree cover density. Copernicus Land Monitoring Service. Available online: https://land.copernicus.eu/en/products/high-resolution-layer-tree-cover-density (accessed on 24 April 2025).
  52. Fernandes, P.; Gonçalves, H.; Loureiro, C.; Fernandes, M.; Costa, T.; Cruz, M.G.; Botelho, H. Modelos de combustível florestal para Portugal” in Actas do. 6º Congresso Florestal Nacional; SPCF: Lisboa, Portugal, 2009; pp. 348–354. [Google Scholar]
  53. Sá, A.C.L.; Benali, A.; Aparicio, B.A.; Bruni, C.; Mota, C.; Pereira, J.M.C.; Fernandes, P.M. A Method to Produce a Flexible and Customized Fuel Models Dataset. MethodsX 2023, 10, 102218. [Google Scholar] [CrossRef]
  54. Renard, K.G. Predicting Soil Erosion by Water: A Guide to Conservation Planning with the Revised Universal Soil Loss Equation (RUSLE); US Department of Agriculture, Agricultural Research Service: Washington, DC, USA, 1997.
  55. Panagos, P.; Ballabio, C.; Borrelli, P.; Meusburger, K.; Klik, A.; Rousseva, S.; Tadić, M.P.; Michaelides, S.; Hrabalíková, M.; Olsen, P.; et al. Rainfall Erosivity in Europe. Sci. Total Environ. 2015, 511, 801–814. [Google Scholar] [CrossRef] [PubMed]
  56. Panagos, P.; Meusburger, K.; Ballabio, C.; Borrelli, P.; Alewell, C. Soil Erodibility in Europe: A High-Resolution Dataset Based on LUCAS. Sci. Total Environ. 2014, 479–480, 189–200. [Google Scholar] [CrossRef] [PubMed]
  57. Panagos, P.; Borrelli, P.; Meusburger, K. A New European Slope Length and Steepness Factor (LS-Factor) for Modeling Soil Erosion by Water. Geosciences 2015, 5, 117–126. [Google Scholar] [CrossRef]
  58. Fernández, C.; Vega, J.A.; Vieira, D.C.S. Assessing Soil Erosion after Fire and Rehabilitation Treatments in NW Spain: Performance of Rusle and Revised Morgan-Morgan-Finney Models. L. Degrad. Dev. 2010, 21, 58–67. [Google Scholar] [CrossRef]
  59. Vieira, D.C.S.; Serpa, D.; Nunes, J.P.C.; Prats, S.A.; Neves, R.; Keizer, J.J. Predicting the Effectiveness of Different Mulching Techniques in Reducing Post-Fire Runoff and Erosion at Plot Scale with the RUSLE, MMF and PESERA Models. Environ. Res. 2018, 165, 365–378. [Google Scholar] [CrossRef]
  60. Blake, D.; Nyman, P.; Nice, H.; D’souza, F.M.L.; Kavazos, C.R.J.; Horwitz, P. Assessment of Post-Wildfire Erosion Risk and Effects on Water Quality in South-Western Australia. Int. J. Wildland Fire 2020, 29, 240–257. [Google Scholar] [CrossRef]
  61. Tedim, F.; Leone, V.; Amraoui, M.; Bouillon, C.; Coughlan, M.R.; Delogu, G.M.; Fernandes, P.M.; Ferreira, C.; McCaffrey, S.; McGee, T.K.; et al. Defining Extreme Wildfire Events: Difficulties, Challenges, and Impacts. Fire 2018, 1, 9. [Google Scholar] [CrossRef]
  62. Keizer, J.J.; Silva, F.C.; Vieira, D.C.S.; González-Pelayo, O.; Campos, I.; Vieira, A.M.D.; Valente, S.; Prats, S.A. The Effectiveness of Two Contrasting Mulch Application Rates to Reduce Post-Fire Erosion in a Portuguese Eucalypt Plantation. Catena 2018, 169, 21–30. [Google Scholar] [CrossRef]
  63. González-Pelayo, O.; Prats, S.A.; Vieira, A.M.D.; Vieira, D.C.S.; Maia, P.; Keizer, J.J. Impacts of Barley (Hordeum vulgare L.) Straw Mulch on Post-Fire Soil Erosion and Ground Vegetation Recovery in a Strawberry Tree (Arbutus unedo L.) Stand. Ecol. Eng. 2023, 195, 107074. [Google Scholar] [CrossRef]
  64. Day, M.A.; Ager, A.A.; Houtman, R.M.; Evers, C.R. Prioritizing Restoration and Risk Reduction Landscape Projects with the ForSys Planning System; Gen. Tech. Rep. RMRS-GTR-437; US Department of Agriculture, Forest Service, Rocky Mountain Research Station: Fort Collins, CO, USA, 2023; p. 55.
  65. Ager, A. Improving the Evaluation of Spatial Optimization Models for Prioritizing Landscape Restoration and Wildfire Risk Reduction Investments. J. Environ. Manag. 2024, 360, 121001. [Google Scholar] [CrossRef]
  66. Benali, A.; Sá, A.C.L.L.; Pinho, J.; Fernandes, P.M.; Pereira, J.M.C.C. Understanding the Impact of Different Landscape-Level Fuel Management Strategies on Wildfire Hazard. Forests 2021, 12, 522. [Google Scholar] [CrossRef]
  67. CAOF. Matriz de Beneficiação 2022: Direção-Geral de Agricultura e Desenvolvimento Rural. Available online: https://www.icnf.pt/imprensa/tabelasdereferenciadacaof (accessed on 24 April 2025).
  68. Grossi, P.; Kunreuther, H.; Patel, C.C. (Eds.) A new approach to managing risk. In Catastrophe Modeling; Springer Science & Business Media: Berlin, Germany, 2005; Volume 25. [Google Scholar]
  69. Kastridis, A.; Stathis, D.; Sapountzis, M.; Theodosiou, G. Insect Outbreak and Long-Term Post-Fire Effects on Soil Erosion in Mediterranean Suburban Forest. Land 2022, 11, 911. [Google Scholar] [CrossRef]
  70. Pausas, J.G.; Llovet, J.; Rodrigo, A.; Vallejo, R. Are Wildfires a Disaster in the Mediterranean Basin?—A Review. Int. J. Wildland Fire 2008, 17, 713. [Google Scholar] [CrossRef]
  71. Vieira, D.C.S.; Borrelli, P.; Jahanianfard, D.; Benali, A.; Scarpa, S.; Panagos, P. Wildfires in Europe: Burned Soils Require Attention. Environ. Res. 2023, 217, 114936. [Google Scholar] [CrossRef]
  72. Parente, J.; Girona-García, A.; Lopes, A.R.; Keizer, J.J.; Vieira, D.C.S. Prediction, Validation, and Uncertainties of a Nation-Wide Post-Fire Soil Erosion Risk Assessment in Portugal. Sci. Rep. 2022, 12, 1–13. [Google Scholar] [CrossRef]
  73. Ager, A.A.; Finney, M.A.; Kerns, B.K.; Maffei, H. Modeling Wildfire Risk to Northern Spotted Owl (Strix Occidentalis Caurina) Habitat in Central Oregon, USA. For. Ecol. Manag. 2007, 246, 45–56. [Google Scholar] [CrossRef]
  74. Buckley, M.; Beck, N.; Bowden, P.; Miller, M.E.; Hill, B.; Luce, C.; Elliot, W.J.; Enstice, N.; Podolak, K.; Winford, E.; et al. Report Prepared for the Sierra Nevada Conservancy, The Nature Conservancy, and USDA Forest Service. In Mokelumne Watershed Avoided Cost Analysis: Why Sierra Fuel Treatments Make Economic Sense; Sierra Nevada Conservancy: Auburn, CA, USA, 2014. Available online: https://burneyhatcreek.opennrm.org/assets/84670bf8b31a2179035739f517d1f959/application/pdf/MACA_Full_Report.pdf (accessed on 3 April 2025).
  75. Robichaud, P.R.; Elliot, W.J.; Pierson, F.B.; Hall, D.E.; Moffet, C.A. Predicting Postfire Erosion and Mitigation Effectiveness with a Web-Based Probabilistic Erosion Model. CATENA 2007, 71, 229–241. [Google Scholar] [CrossRef]
  76. Arnold, J.G.; Srinivasan, R.; Muttiah, R.S.; Williams, J.R. Large Area Hydrologic Modeling and Assessment. Part 1: Model Development. JAWRA J. Am. Water Resour. Assoc. 1998, 34, 73–89. [Google Scholar] [CrossRef]
  77. Morgan, R.P. A Simple Approach to Soil Loss Prediction: A Revised Morgan–Morgan–Finney Model. CATENA 2001, 44, 305–322. [Google Scholar] [CrossRef]
  78. Panagos, P.; Borrelli, P.; Meusburger, K.; Alewell, C.; Lugato, E.; Montanarella, L. Estimating the Soil Erosion Cover-Management Factor at the European Scale. Land Use Policy 2015, 48, 38–50. [Google Scholar] [CrossRef]
  79. Panagos, P.; Borrelli, P.; Meusburger, K.; van der Zanden, E.H.; Poesen, J.; Alewell, C. Modelling the Effect of Support Practices (P-Factor) on the Reduction of Soil Erosion by Water at European Scale. Environ. Sci. Policy 2015, 51, 23–34. [Google Scholar] [CrossRef]
  80. Panagos, P.; Ballabio, C.; Poesen, J.; Lugato, E.; Scarpa, S.; Montanarella, L.; Borrelli, P. A Soil Erosion Indicator for Supporting Agricultural, Environmental and Climate Policies in the European Union. Remote Sens. 2020, 12, 1365. [Google Scholar] [CrossRef]
Figure 1. Location (left) and land cover (right; [33]) of the two study catchments: Castelo de Bode (in blue) and Odelouca (in orange).
Forests 16 01202 g001
Figure 2. Maps of the average annual soil loss for the no-treatment scenario for (a) Castelo de Bode and (b) Odelouca watersheds.
Forests 16 01202 g002
Figure 3. The impact of pre- and post-fire treatments on soil loss reduction (%) for Castelo de Bode and Odelouca watersheds under the 2023 fuel scenario. The soil loss reduction compared the soil loss attained for a given treatment scenario and the no-treatment scenario.
Forests 16 01202 g003
Figure 4. Exceedance probability curves considering the no-treatment scenario and three pre- and post-fire treatment scenarios for Castelo de Bode and Odelouca watersheds. The bottom x-axis represents the average annual soil loss (t ha−1 yr−1) and the top x-axis represents the annual watershed soil loss (kt yr−1). Note that the “average” refers to the spatial average considering the entire watershed.
Forests 16 01202 g004
Figure 5. Effectiveness of pre- and post-fire treatments on soil loss mitigation for Castelo de Bode and Odelouca: (a) treatment leverage (t ha−1 yr−1) and (b) treatment cost-effectiveness ratio (EUR t−1).
Forests 16 01202 g005
Figure 6. Distribution of the annual cost-effectiveness ratio (EUR t−1) against the annual soil loss (t ha−1) for 20% pre- and 20% post-fire treatment extents: (a) Castelo de Bode; (b) Odelouca. Each point represents a simulated year (or fire season).
Forests 16 01202 g006
Figure 7. The cost-effectiveness ratio (EUR t−1) for each soil loss reduction (%) target considering the most cost-effective combinations of treatment strategies: (a) Castelo de Bode and (b) Odelouca. The different marker shapes represent different pre-fire treatment extents. The different marker colors represent different post-fire treatment extents.
Forests 16 01202 g007
Figure 8. Exceedance probability curves considering the no-treatment scenario and the most cost-effective combinations of treatment strategies targeting 10%, 20%, 30% and 40% soil loss reductions for (a) Castelo de Bode and (b) Odelouca watersheds. Results are shown for the 2023 fuel scenario. Note that the “average” refers to the spatial average considering the entire watershed.
Forests 16 01202 g008
Table 1. Burn severity classes according to fireline intensity (kW m−1) and flame length (m) (compiled from works of [12,61]).
Fireline Intensity (kW m−1)Flame Length (m)Burn Severity
<500<1.5Low
500–20001.5–2.5Moderate
>2000>2.5High
Table 2. Assumed soil loss effectiveness (%) and associated costs (EUR ha−1) of the post-fire soil loss mitigation treatments. The minimum and maximum costs are displayed in brackets. Treatment costs were extracted from Girona-García et al. [26].
Non-ForestForest
SlopeEffectiveness (%)Cost (EUR ha−1)Effectiveness (%)Cost (EUR ha−1)
5%–25%632350672491 (846–4136)
>25%862726712961 (1034–4888)
Disclaimer/Publisher’s Note: The statements, opinions and data contained in all publications are solely those of the individual author(s) and contributor(s) and not of MDPI and/or the editor(s). MDPI and/or the editor(s) disclaim responsibility for any injury to people or property resulting from any ideas, methods, instructions or products referred to in the content.

